Embed Size (px)
Citation preview
Application of artificialneural network for fuzzylogic based leanness
assessmentK.E.K. Vimal and Sekar Vinodh
Department of Production Engineering, National Institute of Technology,Tiruchirappalli, India
Abstract
Purpose – The purpose of this paper is to report a case study in which artificial neural network(ANN) has been used for performing fuzzy logic based leanness assessment.
Design/methodology/approach – Leanness is the measure of lean manufacturing practice.Fuzzy logic has been used for the calculation of leanness. To improve the effectiveness of computation,ANN tool has been used in this study. The network has been modeled, trained and simulated using theMATLAB software.
Findings – The disadvantages associated with the scoring method has been overcome by thedeployment of fuzzy logic. The problem associated with manual computation has been overcome bythe application of ANN. The simulated model has been validated by measuring the leanness level ofthe case organization.
Research limitations/implications – The case study has been carried out in a single electronicswitches manufacturing organization. In the fuzzy logic approach, triangular fuzzy numbers are beingused in the present study.
Practical implications – The paper reports a case study conducted in an Indian transformersmanufacturing organisation. Hence, the results derived from the study are validated in a real timemanufacturing environment.
Originality/value – The idea of applying ANN for fuzzy logic based leanness assessment is theoriginal contribution of the authors.
Keywords Lean manufacturing, Leanness, Fuzzy logic, Neural network, India,Manufacturing industries
Paper type Case study
NomenclatureLci ¼ lean capability of ith
enablerWij ¼ importance weight
of jth criterion in ithenabler
Rij ¼ performance ratingof jth criterion in ithenabler
FLI ¼ fuzzy leanness indexD (FLI, LLi) ¼ Euclidean distance between
FLI and LLi
LLi ¼ corresponding FUZZYnumber for natural-languageexpression
fFLI (x) ¼ triangular fuzzy number ofFLI
fLLi(x) ¼ triangular fuzzy number of
LLi
X ¼ lower, middle and uppertriangular number
FPII ¼ fuzzy performanceimportance index
The current issue and full text archive of this journal is available at
www.emeraldinsight.com/1741-038X.htm
JMTM24,2
274
Received 13 September 2011Revised 24 November 20111 February 20124 March 2012Accepted 11 March 2012
Journal of Manufacturing TechnologyManagementVol. 24 No. 2, 2013pp. 274-292q Emerald Group Publishing Limited1741-038XDOI 10.1108/17410381311292340
1. IntroductionLean manufacturing has been adopted as a potential solution for many organizationsparticularly automotive manufacturing industries in Japan (Herron and Hicks, 2008).Lean manufacturing is mainly focused on the elimination of wastes thereby streamliningthe processes (Seth et al., 2008). Most of the concepts in the lean manufacturing areadopted from just in time (JIT), cellular manufacturing and world-class manufacturing(Abdulmalek and Rajgopal, 2007). Lean manufacturing is a methodology whichintegrates the tools like Kanban, Kaizan, Poke-yoke, value stream mapping (VSM), etc.(Vinodh and Chintha, 2009b; Anand and Kodali, 2011; Serrano et al., 2008). Because of thesuperior performance of the lean manufacturing in the automobile industries in Japan, ithas been transferred to non-Japanese and non-automotive situations (Herron and Hicks,2008). Lean practices implementation has the advantages like reduced inventory andlead-times, improved delivery performance, better space and resource utilization,enhanced productivity and quality (Singh et al., 2006). Leanness is the measure of leanmanufacturing practices. Leanness measurement is a multi-criteria decision-makingproblem which necessitates the usage of fuzzy logic (Noor-E-Alam et al., 2008). Themeasurement of leanness gains importance in the recent days. The leannessmeasurement gains importance as it indicates the leanness performance of theorganization (Vinodh and Chintha, 2009a). There are many methods to assess theleanness of the organization. In the present study, artificial neural network (ANN) hasbeen used for fuzzy logic leanness assessment. The presence of vagueness, imprecisenessand uncertainty in scoring method necessitates fuzzy logic based measurement(Vinodh et al., 2010b; Baguley et al., 2006; Ullah, 2005). In this study, the performanceindex and weights for different criteria are obtained from the decision makers to performfuzzy logic based leanness measurement. The decision makers use linguistic variables toassess the lean capabilities (Shamsuzzaman et al., 2003; Wang and Chuu, 2004). Then it ismatched with the fuzzy numbers (Ullah and Harib, 2008) and computation is beingperformed. Then network is formulated based on the historical data and neural networkis used to learn the relation among criteria, enabler and their corresponding performancescore. After calculating the leanness level of the organization using Euclidean distancemethod, fuzzy numbers will be converted into crisp values which are matched with thenatural language set. Then fuzzy performance importance index (FPII) will be calculatedto identify the potential areas of improvement. Suitable proposals have been derived toimprove the identified potential areas. After implementing the identified proposals, leanperformance measures such as idle time, total cycle time, work-in-progress inventory,and defects are measured before and after implementing the leanness assessmenttechnique to evaluate the improvements (Vinodh et al., 2010a).
2. Literature reviewThe literature has been reviewed from the perspectives of lean manufacturing and itsassessment, ANN and fuzzy logic applications.
2.1 Literature review an lean manufacturing and assessmentVinodh and Chintha (2009b) designed a leanness measurement model incorporatedwith multi-grade fuzzy approach. By substituting the data gathered from anorganization, leanness index and also areas for leanness improvement have beenidentified for future deployment. Shah and Ward (2003) presented the effects of three
Leannessassessment
275
contextual factors, plant size, plant age and unionization status, on the likelihood ofimplementing 22 manufacturing practices that are key facets of lean productionsystems. Further, they postulated four “bundles” of inter-related and internalconsistent practices; these are JIT, total quality management (TQM), total preventivemaintenance (TPM), and human resource management (HRM). Finally they validatedthe bundles and measured the operational performance. Sullivan et al. (2002) presentedan equipment replacement decision problem within the context of lean manufacturingimplementation. In particular, they demonstrated that VSM suite of tools can be usedto map the current state of a production line and designed a desired future state andillustrated how VSM can provide necessary information for analysis of equipmentreplacement decision problems encountered in lean manufacturing implementation.Bayou and De Korvin (2008) have presented the seven characteristics of systematicmeasures of leanness like relative, dynamic, long-term fuzzy logical, objective,integrative and comprehensive. By using fuzzy logic they compared the productionleanness of the Ford Motor Company and General Motors using fuzzy logic and provedthat the Ford Motor system is 17 percent leaner than the General Motors systemthrough the benchmarked system. Vinodh et al. (2010a) have constructed the currentstate map after observing the present state in the organization and proposed futurestate map. After implementing the proposals, they measured the lean performancemeasures to quantify the improvements.
2.2 Literature review on NN applicationsNN is a versatile tool for forecasting nonlinear models, but the search for an idealnetwork structure is a complex task. An evolutionary computation approach has beenproposed in searching the ideal network structure. The optimized neural networkstructure for forecasting the apparel sales developed using the sales data has beencollected for two years. Finally they compared the performance of the basic fullyconnected neural network models with the traditional forecasting models (Au et al.,2008). Chambers and Campbell (2002) proposed an approach using ANN model forcomponents of the entire system. The entire system is then modeled by interconnectingthe ANN meta models. Then they trained ANN via simulation to act as a single genericqueuing node. Golmohammadi (2011) has presented a NN based fuzzy multi-criteriadecision-making model using feed forward network. Multi-criteria decision-makingproblems have been formulated and by training the neural network model, relationbetween input and output has been developed by generating weights. Finallyalternatives have been ranked based on the score provided by decision makers.Ciurana et al. (2008) have presented a machine tool selection method for themanufacturing company. Selecting the wrong tool will affect both the process as wellas the growth of the company. For this purpose, NN has been used to identify thesuitable tool for the organization. Gutierrez et al. (2008) have developed a model toforecast the lumpy demand using neural network. They compared the result obtainedfrom NN with the traditional time series method. They have concluded that NNperform better than the traditional method. Cavalieri et al. (2003) compared the resultderived using two methods namely parametric and ANN for the estimation ofproduction cost for a new type of unitary brake disk in an Italian based automobilemanufacturing firm. The result confirms that ANN seems to have a better tradeoffbetween precision and cost of the development for the methodology.
JMTM24,2
276
2.3 Literature review on fuzzy logic applicationsAmid et al. (2011) have developed a weighted max-min fuzzy model to effectivelyhandle the vagueness of input data and different weights of the criteria in supplierselection problem. The achievement level using the model matches with the objectivefunction. Bottani (2009) exploits how fuzzy logic can be used to translate linguisticsjudgments required for relationships and correlations matrices into numerical valueson the house of quality in QFD methodology to enhance agility of the organization.Al-Najjar and Alsyouf (2002) proposed a methodology using a fuzzy multiple criteriadecision making (MCDM) evaluation to select the advanced and the most informative(efficient) maintenance approach. With two examples, they showed that by using thismethod, the planned replacement and failures would be reduced to approximately zeroand higher utilization of component life can be achieved. Fuzzy decision algorithm isused to select the most suitable advanced manufacturing system (AMS) alternativefrom a set of mutually exclusive alternatives. Both economic evaluation and strategiccriteria such as flexibility, quality improvement, which are not quantitative in nature,are considered for selection. The economic aspects of the AMS selection process areaddressed using the fuzzy discounted cash flow analysis. Triangular fuzzy numbersare used throughout the analysis to quantify the vagueness inherent in the financialestimates such as periodic cash flows, interest rate and inflation rates, experts’linguistic assessments for strategic justification criteria, and importance weight of eachcriterion (Karsak and Tolga, 2001). Lin et al. (2006) have addressed the ambiguity inagility evaluation using fuzzy logic. The evaluation procedure includes identifyingagility capabilities, selecting linguistic variables for assessing and interpreting thevalues of the linguistic variables, fuzzy rating and fuzzy weights integration, fuzzyindex labeling, and defuzzifying FPII in order to identify the main adverse factorswhich can influence agility achievement.
3. Assessment methodologyThe assessment starts with the identification of the suitable organization whichnecessitates the leanness measurement. Then the conceptual model is developed for theleanness assessment using fuzzy logic and is shown in Figure 1. The model consists offive enablers and 30 criteria which covers the various lean perspectives of theorganization, into and is shown in Table I (Vinodh and Chintha, 2009b). A set of fuzzynumbers for approximating linguistic variable values was developed as listed inTable II. Five experts participated in a discussion session for leanness assessment.Experts are the heads of various departments namely design, production, customerservice, quality control and new product development and they possess rich experienceregarding the design and operation of modular switches. They used linguisticterms above to directly measure the importance weight of the lean capabilities for isshown in Table III. Then the linguistic terms are converted into fuzzy numbersis shown in Table IV. As a sample, the data pertaining to two enablers are shown inTables III and IV. By substituting the performance index and weights of the criteriausing equation (1), the performance rating for the enabler has been calculated(Lin et al., 2006):
Lci ¼
Pnj¼1ðWij £ RijÞPn
j¼1Wij
ð1Þ
Leannessassessment
277
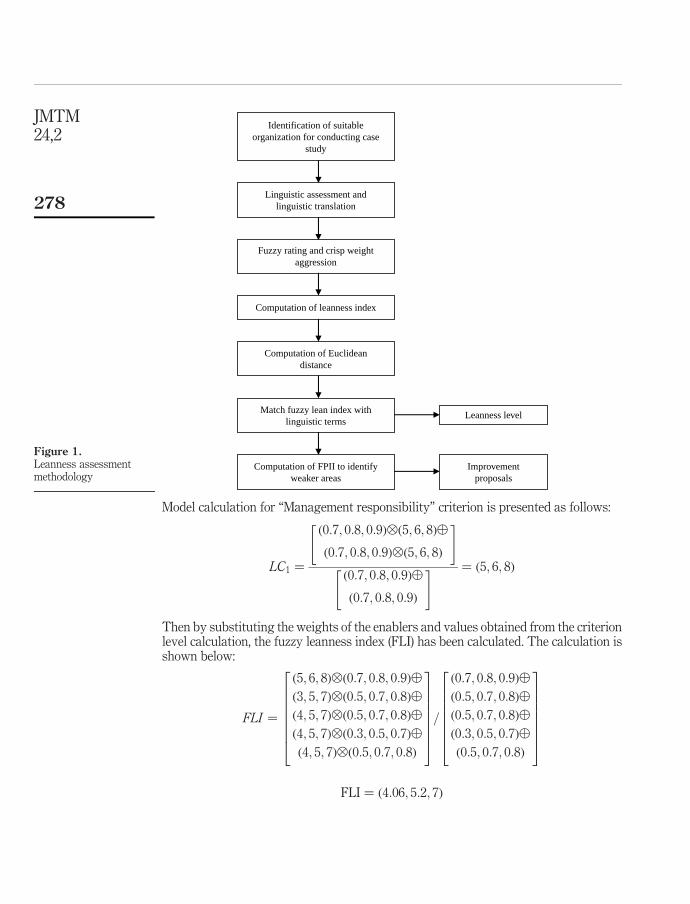
Model calculation for “Management responsibility” criterion is presented as follows:
LC1 ¼
ð0:7; 0:8; 0:9Þ^ð5; 6; 8Þ%
ð0:7; 0:8; 0:9Þ^ð5; 6; 8Þ
" #
ð0:7; 0:8; 0:9Þ%
ð0:7; 0:8; 0:9Þ
" # ¼ ð5; 6; 8Þ
Then by substituting the weights of the enablers and values obtained from the criterionlevel calculation, the fuzzy leanness index (FLI) has been calculated. The calculation isshown below:
FLI ¼
ð5; 6; 8Þ^ð0:7; 0:8; 0:9Þ%
ð3; 5; 7Þ^ð0:5; 0:7; 0:8Þ%
ð4; 5; 7Þ^ð0:5; 0:7; 0:8Þ%
ð4; 5; 7Þ^ð0:3; 0:5; 0:7Þ%
ð4; 5; 7Þ^ð0:5; 0:7; 0:8Þ
26666664
37777775=
ð0:7; 0:8; 0:9Þ%
ð0:5; 0:7; 0:8Þ%
ð0:5; 0:7; 0:8Þ%
ð0:3; 0:5; 0:7Þ%
ð0:5; 0:7; 0:8Þ
26666664
37777775
FLI ¼ ð4:06; 5:2; 7Þ
Figure 1.Leanness assessmentmethodology
Identification of suitableorganization for conducting case
study
Linguistic assessment andlinguistic translation
Improvementproposals
Fuzzy rating and crisp weightaggression
Computation of Euclideandistance
Leanness levelMatch fuzzy lean index withlinguistic terms
Computation of FPII to identifyweaker areas
Computation of leanness index
JMTM24,2
278
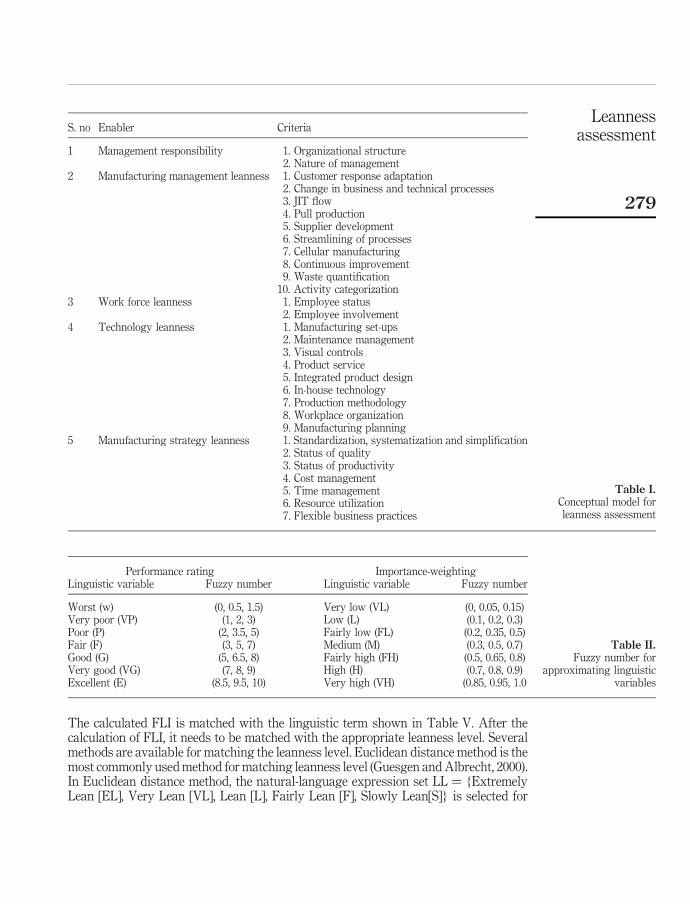
The calculated FLI is matched with the linguistic term shown in Table V. After thecalculation of FLI, it needs to be matched with the appropriate leanness level. Severalmethods are available for matching the leanness level. Euclidean distance method is themost commonly used method for matching leanness level (Guesgen and Albrecht, 2000).In Euclidean distance method, the natural-language expression set LL ¼ {ExtremelyLean [EL], Very Lean [VL], Lean [L], Fairly Lean [F], Slowly Lean[S]} is selected for
S. no Enabler Criteria
1 Management responsibility 1. Organizational structure2. Nature of management
2 Manufacturing management leanness 1. Customer response adaptation2. Change in business and technical processes3. JIT flow4. Pull production5. Supplier development6. Streamlining of processes7. Cellular manufacturing8. Continuous improvement9. Waste quantification
10. Activity categorization3 Work force leanness 1. Employee status
2. Employee involvement4 Technology leanness 1. Manufacturing set-ups
2. Maintenance management3. Visual controls4. Product service5. Integrated product design6. In-house technology7. Production methodology8. Workplace organization9. Manufacturing planning
5 Manufacturing strategy leanness 1. Standardization, systematization and simplification2. Status of quality3. Status of productivity4. Cost management5. Time management6. Resource utilization7. Flexible business practices
Table I.Conceptual model forleanness assessment
Performance rating Importance-weightingLinguistic variable Fuzzy number Linguistic variable Fuzzy number
Worst (w) (0, 0.5, 1.5) Very low (VL) (0, 0.05, 0.15)Very poor (VP) (1, 2, 3) Low (L) (0.1, 0.2, 0.3)Poor (P) (2, 3.5, 5) Fairly low (FL) (0.2, 0.35, 0.5)Fair (F) (3, 5, 7) Medium (M) (0.3, 0.5, 0.7)Good (G) (5, 6.5, 8) Fairly high (FH) (0.5, 0.65, 0.8)Very good (VG) (7, 8, 9) High (H) (0.7, 0.8, 0.9)Excellent (E) (8.5, 9.5, 10) Very high (VH) (0.85, 0.95, 1.0
Table II.Fuzzy number for
approximating linguisticvariables
Leannessassessment
279
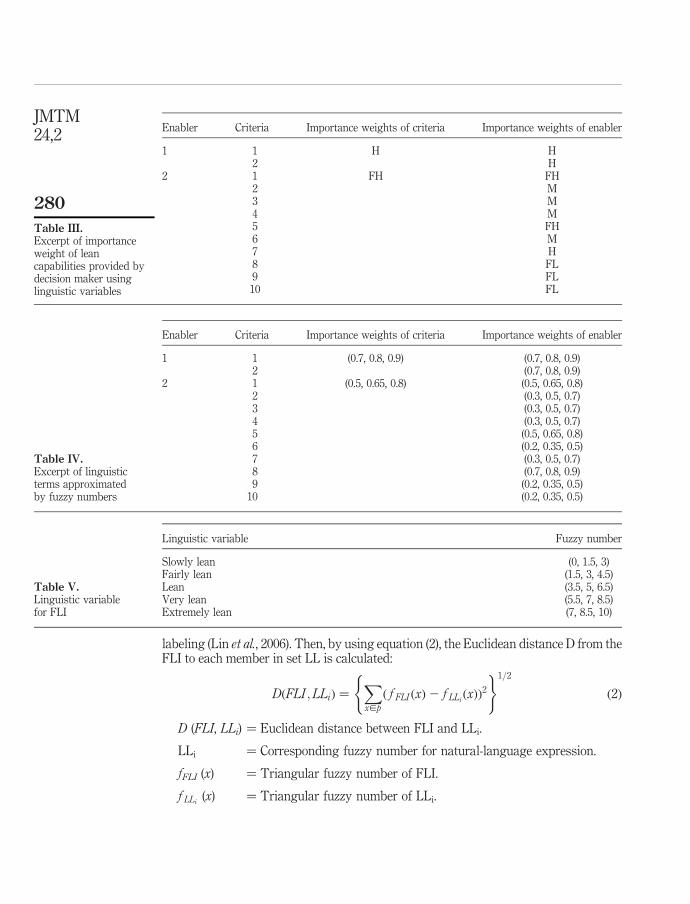
labeling (Lin et al., 2006). Then, by using equation (2), the Euclidean distance D from theFLI to each member in set LL is calculated:
DðFLI ;LLiÞ ¼x[p
Xð f FLI ðxÞ2 f LLi
ðxÞÞ2
( )1=2
ð2Þ
D (FLI, LLi) ¼ Euclidean distance between FLI and LLi.
LLi ¼ Corresponding fuzzy number for natural-language expression.
fFLI (x) ¼ Triangular fuzzy number of FLI.
f LLi(x) ¼ Triangular fuzzy number of LLi.
Enabler Criteria Importance weights of criteria Importance weights of enabler
1 1 H H2 H
2 1 FH FH2 M3 M4 M5 FH6 M7 H8 FL9 FL10 FL
Table III.Excerpt of importanceweight of leancapabilities provided bydecision maker usinglinguistic variables
Enabler Criteria Importance weights of criteria Importance weights of enabler
1 1 (0.7, 0.8, 0.9) (0.7, 0.8, 0.9)2 (0.7, 0.8, 0.9)
2 1 (0.5, 0.65, 0.8) (0.5, 0.65, 0.8)2 (0.3, 0.5, 0.7)3 (0.3, 0.5, 0.7)4 (0.3, 0.5, 0.7)5 (0.5, 0.65, 0.8)6 (0.2, 0.35, 0.5)7 (0.3, 0.5, 0.7)8 (0.7, 0.8, 0.9)9 (0.2, 0.35, 0.5)
10 (0.2, 0.35, 0.5)
Table IV.Excerpt of linguisticterms approximatedby fuzzy numbers
Linguistic variable Fuzzy number
Slowly lean (0, 1.5, 3)Fairly lean (1.5, 3, 4.5)Lean (3.5, 5, 6.5)Very lean (5.5, 7, 8.5)Extremely lean (7, 8.5, 10)
Table V.Linguistic variablefor FLI
JMTM24,2
280
where:
x ¼ Lower, middle and upper triangular number.
Then the leanness level of the organization has been found. Then areas to be improvedhave been identified based on FPII calculation. Using equation (3), FPII is calculated forall the criteria:
FPII ij ¼ W0ij^Rij ð3Þ
Where W0ij ¼ [(1, 1, 1) 2 Wij], Wij is the fuzzy importance weight of the leanness
element capability ij (Lin et al., 2006).After implementing the improvement proposals, there exists a need for again
assessing the leanness level of the organization. The above explained procedure showsthe tediousness involved in computation. Also, this procedure has to be done repeatedly.So there exists a need for infusing artificial intelligence to assess the leanness level. Theliterature review on neural network explains the ANN potential in several applications.But in the MCDM problem its potential has not been realized. To fill this research gap,a conceptual model has been developed to assess the leanness level of the organizationusing ANN and validated by assessing the leanness level of the organization.
4. Case study4.1 About the case companyThe case study has been conducted in transformers manufacturing organizationlocated in Tamil Nadu, India. This organization manufactures transformers, relays andmodular switches. The organization has implemented lean manufacturing strategieslike 5S (Seiri, Seiton, Seiso, Seiketsu and Shitsuke), Kaizen, and TPM. There existed aneed for the organization to continuously assess the leanness level to monitorthe effectiveness of implementing the various tools. The decision makers of theorganization felt that the integration of artificial intelligence methods namely ANN andfuzzy logic could be deployed for leanness assessment.
4.2 Development of conceptual model for neural leanness assessmentIn this assessment, the model used to assess the leanness of the organization using fuzzylogic is shown in Table I. The assessment starts with formulating the input and targetvalues based on the past data. Then network is developed in the MATLAB NNTOOLmodule. Appropriate functions and number of layers have been selected for the problem.After training the model with the data, correct combination of weights has been derived.Then the model has been validated by simulating the network model for the current data.
4.3 Neural network structureUsually, the leanness index has been calculated manually using fuzzy logic. But in thisstudy, the ability of ANN to capture and retain underlying complex, non-linearpatterns has been used to assess the leanness index. But in the case of ANN, a set ofhistorical data combined with some logic and a properly designed neural networkmodel can lead to the correct decision. In this study, NN tool box in MATLAB has beenused to train the network.
Several design factors including selection of input variables, architecture of thenetwork and quantity of training data significantly impact the accuracy of neural
Leannessassessment
281
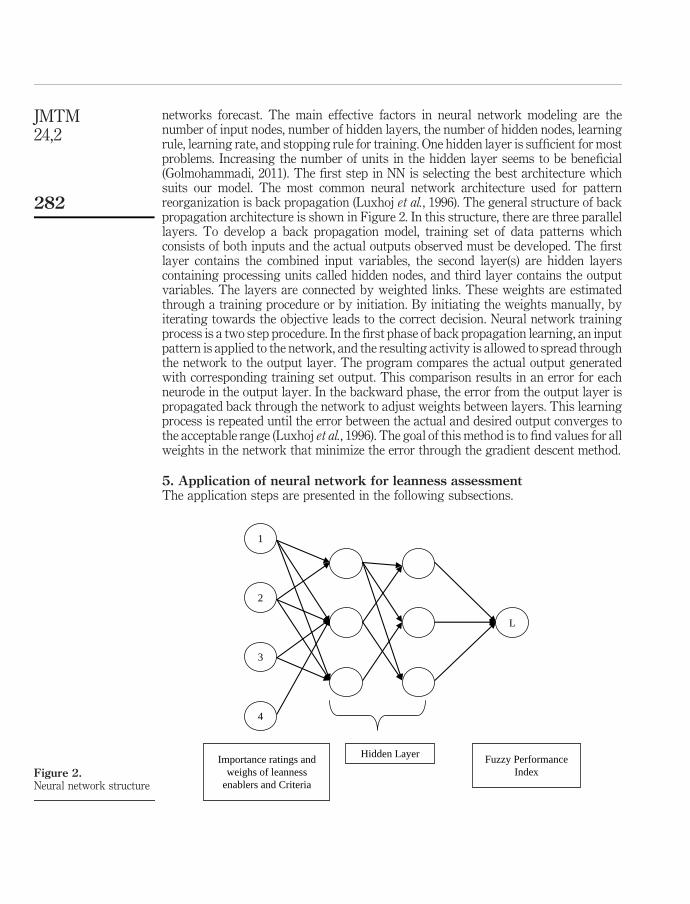
networks forecast. The main effective factors in neural network modeling are thenumber of input nodes, number of hidden layers, the number of hidden nodes, learningrule, learning rate, and stopping rule for training. One hidden layer is sufficient for mostproblems. Increasing the number of units in the hidden layer seems to be beneficial(Golmohammadi, 2011). The first step in NN is selecting the best architecture whichsuits our model. The most common neural network architecture used for patternreorganization is back propagation (Luxhoj et al., 1996). The general structure of backpropagation architecture is shown in Figure 2. In this structure, there are three parallellayers. To develop a back propagation model, training set of data patterns whichconsists of both inputs and the actual outputs observed must be developed. The firstlayer contains the combined input variables, the second layer(s) are hidden layerscontaining processing units called hidden nodes, and third layer contains the outputvariables. The layers are connected by weighted links. These weights are estimatedthrough a training procedure or by initiation. By initiating the weights manually, byiterating towards the objective leads to the correct decision. Neural network trainingprocess is a two step procedure. In the first phase of back propagation learning, an inputpattern is applied to the network, and the resulting activity is allowed to spread throughthe network to the output layer. The program compares the actual output generatedwith corresponding training set output. This comparison results in an error for eachneurode in the output layer. In the backward phase, the error from the output layer ispropagated back through the network to adjust weights between layers. This learningprocess is repeated until the error between the actual and desired output converges tothe acceptable range (Luxhoj et al., 1996). The goal of this method is to find values for allweights in the network that minimize the error through the gradient descent method.
5. Application of neural network for leanness assessmentThe application steps are presented in the following subsections.
Figure 2.Neural network structure
Hidden Layer Fuzzy PerformanceIndex
1
2
3
L
4
Importance ratings andweighs of leanness
enablers and Criteria
JMTM24,2
282
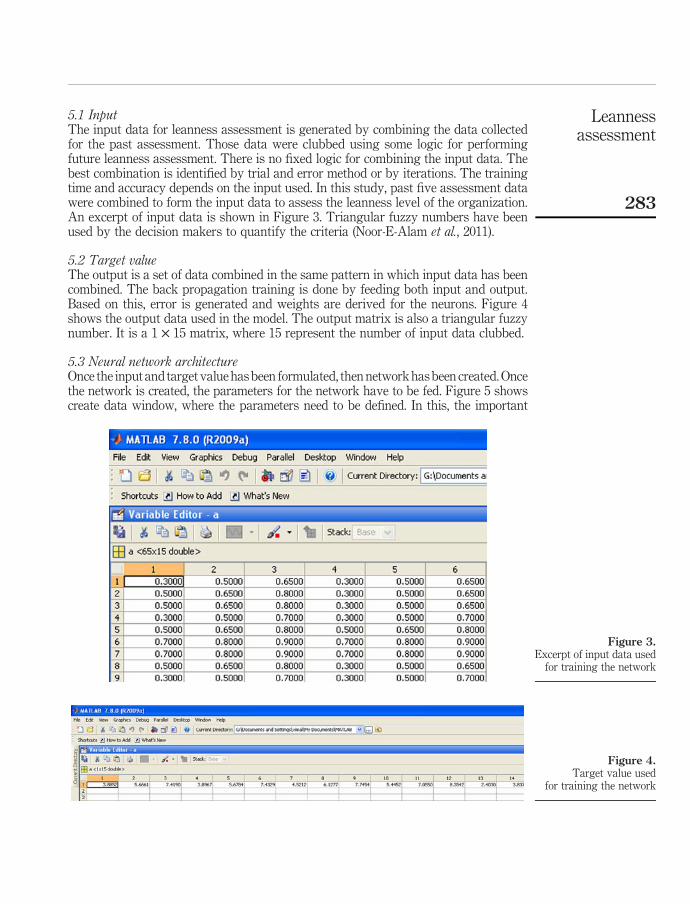
5.1 InputThe input data for leanness assessment is generated by combining the data collectedfor the past assessment. Those data were clubbed using some logic for performingfuture leanness assessment. There is no fixed logic for combining the input data. Thebest combination is identified by trial and error method or by iterations. The trainingtime and accuracy depends on the input used. In this study, past five assessment datawere combined to form the input data to assess the leanness level of the organization.An excerpt of input data is shown in Figure 3. Triangular fuzzy numbers have beenused by the decision makers to quantify the criteria (Noor-E-Alam et al., 2011).
5.2 Target valueThe output is a set of data combined in the same pattern in which input data has beencombined. The back propagation training is done by feeding both input and output.Based on this, error is generated and weights are derived for the neurons. Figure 4shows the output data used in the model. The output matrix is also a triangular fuzzynumber. It is a 1 £ 15 matrix, where 15 represent the number of input data clubbed.
5.3 Neural network architectureOnce the input and target value has been formulated, then network has been created. Oncethe network is created, the parameters for the network have to be fed. Figure 5 showscreate data window, where the parameters need to be defined. In this, the important
Figure 3.Excerpt of input data used
for training the network
Figure 4.Target value used
for training the network
Leannessassessment
283
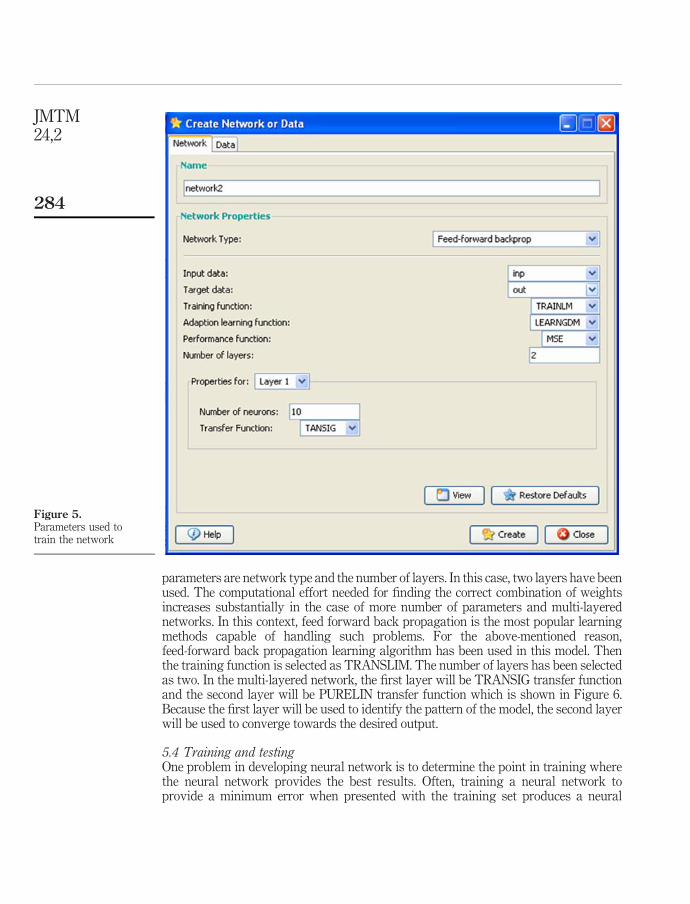
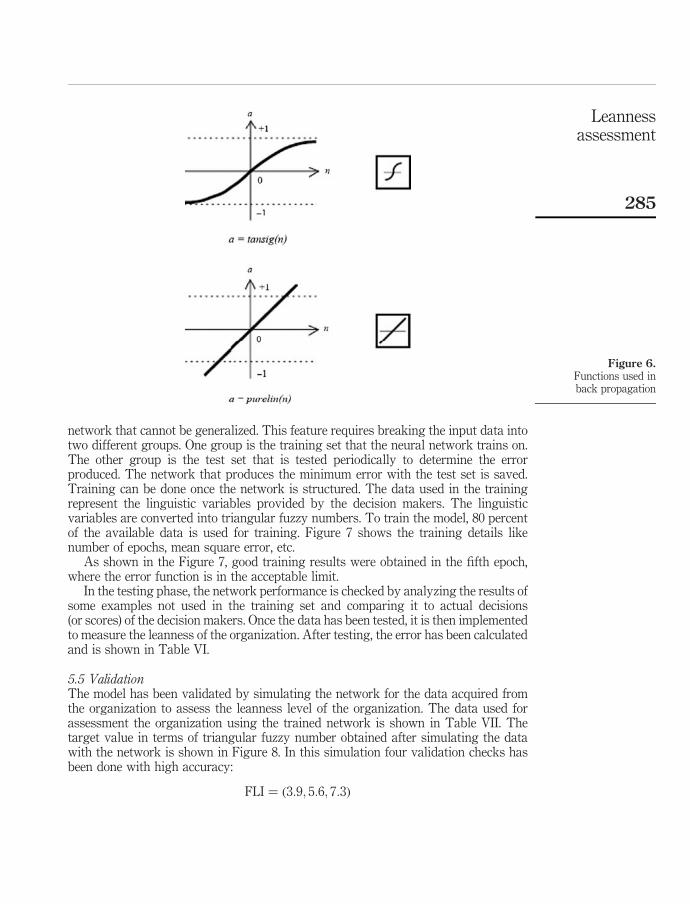
parameters are network type and the number of layers. In this case, two layers have beenused. The computational effort needed for finding the correct combination of weightsincreases substantially in the case of more number of parameters and multi-layerednetworks. In this context, feed forward back propagation is the most popular learningmethods capable of handling such problems. For the above-mentioned reason,feed-forward back propagation learning algorithm has been used in this model. Thenthe training function is selected as TRANSLIM. The number of layers has been selectedas two. In the multi-layered network, the first layer will be TRANSIG transfer functionand the second layer will be PURELIN transfer function which is shown in Figure 6.Because the first layer will be used to identify the pattern of the model, the second layerwill be used to converge towards the desired output.
5.4 Training and testingOne problem in developing neural network is to determine the point in training wherethe neural network provides the best results. Often, training a neural network toprovide a minimum error when presented with the training set produces a neural
Figure 5.Parameters used totrain the network
JMTM24,2
284
network that cannot be generalized. This feature requires breaking the input data intotwo different groups. One group is the training set that the neural network trains on.The other group is the test set that is tested periodically to determine the errorproduced. The network that produces the minimum error with the test set is saved.Training can be done once the network is structured. The data used in the trainingrepresent the linguistic variables provided by the decision makers. The linguisticvariables are converted into triangular fuzzy numbers. To train the model, 80 percentof the available data is used for training. Figure 7 shows the training details likenumber of epochs, mean square error, etc.
As shown in the Figure 7, good training results were obtained in the fifth epoch,where the error function is in the acceptable limit.
In the testing phase, the network performance is checked by analyzing the results ofsome examples not used in the training set and comparing it to actual decisions(or scores) of the decision makers. Once the data has been tested, it is then implementedto measure the leanness of the organization. After testing, the error has been calculatedand is shown in Table VI.
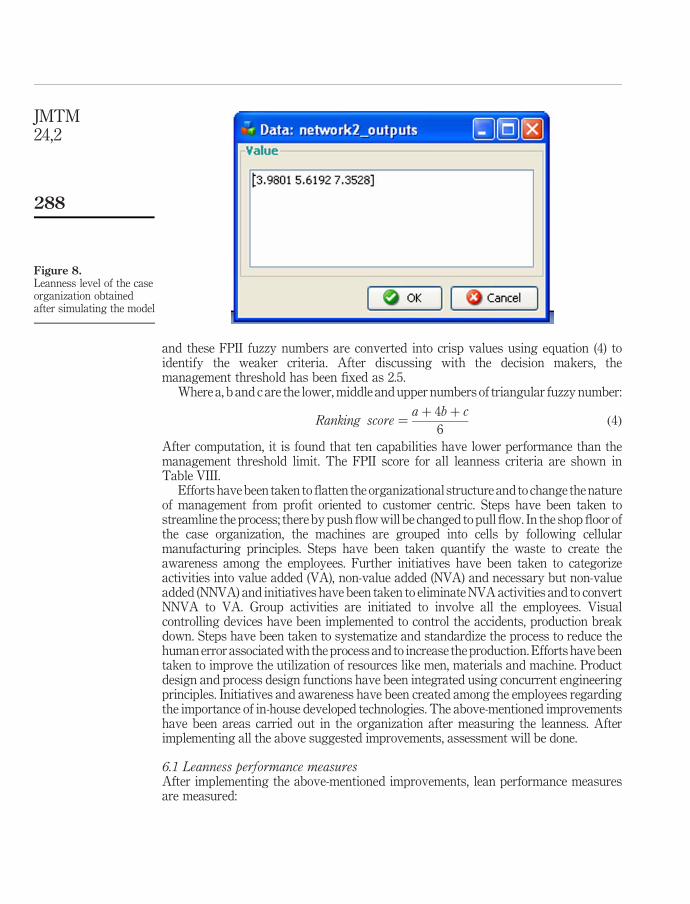
5.5 ValidationThe model has been validated by simulating the network for the data acquired fromthe organization to assess the leanness level of the organization. The data used forassessment the organization using the trained network is shown in Table VII. Thetarget value in terms of triangular fuzzy number obtained after simulating the datawith the network is shown in Figure 8. In this simulation four validation checks hasbeen done with high accuracy:
FLI ¼ ð3:9; 5:6; 7:3Þ
Figure 6.Functions used inback propagation
Leannessassessment
285
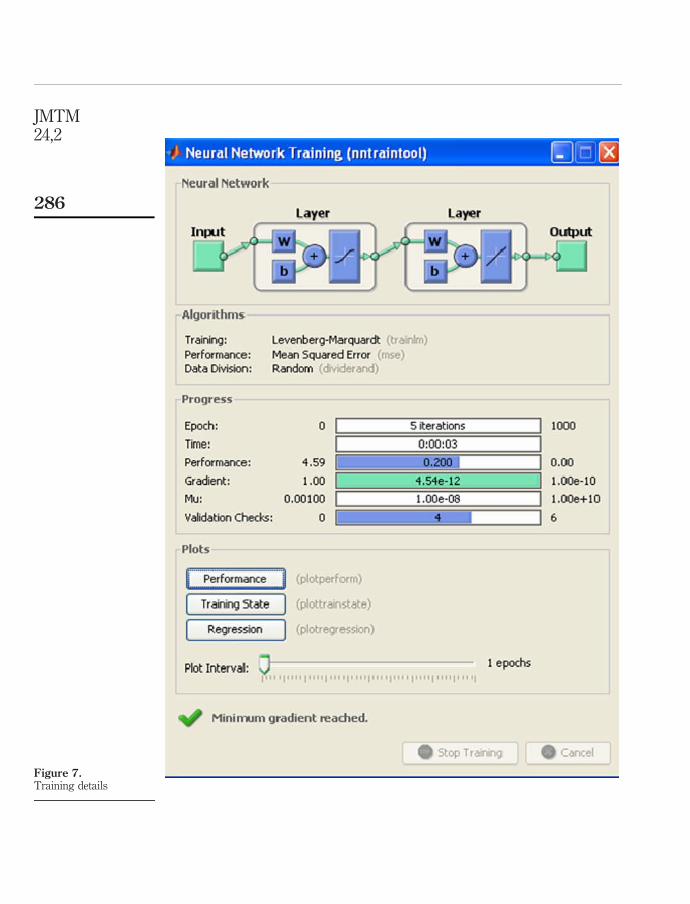
Figure 7.Training details
JMTM24,2
286
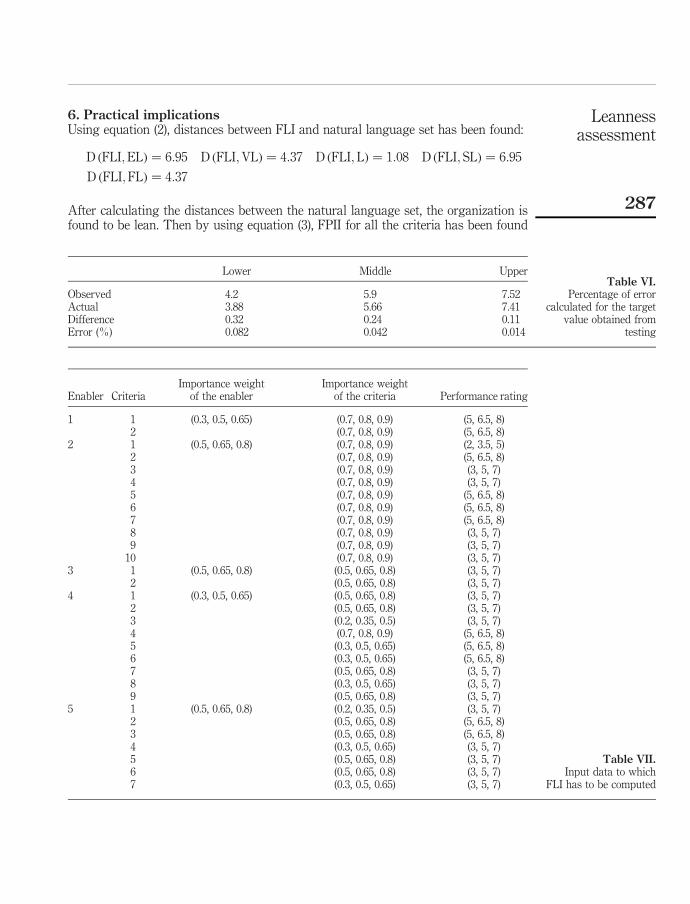
6. Practical implicationsUsing equation (2), distances between FLI and natural language set has been found:
D ðFLI;ELÞ ¼ 6:95 D ðFLI;VLÞ ¼ 4:37 D ðFLI;LÞ ¼ 1:08 D ðFLI; SLÞ ¼ 6:95
D ðFLI;FLÞ ¼ 4:37
After calculating the distances between the natural language set, the organization isfound to be lean. Then by using equation (3), FPII for all the criteria has been found
Lower Middle Upper
Observed 4.2 5.9 7.52Actual 3.88 5.66 7.41Difference 0.32 0.24 0.11Error (%) 0.082 0.042 0.014
Table VI.Percentage of error
calculated for the targetvalue obtained from
testing
Enabler CriteriaImportance weight
of the enablerImportance weight
of the criteria Performance rating
1 1 (0.3, 0.5, 0.65) (0.7, 0.8, 0.9) (5, 6.5, 8)2 (0.7, 0.8, 0.9) (5, 6.5, 8)
2 1 (0.5, 0.65, 0.8) (0.7, 0.8, 0.9) (2, 3.5, 5)2 (0.7, 0.8, 0.9) (5, 6.5, 8)3 (0.7, 0.8, 0.9) (3, 5, 7)4 (0.7, 0.8, 0.9) (3, 5, 7)5 (0.7, 0.8, 0.9) (5, 6.5, 8)6 (0.7, 0.8, 0.9) (5, 6.5, 8)7 (0.7, 0.8, 0.9) (5, 6.5, 8)8 (0.7, 0.8, 0.9) (3, 5, 7)9 (0.7, 0.8, 0.9) (3, 5, 7)
10 (0.7, 0.8, 0.9) (3, 5, 7)3 1 (0.5, 0.65, 0.8) (0.5, 0.65, 0.8) (3, 5, 7)
2 (0.5, 0.65, 0.8) (3, 5, 7)4 1 (0.3, 0.5, 0.65) (0.5, 0.65, 0.8) (3, 5, 7)
2 (0.5, 0.65, 0.8) (3, 5, 7)3 (0.2, 0.35, 0.5) (3, 5, 7)4 (0.7, 0.8, 0.9) (5, 6.5, 8)5 (0.3, 0.5, 0.65) (5, 6.5, 8)6 (0.3, 0.5, 0.65) (5, 6.5, 8)7 (0.5, 0.65, 0.8) (3, 5, 7)8 (0.3, 0.5, 0.65) (3, 5, 7)9 (0.5, 0.65, 0.8) (3, 5, 7)
5 1 (0.5, 0.65, 0.8) (0.2, 0.35, 0.5) (3, 5, 7)2 (0.5, 0.65, 0.8) (5, 6.5, 8)3 (0.5, 0.65, 0.8) (5, 6.5, 8)4 (0.3, 0.5, 0.65) (3, 5, 7)5 (0.5, 0.65, 0.8) (3, 5, 7)6 (0.5, 0.65, 0.8) (3, 5, 7)7 (0.3, 0.5, 0.65) (3, 5, 7)
Table VII.Input data to which
FLI has to be computed
Leannessassessment
287
and these FPII fuzzy numbers are converted into crisp values using equation (4) toidentify the weaker criteria. After discussing with the decision makers, themanagement threshold has been fixed as 2.5.
Where a, b and c are the lower, middle and upper numbers of triangular fuzzy number:
Ranking score ¼aþ 4bþ c
6ð4Þ
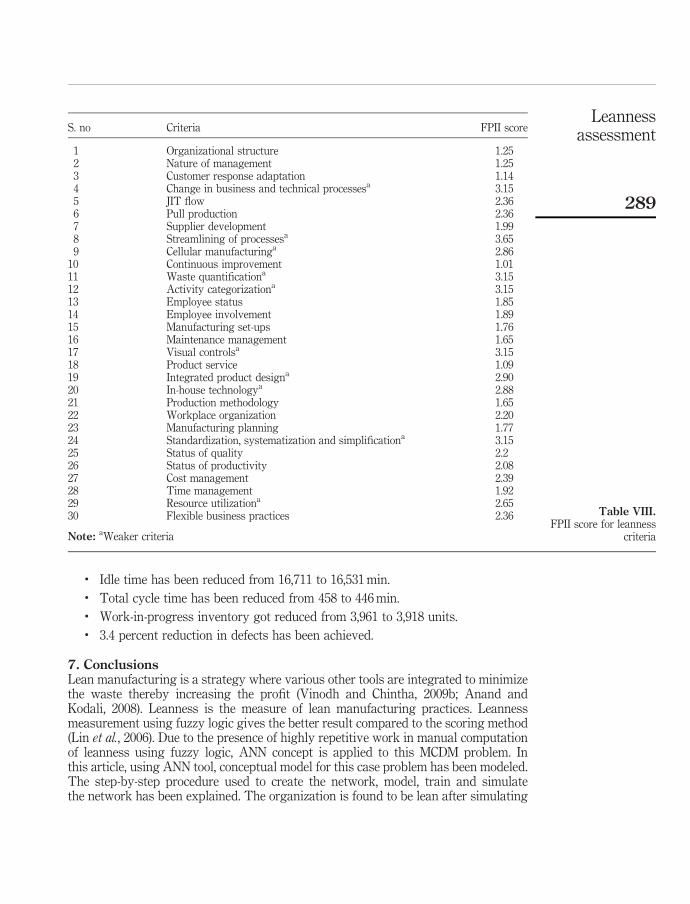
After computation, it is found that ten capabilities have lower performance than themanagement threshold limit. The FPII score for all leanness criteria are shown inTable VIII.
Efforts have been taken to flatten the organizational structure and to change the natureof management from profit oriented to customer centric. Steps have been taken tostreamline the process; there by push flow will be changed to pull flow. In the shop floor ofthe case organization, the machines are grouped into cells by following cellularmanufacturing principles. Steps have been taken quantify the waste to create theawareness among the employees. Further initiatives have been taken to categorizeactivities into value added (VA), non-value added (NVA) and necessary but non-valueadded (NNVA) and initiatives have been taken to eliminate NVA activities and to convertNNVA to VA. Group activities are initiated to involve all the employees. Visualcontrolling devices have been implemented to control the accidents, production breakdown. Steps have been taken to systematize and standardize the process to reduce thehuman error associated with the process and to increase the production. Efforts have beentaken to improve the utilization of resources like men, materials and machine. Productdesign and process design functions have been integrated using concurrent engineeringprinciples. Initiatives and awareness have been created among the employees regardingthe importance of in-house developed technologies. The above-mentioned improvementshave been areas carried out in the organization after measuring the leanness. Afterimplementing all the above suggested improvements, assessment will be done.
6.1 Leanness performance measuresAfter implementing the above-mentioned improvements, lean performance measuresare measured:
Figure 8.Leanness level of the caseorganization obtainedafter simulating the model
JMTM24,2
288
. Idle time has been reduced from 16,711 to 16,531 min.
. Total cycle time has been reduced from 458 to 446 min.
. Work-in-progress inventory got reduced from 3,961 to 3,918 units.
. 3.4 percent reduction in defects has been achieved.
7. ConclusionsLean manufacturing is a strategy where various other tools are integrated to minimizethe waste thereby increasing the profit (Vinodh and Chintha, 2009b; Anand andKodali, 2008). Leanness is the measure of lean manufacturing practices. Leannessmeasurement using fuzzy logic gives the better result compared to the scoring method(Lin et al., 2006). Due to the presence of highly repetitive work in manual computationof leanness using fuzzy logic, ANN concept is applied to this MCDM problem. Inthis article, using ANN tool, conceptual model for this case problem has been modeled.The step-by-step procedure used to create the network, model, train and simulatethe network has been explained. The organization is found to be lean after simulating
S. no Criteria FPII score
1 Organizational structure 1.252 Nature of management 1.253 Customer response adaptation 1.144 Change in business and technical processesa 3.155 JIT flow 2.366 Pull production 2.367 Supplier development 1.998 Streamlining of processesa 3.659 Cellular manufacturinga 2.86
10 Continuous improvement 1.0111 Waste quantificationa 3.1512 Activity categorizationa 3.1513 Employee status 1.8514 Employee involvement 1.8915 Manufacturing set-ups 1.7616 Maintenance management 1.6517 Visual controlsa 3.1518 Product service 1.0919 Integrated product designa 2.9020 In-house technologya 2.8821 Production methodology 1.6522 Workplace organization 2.2023 Manufacturing planning 1.7724 Standardization, systematization and simplificationa 3.1525 Status of quality 2.226 Status of productivity 2.0827 Cost management 2.3928 Time management 1.9229 Resource utilizationa 2.6530 Flexible business practices 2.36
Note: aWeaker criteria
Table VIII.FPII score for leanness
criteria
Leannessassessment
289
the developed model. Thus, the approach has been practically validated by measuringthe leanness of the case organization. Then the FPII is calculated to identify the weakercriteria to further improve the leanness level of the organization. After implementingthe improvement proposals, lean performance measures are measured to quantify theimprovements.
Limitations and future research direction30 criteria model could be further expanded with significant modification to improvethe comprehensiveness of leanness evaluation. In the present study, triangular fuzzynumbers are used for the conversion of linguistic variables; in future trapezoidal fuzzynumber could also be explored for improving the effectiveness of the evaluationapproach. Further, advanced approaches such as fuzzy association rules mining couldalso be developed for leanness evaluation.
References
Abdulmalek, F.A. and Rajgopal, J. (2007), “Analyzing the benefits of lean manufacturing andvalue stream mapping via simulation: a process sector case study”, International Journalof Production Economics, Vol. 107 No. 1, pp. 223-36.
Al-Najjar, B. and Alsyouf, I. (2002), “Selecting the most efficient maintenance approach usingfuzzy multiple criteria decision making”, International Journal of Production Economics,Vol. 84 No. 1, pp. 85-100.
Amid, A., Ghodsypour, S.H. and O’Brien, C. (2011), “A weighted max-min model for fuzzymulti-objective supplier selection in a supply chain”, International Journal of ProductionEconomics, Vol. 131 No. 2, pp. 139-45.
Anand, G. and Kodali, R. (2008), “Selection of lean manufacturing systems using thePROMETHEE”, Journal of Modelling in Management, Vol. 3 No. 1, pp. 40-70.
Anand, G. and Kodali, R. (2011), “Design of lean manufacturing systems using value streammapping with simulation: a case study”, Journal of Manufacturing TechnologyManagement, Vol. 22 No. 4, pp. 444-73.
Au, K.F., Choi, T.M. and Yu, Y. (2008), “Fashion retail forecasting by evolutionary neuralnetworks”, International Journal of Production Economics, Vol. 114, pp. 615-30.
Baguley, P., Page, T., Koliza, V. and Maropoulos, P. (2006), “Time to market prediction using type-2fuzzy sets”, Journal of Manufacturing Technology Management, Vol. 17 No. 4, pp. 513-20.
Bayou, M.E. and De Korvin, A. (2008), “Measuring the leanness of manufacturing systems –a case study of Ford Motor Company and General Motors”, Journal of Engineering& Technology Management, Vol. 25 No. 4, pp. 287-304.
Bottani, E. (2009), “A fuzzy QFD approach to achieve agility”, International Journal of ProductionEconomics, Vol. 119 No. 2, pp. 380-91.
Cavalieri, S., Pinto, R. and Maccarrone, P. (2003), “Parametric vs neural network models for theestimation of production costs: a case study in the automotive industry”, InternationalJournal of Production Economics, Vol. 91 No. 2, pp. 165-77.
Chambers, M. and Campbell, C.A.M. (2002), “Process optimization via neural network metamodeling”, International Journal of Production Economics, Vol. 79 No. 2, pp. 93-100.
Ciurana, J., Quintana, G. and Romeu, D.L.G. (2008), “Estimating the cost of vertical high-speedmachining centres, a comparison between multiple regression analysis and the neuralnetworks approach”, International Journal of Production Economics, Vol. 115 No. 2,pp. 171-8.
JMTM24,2
290
Golmohammadi, D. (2011), “Neural network application for fuzzy multi-criteria decision makingproblems”, International Journal of Production Economics, Vol. 131 No. 2, pp. 490-504.
Guesgen, H.W. and Albrecht, J. (2000), “Imprecise reasoning in geographic information systems”,Fuzzy Sets and Systems, Vol. 113 No. 2, pp. 121-31.
Gutierrez, R.S., Solis, A.O. and Mukhopadhyay, S. (2008), “Lumpy demand forecasting usingneural networks”, International Journal of Production Economics, Vol. 999 No. 2, pp. 409-20.
Herron, C. and Hicks, C. (2008), “The transfer of selected lean manufacturing techniques fromJapanese automotive manufacturing into general manufacturing (UK) through changeagents”, Robotics and Computer-Integrated Manufacturing, Vol. 24 No. 4, pp. 524-31.
Karsak, E.E. and Tolga, E. (2001), “Fuzzy multi-criteria decision-making procedure forevaluating advanced manufacturing system investments”, International Journal ofProduction Economics, Vol. 69 No. 1, pp. 49-64.
Lin, C.T., Chiu, H. and Tseng, Y.H. (2006), “Agility evaluation using fuzzy logic”, InternationalJournal of Production Economics, Vol. 101 No. 2, pp. 353-68.
Luxhoj, J.T., Riis, J.O. and Stensballe, B. (1996), “A hybrid econometric-neural network modelingapproach for sales forecasting”, International Journal of Production Economics, Vol. 43,pp. 175-92.
Noor-E-Alam, M., Hasin, M.A.A., Ullah, A.M.M.S. and Lipi, T.F. (2008), “Supplier evaluation withGD-based multi criteria decision making”, International Journal of Industrial and SystemsEngineering, Vol. 3 No. 3, pp. 368-81.
Noor-E-Alam, M., Lipi, T.F., Hasin, M.A.A. and Ullah, A.M.M.S. (2011), “Algorithms for fuzzymulti expert multi criteria decision making (ME-MCDM)”, Knowledge-Based Systems,Vol. 24 No. 3, pp. 367-77.
Serrano, I., Ochoa, C. and De Castro, R. (2008), “Evaluation of value stream mapping inmanufacturing system redesign”, International Journal of Production Research, Vol. 46No. 16, pp. 4409-30.
Seth, D., Seth, N. and Goel, D. (2008), “Application of value stream mapping (VSM) forminimization of wastes in the processing side of supply chain of cottonseed oil industry inIndian context”, Journal of Manufacturing Technology Management, Vol. 19 No. 4,pp. 529-50.
Shah, R. and Ward, T. (2003), “Lean manufacturing: context, practice bundles, and performance”,Journal of Operations Management, Vol. 21 No. 2, pp. 129-49.
Shamsuzzaman, M., Ullah, A.M.M.S. and Bohez, E.L.J. (2003), “Applying linguistic criteria inFMS selection: fuzzy-set-AHP approach”, Journal of Integrated Manufacturing Systems,Vol. 14 No. 3, pp. 247-54.
Singh, R.K., Kumar, S., Choudhury, A.K. and Tiwari, M.K. (2006), “Lean tool selection in a diecasting unit: a fuzzy-based decision support heuristic”, International Journal of ProductionResearch, Vol. 44 No. 7, pp. 1399-429.
Sullivan, G., McDonald, N. and Aken, M.V. (2002), “Equipment replacement decisions and leanmanufacturing”, Robotics and Computer-Integrated Manufacturing, Vol. 18 No. 3,pp. 255-65.
Ullah, A.M.M.S. (2005), “A fuzzy decision model for conceptual design”, Systems Engineering,Vol. 8 No. 4, pp. 296-308.
Ullah, A.M.M.S. and Harib, K.H. (2008), “An intelligent method for selecting optimal materialsand its application”, Advanced Engineering Informatics, Vol. 22 No. 4, pp. 473-83.
Leannessassessment
291

Vinodh, S. and Chintha, S.K. (2009a), “Application of fuzzy QFD for enabling leanness in amanufacturing organization”, International Journal of Production Research, Vol. 49 No. 6,pp. 1627-44.
Vinodh, S. and Chintha, S.K. (2009b), “Lean assessment suing multi grade fuzzy approach”,International Journal of Production Research, Vol. 49 No. 2, pp. 431-45.
Vinodh, S., Arvind, K.R. and Somanaathan, M. (2010a), “Application of value stream mapping inan Indian camshaft manufacturing organization”, Journal of Manufacturing TechnologyManagement, Vol. 21 No. 7, pp. 888-900.
Vinodh, S., Gautham, S.G., Ramiya, R.A. and Rajanayagam, D. (2010b), “Application of fuzzyanalytic network process for agile concept selection in a manufacturing organization”,International Journal of Production Research, Vol. 48 Nos 23/24, pp. 7243-64.
Wang, R.C. and Chuu, S.J. (2004), “Group decision-making using a fuzzy linguistic approach forevaluating the flexibility in a manufacturing system”, European Journal of OperationalResearch, Vol. 154 No. 3, pp. 563-72.
Corresponding authorSekar Vinodh can be contacted at: [email protected]
To purchase reprints of this article please e-mail: [email protected] visit our web site for further details: www.emeraldinsight.com/reprints
JMTM24,2
292


![Artificial Neural Networks Fuzzy Logic[1]](https://img.pdfslide.net/doc/110x75/577d2aa61a28ab4e1ea9b849/artificial-neural-networks-fuzzy-logic1.jpg)