Embed Size (px)
Citation preview

8
APPLICATION OF DECISION SUPPORT SYSTEM FOR DETERMINING AMPHIBIOUS LANDING BEACH
IN WEST PAPUA INDONESIA
Budi Setiarso¹, Udisubakti Ciptomulyono², Bambang Suharjo¹, I Nengah Putra¹, A K Susilo¹
¹Indonesian Naval Technology College, STTAL, Surabaya, Indonesia ²Industrial Engineering Department, Institut Teknologi Sepuluh Nopember Surabaya, Indonesia
ABSTRACT
Determination of the landing beach becomes a must for the Marine Forces of the Indonesian Navy as an element
of the landing forces in order to carry out the task of amphibious operations in particular to determine the ideal
landing beach location for the successful implementation of the task. Requirements on the determination of ideal
landing beaches should be in accordance with predetermined parameters and serve as an important component
in determining the weighting value of landing beach selection criteria. This study aims to determine the location
of landing beaches by using the Preference Ranking Method Method of Organization for Enrichment Evaluation
(PROMETHEE) combined into the Borda method. The research stages started from determining the value of
criterion preferences to the landing beach alternative options analyzed by PROMETHEE method then processed
again in Borda method. The PROMETHEE method is used to analyze individual decisions of decision makers,
while the Borda method is used to manage group decisions from the PROMETHEE method of ranking. The use
of both methods is a solution to generate more objective group decisions so as to obtain a ranking result against
the selection of logical amphibious landing beaches and have an objective value in accordance with accurate data
and greatly assist decision-makers to solve multi-criteria problems. From the results of this study can be seen that
the location of the selected beach is the most feasible to serve as the location of landing beaches in amphibious
operations is Beach 3 with a weighted value of 0.389.
Keywords: Amphibious operations, the landing beach, Decision Support Systems, PROMETHEE, Borda.
1. INTRODUCTION.
Indonesia is one of the largest countries in the
world with a total area 5.193.250 km2 covering land
and sea areas. This places Indonesia as the world's
seventh largest country after Russia, Canada, USA,
China, Brazil and Australia (Putra, et al., 2017). In
addition Indonesia is also the largest archipelagic
country in the world with a vast maritime territory with
a total coastline of about 81.000 km2 and has more
than 17.000 islands and 5,8 km2 of sea area or about
70% of the total area of Indonesia (Putra, et al.,
2017). As an archipelagic country, especially in the
eastern part of Indonesia with its abundant natural
resources, it has not been optimally utilized so that it
is very vulnerable to regional violation activities, such
as illegal fishing, illegal mining, illegal logging and
other illegal activities (Headquarter, 2017). World
Maritime Axis Policy issued by the President of the
Republic of Indonesia demands that Indonesia
should anticipate able to maintain security stability in
the urisdiction of NKRI. For that reason it is
necessary a thought that can answer the problems
faced in the eastern of Indonesia (Headquarter,
2017).
The process of division of Papua region has
contributed well to the plan of establishment of The
Eastern Marine Area Command and the 3𝑟𝑑 of
Marine Force in West Papua due to infrastructure
International Journal of ASRO Volume 9, Number 1, pp. 8-22
January-June 2018

9
development (Headquarter, 2017), facilities and
infrastructure of the local area is getting better. In
order to carry out the function of empowering the
marine defense area requires the ability of sea
defense and also the ability to maintain all the
potential of natural resources in it (Brink, 2000).
Understanding deeply about the coastal
characteristics of West Papua especially related to
the determination of landing beach becomes a must
for Pasmar as a landing troop element in order to
carry out the task of amphibious operation especially
to determine the ideal landing beach location
(Headquarter, 2013) for the successful
implementation of the task (Brink, 2000).
Requirements on determining ideal landing beaches
(Collins, 1998) must conform to predefined
parameters (Brink, 2000). These parameters serve
as an important component in the determination of
the criterion preferences value of the selected
alternative (Ronyastra, et al., 2015) ideal landing
beach location.
In the case of the landing beach location
selection the PROMETHEE method is used to make
individual decisions. Individual decision making is
done by each decision maker by giving input in the
form of weighted value against the criteria used
(Brans, et al., 1998). PROMETHEE method is used
in this research because this method is good enough
to take into account the characteristics of the data as
well as provide many functions that can
accommodate various kinds of data characteristics
(Deshmukh, 2013). The Borda method uses a
preferential calculation for ranking against inputs
provided by decision makers with more than one
alternative (Costa, 2017). The Borda method in this
study is used to accommodate the decision of each
decision maker (Mohajan, 2013) which results from
the calculation of the PROMETHEE method.
Calculations using the Borda method use the
weights in each ranking of each decision maker (da
Rocha, et al., 2016). The choice alternatives with the
top-ranking positions produced by each decision
maker are rated higher than the rank below
(Saediman, 2015). Using the method, the resulting
decision is wiser depending on the original rank.
By using PROMETHEE method combined
into Borda method, the research stages are started
from the determination of the criterion preferences
value (Ronyastra, et al., 2015) to the alternative
choice (Velazques & Hestler, 2013) landing beaches
using PROMETHEE method analysis to find an
alternative ranking value for each individual
decision-maker, then the ranking result is processed
again with Borda method that emphasizes on the
weighting of all alternative ranking (Costa, 2017)
which is generated in the previous process so it is
expected to obtain the result of alternative ranking of
the landing beach which is logical and has objective
value according to accurate data and very help the
decision makers to solve the problem which is multi-
criteria (Velasquez & Hester, 2013).
The systematics of this study are as follows:
Chapter 2 contains a review literature on the
definition of Amphibious Operations, landing
beaches and theories used as the basis for the use
of PROMETHEE and Borda methods. In chapter 3
discussed the flowchart and the use of research
methods in all stages of the study. In chapter 4 the
results and discussion are presented and the last is
chapter 5 conclusion.
1. 2. MATERIAL/METHODOLOGY.
Amphibious Operations.
Amphibious Operation is an attack
carried out from the sea by naval units of the
Navy and landing troops loaded in ships and
amphibious landing means (Brink, 2000) and
landed on enemy shore and / or coastal
potential enemy (Headquarter, 2013).
The Landing Beach.

10
The landing beach is part of the
coastline required for landing one Battalion of
Landing Team or equivalent unit. Beach
landing can also be part of the coastline that
has tactical value (Brink, 2000), such as a bay
beach that can be used to land a smaller unity
of the Battalion of the Landing Team (Brink,
2000) (Headquarter, 2013). In landing beach
selection, certain types of oceanographic data
should be adequately considered so that the
Marines can safely carry out their landing
(Staff, 2014) (Brink, 2000). These types of
data include the concept of landing troop
operations, coastal capacity to maneuver
amphibious landing troops, coastal
approaches, coastal obstacles, coastal rear
features, communications infrastructure
including railroads and weather and other
hydro-oceanographic data (Collins, 1998). An
important aspect of the ideal landing zone
selection criteria in amphibious operations
should be in accordance with landing beach
parameters (Collins, 1998) which has been
determined in accordance with table 1.
Table 1. Parameter of criteria for ideal landing
beach in amphibious operations (Collins, 1998).
Group Decision Support System.
Decision Support Systems The group
was very popular in the 1980s which was a
tool in finding solutions to solve problems in
workgroups (Manzini & Pareschi, 2012) so the
system is usually called the group decision
support system (Korhonen, et al., 1992).
There are three important steps to solve the
problem in this system:
a. Determination of criteria and
alternatives.
b. Evaluate the value of criteria preference
to alternative by the decision makers of each
section.

11
c. Evaluate the weighted values collected
into one group to determine the alternatives of
group selection.
PROMETHEE Method.
PROMETHEE (Preference Ranking
Organization Method for Enrichment
Evaluation)
is a method for determining the order or
priority of alternative options (Turcksin, et al.,
2011) on issues that are multicriteria (Brans,
et al., 1998) which offers a simple and flexible
way (Rao & Rajesh, 2009) to the decision
makers in order to find the right solution
(Martin, et al., 2003) on multicriteria issues
(Brans & Vincke, 1985). In this method the
value of the criterion preferences for the
alternative P (d) is grouped according to the
six types of preference functions (Deshmukh,
2013) below:
a. Usual criterion.
𝑃(𝑑) =
.0,1
,0,0
d
d (1)
In this case, 𝑎 and 𝑏 are said to be
indifference if and only if 𝑓 (𝑎) = 𝑓 (𝑏). If
there is a difference (though very small)
between the two alternatives then the decision
maker gives immediate preference (Halouani,
et al., 2009) strong for an alternative with a
higher value (Brans & Vincke, 1985). The
function P (d) is shown in Figure 1 below:
Fig. 1 Usual criterion.
b. Quasi criterion:
𝑃(𝑑) =
qdqd
qdq
,1
,0 (2)
Based on this criterion, the two
alternatives are said to be no different as long
as the value 𝑑 does not exceed the value of 𝑞,
and if the d value exceeds the 𝑞 value then
there is absolute preference (Brans & Vincke,
1985). This is shown in Figure 2 below:
Fig. 2 Quasi criterion.
If the decision maker decides to use the
quasi criterion, then the value of 𝑞 should be
determined (Deshmukh, 2013), where this
value can explain the significant effect of a
criterion (Macharis, et al., 2004). Thus it can
be said that q is the indifference threshold
value, which is the largest 𝑑 value which still
allows indifference between alternatives
(Christian, et al., 2016).
c. Criterion with linear preference:
𝑃(𝑑) =
.,1
,,/
pdpd
pdppd (3)
In this criterion, decision-making
preferences increase linearly as long as the
value 𝑑 is still lower than 𝑝 (Vega, et al., 2013).
And if 𝑑 exceeds p occurs absolute preference
(Goumas & Lygerou, 2000). Here the decision
maker must set the value of 𝑝 (threshold
preference value), it’s the lowest 𝑑 value that
still results in a preference relationship
between alternatives (Brans & Vincke, 1985).
Fig. 3 Criterion with linear preference.
d. Level criterion:
0
P(d)
1
d
-q 0 q
P(d)
1
d
-p 0 p
𝑃(𝑑)
1
d

12
𝑃(𝑑) =
.,1
,,2/1
,,0
dp
pdq
qd
(4)
Here, the indifference threshold value 𝑞
and the preference threshold 𝑝 are
determined simultaneously (Briggs, et al.,
1990). If d lies between 𝑞 and 𝑝 then there is
a weak preference relationship ( 𝑃(𝑑)=1/2 )
(Brans & Vincke, 1985).
Fig. 4 Level criterion.
e. Criterion with linear preference and
indifferent area:
𝑃(𝑑) =
.,1
,),/()(
,,0
dp
pdqqpqd
qd
(5)
Here the decision-making preference
increases linearly from the indifference to the
absolute preference in the area between 𝑞
and 𝑝 (Behzadian, et al., 2010).
Fig. 5 Criterion with linear preference and
indifferent area.
f. Gaussian criteria:
𝑃(𝑑) = 1 − 𝑒𝑥𝑝{−𝑑2/22}. (6)
Where 𝑑 is difference of criterion value,
then it can be written 𝑑 = 𝑓(𝑎) − 𝑓(𝑏) . Here it
is only necessary to determine the value
which can be made based on the normal
distribution of statistics (Martin, et al., 2003).
Graphically, this criterion can be seen in the
following picture:
Fig. 6 Gaussian Criteria
The stages of calculation by using
PROMETHEE method is as follows (Vega, et
al., 2013):
a. Specify some alternatives.
b. Specify some criteria.
c. Define the criteria weight.
d. Define the rating rules (maximum or
minimum).
e. Determine the type of preference for
each criterion based on data and judgments of
decision makers. These types of preferences
are Usual, Quasi, linear, quasi and Gaussian
linear.
f. Calculates the preference index.
g. Calculating leaving flow, entering flow
and net flow.
h. Determine the ranking of alternatives by
creating a peraninga table (Brans & Vincke,
1985).
Borda Method.
Borda method proposed by the
discoverer of Jean Charles de Borda in the
18th century is one of the methods used for
the alternative purpose of some selected
alternatives (Costa, 2017). Each alternate
option will be judged on a weighted value and
then sorted by rank (Vega, et al., 2013). The
greatest weight is the best alternative for
decision makers (Mohajan, 2012) (Costa,
2017). The privilege of this method can
overcome the difficulties of other methods
where people / things that are not in the first
-p -q 0 q p
P(d) 1
½
d
-p -q 0 q p
𝑃(𝑑)) 1
d
1
0 d
𝑃(𝑑)

13
rank will be automatically eliminated (Ishida,
2017). The basic idea in Borda Method is by
assigning weight to each of the first rank,
second rank, and so on (Ishida, 2017).
Borda method is one method that can
be used to accommodate the ranking of
decision makers (Saediman, 2015). The
calculation on this method uses the weight of
each ranking position generated by the
decision makers (Costa, 2017) (Mohajan,
2013).
Flow Chart Diagram.
In this study is divided into four stages
of research activities are arranged in
sequence starting from the stage of
identification, data collection phase, analysis
and data processing and conclusions and
suggestions that can be seen as Figure 7. as
follows:
Fig. 7 Flow chart diagram of research..
Research Object.
Fig. 8 Research location map.
Fig. 9 Alternative map of landing beach location.
Research Stages.
Stages of this study can be explained
as follows:
a. Identification phase .
1) Problem identification.
Before decision support systems are
built, the problems in the research must
be properly defined so that the results
obtained match the problems at hand.
2) Object Determination.
Determination of research objectives is
done based on a problem that is defined
as something that must be solved.
b. Collecting data phase.
Data collection was obtained by
conducting literature studies on PROMETHEE
and Borda methods used in the study, as well
as the determinant variables and criteria of
ideal landing beach parameters from several
literature such as journals, books and other
relevant scientific sources relevant to the
study.

14
c. Analysis and processing data phase.
Determination of landing beach location
ranking from each decision maker/stake
holder. In this phase, ranking is done by
PROMETHEE method to generate individual
location ranking by decision makers. The
sequence of activities undertaken is as
follows:
a) Determine the criteria value
against the alternatives.
The criteria assessment of alternatives
is implemented by decision makers in
accordance with predetermined
assessment rules.
b) Determine the preference value
𝐻(𝑑).
In this case the type of preference used
is the type of linear preference with the
consideration that the decision maker
will assign the value of the criterion
preferences to each alternative on the
condition that if 𝑑 ≤ 0 then 𝐻(𝑑) = 0
and if 𝑑 > 0 then 𝐻(𝑑) = 1, the
calculation of preference values is
determined by the formula (Ronyastra,
et al., 2015):
𝑃[𝑓(𝑎), 𝑓(𝑏)] = 𝑃[𝑓(𝑎) − 𝑓(𝑏)]
In order to indicate any differences in
values between environments, it can be
written by the formula (Brans, et al.,
1998) (Brans & Vincke, 1985):
𝑑 = 𝑓(𝑎) − 𝑓(𝑏)
Where:
𝑃 : preference.
𝑑 : difference of criterion value
𝑓(𝑎) : preference value 𝑎.
𝑓(𝑏) : preference value 𝑏.
c) Determine the preference index
value 𝐻(𝑑).
After the criterion preferences value for
each individual alternative has been
obtained, the next step is to determine
the preference index value (Brans &
Vincke, 1985) by the formula (Brans, et
al., 1998):
𝜋(𝑎, 𝑏) =1
𝑘∑ 𝑃ℎ(𝑎, 𝑏)
𝑘
ℎ=1
Where:
𝜋(𝑎, 𝑏)= index preference 𝑎, 𝑏.
𝑘 = total of criteria.
ℎ = preference group 1,2,3, . . . , 𝑘.
The function of this index value is to
measure the decision maker's
preferences in order to answer the
question of whether the alternative 𝑎 is
better than alternative 𝑏 taking all the
criteria into account simultaneously
(Brans & Vincke, 1985) (Deshmukh,
2013). This value is between 0 and 1
with conditions if 𝜋(𝑎, 𝑏)=0 then it
shows weak preference for alternative
𝑎 better than 𝑏 in all criteria (Martin, et
al., 2003). And if 𝜋(𝑎, 𝑏)=1 then it strong
preference for alternative 𝑎 better than
𝑏 in all criteria (Brans, et al., 1998).
d) Calculate leaving flow (Ф⁺ ).
Leaving flow function is to measure the
level of dominance of alternative 𝑎 to
other alternatives (Brans, et al., 1998)
with the following formula (Brans &
Vincke, 1985):
∅+(𝑎) =1
𝑛 − 1∑ 𝜋(𝑎, 𝑥)
𝑥∈𝑘
Where:
∅+ : leaving flow
𝑎 : alternative
𝑛 : total of alternative
𝑘 : criteria
𝜋(𝑎, 𝑥) : preference outgoing flow for
each node a.
e) Calculate entering flow (Ф¯),

15
Entering flow is to measure how big an
alternative is dominated by other
alternatives (Brans, et al., 1998) with
the following formula (Brans & Vincke,
1985):
∅−(𝑎) =1
𝑛 − 1∑ 𝜋(𝑥, 𝑎)
𝑥∈𝑘
Where:
∅+ : leaving flow
𝑎 : alternative
𝑛 : total of alternative
𝑘 : criteria
𝜋(𝑥, 𝑎): preference incoming flow for
each node a.
f) Calculate net flow (Ф ).
Net flow is calculated based on the
difference between leaving flow and
entering flow in order to determine an
alternate ranking (Brans, et al., 1998)
by formula (Brans & Vincke, 1985):
∅(𝑎) = ∅+(𝑎) − ∅−(𝑎)
Where:
∅(𝑎) : net flow
∅+(𝑎) : leaving flow
∅−(𝑎) : entering flow
2) Determination of alternative ranking for group
decision.
In this phase, to determinate alternative
ranking for group decision use Borda method where
the rank of landing beaches are resulted by that
count. We can see on this phase below:
a) Create a ranking table from the all
decision maker.
The ranking table is created base on
PROMETHEE process result before, and then
entered in matrix form.
b) Determination alternative value.
From table 3, we do the assessment by giving
the value for the first rank with the value of 𝑛 −
1 where n is the number of alternatives
(Mohajan, 2012). Each decision maker
assigns a 𝑛 − 1 value for the first choice
alternative, 𝑛 − 2 for the second option, 𝑛 − 3
for the third option and so on up to 0 for the
last choice criterion or alternative (Ishida,
2017).
c) Determination ratio value for all
weighted ranking of alternative (Costa, 2017)
with formula below (Ishida, 2017):
𝑅1 = ∑ 𝑅𝑖𝑗
𝑛
𝑗=1
d) Determination of the weight value of
each alternative (𝑊1) (Ishida, 2017):
𝑊1 =𝑅1
∑ 𝑅1𝑚𝑖=1
Where:
𝑅1: the sum of all rankings is weighted for all
criteria 1.
𝑅𝑖𝑗: the rankings are evaluated by j for
criteria 1.
𝑊1: criteria weight 1 for evaluator n.
In this case, all alternatives are
calculated on the basis of their respective
weights and then the results are divided by the
ratio value to get the alternative value. The
alternative with the highest value is the choice.
3. RESULT AND DISCUSS.
Data Alternatives.
From the data acquisition results about
the characteristics of each alternative beach
that will be selected as the location of
amphibious landing beach obtained data.
There are four alternatives to be considered in
the selection process with data summarized
in table 2.
16
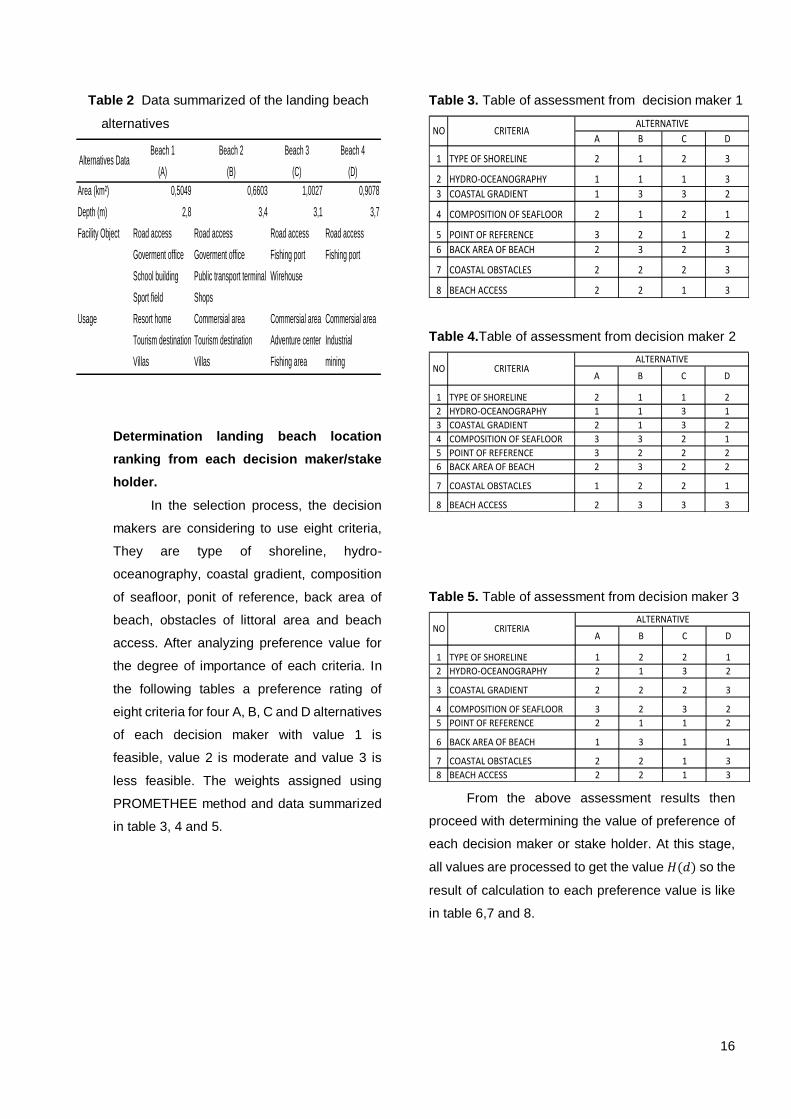
Table 2 Data summarized of the landing beach
alternatives
Determination landing beach location
ranking from each decision maker/stake
holder.
In the selection process, the decision
makers are considering to use eight criteria,
They are type of shoreline, hydro-
oceanography, coastal gradient, composition
of seafloor, ponit of reference, back area of
beach, obstacles of littoral area and beach
access. After analyzing preference value for
the degree of importance of each criteria. In
the following tables a preference rating of
eight criteria for four A, B, C and D alternatives
of each decision maker with value 1 is
feasible, value 2 is moderate and value 3 is
less feasible. The weights assigned using
PROMETHEE method and data summarized
in table 3, 4 and 5.
Table 3. Table of assessment from decision maker 1
Table 4.Table of assessment from decision maker 2
Table 5. Table of assessment from decision maker 3
From the above assessment results then
proceed with determining the value of preference of
each decision maker or stake holder. At this stage,
all values are processed to get the value 𝐻(𝑑) so the
result of calculation to each preference value is like
in table 6,7 and 8.
Beach 1 Beach 2 Beach 3 Beach 4
(A) (B) (C) (D)
Area (km²) 0,5049 0,6603 1,0027 0,9078
Depth (m) 2,8 3,4 3,1 3,7
Road access Road access Road access Road access
Goverment office Goverment office Fishing port Fishing port
School building Public transport terminal Wirehouse
Sport field Shops
Resort home Commersial area Commersial area Commersial area
Tourism destination Tourism destination Adventure center Industrial
Villas Villas Fishing area mining
Usage
Alternatives Data
Facility Object
A B C D
1 TYPE OF SHORELINE 2 1 2 3
2 HYDRO-OCEANOGRAPHY 1 1 1 3
3 COASTAL GRADIENT 1 3 3 2
4 COMPOSITION OF SEAFLOOR 2 1 2 1
5 POINT OF REFERENCE 3 2 1 2
6 BACK AREA OF BEACH 2 3 2 3
7 COASTAL OBSTACLES 2 2 2 3
8 BEACH ACCESS 2 2 1 3
NO CRITERIAALTERNATIVE
A B C D
1 TYPE OF SHORELINE 2 1 1 2
2 HYDRO-OCEANOGRAPHY 1 1 3 1
3 COASTAL GRADIENT 2 1 3 2
4 COMPOSITION OF SEAFLOOR 3 3 2 1
5 POINT OF REFERENCE 3 2 2 2
6 BACK AREA OF BEACH 2 3 2 2
7 COASTAL OBSTACLES 1 2 2 1
8 BEACH ACCESS 2 3 3 3
NO CRITERIAALTERNATIVE
A B C D
1 TYPE OF SHORELINE 1 2 2 1
2 HYDRO-OCEANOGRAPHY 2 1 3 2
3 COASTAL GRADIENT 2 2 2 3
4 COMPOSITION OF SEAFLOOR 3 2 3 2
5 POINT OF REFERENCE 2 1 1 2
6 BACK AREA OF BEACH 1 3 1 1
7 COASTAL OBSTACLES 2 2 1 3
8 BEACH ACCESS 2 2 1 3
NO CRITERIAALTERNATIVE

17
Table 6. Preference value from decision maker 1
Table 7. Preference value from decision maker 2
Table 8. Preference value from decision maker 3.
From the calculation of the above preference
values has been obtained a value of of 𝐻(𝑑) for all
criteria on all landing beach alternatives. Then the
results of the assessment are processed again to
determine a value of 𝜋 as an alternative preference
value index of landing beach location choice on each
decision maker. The calculation result of index value
𝜋 for each decision maker can be seen in table 9, 10
and 11.
Table 9. Calculation result of the preference index
value from decision maker 1.
No Criteria (F)
F1 (A,B) F1 (A,C) F1 (A,D) F1 (B,A) F1 (B,C) F1 (B,D) F1 (C,A) F1 (C,B) F1 (C,D) F1 (D,A) F1 (D,B) F1 (D,C)
d 1 0 -1 -1 -1 -2 0 1 -1 1 2 1
H(d) 1 0 0 0 0 0 0 1 0 1 1 1
F2 (A,B) F2 (A,C) F2 (A,D) F2 (B,A) F2 (B,C) F2 (B,D) F2 (C,A) F2 (C,B) F2 (C,D) F2 (D,A) F2 (D,B) F2 (D,C)
d 0 0 -2 0 0 -2 0 0 -2 2 2 2
H(d) 0 0 0 0 0 0 0 0 0 1 1 1
F3 (A,B) F3 (A,C) F3 (A,D) F3 (B,A) F3 (B,C) F3 (B,D) F3 (C,A) F3 (C,B) F3 (C,D) F3 (D,A) F3 (D,B) F3 (D,C)
d -2 -2 -1 2 0 1 2 0 1 1 -1 -1
H(d) 0 0 0 1 0 1 1 0 1 1 0 0
F4 (A,B) F42 (A,C) F4 (A,D) F4 (B,A) F4 (B,C) F4 (B,D) F4 (C,A) F4 (C,B) F4 (C,D) F4 (D,A) F4 (D,B) F4 (D,C)
d 1 0 1 -1 -1 0 0 1 1 -1 0 -1
H(d) 1 0 1 0 0 0 0 1 1 0 0 0
F5 (A,B) F5 (A,C) F5 (A,D) F5 (B,A) F5 (B,C) F5 (B,D) F5 (C,A) F5 (C,B) F5 (C,D) F5 (D,A) F5 (D,B) F5 (D,C)
d 1 2 1 -1 1 0 -2 -1 -1 -1 0 1
H(d) 1 1 1 0 1 0 0 0 0 0 0 1
F6 (A,B) F6 (A,C) F6 (A,D) F6 (B,A) F6 (B,C) F6 (B,D) F6 (C,A) F6 (C,B) F6 (C,D) F6 (D,A) F6 (D,B) F6 (D,C)
d -1 0 -1 1 1 0 0 -1 -1 1 0 1
H(d) 0 0 0 1 1 0 0 0 0 1 0 1
F7 (A,B) F7 (A,C) F7 (A,D) F7 (B,A) F7 (B,C) F7 (B,D) F7 (C,A) F7 (C,B) F7 (C,D) F7 (D,A) F7 (D,B) F7 (D,C)
d 0 0 -1 0 0 -1 0 0 -1 1 1 1
H(d) 0 0 0 0 0 0 0 0 0 1 1 1
F8 (A,B) F8 (A,C) F8 (A,D) F8 (B,A) F8 (B,C) F8 (B,D) F8 (C,A) F8 (C,B) F8 (C,D) F8 (D,A) F8 (D,B) F8 (D,C)
d 0 1 -1 0 1 -1 -1 -1 -2 1 1 2
H(d) 0 1 0 0 1 0 0 0 0 1 1 1
Calculation Result of Preference Values [H(d)]
6F6: Back Area of
Beach
7 F7: Coastal Obstacle
8 F8: Beach Access
3 F3: Coastal Gradient
4F4: Composition of
Seafloor
5F5: Point of
Reference
F1: Type of
Shoreline1
2F2: Hydro-
Oceanography
No Criteria (F)
F1 (A,B) F1 (A,C) F1 (A,D) F1 (B,A) F1 (B,C) F1 (B,D) F1 (C,A) F1 (C,B) F1 (C,D) F1 (D,A) F1 (D,B) F1 (D,C)
d 1 1 0 -1 0 0 -1 0 -1 0 1 1
H(d) 1 1 0 0 0 0 0 0 0 0 1 1
F2 (A,B) F2 (A,C) F2 (A,D) F2 (B,A) F2 (B,C) F2 (B,D) F2 (C,A) F2 (C,B) F2 (C,D) F2 (D,A) F2 (D,B) F2 (D,C)
d 0 -2 0 0 -2 0 2 2 2 0 0 -2
H(d) 0 0 0 0 0 0 1 1 1 0 0 0
F3 (A,B) F3 (A,C) F3 (A,D) F3 (B,A) F3 (B,C) F3 (B,D) F3 (C,A) F3 (C,B) F3 (C,D) F3 (D,A) F3 (D,B) F3 (D,C)
d 1 -1 0 -1 -2 -1 1 2 1 0 1 -1
H(d) 1 0 0 1 0 0 1 1 1 0 1 0
F4 (A,B) F42 (A,C) F4 (A,D) F4 (B,A) F4 (B,C) F4 (B,D) F4 (C,A) F4 (C,B) F4 (C,D) F4 (D,A) F4 (D,B) F4 (D,C)
d 0 1 2 0 1 2 -1 -1 1 -2 -2 -1
H(d) 0 1 1 0 1 1 0 0 1 0 0 0
F5 (A,B) F5 (A,C) F5 (A,D) F5 (B,A) F5 (B,C) F5 (B,D) F5 (C,A) F5 (C,B) F5 (C,D) F5 (D,A) F5 (D,B) F5 (D,C)
d 1 1 1 -1 0 0 -1 0 2 -1 0 0
H(d) 1 1 1 0 0 0 0 0 1 0 0 0
F6 (A,B) F6 (A,C) F6 (A,D) F6 (B,A) F6 (B,C) F6 (B,D) F6 (C,A) F6 (C,B) F6 (C,D) F6 (D,A) F6 (D,B) F6 (D,C)
d -1 0 0 1 1 1 0 -1 0 0 -1 0
H(d) 0 0 0 1 1 1 0 0 0 0 0 0
F7 (A,B) F7 (A,C) F7 (A,D) F7 (B,A) F7 (B,C) F7 (B,D) F7 (C,A) F7 (C,B) F7 (C,D) F7 (D,A) F7 (D,B) F7 (D,C)
d -1 -1 0 1 0 1 1 0 1 0 -1 -1
H(d) 0 0 0 1 0 1 1 0 1 0 0 0
F8 (A,B) F8 (A,C) F8 (A,D) F8 (B,A) F8 (B,C) F8 (B,D) F8 (C,A) F8 (C,B) F8 (C,D) F8 (D,A) F8 (D,B) F8 (D,C)
d -1 -1 -1 1 0 0 1 0 0 1 0 0
H(d) 0 0 0 1 0 0 1 0 0 1 0 0
Calculation Result of Preference Values [H(d)]
8 F8: Beach Access
1F1: Type of
Shoreline
2F2: Hydro-
Oceanography
3 F3: Coastal Gradient
4F4: Composition of
Seafloor
5F5: Point of
Reference
6F6: Back Area of
Beach
7 F7: Coastal Obstacle
No Criteria (F)
F1 (A,B) F1 (A,C) F1 (A,D) F1 (B,A) F1 (B,C) F1 (B,D) F1 (C,A) F1 (C,B) F1 (C,D) F1 (D,A) F1 (D,B) F1 (D,C)
d -1 -1 0 1 0 1 1 0 1 0 -1 -1
H(d) 0 0 0 1 0 1 1 0 1 0 0 0
F2 (A,B) F2 (A,C) F2 (A,D) F2 (B,A) F2 (B,C) F2 (B,D) F2 (C,A) F2 (C,B) F2 (C,D) F2 (D,A) F2 (D,B) F2 (D,C)
d 1 -1 0 -1 -2 -1 1 2 1 0 0 -1
H(d) 1 0 0 0 0 0 1 1 1 0 0 0
F3 (A,B) F3 (A,C) F3 (A,D) F3 (B,A) F3 (B,C) F3 (B,D) F3 (C,A) F3 (C,B) F3 (C,D) F3 (D,A) F3 (D,B) F3 (D,C)
d 0 0 -1 0 0 -1 0 0 -1 1 1 1
H(d) 0 0 0 0 0 0 0 0 0 1 1 1
F4 (A,B) F42 (A,C) F4 (A,D) F4 (B,A) F4 (B,C) F4 (B,D) F4 (C,A) F4 (C,B) F4 (C,D) F4 (D,A) F4 (D,B) F4 (D,C)
d 1 0 1 -1 -1 0 0 1 1 -1 0 -1
H(d) 1 0 1 0 0 0 0 1 1 0 0 0
F5 (A,B) F5 (A,C) F5 (A,D) F5 (B,A) F5 (B,C) F5 (B,D) F5 (C,A) F5 (C,B) F5 (C,D) F5 (D,A) F5 (D,B) F5 (D,C)
d 1 1 0 -1 0 -1 -1 0 -1 0 1 1
H(d) 1 1 0 0 0 0 0 0 0 0 1 1
F6 (A,B) F6 (A,C) F6 (A,D) F6 (B,A) F6 (B,C) F6 (B,D) F6 (C,A) F6 (C,B) F6 (C,D) F6 (D,A) F6 (D,B) F6 (D,C)
d -2 0 0 2 2 2 0 -2 0 0 -2 0
H(d) 0 0 0 1 1 1 0 0 0 0 0 0
F7 (A,B) F7 (A,C) F7 (A,D) F7 (B,A) F7 (B,C) F7 (B,D) F7 (C,A) F7 (C,B) F7 (C,D) F7 (D,A) F7 (D,B) F7 (D,C)
d 0 1 -1 0 1 -1 -1 -1 -2 1 1 2
H(d) 0 1 0 0 1 0 0 0 0 1 1 1
F8 (A,B) F8 (A,C) F8 (A,D) F8 (B,A) F8 (B,C) F8 (B,D) F8 (C,A) F8 (C,B) F8 (C,D) F8 (D,A) F8 (D,B) F8 (D,C)
d 0 1 -1 0 1 -1 -1 -1 -2 1 1 2
H(d) 0 1 0 0 1 0 0 0 0 1 1 1
Calculation Result of Preference Values [H(d)]
1F1: Type of
Shoreline
2F2: Hydro-
Oceanography
3 F3: Coastal Gradient
4F4: Composition of
Seafloor
8 F8: Beach Access
5F5: Point of
Reference
6F6: Back Area of
Beach
7 F7: Coastal Obstacle
Index A B C D
A 0 0,375 0,25 0,25
B 0,25 0 0,375 0,125
C 0,125 0,25 0 0,25
D 0,75 0,5 0,75 0

18
Table 10. Calculation result of the preference index
value from decision maker 2.
Table 11. Calculation result of the preference index
value from decision maker 3.
After the preference index value in each
decision maker has been obtained, then the next
step is to determine the value of leaving flow (∅+) ,
entering flow (∅−) dan net flow (∅) to know the
acquisition of the ratings of all the alternative landing
beach options in each decision maker that we can
see in tables 12, 13 and 14.
Table 12. Calculation result of leaving flow, entering
flow and net flow from decision maker 1.
Table 13. Calculation result of leaving flow, entering
flow and net flow from decision maker 2.
Table 14. Calculation result of leaving flow, entering
flow and net flow from decision maker 3.
From the calculation of the value of leaving
flow, entering flow and net flow above we can see
the difference of the ranking of the alternative to the
alternative on each decision maker. In the decision
maker 1 shows the alternative D in the order of 1 with
the net value of 0.458 followed by alternative C in the
order of 2 with the net value of -0.25, the alternative
B in the order of 3 with net flow -0.125 and the last
alternative A in fourth place with net flow -0.083.
While the ranking in decision maker 2 shows the
alternative C in the first sequence with net flow
0.208, alternate B in second with net flow 0.083,
alternative A in third with net flow -0,042 and
alternative D in fourth with net flow -0, 25. While for
decision maker 3 produce alternative D in the first
sequence with net flow 0,208, alternative A in second
with net flow 0, alternative C in third with net flow -
0,125 and alternative B in fourth with net value -
0,083.
Determination of alternatif ranking for group
decision.
From the results of individual decisions
resulting from each decision maker, then performed
the processing using Borda method. This Borda
calculation is used to manage group decisions from
the rankings generated by each appraiser so that the
resulting decision has a more objective value.
Alternative landing beach ranking results from
each decision maker as assessors can be seen in
table 15.
Index A B C D
A 0 0,375 0,375 0,25
B 0,5 0 0,25 0,375
C 0,5 0,25 0 0,625
D 0,125 0,25 0,125 0
Index A B C D
A 0 0,375 0,375 0,125
B 0,25 0 0,375 0,25
C 0,25 0,25 0 0,375
D 0,375 0,5 0,5 0
A 0,292 0,375 -0,083 4
B 0,250 0,375 -0,125 3
C 0,208 0,458 -0,250 2
D 0,667 0,208 0,458 1
AlternativeLeaving
Flow (Ф⁺)
Entering
Flow (Ф¯)
Net Flow
(Ф)
Alternative
Ranking
A 0,333 0,375 -0,042 3
B 0,375 0,292 0,083 2
C 0,458 0,250 0,208 1
D 0,167 0,417 -0,250 4
AlternativeLeaving
Flow (Ф⁺)
Entering
Flow (Ф¯)
Net Flow
(Ф)
Alternative
Ranking
A 0,292 0,292 0 2
B 0,292 0,375 -0,083 4
C 0,292 0,417 -0,125 3
D 0,458 0,250 0,208 1
AlternativeLeaving
Flow (Ф⁺)
Entering
Flow (Ф¯)
Net Flow
(Ф)
Alternative
Ranking

19
Table 15. Ranking result from each assessor.
At this stage, the ranking of the alternatives of
each decision maker was re-processed as the
material for determining the ranking of landing beach
alternatives using the Borda method in order to
obtain group decision results. The calculation of
Borda is done by giving a value to the 𝑛 − 1
alternative for the first rank, 𝑛 − 2 for second rank,
𝑛 − 3 for third rank and 𝑛 − 4 for fourth rank, where
in this case the alternative number is four landing
beach options so the value given for the first rank is
3 and so on up to the value 0 for the last ranking. The
results of the assessment process on the landing
beach alternative can be seen in table 16.
Table 16. Calculation result of alternatif value.
The results of the calculation of the above
alternative values shown in the column value 1,
value 2 and value 3 further determined the ratio
value (𝑅1) for all weighted ranking values of all
alternatives in accordance with Borda calculations
with the result 𝑅1 = 18. Based on the 𝑅1, all
alternatives are calculated on the basis of their
respective weights and then the results are divided
by the ratio value to get the alternate value. From the
resulting alternative value that can be known the
overall ranking ranking of the landing beach
alternative to be selected. In table 17 is the result of
the calculation of Borda method which shows the
ranking of alternative based on the value of
alternative generated. While in Figure 10 shows the
graph of alternative ranking result which compiled
based on result of calculation of alternative value.
Table 17. Alternative ranking result.
Fig. 10. The ranking result graph.
From the final result of the calculation it can be
seen that the group decision making using the Borda
method resulted in Beach 3 with an alternative value
of 0.389 as the main priority to be chosen as landing
beach, then in the other priority order, second to
fourth respectively is Beach 4 with value 0,333,
Beach 2 with value 0,222 and Beach 1 with value
0,056.
4. CONCLUSION.
Based on the results of research conducted to
obtain the following conclusions:
1. In determining ideal landing beaches to
carry out amphibious operations in the coastal
waters of West Papua requires the ability of
analysis of the components to be used as the
Expert 1 Expert 2 Expert 3
Beach 1 4 3 2
Beach 2 3 2 4
Beach 3 2 1 3
Beach 4 1 4 1
Alternative PROMETHEE Ranking
Expert 1 Expert 2 Expert 3 Value 1 Value 2 Value 3
Beach 1 4 3 2 0 1 2
Beach 2 3 2 4 1 2 0
Beach 3 2 1 3 2 3 1
Beach 4 1 4 1 3 0 3
Alternative PROMETHEE Ranking Alternative Value
Beach 1 W₁ 1 18 0,056 4
Beach 2 W₂ 4 18 0,222 3
Beach 3 W₃ 7 18 0,389 1
Beach 4 W₄ 6 18 0,333 2
LevelAlternativeWeight
Code
Weight
Value (W)Ratio (R₁)
Value
(W/R₁)

20
main criterion of selection and alternative
landing coastal beaches that are multi-criteria.
This is important because the selection of the
right coastal location will determine the
success in the implementation of amphibious
operations, especially on the mastery of the
beach.
2. Needed a right decision-making
method to apply to this problem with reference
to group decision support system that is
integration between PROMETHEE and Borda
method, where in this research PROMETHEE
method is used to generate individual decision
from each decision maker while method Borda
serves to establish the results of group
decisions on an alternative landing beach to
be selected.
3. The result of analysis with
PROMETHEE method to determination of
alternative rank of landing beach in order to
know the result of individual decision from
each decision maker can be known that there
are different preference about alternative
appraisal on each decision maker. The result
of individual decision on decision maker 1
shows that alternative D (Beach 4) becomes
first rank with net value 0,458. In decision
maker 2, alternative C (Beach 3) was chosen
to be the first rank with net flow 0.208. As for
decision maker 3 produces alternative D
(Beach 4) in the first sequence with net flow
0.208.
4. From result of analysis with Borda
method can be known that Beach 3 with value
0,389 chosen as first order, while for second
to fourth is Beach 4, Beach 2 and Beach 1.
The result of this calculation is result of group
decision so Beach 3 is considered most
feasible for chosen to be the location of the
amphibious landing beach.
5. The integration between PROMETHEE
and Borda method is very suitable to solve the
problem of landing beach location selection in
amphibious operation, where the result of
PROMETHEE method can give input as
alternative preference value which can then
be processed in an integrated manner with
Borda method analysis according to each
process stage so that the result of the resulting
group decision is logical and objective.
2. 5. BIBLIOGRAPHY.
Behzadian, M., Kazemzadeh, R. B., Albadvi, A. &
Aghdasi, M., 2010. PROMETHEE: A comprehensive
literature review on methodologies and applications.
European Journal of Operation Research, Volume
200, pp. 198-215.
Brans, J. et al., 1998. Combining multicriteria
decision system aid with system dinamics for the
control of socio-economic processes. An iterative
real time procedure. European Journal of
Operational Research, Volume 109, pp. 428-441.
Brans, J. & Vincke, P., 1985. A Preference Ranking
Organization Method (The PROMETHEE Method for
Multiple Criteria Decision Making). Managenent
Science, June, Volume 31, No. 6, pp. 647-656.
Briggs, T., Kunsch, P. L. & Mareschal, B., 1990.
Nuclear waste management: An application of the
multicriteria PROMETHEE methods. European
Journal of Operation Research, Volume 44, pp. 1-10.
Brink, K. H., 2000. Oceanography and Mine
Warefare, Ocean Studies Board Commision on
Geoscience, Environment and Resource.
Washington, DC(USA): National Research Council.
Christian, A. V., Zhang, Y. & Salifou, C., 2016.
Application of PROMETHEE-GAIA Method in the
Entry Mode Selection Process in International

21
Market Expansion. Open Journal of Business and
Management, April, Volume 4, pp. 238-250.
Collins, J. M., 1998. Military Goegraphy for
Professional and Public. Washington, DC(USA):
National Defence University Press.
Costa, H. G., 2017. AHP-De Borda: Hybrid
Multicriteria Ranking Method. Brazilian Journal of
Operation and Production Management 14, pp. 281-
287.
da Rocha, P. M., de Barros, A. P., da Silva, G. B. &
Costa, H. G., 2016. Analysis of the operational
performance of brazilian airport terminals: A
multicriteria approach with De Borda-AHP
integration. Journal of Air Transport Management,
Volume 51, pp. 19-26.
Deshmukh, S., 2013. Preference Ranking
Organization Method of Enrichment Evaluation
(PROMETHEE). International Journal of
Engineering Science Invention, November, 2(11),
pp. 28-34.
Goumas, M. & Lygerou, V., 2000. An extension of
the PROMETHEE method for decision making in
fuzzy environment: Ranking of alternative energy
exploitation projects. European Journal of
Operational Research, Volume 123, pp. 606-613.
Halouani, N., Chabchoub, H. & Martel, J., 2009.
PROMETHEE-MD-2T method for project selection.
European Journal of Operation Research, Volume
195, pp. 841-849.
Headquarter, E. F. C. o. T. I. N., 2017. Fleet
Command III Development in West Papua to Make
Preventive Power for Keep Security Stabilitation on
The Eastern of Indonesian Ocean. s.l.:Headquarter,
Eastern Fleet Command of The Indonesian Navy;.
Headquarter, I. A. F., 2013. The Indonesian Armed
Forces Doctrine about Amphibious Operations.
Jakarta: Indonesian Armed Forces Headquarter.
Ishida, R., 2017. Borda Count Method for Fiscal
Policy. Policy Research Institute Discussioan Paper
Series, pp. 17A-07.
Korhonen, P., Moskowitz, H. & Wallenius, J., 1992.
Multiple criteria decision support-A review. European
Journal of Operational Research, Volume 63, pp.
361-375.
Macharis, C., Springael, J., Brucker, K. D. &
Verbeke, A., 2004. PROMETHEE and AHP: The
design of operational synergies in multicriteria
analysis. Strengthening PROMETHEE with ideas of
AHP. European Journal of Operational Research,
Volume 153, pp. 307-317.
Manzini, R. & Pareschi, A., 2012. A Decision-
Support System for the Car Pooling Problem.
Journal of Transportation Technologies, April,
Volume 2, pp. 85-101.
Martin, J., Fajardo, W., Blanco, A. & Requena, I.,
2003. Constructing Linguistic Versions for the
Multicriteria Decision Suport System Preference
Ranking Organization of Enrichment Evaluation.
International Journal of Intelligent Systems, Volume
18, pp. 711-731.
Martin, J. M., Fajardo, W., Blanco, A. & Requena, I.,
2003. Constructing Linguistic Versions for the
Multicriteria Decision Support System Preference
Organization Method for Enrichment Evaluation.
International Journal of Intelligent Systems, Volume
18, pp. 711-731.

22
Mohajan, H. K., 2012. Majority Judgement in an
Election with Borda Majority Count. International
Journal of Management and Transformation, pp.
6(1) 19-31.
Mohajan, H. K., 2013. Majority Judgment in an
Election with Borda Majority Count. International
Journal of Management and Transformation, 22
October, Volume 6 No. 1, pp. 19-31.
Putra, I. N., Hakim, A., Pramono, S. & Leksono, A.,
2017. The Effect of Strategic Environment Change
toward Indonesia Maritime Security: Threat and
Opportunity. International Journal of Applied
Engineering Research , Volume 12, pp. 6037-6044.
Rao, R. V. & Rajesh, T. S., 2009. Software Selection
in Manufacturing Industries Using a Fuzzy Multiple
Criteria Decision Making Method, PROMETHEE.
Intelligent Information Management, December,
Volume 1, pp. 159-165.
Ronyastra, I. M., Gunarta, I. K. & Ciptomulyono, U.,
2015. A multi criteria decision analysis for
reinvestment action portfolio selection problem in an
Indonesian real estate company. Industrial
Engineering and Service Science (IESS), Volume 4,
pp. 558-567.
Saediman, H., 2015. Prioritizing Commodities in
Southeast Sulawesi Province of Indonesia Using
AHP Based Borda Count Method. Asian Social
Science, Volume 11 No. 15, pp. 171-179.
Staff, J. C. o., 2014. Amphibious Operations. USA:
Join Publication 3-02 July,18,2014.
Turcksin, L., Bernardini, A. & Macharis, C., 2011. A
combined AHP-PROMETHEE approach for
selecting the most appropriate policy scenario to
stimulate a clean vehicle fleet. Procedia Social and
Behavioral Sciences, Volume 20, pp. 954-965.
Vega, D. M., Jimenez, M. T. L., Suarez, A. R. &
Lozano, J. M. S., 2013. Applying Pareto meta-
analysis in location selection for photovoltaic plant.
Eureka-2013. Fourth International Workshop
Proceedings, pp. 218-224.
Vega, D. M., Jimenez, M. T. L., Suarez, A. R. &
Lozano, J. M. S., 2013. Applying Pareto meta-
analysis in location selection for photovoltaic plant.
Eureka-2013.Fourth International Workshop
Proceedings, pp. 218-224.
Velasquez, M. & Hester, P. T., 2013. An Analysis of
Multi-Criteria Decision Making Methods. Volume 10
No.2, pp. 56-66.
Velazques, M. & Hestler, P. T., 2013. An Analysis of
Multi-Criteria Decision Making Methods. Volume 10,
pp. 56-66.