Embed Size (px)
Citation preview
Hindawi Publishing CorporationMathematical Problems in EngineeringVolume 2012, Article ID 352749, 12 pagesdoi:10.1155/2012/352749
Research ArticleApplication of Extension Neural Network Type-1 toFault Diagnosis of Electronic Circuits
Meng-Hui Wang
Department of Electrical Engineering, National Chin-Yi University of Technology, No. 35, Lane 215,Section 1, Chung-Shan Road, Taichung County, Taiping City 411, Taiwan
Correspondence should be addressed to Meng-Hui Wang, [email protected]
Received 31 January 2012; Revised 9 March 2012; Accepted 19 March 2012
Academic Editor: Wudhichai Assawinchaichote
Copyright q 2012 Meng-Hui Wang. This is an open access article distributed under the CreativeCommons Attribution License, which permits unrestricted use, distribution, and reproduction inany medium, provided the original work is properly cited.
The values of electronic components are always deviated, but the functions of the modern circuitsare more and more precise, which makes the automatic fault diagnosis of analog circuits verycomplex and difficult. This paper presents an extension-neural-network-type-1-(ENN-1-) basedmethod for fault diagnosis of analog circuits. This proposed method combines the extensiontheory and neural networks to create a novel neural network. Using the matter-element models offault types and a correlation function, can be calculated the correlation degree between the testedpattern and every fault type; then, the cause of the circuit malfunction can be directly diagnosed bythe analysis of the correlation degree. The experimental results show that the proposedmethod hasa high diagnostic accuracy and is more fault tolerant than the multilayer neural network (MNN)and the k-means based methods.
1. Introduction
In the real situation, there are certain errors in the electronic components. For example, thelast color ring of electronic resistance is used to specify the range of errors. Therefore, everycomponent would have errors when they are produced by the factory. This would resultthe shift of the circuit. As long as the errors are still in the acceptable range, the circuit isstill normal. But when the value of the component is out of the error range, there would befaults. Therefore, the faults of circuit include two types: hard fault and soft fault [1]. Generallyspeaking, hard fault happens when the circuit is burned and cannot be operated, while softfault happens when the value of the circuit is out of the acceptable range but can still work.The result of output is wrong and may destroy the output of the circuit. Compared with hardfault, soft fault is harder to detect [2, 3]. The value of the component which shifts less than5% is normal and acceptable in the range of errors. The value of the component shifting from
2 Mathematical Problems in Engineering
5% to 50% is called soft fault [4]. As for the hard faults, they can result in short learning timethat makes the circuit unable to work normally.
Recently, many papers contribute to lots of ways to diagnose faults, such ashierarchical fault diagnosis [5], neural networks [6], grey relation diagnosis [7], and fuzzytheory [8]. Hence, this paper proposed a new method using the extension neural networkand develops a fault diagnosis scheme for soft fault of analog circuit. The proposed methodcan classify the fault types, and it calculates the correlation degree between characteristicsand fault types. The ENN-1 has been proposed in my recent paper [9, 10] it uses an extensiondistance instead of using the Euclidean distance (ED) to measure the similarity betweentested data and cluster domain. It can quickly and stably learn to categorize input patternsand permit adaptive process to significant new information. Moreover, the ENN-1 has shorterlearning times and simpler structure than traditional neural networks. The proposed methodhas been tested on a practical analog circuit and compared with the multilayer-neural-network-(MNN-) based methods and k-means classification method. The application of thisnew method to some testing cases has given promising results.
2. Extension Neural Network Type-1
The extension neural network type-1 (ENN-1) introduced by this author is a new patternclassification system based on concepts from extension theory and neural networks. ENN-1permits that clustering problems have a range of features, supervised learning, continuousinput, and discrete output. This new neural network is the first combination of extension settheory and neural network. The extension theory provides a novel distance measurement forclassification, and the neural network can embed the salient features of parallel computationpower and learning capability. The ENN-1 is a relatively new neural network model and hasbeen shown to be successful as a classifier using the well-known Iris dataset and the morecomplex problems [9, 10].
2.1. Structure of the ENN-1
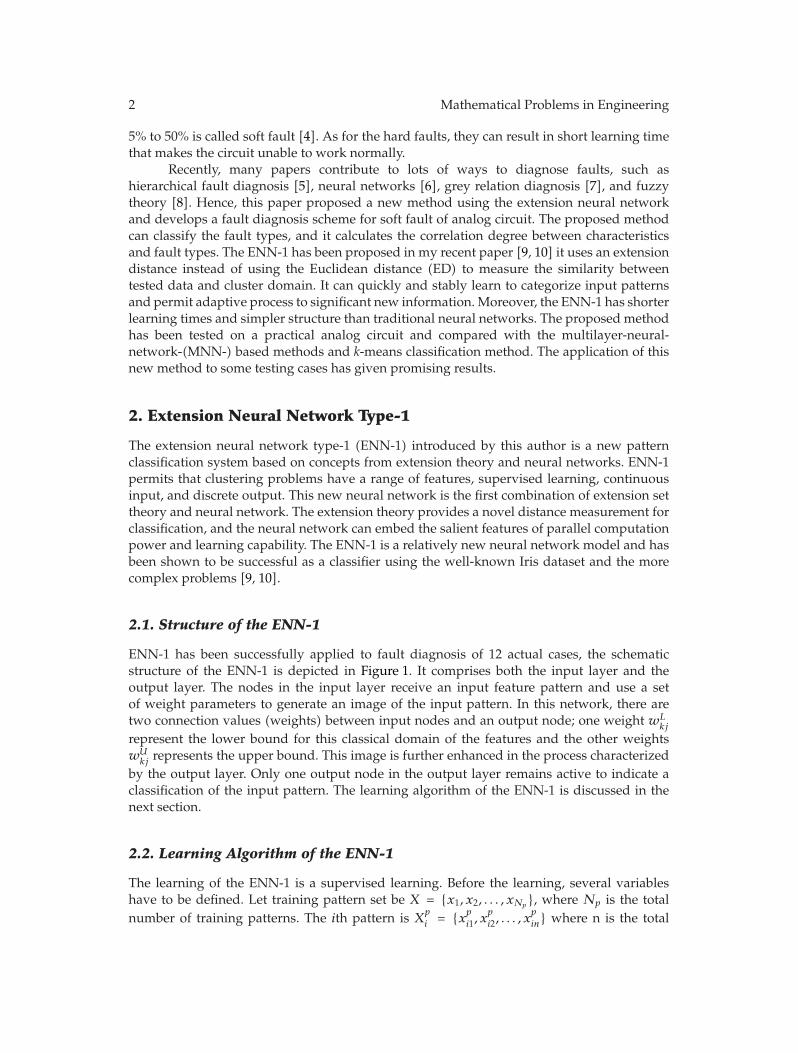
ENN-1 has been successfully applied to fault diagnosis of 12 actual cases, the schematicstructure of the ENN-1 is depicted in Figure 1. It comprises both the input layer and theoutput layer. The nodes in the input layer receive an input feature pattern and use a setof weight parameters to generate an image of the input pattern. In this network, there aretwo connection values (weights) between input nodes and an output node; one weight wL
kj
represent the lower bound for this classical domain of the features and the other weightswU
kj represents the upper bound. This image is further enhanced in the process characterizedby the output layer. Only one output node in the output layer remains active to indicate aclassification of the input pattern. The learning algorithm of the ENN-1 is discussed in thenext section.
2.2. Learning Algorithm of the ENN-1
The learning of the ENN-1 is a supervised learning. Before the learning, several variableshave to be defined. Let training pattern set be X = {x1, x2, . . . , xNp}, where Np is the totalnumber of training patterns. The ith pattern is X
p
i = {xp
i1, xp
i2, . . . , xp
in} where n is the total
Mathematical Problems in Engineering 3
Output layer
Input layer
nck
j n
Oik Oinc
xij xin
wL11
wU11
wLkj
wUkj
1
Oi1
xi1
· · · · · ·
· · ·· · ·1
Figure 1: The structure of extension neural network (ENN-1).
number of the feature of patterns and the category of the ith pattern is p. To evaluate theclustering performance, the total error number is set as Nm, and the total error rate ET isdefined below:
ET =Nm
Np. (2.1)
The detailed supervised learning algorithm can be described as follows.
Step 1. Set the connection weights between input nodes and output nodes according to therange of classical domains. The range of classical domains can be directly obtained fromprevious experience or determined from training data as follows:
wUkj = Max
i∈NP
{xkij
},
wLkj = Min
i∈NP
{xkij
} for i = 1, 2, . . . ,Np; j = 1, 2, . . . , n; k = 1, 2, . . . , nc. (2.2)
Step 2. Calculate the weights of each feature median:
Zk = {zk1, zk2, . . . , zkn},
Zkj =
(wL
kj +wUkj
)
2,
for k = 1, 2, . . . , nc, j = 1, 2, . . . , n. (2.3)
Step 3. Read the ith training pattern and its cluster number p:
Xp
i ={xp
i1, xp
i2, . . . , xp
in
}, p ∈ nc. (2.4)
4 Mathematical Problems in Engineering
1
0
wL zx
wU
ED
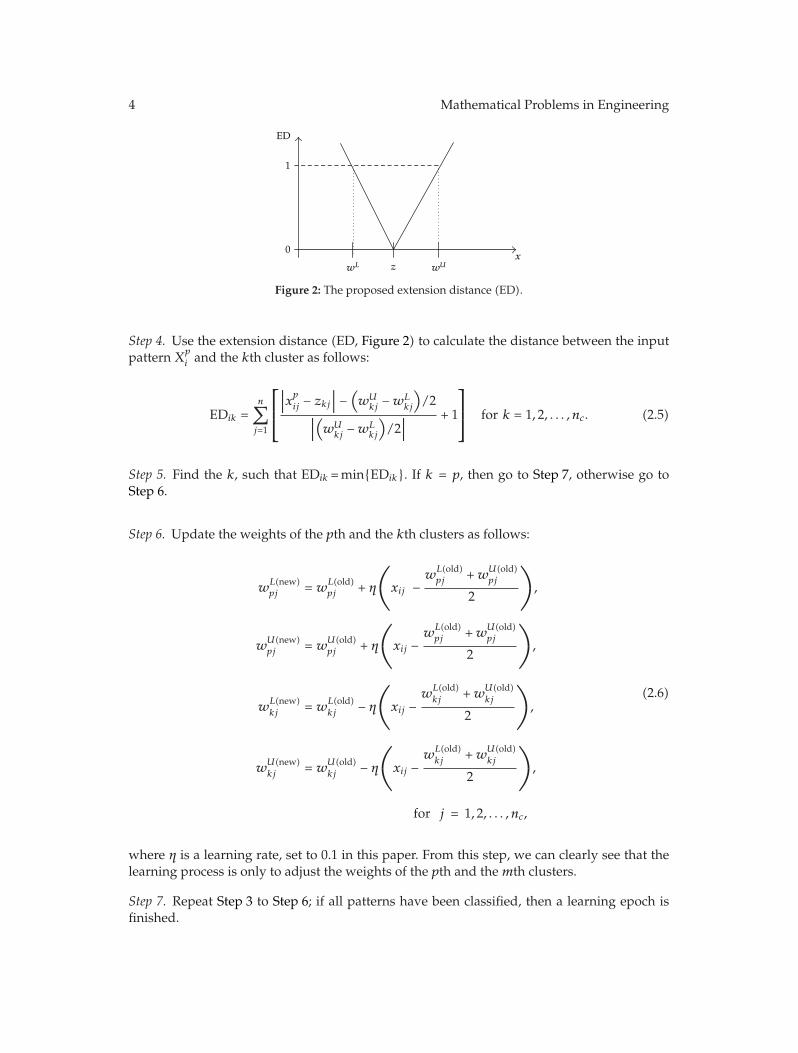
Figure 2: The proposed extension distance (ED).
Step 4. Use the extension distance (ED, Figure 2) to calculate the distance between the inputpattern X
p
i and the kth cluster as follows:
EDik =n∑j=1
⎡⎢⎣
∣∣∣xp
ij − zkj∣∣∣ −
(wU
kj −wLkj
)/2
∣∣∣(wU
kj−wL
kj
)/2
∣∣∣+ 1
⎤⎥⎦ for k = 1, 2, . . . , nc. (2.5)
Step 5. Find the k, such that EDik =min{EDik}. If k = p, then go to Step 7, otherwise go toStep 6.
Step 6. Update the weights of the pth and the kth clusters as follows:
wL(new)pj = w
L(old)pj + η
⎛⎝xij −
wL(old)pj +w
U(old)pj
2
⎞⎠,
wU(new)pj = w
U(old)pj + η
⎛⎝xij −
wL(old)pj +w
U(old)pj
2
⎞⎠,
wL(new)kj
= wL(old)kj
− η
⎛⎝xij −
wL(old)kj +w
U(old)kj
2
⎞⎠,
wU(new)kj
= wU(old)kj
− η
⎛⎝xij −
wL(old)kj
+wU(old)kj
2
⎞⎠,
for j = 1, 2, . . . , nc,
(2.6)
where η is a learning rate, set to 0.1 in this paper. From this step, we can clearly see that thelearning process is only to adjust the weights of the pth and themth clusters.
Step 7. Repeat Step 3 to Step 6; if all patterns have been classified, then a learning epoch isfinished.
Mathematical Problems in Engineering 5
1 2
15 V
−+• •
R1
R2
R3 R4
C1 C2
V 1
−15 V
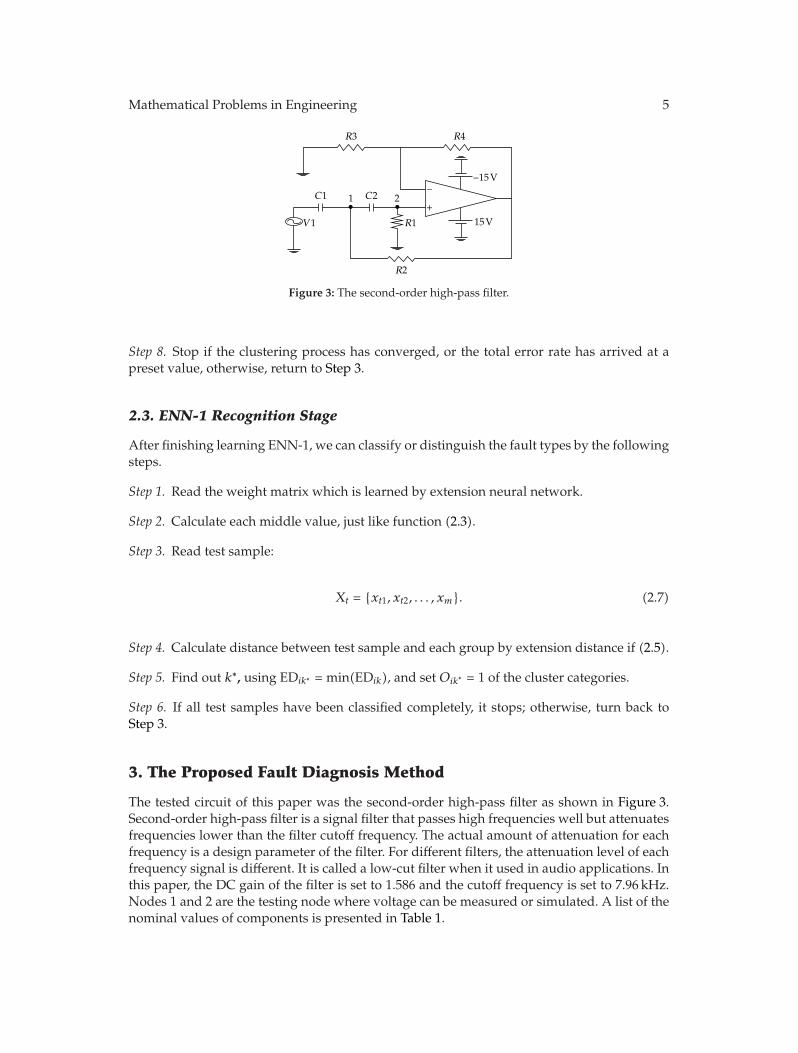
Figure 3: The second-order high-pass filter.
Step 8. Stop if the clustering process has converged, or the total error rate has arrived at apreset value, otherwise, return to Step 3.
2.3. ENN-1 Recognition Stage
After finishing learning ENN-1, we can classify or distinguish the fault types by the followingsteps.
Step 1. Read the weight matrix which is learned by extension neural network.
Step 2. Calculate each middle value, just like function (2.3).
Step 3. Read test sample:
Xt = {xt1, xt2, . . . , xm}. (2.7)
Step 4. Calculate distance between test sample and each group by extension distance if (2.5).
Step 5. Find out k∗, using EDik∗ = min(EDik), and set Oik∗ = 1 of the cluster categories.
Step 6. If all test samples have been classified completely, it stops; otherwise, turn back toStep 3.
3. The Proposed Fault Diagnosis Method
The tested circuit of this paper was the second-order high-pass filter as shown in Figure 3.Second-order high-pass filter is a signal filter that passes high frequencies well but attenuatesfrequencies lower than the filter cutoff frequency. The actual amount of attenuation for eachfrequency is a design parameter of the filter. For different filters, the attenuation level of eachfrequency signal is different. It is called a low-cut filter when it used in audio applications. Inthis paper, the DC gain of the filter is set to 1.586 and the cutoff frequency is set to 7.96 kHz.Nodes 1 and 2 are the testing node where voltage can be measured or simulated. A list of thenominal values of components is presented in Table 1.
6 Mathematical Problems in Engineering
Table 1: The nominal value of high-pass filter.
Components Nominal values
R1 1 kΩR2 1 kΩR3 1 kΩR4 586ΩC1 20 nFC2 20 nF
Table 2: The tolerance ranges of normal and soft faults for the circuit components.
Components Nominal values Variables ±5% normal Variables ±20% soft faults
R1 1 kΩ 1.05 kΩ0.95 kΩ
1.2 kΩ0.8 kΩ
R2 1 kΩ 1.05 kΩ0.95 kΩ
1.2 kΩ0.8 kΩ
R3 1 kΩ 1.05 kΩ0.95 kΩ
1.2 kΩ0.8 kΩ
R4 586Ω 615.3Ω556.7Ω
703.2Ω468.8Ω
C1 20 nF 21 nF19 nF
24 nF16 nF
C2 20 nF 21 nF19 nF
24 nF16 nF
3.1. The Various Situations of Analog Circuits
The circuit under test was simulated both at normal and all faulty conditions by using PSPICEsoftware; the tolerance normal rangewas selectedwith deviation of about ±5% of the nominalvalues, and soft fault was deviation of about ±20%. By analyzing sensitivity of the circuitunder test, R1, R2, R3, R4, C1, and C2 are selected to be the fault components; the preselectedset of single faults of the test circuit are presented in Table 2.
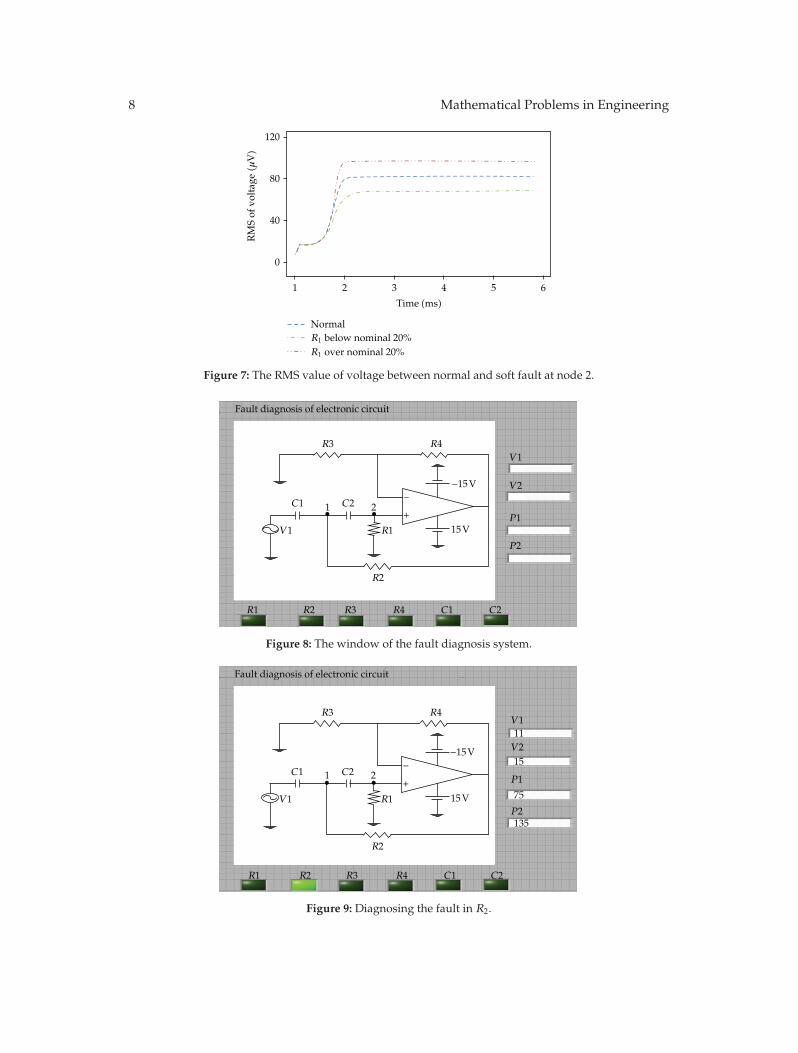
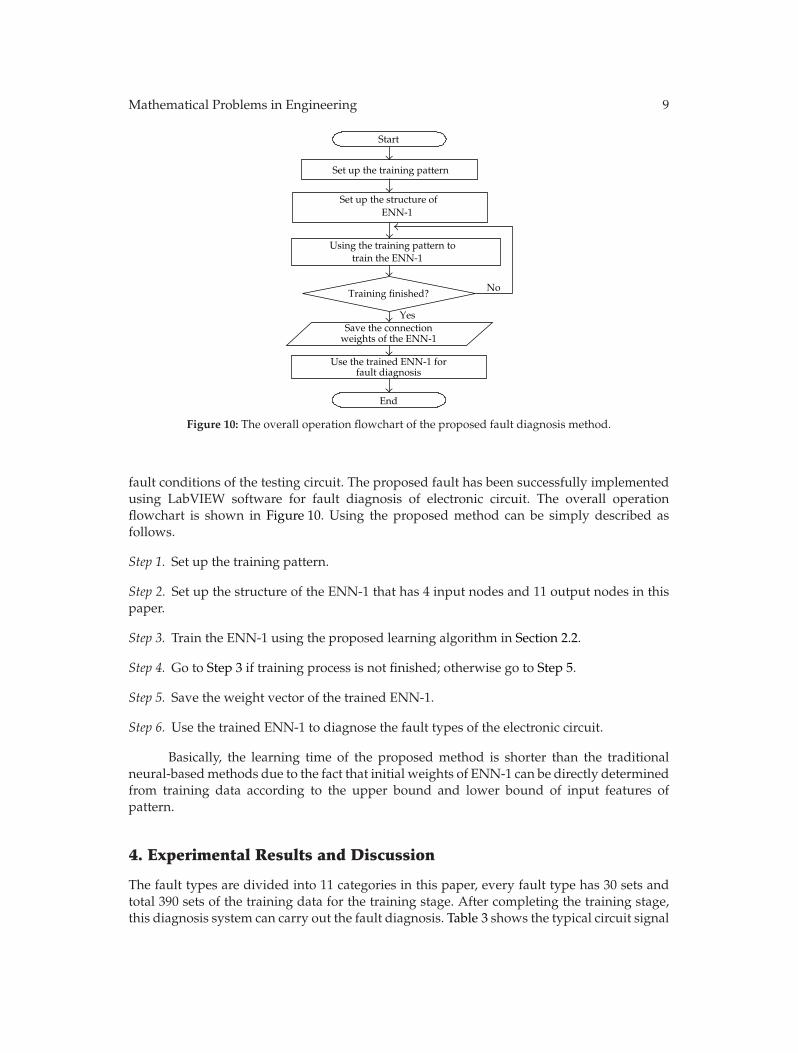
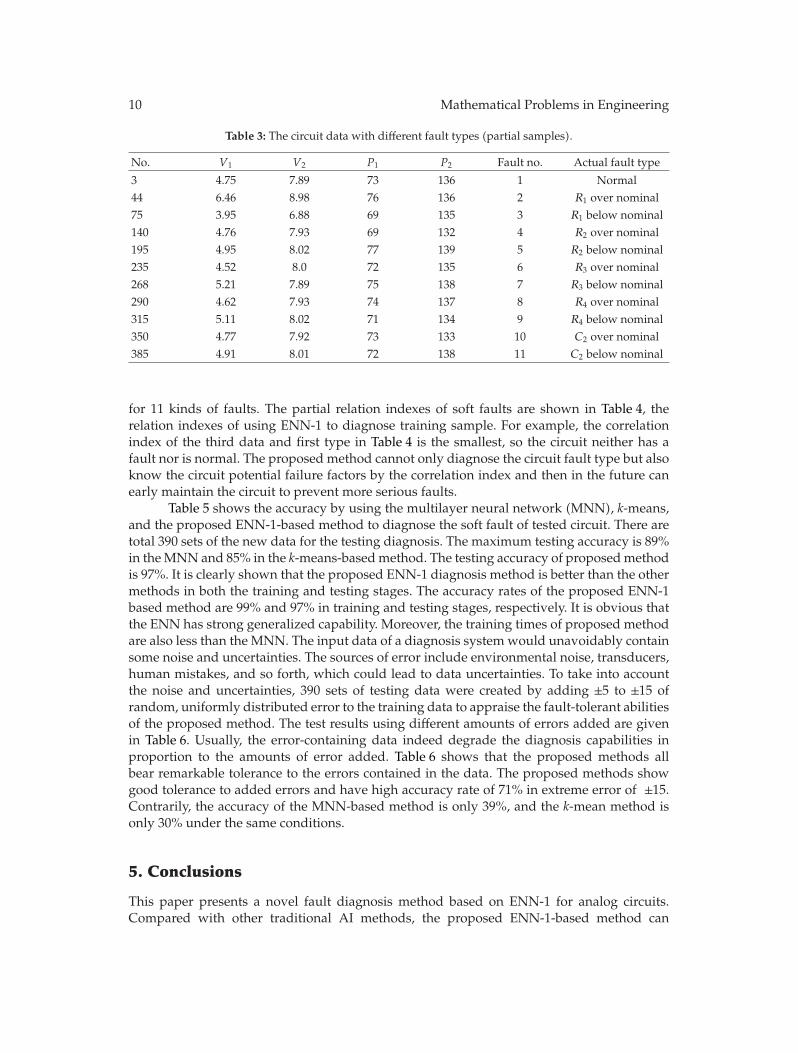
The measurement point in the study is node 1 and node 2 which are transient voltageand phase spectrum as four test signals and simulate normal and various fault condition.Figures 4, 5, 6 and 7 show the RMS value of transient voltage and phase spectrum by R1 asthe fault components to simulate the correct and soft fault on the node 1 and node 2. Usingthe Monte-Carlo needle produces 30 training sets for each fault type in training phase; inaddition, every fault type can build 11 matter element models. Figure 8 in this paper designsa user interface of fault diagnosis for this analog circuit by the LabVIEW, and Figure 9 showsa diagnostic fault in R2 and also shows in the fault-displayed window a twinkling green lightto alert user to in which the circuit element fault was happening.
3.2. ENN1-Based Fault Diagnosis Method
If the circuit components have fault, that can cause the function to change in a circuit. In thisstudy, the circuit faults can be divided into 11 types (1 for normal, 10 for the soft fault), andusing PSPICE software simulates various faults, and then we used the ENN-1 to diagnose the
Mathematical Problems in Engineering 7
1 2
Normal
0
−50
−100
3 4 5 6
Frequency (kHz)
Phas
e an
gle(d
eg.)
R1 below nominal 20%R1 over nominal 20%
Figure 4: The phase spectrum between normal and soft fault at node 1.
1 2 3 4 5 6
Frequency (kHz)
Phas
e an
gle(d
eg.)
0
−40
−80
−120
NormalR1 below nominal 20%R1 over nominal 20%
Figure 5: The phase spectrum between normal and soft fault at node 2.
1 2 3 4 5 6
Normal
Time (ms)
80
40
0
RM
S of
vol
tage
(µV)
R1 below nominal 20%R1 over nominal 20%
Figure 6: The RMS value of voltage between normal and soft fault at node 1.
8 Mathematical Problems in Engineering
120
80
40
0
1 2 3 4 5 6
Time (ms)
Normal
RM
S of
vol
tage
(µV)
R1 below nominal 20%R1 over nominal 20%
Figure 7: The RMS value of voltage between normal and soft fault at node 2.
Fault diagnosis of electronic circuit
1 2
15 V
−+• •
R1
R2
R3 R4
C1 C2
V 1
R1 R2 R3 R4 C1 C2
V 1
V 2
P1
P2
−15 V
Figure 8: The window of the fault diagnosis system.
1 2
15 V
−+• •
R1
R2
R3 R4
C1 C2
V 1
11
15
75
135
Fault diagnosis of electronic circuit
R1 R2 R3 R4 C1 C2
V 1
V 2
P1
P2
−15 V
Figure 9: Diagnosing the fault in R2.
Mathematical Problems in Engineering 9
Start
Set up the structure ofENN-1
Using the training pattern totrain the ENN-1
No
Yes
Training finished?
Save the connectionweights of the ENN-1
Use the trained ENN-1 forfault diagnosis
End
Set up the training pattern
Figure 10: The overall operation flowchart of the proposed fault diagnosis method.
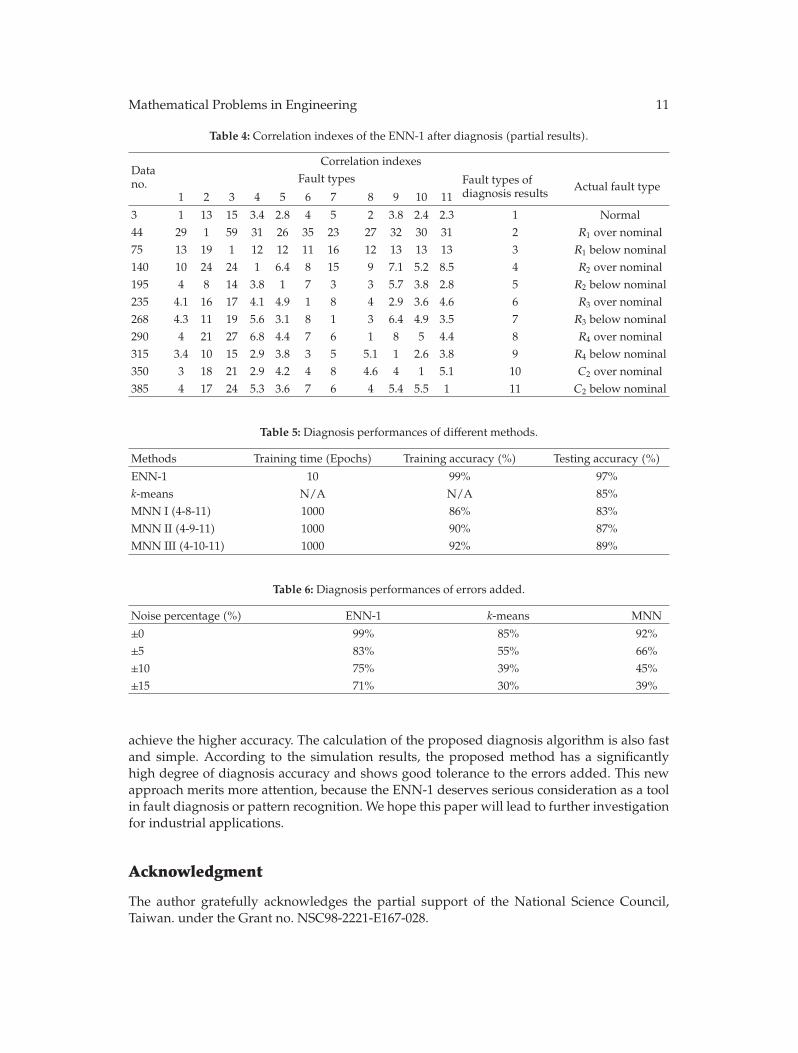
fault conditions of the testing circuit. The proposed fault has been successfully implementedusing LabVIEW software for fault diagnosis of electronic circuit. The overall operationflowchart is shown in Figure 10. Using the proposed method can be simply described asfollows.
Step 1. Set up the training pattern.
Step 2. Set up the structure of the ENN-1 that has 4 input nodes and 11 output nodes in thispaper.
Step 3. Train the ENN-1 using the proposed learning algorithm in Section 2.2.
Step 4. Go to Step 3 if training process is not finished; otherwise go to Step 5.
Step 5. Save the weight vector of the trained ENN-1.
Step 6. Use the trained ENN-1 to diagnose the fault types of the electronic circuit.
Basically, the learning time of the proposed method is shorter than the traditionalneural-basedmethods due to the fact that initial weights of ENN-1 can be directly determinedfrom training data according to the upper bound and lower bound of input features ofpattern.
4. Experimental Results and Discussion
The fault types are divided into 11 categories in this paper, every fault type has 30 sets andtotal 390 sets of the training data for the training stage. After completing the training stage,this diagnosis system can carry out the fault diagnosis. Table 3 shows the typical circuit signal
10 Mathematical Problems in Engineering
Table 3: The circuit data with different fault types (partial samples).
No. V1 V2 P1 P2 Fault no. Actual fault type
3 4.75 7.89 73 136 1 Normal44 6.46 8.98 76 136 2 R1 over nominal75 3.95 6.88 69 135 3 R1 below nominal140 4.76 7.93 69 132 4 R2 over nominal195 4.95 8.02 77 139 5 R2 below nominal235 4.52 8.0 72 135 6 R3 over nominal268 5.21 7.89 75 138 7 R3 below nominal290 4.62 7.93 74 137 8 R4 over nominal315 5.11 8.02 71 134 9 R4 below nominal350 4.77 7.92 73 133 10 C2 over nominal385 4.91 8.01 72 138 11 C2 below nominal
for 11 kinds of faults. The partial relation indexes of soft faults are shown in Table 4, therelation indexes of using ENN-1 to diagnose training sample. For example, the correlationindex of the third data and first type in Table 4 is the smallest, so the circuit neither has afault nor is normal. The proposed method cannot only diagnose the circuit fault type but alsoknow the circuit potential failure factors by the correlation index and then in the future canearly maintain the circuit to prevent more serious faults.
Table 5 shows the accuracy by using the multilayer neural network (MNN), k-means,and the proposed ENN-1-based method to diagnose the soft fault of tested circuit. There aretotal 390 sets of the new data for the testing diagnosis. The maximum testing accuracy is 89%in theMNN and 85% in the k-means-basedmethod. The testing accuracy of proposedmethodis 97%. It is clearly shown that the proposed ENN-1 diagnosis method is better than the othermethods in both the training and testing stages. The accuracy rates of the proposed ENN-1based method are 99% and 97% in training and testing stages, respectively. It is obvious thatthe ENN has strong generalized capability. Moreover, the training times of proposed methodare also less than the MNN. The input data of a diagnosis system would unavoidably containsome noise and uncertainties. The sources of error include environmental noise, transducers,human mistakes, and so forth, which could lead to data uncertainties. To take into accountthe noise and uncertainties, 390 sets of testing data were created by adding ±5 to ±15 ofrandom, uniformly distributed error to the training data to appraise the fault-tolerant abilitiesof the proposed method. The test results using different amounts of errors added are givenin Table 6. Usually, the error-containing data indeed degrade the diagnosis capabilities inproportion to the amounts of error added. Table 6 shows that the proposed methods allbear remarkable tolerance to the errors contained in the data. The proposed methods showgood tolerance to added errors and have high accuracy rate of 71% in extreme error of ±15.Contrarily, the accuracy of the MNN-based method is only 39%, and the k-mean method isonly 30% under the same conditions.
5. Conclusions
This paper presents a novel fault diagnosis method based on ENN-1 for analog circuits.Compared with other traditional AI methods, the proposed ENN-1-based method can
Mathematical Problems in Engineering 11
Table 4: Correlation indexes of the ENN-1 after diagnosis (partial results).
Datano.
Correlation indexesFault types Fault types of
diagnosis results Actual fault type1 2 3 4 5 6 7 8 9 10 11
3 1 13 15 3.4 2.8 4 5 2 3.8 2.4 2.3 1 Normal44 29 1 59 31 26 35 23 27 32 30 31 2 R1 over nominal75 13 19 1 12 12 11 16 12 13 13 13 3 R1 below nominal140 10 24 24 1 6.4 8 15 9 7.1 5.2 8.5 4 R2 over nominal195 4 8 14 3.8 1 7 3 3 5.7 3.8 2.8 5 R2 below nominal235 4.1 16 17 4.1 4.9 1 8 4 2.9 3.6 4.6 6 R3 over nominal268 4.3 11 19 5.6 3.1 8 1 3 6.4 4.9 3.5 7 R3 below nominal290 4 21 27 6.8 4.4 7 6 1 8 5 4.4 8 R4 over nominal315 3.4 10 15 2.9 3.8 3 5 5.1 1 2.6 3.8 9 R4 below nominal350 3 18 21 2.9 4.2 4 8 4.6 4 1 5.1 10 C2 over nominal385 4 17 24 5.3 3.6 7 6 4 5.4 5.5 1 11 C2 below nominal
Table 5: Diagnosis performances of different methods.
Methods Training time (Epochs) Training accuracy (%) Testing accuracy (%)
ENN-1 10 99% 97%k-means N/A N/A 85%MNN I (4-8-11) 1000 86% 83%MNN II (4-9-11) 1000 90% 87%MNN III (4-10-11) 1000 92% 89%
Table 6: Diagnosis performances of errors added.
Noise percentage (%) ENN-1 k-means MNN
±0 99% 85% 92%±5 83% 55% 66%±10 75% 39% 45%±15 71% 30% 39%
achieve the higher accuracy. The calculation of the proposed diagnosis algorithm is also fastand simple. According to the simulation results, the proposed method has a significantlyhigh degree of diagnosis accuracy and shows good tolerance to the errors added. This newapproach merits more attention, because the ENN-1 deserves serious consideration as a toolin fault diagnosis or pattern recognition. We hope this paper will lead to further investigationfor industrial applications.
Acknowledgment
The author gratefully acknowledges the partial support of the National Science Council,Taiwan. under the Grant no. NSC98-2221-E167-028.
12 Mathematical Problems in Engineering
References
[1] S. Yongkui, C. Guangju, and L. Hui, “Analog circuits fault diagnosis using support vector machine,”in Proceedings of the International Conference on Communications, Circuits and Systems (ICCCAS ’07), pp.1003–1006, July 2007.
[2] M. Slamani and B. Kaminska, “Fault observability analysis of analog circuits in frequency domain,”IEEE Transactions on Circuits and Systems Part II, vol. 43, no. 2, pp. 134–139, 1996.
[3] Z. You, E. Sanchez-Sinencio, and J. Pineda de Gyvez, “Analog system-level fault diagnosis based ona symbolic method in the frequency domain,” IEEE Transactions on Instrumentation and Measurement,vol. 44, no. 1, pp. 28–35, 1995.
[4] M. Catelani and A. Fort, “Soft fault detection and isolation in analog circuits: some results and acomparison between a fuzzy approach and radial basis function networks,” IEEE Transactions onInstrumentation and Measurement, vol. 51, no. 2, pp. 196–202, 2002.
[5] C. K. Ho, P. R. Shepherd, F. Eberhardt, and W. Tenten, “Hierarchical fault diagnosis of analogintegrated circuits,” IEEE Transactions on Circuits and Systems. I, vol. 48, no. 8, pp. 921–929, 2001.
[6] L. Yuan, Y. He, J. Huang, and Y. Sun, “A new neural-network-based fault diagnosis approach foranalog circuits by using kurtosis and entropy as a preprocessor,” IEEE Transactions on Instrumentationand Measurement, vol. 59, no. 3, pp. 586–595, 2010.
[7] M. H. Zhang, S. J. Lv, D. H. Wang, Y. X. Song, and H. Liu, “Research on fault diagnosis methods withgrey relation analysis,” in Proceedings of the IEEE International Conference on Grey Systems and IntelligentServices (GSIS ’09), pp. 72–75, November 2009.
[8] M. Catelani, A. Fort, and C. Alippi, “A fuzzy approach for soft fault detection in analog circuits,”Measurement, vol. 32, no. 1, pp. 73–83, 2002.
[9] M. H. Wang and C. P. Hung, “Extension neural network and its applications,” Neural Networks, vol.16, no. 5-6, pp. 779–784, 2003.
[10] M. H. Wang and C. P. Hung, “Extension neural network,” in Proceedings of the International JointConference on Neural Networks, vol. 1, pp. 399–403, July 2003.

Submit your manuscripts athttp://www.hindawi.com
Hindawi Publishing Corporationhttp://www.hindawi.com Volume 2014
MathematicsJournal of
Hindawi Publishing Corporationhttp://www.hindawi.com Volume 2014
Mathematical Problems in Engineering
Hindawi Publishing Corporationhttp://www.hindawi.com
Differential EquationsInternational Journal of
Volume 2014
Applied MathematicsJournal of
Hindawi Publishing Corporationhttp://www.hindawi.com Volume 2014
Probability and StatisticsHindawi Publishing Corporationhttp://www.hindawi.com Volume 2014
Journal of
Hindawi Publishing Corporationhttp://www.hindawi.com Volume 2014
Mathematical PhysicsAdvances in
Complex AnalysisJournal of
Hindawi Publishing Corporationhttp://www.hindawi.com Volume 2014
OptimizationJournal of
Hindawi Publishing Corporationhttp://www.hindawi.com Volume 2014
CombinatoricsHindawi Publishing Corporationhttp://www.hindawi.com Volume 2014
International Journal of
Hindawi Publishing Corporationhttp://www.hindawi.com Volume 2014
Operations ResearchAdvances in
Journal of
Hindawi Publishing Corporationhttp://www.hindawi.com Volume 2014
Function Spaces
Abstract and Applied AnalysisHindawi Publishing Corporationhttp://www.hindawi.com Volume 2014
International Journal of Mathematics and Mathematical Sciences
Hindawi Publishing Corporationhttp://www.hindawi.com Volume 2014
The Scientific World JournalHindawi Publishing Corporation http://www.hindawi.com Volume 2014
Hindawi Publishing Corporationhttp://www.hindawi.com Volume 2014
Algebra
Discrete Dynamics in Nature and Society
Hindawi Publishing Corporationhttp://www.hindawi.com Volume 2014
Hindawi Publishing Corporationhttp://www.hindawi.com Volume 2014
Decision SciencesAdvances in
Discrete MathematicsJournal of
Hindawi Publishing Corporationhttp://www.hindawi.com
Volume 2014
Hindawi Publishing Corporationhttp://www.hindawi.com Volume 2014
Stochastic AnalysisInternational Journal of