Embed Size (px)
Citation preview
APPLICATION OF FACTS DEVICES FOR POWER SYSTEM
TRANSIENT STABILITY ENHANCEMENT
JOEL RUTTO SUTTER
MASTER OF SCIENCE
(Electrical and Electronic Engineering)
JOMO KENYATTA UNIVERSITY OF
AGRICULTURE AND TECHNOLOGY
2016
Application of FACTS Devices for Power System Transient Stability
Enhancement
Joel Rutto Sutter
A Thesis submitted in Partial Fulfillment for the Degree of Master
of Science in Electrical and Electronic Engineering in the Jomo
Kenyatta University of Agriculture and Technology
2016

ii
DECLARATION
This thesis is my original work and it has not been submitted for degree to any other
University.
Signature.........................................................................Date........................................
Joel Rutto Sutter
This thesis has been submitted for examination with our approval as the Supervisors:
Signature…………………………………….………..Date………………..………
Prof. John N. Nderu
JKUAT, Kenya.
Signature……………………………………………..Date………………………
Dr. Christopher M. Muriithi
TUK, Kenya.

iii
DEDICATION
I dedicate this work to my daughter Stacie Sutter to whom my dreams live.

iv
ACKNOWLEDGEMENTS
I would like to thank Almighty God for giving me the strength, courage and the
ability to complete this research. I would also wish to appreciate my supervisors
Prof. John Nderu and Dr. Christopher Muriithi for their invaluable support, advice,
help and time. I would like to thank Geothermal Development Company for
approving this master’s course.
I would like to thank Jomo Kenyatta University of Agriculture and Technology
School of Electrical, Electronic and Information Engineering staff and colleagues for
informative discussions and input accorded to me.
Finally, I would like to extend my deepest gratitude to those closest to me; my wife
Jepkemoi Sutter and Mum, Teresia Kimoi Sutter. Many thanks for their inestimable
support.

v
TABLE OF CONTENTS
DECLARATION ....................................................................................................................... ii
DEDICATION .......................................................................................................................... iii
ACKNOWLEDGEMENTS .................................................................................................... iv
TABLE OF CONTENTS ........................................................................................................ iv
LIST OF TABLES ................................................................................................................. viii
LIST OF FIGURES .................................................................................................................. ix
LIST OF APPENDICES ......................................................................................................... xi
LIST OF ABBREVIATIONS AND ACRONYMS.......................................................... xii
ABSTRACT .............................................................................................................................. xiv
CHAPTER ONE......................................................................................................................... 1
INTRODUCTION...................................................................................................................... 1
1.1 Background ........................................................................................................ 1
1.2 Problem statement .............................................................................................. 2
1.3 Justification of the study .................................................................................... 3
1.4 Objectives ........................................................................................................... 4
1.4.1 General objective ............................................................................................ 4
1.4.2 Specific objectives .......................................................................................... 4
1.5 Contributions of the research ............................................................................. 4
1.6 Thesis outline ..................................................................................................... 5
CHAPTER TWO ....................................................................................................................... 7
LITERATURE REVIEW ........................................................................................................ 7

vi
2.1 Overview ............................................................................................................ 7
2.2 Benefits of utilizing facts devices ...................................................................... 7
2.3 Unified power flow controller (UPFC) .............................................................. 8
2.3.1 Static synchronous series compensator (SSSC) ........................................... 10
2.3.2 Interline power flow controller (IPFC) ......................................................... 11
2.3.3 Power system stability classification of power system stability ................... 12
2.3.4 Rotor angle stability .................................................................................. 13
2.3.5 Transient stability ...................................................................................... 13
2.3.6 Transient stability indices ......................................................................... 13
2.3.7 Small signal stability ................................................................................. 14
2.4 Recent trends .................................................................................................... 14
2.5 Power system modeling ................................................................................... 19
2.6 Time domain simulation technique .................................................................. 20
2.7 Summary and gaps ........................................................................................... 21
CHAPTER THREE ................................................................................................................. 23
METHODOLOGY .................................................................................................................. 23
3.1 Introduction ...................................................................................................... 23
3.2 Placement of facts devices ............................................................................... 26
3.2.1 Location of facts devices using PSAT CPF .............................................. 26
3.3 Dynamic model for UPFC FACTS device ....................................................... 26
3.4 Dynamic model for SSSC FACTS device ....................................................... 29
3.6 Simulation and analysis of transient stability ................................................... 31
CHAPTER FOUR .................................................................................................................... 32
RESULTS, DISCUSSIONS AND ANALYSIS .................................................................. 32
4.1 Introduction ...................................................................................................... 32
4.2 Placement of facts devices ............................................................................... 32
4.2.1 Location of facts devices using PSAT CPF .............................................. 32

vii
4.3 Analysis for a single synchronous generator .................................................... 36
4.3.1 Analysis with UPFC ................................................................................. 36
4.3.2 Analysis with SSSC .................................................................................. 41
4.3.3 Analysis with IPFC ......................................................................................... 44
4.4 Analysis for more than one synchronous generator ......................................... 48
4.4.1 Generator rotor angle behaviour ............................................................... 48
4.4.2 Q-axis component of voltage behind transient reactance responses ......... 51
4.5 Voltage stability and loss reduction with FACTS ............................................ 54
CHAPTER FIVE ...................................................................................................................... 56
CONCLUSIONS AND RECOMMENDATIONS ............................................................ 56
5.1 Conclusions ...................................................................................................... 56
5.2 Recommendations ............................................................................................ 57
REFERENCES ......................................................................................................................... 59
APPENDICES........................................................................................................................... 70

viii
LIST OF TABLES
Table 4.1: Continuation Power Flow results for IEEE 14 bus system ………………33
Table 4.2: Voltage magnitude and real power losses ……………………………..…55

ix
LIST OF FIGURES
Figure 2.1(a): UPFC VSC model……………………………….……………….……8
Figure 2.1(b): UPFC injection model………………..….………………………..…...9
Figure 2.2(a): Voltage source model of SS………………………………..………....10
Figure 2.2(b): Injection Model of SSSC...………………………………...………….11
Figure 2.3: Classification of power system stability………...…………………….….13
Figure 3.1: IEEE 14 bus standard dynamic model………………….………...………24
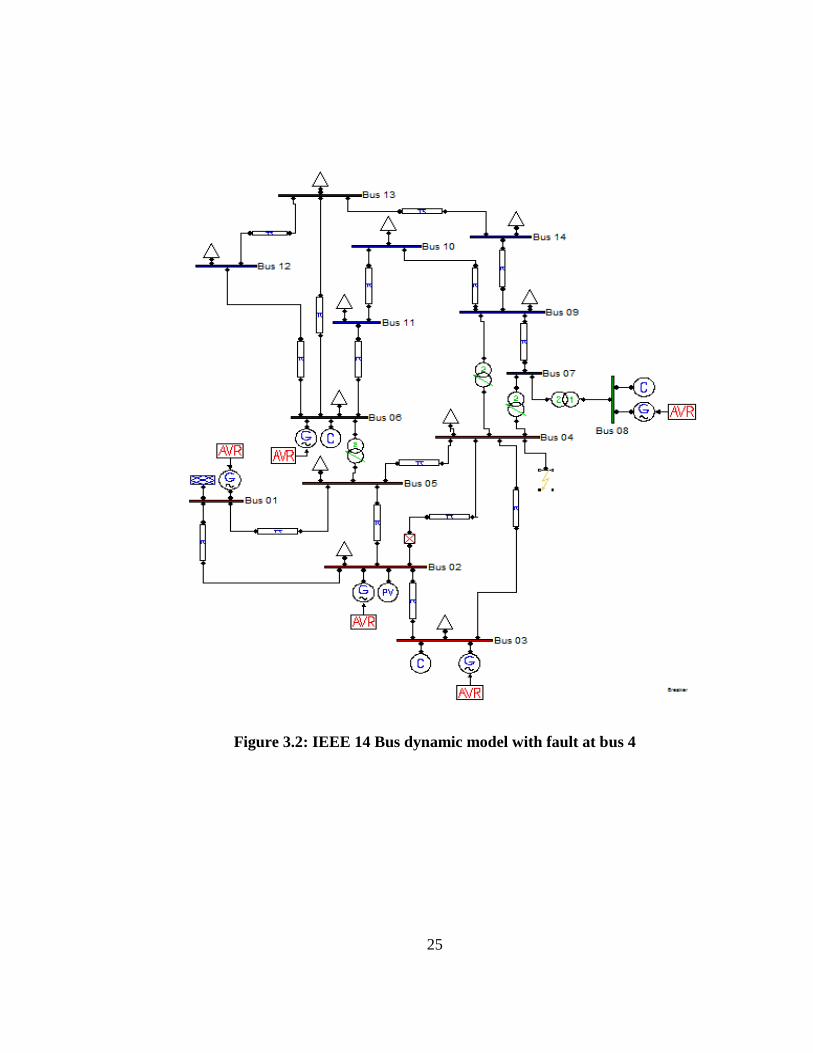
Figure 3.2: IEEE 14 Bus dynamic model with fault at bus 4………………..…...…...25
Figure 3.3: CPF Prediction step illustration...…...……………………………....……26
Figure 3.4: IEEE 14 Bus Dynamic model with fault and UPFC……...…..…..….…...28
Figure 3.5: IEEE 14 Bus Dynamic model with fault and SSSC…........……...……….29
Figure 3.6: Dynamic Simulink Model with fault and IPFC..……..…………………...30
Figure 4.1: Voltage profile magnitude……..………………………………......……...34
Figure 4.2: Voltage P-V nose curves for two low voltage buses……………..….........35
Figure 4.3: Generator 1 rotor Speed with fault at bus 4………...…………….…….…37
Figure 4.4: Generator 1 rotor speed with fault at bus 4 with UPFC….….……...……..37
Figure 4.5: Generator 5 rotor speeds with fault at bus 4……………...……….……….38
Figure 4.6: Generator 5 rotor speeds with fault at bus 4……...………….….………....39
Figure 4.7: Generator 3 real power response, fault at bus 4……………………….…..40
Figure 4.8: Generator 3 real power response with fault and UPFC…………….….…..41
Figure 4.9: Generator 1 rotor speed with fault at bus 4………………,,,…..…….……42
Figure 4.10: Generator 1 rotor speed, fault at bus 4 and SSSC…...…..………….……42
Figure 4.11: Generator 3 real power response, fault at bus 4…………………….…....43
Figure 4.12: Generator 3 real power, fault at bus 4 and SSSC………….………….….44
Figure 4.13: Generator 1 rotor speed with fault at bus 4……….……………....……...45
Figure 4.14: Generator 1 rotor speed, fault at bus 4 and IPFC……………….……......46
Figure 4.15: Generator 4 reactive response with fault at bus 4…….……………….…47
Figure 4.16: Generator 4 reactive response with fault and IPFC at bus 14…….……...48
Figure 4.17: Rotor angle responses without FACTS, fault at Bus 4…………………..50

x
Figure 4.18: Rotor angle responses UPFC FACTS device, fault at bus 4……………..50
Figure 4.19: Rotor angle responses for SSSC FACTS, fault at bus 4…………………51
Figure 4.20: Rotor angle responses with IPFC FACTS, fault at bus 4………….……..51
Figure 4.21: q-axis voltage component behind transient reactance without FACTS.…52
Figure 4.22: q-axis voltage component behind transient reactance with UPFC…….…53
Figure 4.23: q-axis voltage component behind transient reactance with SSSC….....…53
Figure 4.24: q-axis voltage component behind transient reactance with IPFC….…….54
Figure 4.25: Voltage magnitude profiles with and without FACT……….……...…….56

xi
LIST OF APPENDICES
Appendix 1: Single line diagram of static IEEE 14-bus system…………….………...70
Appendix 2: Bus data of IEEE 14-bus system…….…………………………………..71
Appendix 3: Line data of IEEE 14-bus system………………………………………..72
Appendix 4: IEEE 14 bus generator data…………………………………………..….73
Appendix 5: IEEE 14 bus system AVR data………………………………….……….75
Appendix 6: IEEE 14 bus compensator data…………………….………………..…...76
Appendix 7: UPFC data………………………………………………………………..77
Appendix 8: SSSC data………………………………………………………………...78
Appendix 9: Equations for Modeling Synchronous machine…………….……………78
Appendix 10: Power flow Equations of FACTS devices………..…………………….80
Appendix 11: Time domain report in PSAT…………………………...………………80

xii
LIST OF ABBREVIATIONS AND ACRONYMS
AC Alternating Current
ACPTDF AC Power Transfer Distribution Factor
AP Active Power
ATC Available Transfer Capability
CEA Combined Evolutionary Algorithm
CPF Continuation Power Flow
DC Direct Current
DS Dynamic Stability
FACTS Flexible Alternating Current Transmission System
FCL Fault Current Limiting
GA Genetic Algorithm
IM Induction Motor
IPFC Interline Power Flow Controller
N-R Newton-Raphson
OPF Optimal Power Flow
PD Power Oscillations Damper
PSAT Power System Analysis Toolbox
PSCAD Power System Computer Aided Design
PSO Particle Swarm Optimization
P-V Power- Voltage
RP Reactive Power
SS Transient Stability
SSSC Static Synchronous Series Compensator
SVC Static Var Compensator (SVC)
TCPAR/T Thyristor Controlled Phase Angle Regulators/ Transformer
TCSC Thyristor Controlled Series Capacitor
TDS Time Domain Simulation
TS Transient Stability

xiii
TSE Transient Stability Enhancement
UPFC Unified Power Flow Controller
VS Voltage Stability
VSI Voltage Stability Index

xiv
ABSTRACT
The massive growth of interconnected power systems due to increasing demand for
electrical energy has given rise to numerous challenges. These include power swings
and oscillations due to outages, blackouts, natural disturbances and system faults
that occur along transmission lines, load and generation points. Blackouts have been
witnessed in the recent years in countries around the world. These major
disturbances cause power system instability and pose difficulties to system
operation, planning and maintenances scheduling. In these circumstances, Flexible
Alternating Current Transmission System (FACTS) controllers such as the Interline
Power Flow Controller (IPFC) Static Synchronous Series Compensator (SSSC) and
Unified Power Flow Controller (UPFC) can considerably improve transient stability
thus enhance overall system stability during disturbances. Alongside the property of
fast control of active and reactive power in power system, SSSC, IPFC and UPFC
devices also play an additional role in transient stability enhancement and therefore
play vital in system stability control. This research has delved into the specific and
comparative performances of three devices as far as damping of system oscillations
is concerned. It has gone further to look at voltage support and loss reduction
features attributed to each device vis-à-vis damping of oscillations to enable power
system planners merge the transient stability, loss reduction and voltage support
characteristics of the three/ devices. In this research, use of UPFC, SSSC and IPFC
FACTS controllers were applied in Transient Stability Enhancement (TSE) analysis
considering dynamic environment of the standard IEEE 14 bus test system. TSE for
single compensation device (SSSC) and double compensation devices (UPFC and
IPFC) were accomplished successfully. The inherent properties of the three devices
were deduced for TSE. The research is inspired by the need of automating power
system transient stability control by outlining the distinguishing features of three
FACTS devices for TSE using with focus on their compensation properties. By
incorporating fast acting and appropriately located FACTS devices, the

xv
corresponding time domain responses were obtained and analysed with and without
the devices. This research has effectively brought out the specific and comparative
performances of three devices as far as damping of system oscillations is concerned.
The results have shown significant enhancement of the transient stability when the
FACTS devices are applied by considerably reducing post-fault settling time of
power system as well as effectively damping network oscillations in contrast with
when the devises are not applied. Synchronous machine parameters’ responses for
the three FACTS devices, appropriately placed, were obtained and analysed
successfully.

1
CHAPTER ONE
INTRODUCTION
1.1 Background
An electrical power system is a complex interconnected network comprising of
numerous generators, transmission lines, variety of loads and transformers. The term
Flexible Alternating Current Transmission System (FACTS) devices describes a
wide range of high voltage, large power electronic converters that can increase the
flexibility of power systems to enhance AC system controllability, stability and
increase power transfer capability. Demand for power and ensuing development of
the modern power system has led to an increasing complexity in the study of power
systems, presenting new challenges to power system stability, and in particular, to
the aspects of transient stability and small-signal stability [1]. Instabilities in power
system are caused by insulation breakdown or collapse, long length of transmission
lines, interconnected grid, changing system loads and other unforeseen disturbances
in the system. These instabilities result in reduced line flows or even line trip.
FACTS devices stabilize transmission systems with increased transfer capability and
reduced risk of line trips. Other benefits attributed to FACTS devices are additional
energy sales due to increased transmission capability, reduced wheeling charges due
to increased transmission capability and due to delay in investment of high voltage
transmission lines or even new power generation facilities. These devices stabilize
transmission systems with increased transfer capability and reduced risk of line trips
[1]. The major problem in power system is upholding steady acceptable system
parameters like bus voltage, reactive power and active power under normal
operating and anomalous conditions. This is usually system regulation problem and
regaining synchronism after a major fault is critical for this phenomenon. Faults can
cause loss of synchronism. As effects of instability, faults occur due to insulation
breakdown or compromise as result of lightning ionizing air, power cables blowing
2
together in the wind, animals or plants coming in contact with the wires, salt spray,
pollution on insulators, system overloading, long transmission lines with
uncontrolled buses at the receiving end, shortage of local reactive power, intrinsic
factors, natural causes like harsh weather and small generation reserve margins.
Such system disturbances have led to the introduction of FACTS devices such as
SVC, SSSC, STATCOM, UPFC and IPFC [2, 3]. In stable power systems, when
synchronous machines are disturbed, synchronism will either go back to their
original state if there is no net change of power or will reach a new state without loss
of synchronism and when there is net change in power; synchronism is lost [4]. Due
to FACTS devices, the power can be flown through the chosen routes with
consideration to mitigate the loss thereby averting losses due system tripping or
outages. UPFC and IPFC, for instance, are very versatile FACTS controllers.
1.2 Problem statement
Disturbances and faults in power systems pose adverse challenges. They include
power swings, oscillations, loss of synchronism and outages. This circumstances
causes power system problems of instability and even collapse. Voltage collapse
results when active and reactive power balance equations fail or the inability of load
dynamics attempt to restore power consumption beyond the capability of the
transmission network and the connected generation to provide the required reactive
support. Large disturbances such as a three-phase fault decelerates loads and cause
instability to generating units. Further still, continuous demand in electric power
system network as well as heavy loading leading to system instability and straining
of the thermal limits. FACTS can be applied at these instances to avert voltage
collapse and settle the swings. These controllers have varied and unique
compensation features when connected to power system. Single compensating
controller (series or shunt) like the series SSSC controllers and double
compensating characteristics of series-series IPFC and series-hunt UPFC have to be

3
analysed for TSE and reactive power control (voltage injection) since FACTS
devices are very expensive although very versatile. In interconnected power
systems, they optimize power networks via reactive, active and voltage control
enabling the system to better transient stability and boost the loading capability of
transmission lines to their rated thermal capabilities both in short term and long
term. Consequently, voltages, angle and impedance can be controlled, voltage
support enhanced and transient stability is improved significantly. Since their
compensation properties differ based on the type and configuration, the three
controllers need to be simulated so as to outline their distinct compensation features
for both TSE and power system control.
1.3 Justification of the study
This research is motivated by the growing use of FACTS to automate and optimize
power networks enabling multi-machine power system to improve stability, mitigate
dynamic sensitivities and reduce chances of system collapse under severe
disturbances. Placement of FACTS is achievable and the research in this area has
been widely done. The research is also inspired by difficulties in power transient
instabilities due to outages, blackouts and system faults that occur due to dynamics
in long transmission lines of interconnected systems and distance between load and
generation points. This phenomenon has resulted in system collapse in Kenya, USA,
France, Belgium, Sweden and Japan. The SSSC, UPFC and IPFC FACTS devices
are very promising devices in the FACTS controllers, concept. The need to
distinguish the effects of the three FACTS controllers for TSE and control in the
occurrence of disturbances like faults is critical since FACTS controllers have the
ability to adjust the three control parameters, i.e. the bus voltage, transmission line
reactance, and phase angle between two buses, either simultaneously or
independently [7]. They perform this through the control of the in-phase voltage,
quadrature voltage, and shunt compensation to improve voltage stability, steady

4
state and transient stabilities of a complex interconnected power system [8, 9]. This
property should be matched with other properties of FACTS like loss reduction and
voltage stability for system planning and economic operation. These features have to
be classified and each controller capabilities established.
1.4 Objectives
1.4.1 General objective
The main objective of this research was to investigate impacts of incorporating
SSSC, UPFC and IPFC FACTS devices in a multi-machine power network on
transient stability enhancement using a dynamic model with and without FACTS
devices.
1.4.2 Specific objectives
1. To determine suitable location of UPFC, SSSC and IPFC FACTS devices
2. To develop dynamic power system models for the FACTS devices.
3. To analyze the extent of transient stability enhancement with FACTS devices.
1.5 Contributions of the research
The thesis has made several contributions as described in the following:
(i) The incorporation of model of three types of FACTS devices namely; SSSC, UPFC
and IPFC to multi-machine power system in order to improve transient stability was
done successfully. The models have been used for dynamic analysis of FACTS
devices in power system network.
(ii) The most suitable location of FACTS devices has been determined effectively by
PSAT continuation power flow strategy. This was achieved via establishing the bus
with lowest voltage magnitude; the weakest bus for IEEE 14 bus test system. SSSC,
UPFC and IPFC FACTS devices have been located close to the weak bus and TSE
has been performed using dynamic IEEE 14 test system with AVR as the source of
5
excitation control for the synchronous generator. Successful simulations with and
without the three FACTS controllers/devices connected.
(iii) The power oscillations damping properties of single compensating series controller,
SSSC, the double series-shunt compensator, UPFC and double series- series
compensator, IPFC FACTS have been comparatively analysed in this thesis. Other
than the property of fast control of active and reactive power in power system from
the devices, the SSSC, IPFC and UPFC FACTS have been applied in damping
power system oscillations and transient-stability improvement. This research has
delved into the specific comparative performances of three devices as far as
damping of system oscillations is concerned. It has gone further to examine voltage
stability support and loss reduction attributed to each device to enable power system
planners merge the transient stability, loss reduction and voltage support
characteristics of the three devices.
(iv) The performance of double compensating integrated model of UPFC and
independent model of the IPFC with respect to oscillations damping, and loss
reduction have been successfully studied. The performances of the two have
compared with those of single compensating SSSC device.
(v) Distinct properties of the three FACTS controllers have deduced in oscillation
damping, voltage support and loss reduction have been effectively identified and
analysed.
1.6 Thesis outline
Chapter 1 outlines brief introduction of the problem to be solved, background,
proposed approach, and contributions of the research. The rest four parts are:
Chapter 2 provides a literature survey on essential topics of this research. It starts
with a general overview of techniques for solving FACTS devices optimization
problems, FACTS optimal location, FACTS devices modeling and application in
power system

6
Chapter 3 entails the methodology. The FACTS devices’ model developments are
developed for transient stability enhancement and analysis.
Chapter 4 Analyses, discuses and compares the results of the two FACTS; SSSC,
UPFC and IPFC and validates their performance in Transient Stability
Enhancement.
Chapter 5 outlines conclusion, summary and recommendations.
7
CHAPTER TWO
LITERATURE REVIEW
2.1 Overview
The development of FACTS devices started with the growing capabilities of power
electronic components. Devices for high power levels have been made available to
converters for different voltage levels. The overall starting points are network
elements influencing the reactive power the parameters of power system. FACTS
controllers are power electronic devices that enhance power system operation
through their control attributes and injection modes [12]. The devices are mainly
grouped as:
1) Series controllers such as Thyristor Controlled Series Compensator (TCSC),
Thyristor Controlled Phase Angle Regulators (TCPAR or TCPST), and Static
Synchronous Series Compensator (SSSC).
2) Shunt controllers such as Static Var Compensator (SVC), and Static
Synchronous Compensator (STATCOM).
3) Combined series-series controllers and combined series-shunt controllers such as
Interline Power Flow Controller (IPFC), Unified Power Flow Controller
(UPFC).
2.2 Benefits of utilizing facts devices
The benefits of utilizing FACTS devices in electrical transmission systems can be
summarized as follows [12]:They lead to increased loading capacity of transmission
lines, prevention of blackouts, boosting generation productivity, reduce circulating
reactive power, improvement of system stability limit, reduction of voltage flickers,

8
damping of power system oscillations, guaranteeing system stability, security,
availability, reliability and system economic operation [12].
2.3 Unified power flow controller (UPFC)
A unified power flow controller (UPFC) is a versatile controller in the FACTS
concept. It has the ability to adjust the three control parameters: the bus voltage,
transmission line reactance, and phase angle between two buses, either
simultaneously or independently [13] [14]. It has two voltage source converters
(VSC), series and shunt converter, which are connected to each other with a
common DC link capacitor which provides bidirectional flow of real power between
series connected SSSC and shunt STATCOM respectively. As shown in Figure
2.1(a) and 2(b) these converters are shunt and series transformers with AC voltage
bus. The series controller SSSC is used to add controlled voltage magnitude and
phase angle in series with the line, while shunt converter STATCOM is used to
provide reactive power to the ac system [15]. The UPFC model can be incorporated
to the power flow equations by including the impedances of the converters
transformers into the bus admittance matrix and adding the UPFC injection powers
at specific buses. The schematic diagram connected between two buses; i and j as
shown below.
Figure 2.1(a): UPFC VSC model

9
Figure 2.1(b): UPFC injection model
UPFC has the following control attributes; AP and RP control, voltage control, VAR
compensation, Power Oscillations Damping, VS, and DS [15].
For UPFC, is the series voltage source and is the shunt current source given
by:
( ) (2.1)
( ) (2.2)
Where, V𝑝 and V𝑞 are the component of the series voltage, 𝑝 and i𝑞 are the
component of the shunt current, ∅ and 𝜃𝑘 are the angles of the line current and bus
voltage. The differential equations used to control the components of the series and
shunt sources are given by:
(
) (2.3)
(
) (2.4)
[ (
) ] (2.5)
10
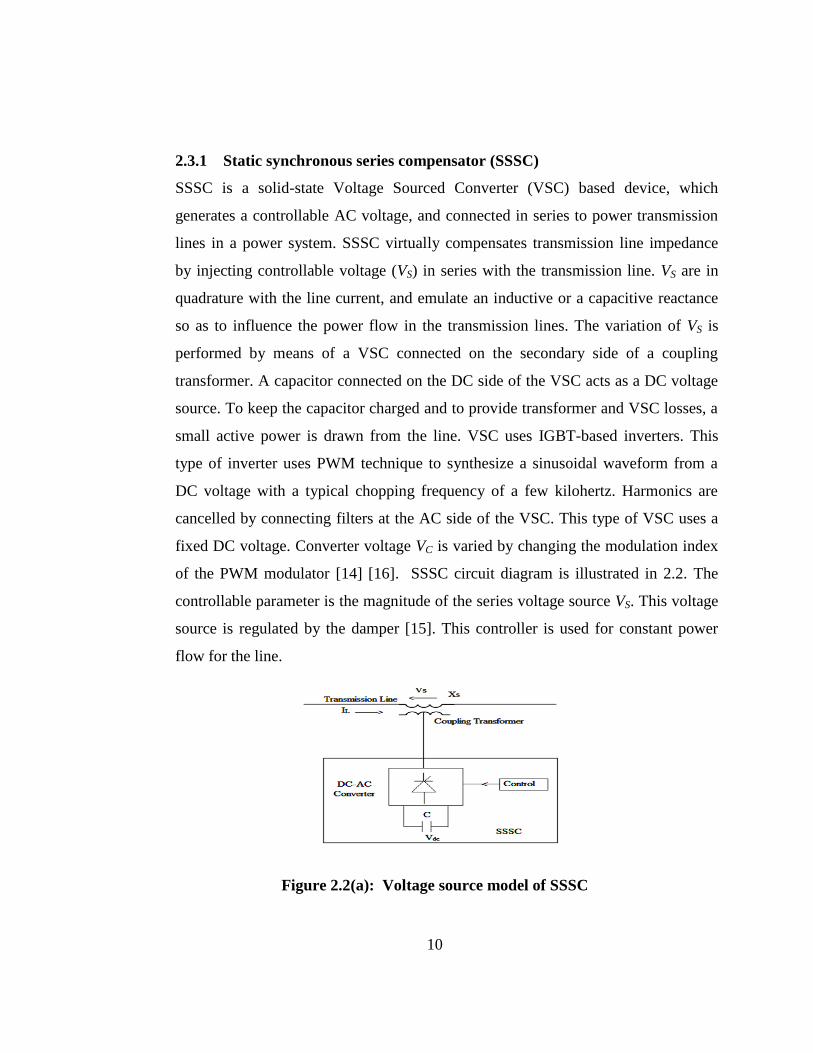
2.3.1 Static synchronous series compensator (SSSC)
SSSC is a solid-state Voltage Sourced Converter (VSC) based device, which
generates a controllable AC voltage, and connected in series to power transmission
lines in a power system. SSSC virtually compensates transmission line impedance
by injecting controllable voltage (VS) in series with the transmission line. VS are in
quadrature with the line current, and emulate an inductive or a capacitive reactance
so as to influence the power flow in the transmission lines. The variation of VS is
performed by means of a VSC connected on the secondary side of a coupling
transformer. A capacitor connected on the DC side of the VSC acts as a DC voltage
source. To keep the capacitor charged and to provide transformer and VSC losses, a
small active power is drawn from the line. VSC uses IGBT-based inverters. This
type of inverter uses PWM technique to synthesize a sinusoidal waveform from a
DC voltage with a typical chopping frequency of a few kilohertz. Harmonics are
cancelled by connecting filters at the AC side of the VSC. This type of VSC uses a
fixed DC voltage. Converter voltage VC is varied by changing the modulation index
of the PWM modulator [14] [16]. SSSC circuit diagram is illustrated in 2.2. The
controllable parameter is the magnitude of the series voltage source VS. This voltage
source is regulated by the damper [15]. This controller is used for constant power
flow for the line.
Figure 2.2(a): Voltage source model of SSSC

11
Figure 2.2(b): Injection Model of SSSC
SSSC has the following control attributes Current control, VS, TS, and FCL [15].
The controllable parameter (magnitude of the series voltage source ) is regulated
by the damping controller, PD. This controller is used for constant power flow
through the line. The equations modeling the SSSC are:
(
) (2.6)
( ) (2.7)
( ) (2.8)
Where is the input signal.
2.3.2 Interline power flow controller (IPFC)
The inter-line power flow controller employs DC-to-AC converters each providing
series compensation for different lines or buses. The IPFC comprise a two SSSC.
The simplest IPFC consist of two back-to-back DC-to-AC integrated or independent
converters. They are connected in series with two transmission lines through series
coupling transformers and the dc terminals of the converters are connected together
via a common DC link or separate one [15][16]. The IPFC can be used to provide
double or compensation for the same or compensate two transmission lines at the
same time through integrated configuration where the SSSC controllers share a
common DC link or independent configuration where each SSSC has its own DC

12
link. The IPFC double SSSC configuration is shown. The independent configuration
has been chosen for this thesis. Two separate SSSCs are placed at the weakest bus.
IPFC has the following control attributes; RP control, Voltage control, Power
Oscillations Damping, VS, TS and DS [15]. The controllable parameters of this
device is the magnitude of the series voltage sources; and . The voltages
sources are regulated by the respective PD controllers. The equations modeling the
two SSSCs making up the IPFC are:
SSSC 1
(
) (2.9)
( ) (2.10)
( ) (2.11)
SSSC 2
(
) (2.12)
( ) (2.13)
( ) (2.14)
2.3.3 Power system stability classification of power system stability
Classification of power system stability is mainly categorized into three parts; rotor
angle, frequency and voltage stability as shown in figure 2.3 below:

13
Figure 2.3: Classification of power system stability. [17, 18]
2.3.4 Rotor angle stability
Rotor angle stability refers to the ability of synchronous machines of an
interconnected power system to remain in synchronism after being subjected to a
disturbance [17, 19]. Power system stability can be categorized into the following
subcategories:
2.3.5 Transient stability
This is the ability of the power system to maintain synchronism after a large
disturbance such as loss of a generator or major load or major system faults [20, 21].
In transient stability analysis, the time frame of interest is usually 3 to 5 seconds
following the disturbance. It may extend to 10 to 20 seconds for very large systems
with dominant inter-area swings [22, 23].
2.3.6 Transient stability indices
These are parameters applicable in assessment of TS. They are TS indicators and
include critical clearing time (CCT) and critical clearing angle (CCA) [22]. CCT/A
is the maximum allowable fault period/angle for stability to be maintained. The
higher the CCT, the more stable the system. It is applied for measurement of
contingency severity and thus can be used in ranking contingencies. Another
parameter is fault settling time; the duration it takes for the system ton to regain its

14
steady state original condition after a disturbance. Steady state can only be achieved
if the CCT ids not exceeded [23]. Power system oscillations of a system which are
more stable take less time to settle and the converse is true. The oscillations damping
property has been utilized significantly in this research for the TSE enhancement
analysis with three FACTS in this thesis.
2.3.7 Small signal stability
This is the ability of the power system to maintain synchronism when the system is
subjected to small disturbances such as long gradual power changes after the action
of AVRs and turbine governors [23]. It is basically concerned with the disturbances
such as small changes and variations in loading and generation units.
2.4 Recent trends
In the research work [2], the SVC and Thyristor TSCS based FACTS device are
employed to minimize the losses and improve power flow in long distance
transmission line. For the research study [25], the Combined Evolutionary
Algorithm (CEA) was presented i.e. Cuckoo Search (CS) and Evolutionary
Programming (EP) algorithm to find the optimal location and optimal capacity to be
placed at the location for UPFC FACTS to provide of reactive power for voltage
stability. In study [26], the application of Bacterial Foraging (BF) Algorithm to find
optimal location of FACTS devices to achieve voltage stability improvement for
minimum cost of installation of the FACTS devices has been presented. Comparison
between, SVC, TCSC, and SSSC for power system stability enhancement under
large disturbance for inter-area power system in [27] demonstrated that SSSC
settling time for line power in post fault period is found to be around 1.5 seconds,
TCSC at 3 seconds and SVC 7 seconds. In research [28], a genetic algorithm based
optimal power flow is proposed for optimal location and rating of the UPFC in
power systems and also simultaneous determination of the active power generation
15
for different loading conditions has been studied. In research [29], the reduction of
reactive power loss sensitivity-based method has been developed for determining the
optimal location of TCSC to relieve congestion.
Research work in [30] investigated the transient characteristic of STATCOM, and
summarized the switch strategy of based on two generating stations. The simulation
result shows that STATCOM can damp power oscillation efficiently. Study [31]
aimed at utilizing FACTS devices with the purpose of improving the operation of an
electrical power system. In the work [32], a model of the power system with an
SVC boost to transient stability by increasing critical clearing angle. For the work
done in [33], the power system stability improvement of a multi-machine power
system by various FACTS devices such as SVC and UPFC is analyzed for a two
area system for performance of the devices for power system stability improvement.
Work done in [34] seeks to improve transient stability using FACTS devices. In
research the [35], the utilization of a STATCOM with adaptive control is to enhance
the transient answer of the synchronous generator via inhibiting the transients.
In the analysis done in [36], SVC is used in a two area power system for improving
transient stability. In the in [37] study, DSSC was placed in a sample two machine
power system to increase transient stability. Studies in [38] presented transient
stability and power flow models of STATCOM to demonstrate that STATCOM
considerably improves transient stability. FACTS devices can regulate the active and
reactive power control as well as adaptive to voltage-magnitude control
simultaneously because of their flexibility and fast control characteristics [39].
Power system stability enhancement of a power system by various FACTS devices
is presented and discussed in [40] using TCSC. Results demonstrated the
effectiveness and robustness of TCSC on transient stability improvement of the
system. Analysis in [41] investigated the capability of UPFC on transient stability of
a two-area power system. The analysis of generator rotor angle, voltage profile and

16
angular frequency is done with and without UPFC at different fault clearing times,
CTs. The impact of TCSC on the transient stability is studied in [42]. Line reactance
and the power flow can be changed by TCSC. A general non-linear dynamical
model for power systems with UPFC as a stabilizing controller is used [43] and was
applied in SS. For the study in [44], STATCOM was used to improve the system by
eliminating fault transients on single machine infinite bus system (SMIB); it was
observed that the IPFC is better damping than STATCOM. Research study done in
[45], presents the transient stability assessment of two series FACTS controllers
SSSC and IPFC where it was improved transients due to faults while enhancing the
Available Transfer Capacity (ATC).
The IPFC in research [46] suitably located, helps the system to remain stable by
increasing critical clearing time (CCT) because of the strong multi-line control
capability of integrated model of IPFC. Power Injection Model (PIM) is
implemented into the modified IEEE 30-bus test system in [47] with IPFC to
equalize both real and reactive power to relieve the overloaded lines. The results
show the capability of IPFC utilization as an automatic generator control actuator
[47, 48]. In studies done in [49], Fuzzy tuned-AVR with IPFC is used for series
compensation with capability of controlling power flow. Modeling, simulation and
comparison of the performance of IPFC and UPFC FACTS controllers for voltage
stability enhancement and improvement of power transfer capability have been
presented in [50]. From the [51] investigation, IPFC is a feasible resolution
throughout the transmission lines not only to increase the transmission capacity but
also improve the transient performance. The small signal studies have been carried
out to investigate the performances of the IPFC and UPFC in [52]. Finding is
obtained IPFC has on more series branches than the UPFC hence better series
voltage compensation.

17
The studies in [53] reveal Hybrid Power Flow Controller (HPFC) stabilizes quickly,
reduces the settling time, and thus settles out the power system transients effectively.
The [54] model is adapted to IPFC and UPFC devices. On the same work,
simulations done revealed the integrated IPFC model and UPFC capabilities and
advantages for controlling simultaneously both active and reactive power flow hence
real and reactive power coordination. This needs to extend to transient stability
enhancement. For study in [55], Real power (P) and reactive power (Q) of the
system is compared with and without of UPFC and IPFC in the system. It is shown
that powers profiles are improved. In [56], SSSC has been applied in PSAT to
improve voltage profile enhancement, power flow control is achieved and
congestion is less and congestion management. Observations made in [57] shows
positive improvements caused by TCSC and SSSC controllers, two of FACTS
devices, in the increase of energy transmission lines capacity and amplifying voltage
stability limits. When the system was examined in terms of voltage stability,
improvements related to power increase were detected. It was seen on the voltage
stability curves that voltage stability limits are rather favorable when same capacity
load is transferred. Optimal co-ordination design of PSSs and UPFC devices in a
multi-machine power system was done in [58]. The procedure was based on the use
of the Angle-PSO which adjusts the parameters of the controllers to achieve system
stability and maintain optimal damping as the system operating condition and/or
configuration change. The simulation results proved that the power system is more
stable with UPFC device provided the optimal choice of its location and parameters.
Electromagnetic Transient Program (EMTP) simulation software has utilized in [59]
for transient stability and power flow models of Thyristor Controlled Reactor (TCR)
and Voltage Sourced Inverter (VSI) based Flexible AC Transmission System
(FACTS) Controllers. Models of the SVC, TCSC, STATCOM, SSSC, and UPFC
appropriate for voltage and angle stability studies have studied. Research [60]
presented SSSC where its linearized power flow equations were incorporated into

18
Newton-Raphson algorithm in a MATLAB® written program to successfully carry
out the control of active power flow and the transient stability studies. In in research
work at [61], the simulation of a single-machine infinite bus power system model
under different faults has been carried out in order to exemplify the superiority in the
performance of damping low frequency oscillation by employing SSSC based
controller with modified GA. The results clearly indicated that SSSC provided
improved dynamic response and at the same time faster than other conventional
controllers. Effect of SSSC and UPFC demonstrated in [62] that FACTS devices
improve the power transfer capability and control the power flow. It was found out
in [63] that by incorporation of SSSC, the power flow between the lines improves
and the lower order harmonics are reduced. The work was implemented vide a
MATLAB® code. A complete model for transient stability study of multi machine
power system has been developed using MATLAB®/Simulink environment in [64].
It was deduced that Simulink model is not only well suited for an analytical study of
a power system network, but it is also helpful in detailed study of load flow and
parameter variations. Numerical results on the test system demonstrated in [65] that
the proposed IPFC model yields fairly accurate results for bus voltages and power
flows. The Available Transfer Capability (ATC) of the required transmission lines
has been increased as the power transfer through the particular line has reduced.
Research [66] studied that the oscillation produced in the system can be removed
with SVC. From the simulation work it was clear that the power system can attain
the stability in the best manner if the SVC is located optimally after fault occurrence.
This way, SVC was used to improve the transient stability of system. The work was
achieved using a MATLAB®
program. Transient stability analysis of electrical
power systems by means of LabVIEW tool based Simulation of STATCOM was
done in [67]. LabVIEW helped to study the system behaviour, thus reducing its
complexity. STATCOM provided better damping characteristics than the SVC, as it
is able to exchange active power with the system.
19
2.5 Power system modeling
`Power system dynamic simulations fall in basically two groups: Electromagnetic
Transients (EMT) and quasi-sinusoidal (or phasor mode) approximation. In the
EMT, fast electromagnetic transients are simulated and in steady state, voltages and
currents evolve sinusoidally with time at a nominal frequency. The network itself is
modeled through differential equations with respect to its reactances. For the quasi-
sinusoidal (or phasor mode) approximation, the network is denoted by algebraic
equations corresponding to sinusoidal regime. During transients, all phasors vary
with time while in steady-state they take on constant values. The dynamic model
describes how the phasors evolve with time. To effectively, analyze any power
system, mathematical model is used to represent the system. In this research, system
has been represented in terms of Simulink blocks in a single integral model. The
meriting feature of a model in Simulink is its easy interactive capacity; the display
of a signal at any point is readily available; by just adding a block or, an output port.
Feeding of feedback signal can be quite easily done. A block parameter can be
controlled from a MATLAB®
command line or m-file program. Thus, this is
invaluable for a transient stability studies as the power system configurations are
different before, during and after fault. Loading conditions and control measures can
also be implemented accordingly. Power system generators on the system are
considered as constant voltage sources. The largest generator is treated as the swing
bus which will take care of the power mismatch in the system. All loads are treated
as constant power sinks. Medium length model is considered for all transmission
line sections [68]. Transformers are modelled with tertiary winding and are
operating with an on-line tap changer. The Simulink environment applied in this
thesis is MATLAB®
PSAT, computing power system analysis simulation tool with
properties for design power networks, visualize the topology and change the data
stored in it, without the need of directly dealing with lists of data [70]. Matpower
toolbox is a package of MATLAB® m-files for solving power flow and optimal
20
power flow problems also utilized in this work together with PSAT is a MATLAB®
toolbox for electric power system analysis and control a toolbox with a variety of
utilities, as follows: one-line network diagram editor (Simulink library); user
interfaces for settings system and routine parameters; user defined model
construction and installation; GUI for plotting results; filters for converting data to
and from other formats and command logs [68] [70].
2.6 Time domain simulation technique
Dynamic simulations are commonly used for checking the response of electric
power systems to large disturbances. They have become indispensable for planning,
design, operation, and security of power systems. Operators depend on fast and
accurate dynamic simulations to train operators, analyze large sets of scenarios,
assess the dynamic performance of the network in real-time. TDS require solving a
large set of nonlinear, stiff, hybrid, Differential-Algebraic Equations (DAEs) that
describe the physical dynamic characteristics, interactions, and control schemes of
the system. A large interconnected transmission involves hundreds of thousands of
such equations whose dynamics span over very different time scales and undergo
many discrete transitions imposed by limiters, switching devices, etc. Consequently,
dynamic simulations are challenging to execute, computationally intensive and can
easily push any given computer to its limits. In this research by use of TDS tool in
MATLAB®
PSAT; two integration methods are applied forward Euler and
Trapezoidal rule to evaluate the algebraic and state variable directions at each
dynamic step of the algebraic and state Jacobian matrices of the system.
Disturbances are fully supported in PSAT. The most common perturbations for
transient stability analysis; faults and breakers are handled by function models. At
TDS period, a time vector for carrying out TSA before and after the fault
occurrences is created. When the faults or the fault clearances occur, the shunt
admittances of the network are modified and the admittance matrix is recomputed.
The responses are computed by TDS and responses given by the main graphical user
21
interface on PSAT. Eventually in this research work, SSSC, IPFC and UPFC
FACTS models are incorporated to the system and their responses for power
oscillation before and after are comparatively studied using the PSAT TDS tool [69]
[70].
2.7 Summary and gaps
From the foregoing literature survey, it is noted that placement various FACTS
devices has been research at great depth and profundity. To realize the peak
performances of the three devices; SSSC, UPFC and IPFC, the best location, based
on the bus voltage magnitude has been implemented in this thesis. The review has
also established that FACTS devices have been applied jointly and severally to
provide voltage through active and real power control vide their voltage injection
properties. Singularly, FACTS controllers like SVC, TSCS, SSSC, HPFC, and
integrated model of the UPFC and IPFC have used to enhance voltage stability and
transient stability. This research has gone a step further. As stated previously, other
than the property of fast control of active and reactive power in power system
clearly depicted in the literature exploration, the three FACTS devices also play a
key part in invaluably damping power system oscillations and transient-stability
enhancement hence boosting system reliability and control during disturbances. The
power oscillations damping properties of single compensating series controller,
SSSC, the double series-shunt compensator, UPFC and double series-series
compensator, IPFC FACTS have been comparatively studied in this thesis go
beyond the above survey. Further still, this research has examined the specific
performances of three devices before the comparative analysis far as their damping
of system oscillations, voltage support and loss reduction regimes are concerned. It
has also uniquely contributed to system TS control information using FACTS
through the study of the responses of double compensating and independent model
of the IPFC with respect oscillations damping and loss reduction capabilities by way
distinguishing their capability with respect other devices under examination. It has

22
gone further to look at voltage stability support and loss reduction attributed to each
device to enable power system planners merge and establish the trade-off among
transient stability, loss reduction and voltage support characteristics of the three
devices focused. Best application of FACTS needs to determined; is it voltage
support or transient stability. Distinction of compensation properties of series and
shunt converters in TSE is major gap in past studies.

23
CHAPTER THREE
METHODOLOGY
3.1 Introduction
This chapter outlines the research procedure and approach. The most appropriate
location of FACTS devices has been determined by CPF strategy by finding out the
critical buses or weakest buses, for placement of the FACTS devices. The method
outlines the buses with the lowest voltage magnitudes hence the best location for
placing the devices. The method used is CPF via MATLAB®
PSAT Toolbox.
Subsequently, dynamic TSE simulations using TDS tool incorporated in power
system simulation software MATLAB®
PSAT Toolbox are performed with and
without FACTS located based on the above criterion.PSAT is selected for its
robustness and the ability of its TDS tool to analyze numerous transient stability
parameters compared to other tools.
Dynamic TDS simulations to validate the effects of three FACTS controllers; SSSC,
UPFC and IPFC have been realized by use of standard dynamic IEEE 14 bus model
with AVR as shown in figure 3.1 below. IEEE 14 bus selected for this study as it’s a
multi-machine network that can be used as a basis and can be extrapolated to all
network other networks including the Kenyan power network. The most critical
consideration was the compensation properties of FACTS and not the size of the
system. A TDS was performed for three phase fault at bus 4, see figure 3.2 for all
the three FACTS controllers. The faulted bus is randomly selected since system
faults can occur anywhere in the system. Other buses, generations units, substations
can also be faulted.

24
Figure 3.1: IEEE 14 test bus standard dynamic model
25
Figure 3.2: IEEE 14 Bus dynamic model with fault at bus 4

26
3.2 Placement of facts devices
The method employed to determine the bus with weakest voltage profile for FACTS
devices location is outlined in 3.1.1 below.
3.2.1 Location of facts devices using PSAT CPF
CPF technique is used for carrying out voltage stability performance analysis of the
system under study. It is used to obtain P-V curve of power system for each bus. In
P-V curve Continuation power flow starting with initial operating point and
increasing load to the maximum loading point as shown in figure 3.3 below.
Figure 3.3 CPF Prediction step illustration
Continuation power flow analysis been done establish the bus with lowest voltage
magnitude. This is the weakest bus and the best location of the FACTS device.
3.3 Dynamic model for UPFC FACTS device
The dynamic model of standard IEEE 14 Bus in PSAT toolbox with UPFC FACTS
device is utilized in this thesis. UPFC FACTS device is connected to the optimal
location obtained in 3.2.1 above. The best locations of the devices are the buses with
lowest voltage profile. The IEEE 14 bus system consists of 14 buses, 5 generators
each with AVR, 11 loads, 3 transformers and 20 branches. The bus data include the
bus voltage with its phase and magnitudes. Out of five generators two generators
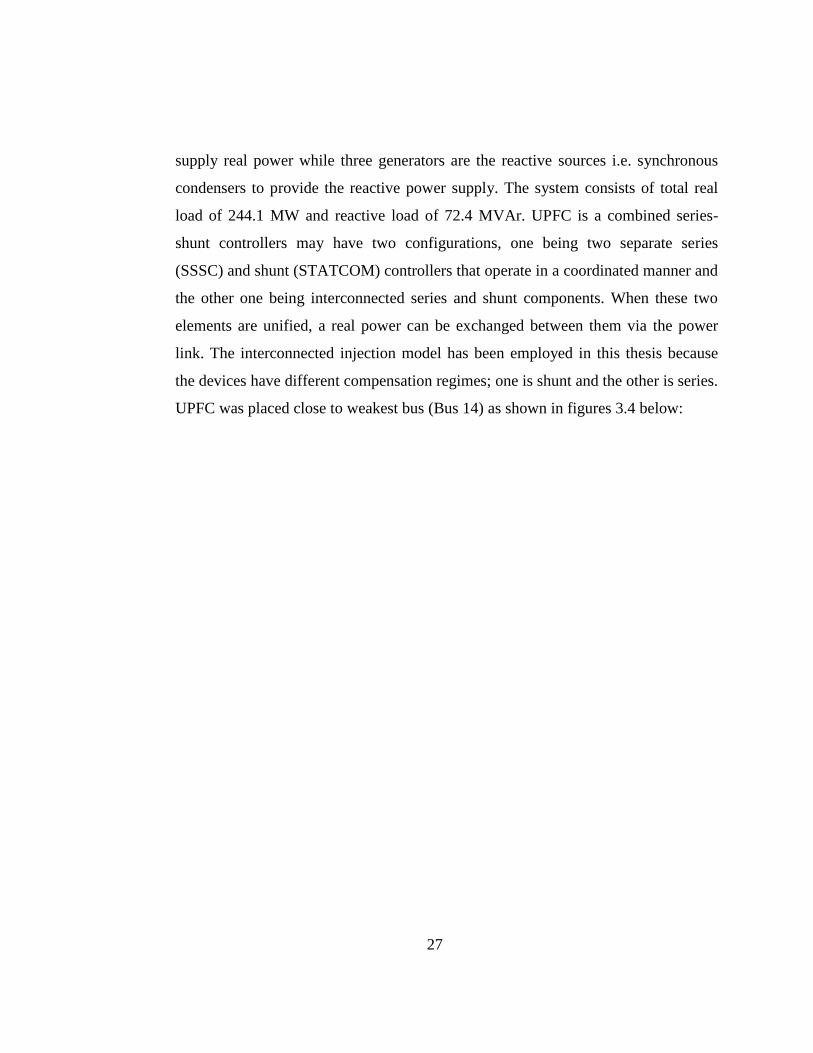
27
supply real power while three generators are the reactive sources i.e. synchronous
condensers to provide the reactive power supply. The system consists of total real
load of 244.1 MW and reactive load of 72.4 MVAr. UPFC is a combined series-
shunt controllers may have two configurations, one being two separate series
(SSSC) and shunt (STATCOM) controllers that operate in a coordinated manner and
the other one being interconnected series and shunt components. When these two
elements are unified, a real power can be exchanged between them via the power
link. The interconnected injection model has been employed in this thesis because
the devices have different compensation regimes; one is shunt and the other is series.
UPFC was placed close to weakest bus (Bus 14) as shown in figures 3.4 below:
28
Figure 3.4: IEEE 14 Bus Dynamic Simulink Model with fault and UPFC
UPFC Device

29
3.4 Dynamic model for SSSC FACTS device
The dynamic model for SSSC FACTS device was developed to check the
effectiveness of SSSC for TSE. The IEEE 14 bus dynamic model for SSSC placed
close to 14 is shown in figures 3.5 below:
Figure 3.5: IEEE 14 Bus Dynamic Simulink Model with fault and SSSC
SSSC Device

30
3.5 Dynamic model for IPFC FACTS device
The dynamic model with independent configuration of IPFC FACTS device was
also utilized to check the effectiveness of IPFC for TSE. The Simulink arrangement
is shown in figure 3.6 below.
Figure 3.6: Dynamic Simulink Model with fault and IPFC device
SSSC 1
SSSC 2

31
3.6 Simulation and analysis of transient stability
PSAT is used to assess the effectiveness of the three FACTS device models
developed in this thesis. 3-Phase fault is has been simulation to provide the source of
disturbance with fault time occurring at 1.000 second cleared time at 1.250 seconds.
The following cases are considered:
Case I:
TDS is carried out with 3-Phase fault with no FACTS device connected.
Case II:
TDS is carried out with 3-Phase fault with the three FACTS devices connected to
the system.
The TSE responses were obtained from the above TDS for comparative analysis
alongside the effects of the three devices in voltage profile improvement and loss
reduction. Appendices A1-A8 outlines the details of IEEE 14 bus test system,
system bus/line data and FACTS controllers’ data.

32
CHAPTER FOUR
RESULTS, DISCUSSIONS AND ANALYSIS
4.1 Introduction
This chapter deals analysis of the results. The results of the FACTS controllers’
location are initially outlined. Thereafter, the TSE simulation results with and
without the controllers, in time domain, were subsequently obtained. The results of
determination of suitable location of FACTS devices have been obtained by use of
CPF method in the PSAT platform. Accordingly, dynamic TSE simulations using
TDS tool incorporated in power system simulation software PSAT Toolbox are
performed for the three devices. TS parameters including rotor speed, settling time
and angle have been simulated and analysed. Initially, Transient Stability
Enhancement (TSE) analysis for single parameters was dealt with before multiple
parameters machines were considered.
4.2 Placement of facts devices
4.2.1 Location of facts devices using PSAT CPF
Continuation power flow simulation was done using PSAT software and the results
were obtained as displayed in table 4.1. The power flow results revealed that the
buses with lowest voltage magnitudes are 04 and 14. The P-V nose curves for the
weakest buses are illustrated in figure 4.1. It was deduced from the curves for the
14-bus test system, that bus 14 was the weakest bus for IEEE 14 bus system.
Continuation power flow technique has been used to successfully identify weakest
bus in the system to locate the devices.

33
Table 4.1: Continuation Power Flow results for IEEE 14 bus system
POWER FLOW RESULTS (Voltage and Angle)
Bus V[p.u.] Phase[rad]
Bus 01 1.060 0
Bus 02 1.045 -0.136
Bus 03 1.010 -0.332
Bus 04 0.998 -0.263
Bus 05 1.002 -0.227
Bus 06 1.070 -0.380
Bus 07 1.035 -0.354
Bus 08 1.090 -0.354
Bus 09 1.011 -0.402
Bus 10 1.0105 -0.405
Bus 11 1.034 -0.395
Bus 12 1.046 -0.401
Bus 13 1.036 -0.403
Bus 14 0.996 -0.429
34
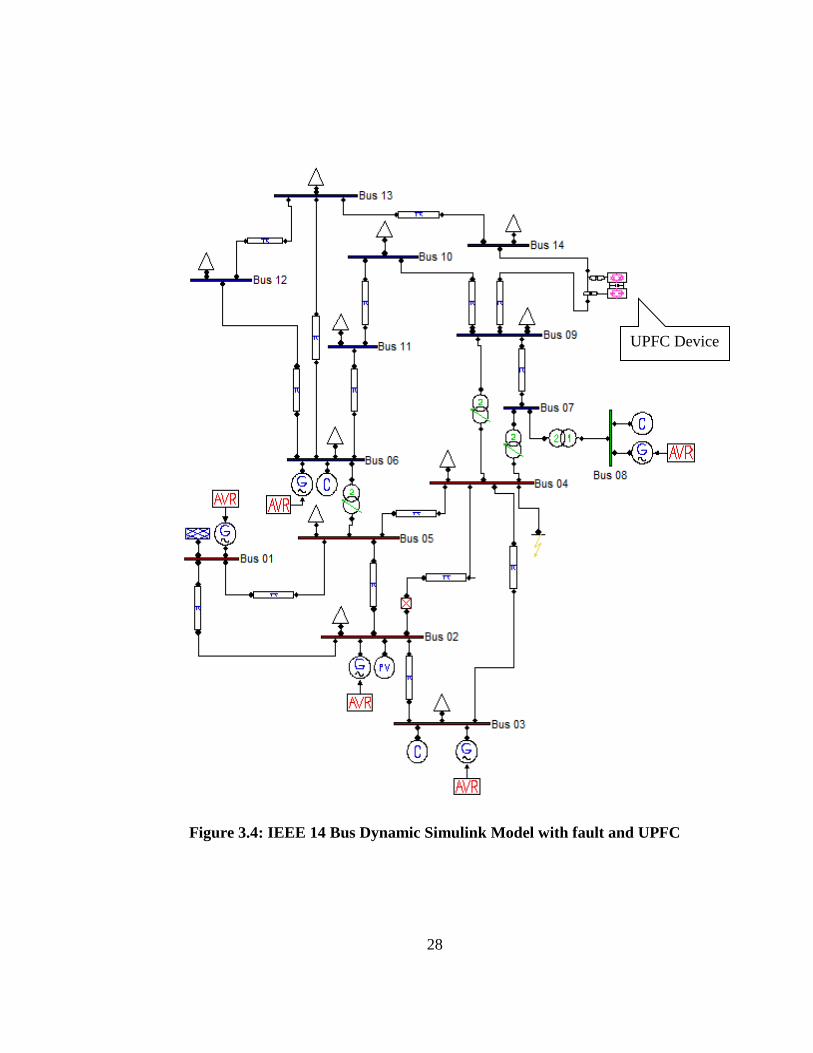
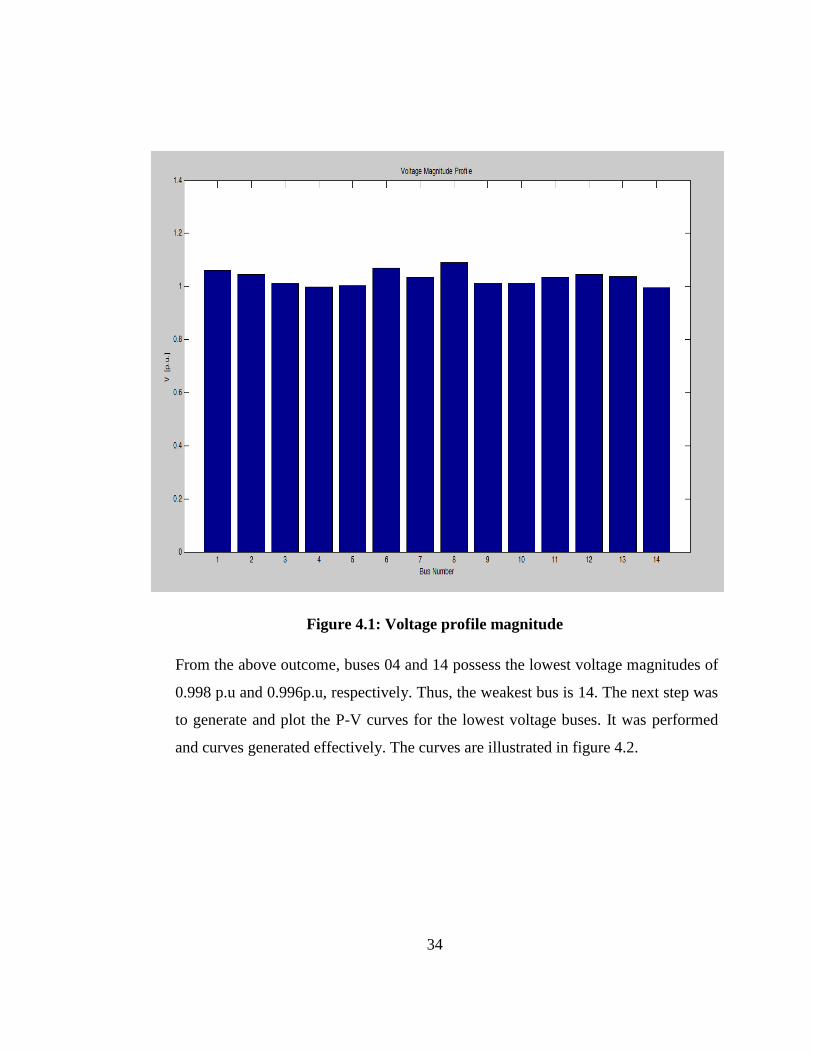
Figure 4.1: Voltage profile magnitude
From the above outcome, buses 04 and 14 possess the lowest voltage magnitudes of
0.998 p.u and 0.996p.u, respectively. Thus, the weakest bus is 14. The next step was
to generate and plot the P-V curves for the lowest voltage buses. It was performed
and curves generated effectively. The curves are illustrated in figure 4.2.

35
Figure 4.2: Voltage P-V nose curves for two low voltage buses in IEEE 14 bus
system
The figure above shows the changes of bus voltage with the loading factor lambda
(λ) for IEEE 14 bus test system. From the plots of buses 04 and 14, it is deduced that
bus number 14 is the most insecure bus as the voltage at each reactive load of bus 14
is minimum. Thus, this is the best location for the three FACTS devices for TDS.
The P-V is plot of variation of bus voltage with the loading factor.

36
4.3 Analysis for a single synchronous generator
TSE simulations were carried in TDS tool embedded in MATLAB® PSAT toolbox.
The simulations were carried out initially without FACTS controllers. Later,
simulations with three FACTS controllers were also done and the results recorded.
Though there are numerous TSE variables were done in the development of this
work, the thesis can have very many plots. For purposes of this work, rotor speed, q-
axis voltage component behind transient reactance, generator power and rotor angle
and speed parameters were selected for time domain simulations (TDS) and
analysis. TDS have been carried out to evaluate the effectiveness of the three
FACTS device models in this work. Three-phase fault is has been applied to provide
the source of disturbance with fault time occurring at 1.00 second cleared time at
1.25 seconds with and without FACTS. Single parameter-responses for singular
machines were obtained and studied initially before consideration of multiple
machines.
4.3.1 Analysis with UPFC
1. Rotor speed responses
a. Rotor Speed Response of Generator 1
Without UPFC, the oscillations of the rotor speed (angular frequency) of
synchronous generator 1 settle to steady state condition after 40 seconds as observed
in figure 4.3. The damping to steady state operating condition of post fault
oscillations is significantly enhanced by UPFC FACTS device. The UPFC damps
the oscillations at a time of about 25 seconds as shown in figure 4.4.

37
Figure 4.3: Generator 1 rotor speed with fault applied at bus 4
Figure 4.4: Generator 1 rotor speed with fault applied at bus 4 and UPFC close to
14.

38
b. Rotor Speed Response of Generator 5
For synchronous generator number 5, UPFC damps the oscillations of the rotor
speed (angular frequency) of synchronous generator 5 after about 25 seconds. The
damping of post fault oscillations to steady state operating condition is significantly
achieved faster with UPFC FACTS device. The oscillations phenomena with and
without UPFC are shown below, in figures 4.5 and 4.6 respectively.
Figure 4.5: Generator 5 rotor speeds with fault applied at bus 4

39
Figure 4.6: Generator 5 rotor speed with fault at bus 4 and UPFC at Bus 14
2. Generator 3 real power response
Real power, P, response of synchronous generator 3 without UPFC is shown in
figure 4.7. Figure 4.8 below displays the response with UPFC. Oscillations after
fault clearance at 1.25 seconds remain unstable and go beyond the simulations
ending time set at 40 seconds. However, with UPFC the swings are damped to
steady sate operating condition at about 15 seconds at real power magnitude of about
0.4 p.u.

40
Figure 4.7: Generator 3 real power response with fault applied at bus 4
Figure 4.8: Generator 3 real power response, fault at bus 4 with UPFC at Bus 14
41
4.3.2 Analysis with SSSC
1) Rotor speed response
A. Rotor Speed Response of Generator 1
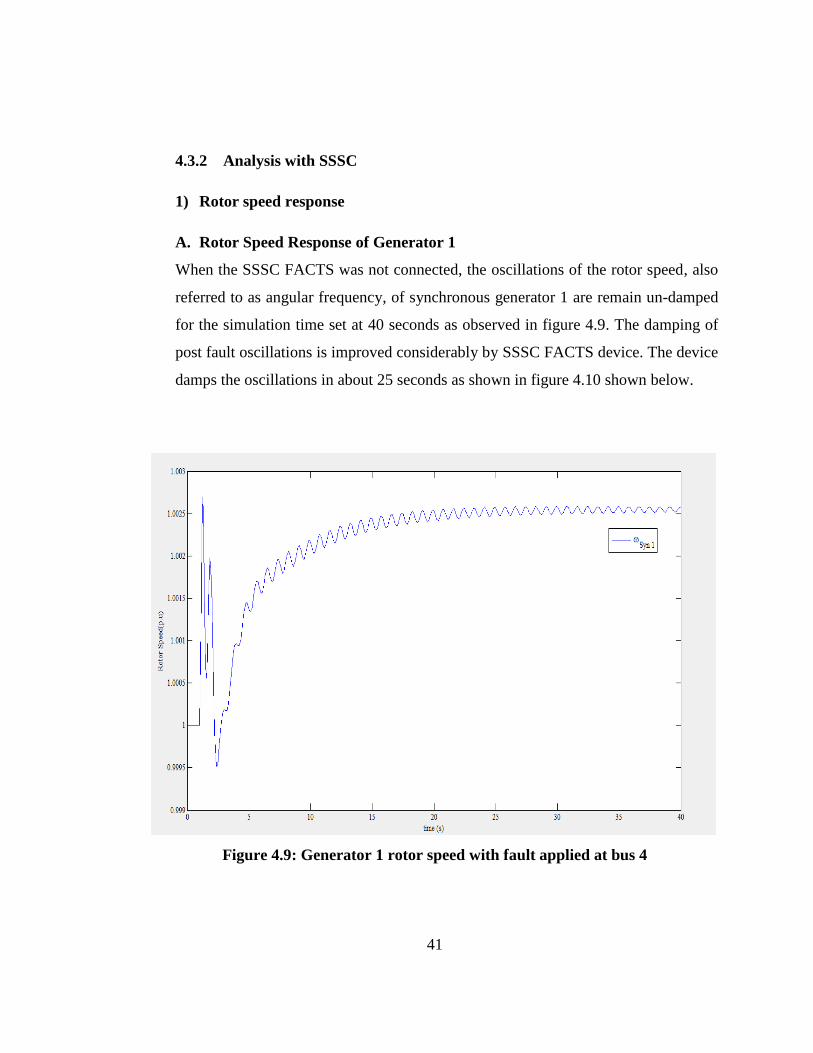
When the SSSC FACTS was not connected, the oscillations of the rotor speed, also
referred to as angular frequency, of synchronous generator 1 are remain un-damped
for the simulation time set at 40 seconds as observed in figure 4.9. The damping of
post fault oscillations is improved considerably by SSSC FACTS device. The device
damps the oscillations in about 25 seconds as shown in figure 4.10 shown below.
Figure 4.9: Generator 1 rotor speed with fault applied at bus 4

42
Figure 4.10: Generator 1 rotor speed, fault at bus 4 and SSSC at bus 14
B. Generator 3 real power response
Real power, P, response of synchronous generator 3 without UPFC is shown in
figure 4.11. Figure 4.12 displays the response with SSSC. Oscillations after fault
clearance at 1.25 seconds continue unsettled and go beyond the simulations ending
time set at 40 seconds. However, with SSSC the swings settle to steady state
operating condition at about 22 seconds at real power magnitude of about 0.4 p.u.

43
Figure 4.11: Generator 3 real power response, fault applied at bus 4
Figure 4.12: Generator 3 real power, fault applied at bus 4 and SSSC at Bus 14

44
4.3.3 Analysis with IPFC
C. Rotor speed responses
I. Rotor Speed Response of Generator 1
When the IPFC FACTS device is not connected at the weakest buses, the response
of the rotor speed of synchronous generator 1 oscillate beyond the simulation time of
40 seconds as observed in figure 4.13. The damping of post fault oscillations is
improved significantly by placing independent IPFC FACTS device at bus 04 and
14. The device damps the oscillations giving rotor speed settling time of about 25
seconds as shown in figure 4.14 shown below.
Figure 4.13: Generator 1 rotor speed for IEEE-14-bus system with fault at bus 4

45
Figure 4.14: Generator 1 rotor speed with fault applied at bus 4 and IPFC

46
D. Generator 4 reactive power response
A similar arrangement for reactive power response of synchronous generator 4
without IPFC is shown in figure 4.15. Figure 4.16 is an illustration of Q response
with IPFC. Oscillations after fault clearance at 1.25 seconds swung unstably beyond
the simulations ending time set at 30 seconds. However, with IPFC of independent
configuration (dual SSSC) the swings are damped steady state operating condition at
about 5 second as shown in figure 4.16. It can be observed that after fault clearance,
oscillations of rose to a peak of about 0.75p.u. IPFC has been utilized to damp
power transients efficiently as shown in figure 4.16.
Figure 4.15: Generator 4 reactive power response with fault applied at bus 4

47
Figure 4.16: Generator 4 reactive power response with fault and IPFC at bus 14
48
4.4 Analysis for more than one synchronous generator
While considering thee three generators, Time Domain Simulations are carried out
to assess the effectiveness of the three FACTS device models developed in this
work. Three-phase fault is has been simulated to provide the source of disturbance
with fault time occurring at 1.00 second cleared time at 1.25 seconds with and
without FACTS.
4.4.1 Generator rotor angle behaviour
Figures 4.17 to 4.20 illustrate the rotor angle behavior for three synchronous
generators 2, 4 and 5. They show the simulation results of rotor angle responses.
Without using the FACTS devices, the rotor angles keeps accelerating and go out of
synchronism as shown in figure 4.17. When the dynamic model with the FACTS is
simulated, the responses start decreasing. Generally, for the three generators, the
three FACTS decrease the acceleration of the rotor angles. For all of the three cases,
the rotor angle of generator 5 decreases the most followed by angle of generator 4
and the least decreasing rotor angle is that of the generator 2. The decrease is as a
result of damping characteristics of FACTS devices connected. It is more
pronounced with IPFC than SSSC and UPFC.

49
Figure 4.17: Rotor angle responses without FACTS, fault at bus 04
Figure 4.18: Rotor angle responses UPFC FACTS device, fault applied at bus 04

50
Figure 4.19: Rotor angle responses for SSSC, fault applied at bus 4
Figure 4.20: Rotor angle responses with IPFC, fault applied at bus 4

51
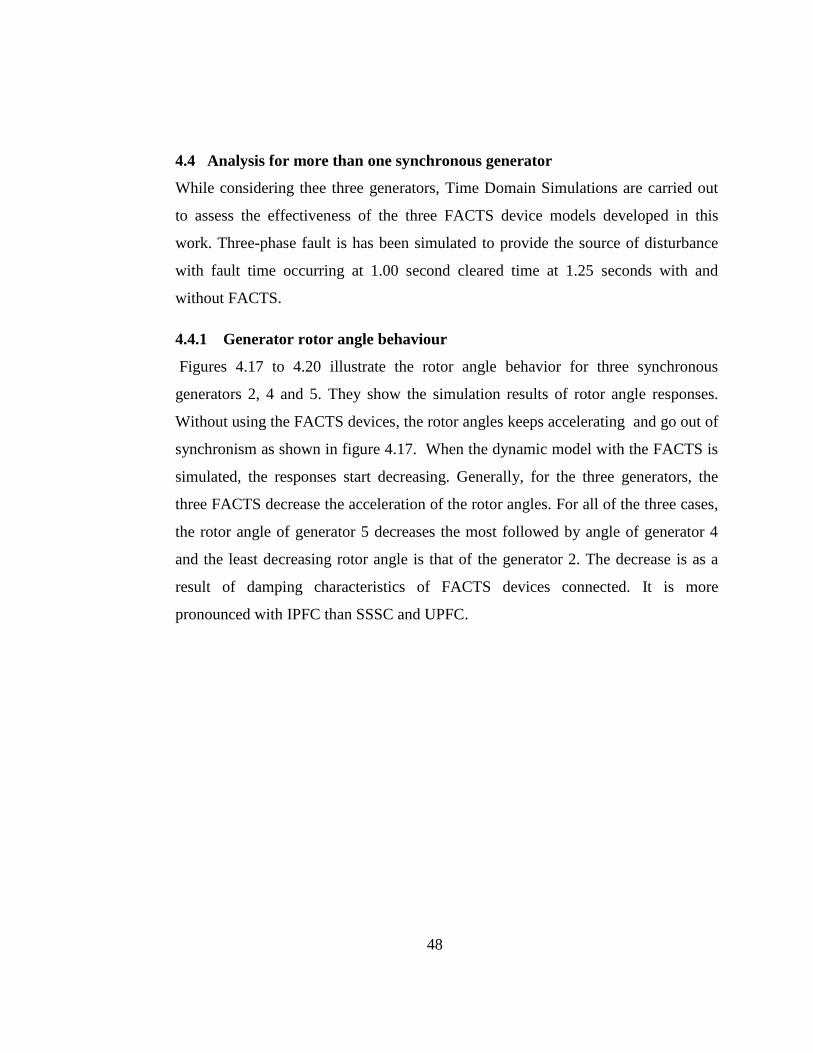
4.4.2 Q-axis component of voltage behind transient reactance responses
Responses of quadrature axis component of voltage behind transient reactance for
the three synchronous generators with and without FACTS are displayed in figure
4.22 to figure 4.25 below. With FACTS, the post fault oscillations are damped.
Overall, for the three generators, without facts the responses oscillate beyond the
simulation time. With FACTS, the oscillation is damped as follows, for UPFC and
SSSC, generator two and four at about 4 seconds and generator 5 at about 12
seconds. For IPFC devices, the oscillations are damped as follows; generators 2 and
4 at about 4 seconds and generator 5 at about 8 seconds. As observed, IPFC provides
overall better damping characteristics.
Figure 4.21: q-axis voltage component behind transient reactance responses
without FACTS

52
Figure 4.22: q-axis voltage component behind transient reactance responses with
UPFC
Figure 4.23: q-axis voltage component behind transient reactance responses
with SSSC
53
Figure 4.24: q-axis voltage component behind transient reactance responses with
IPFC
54
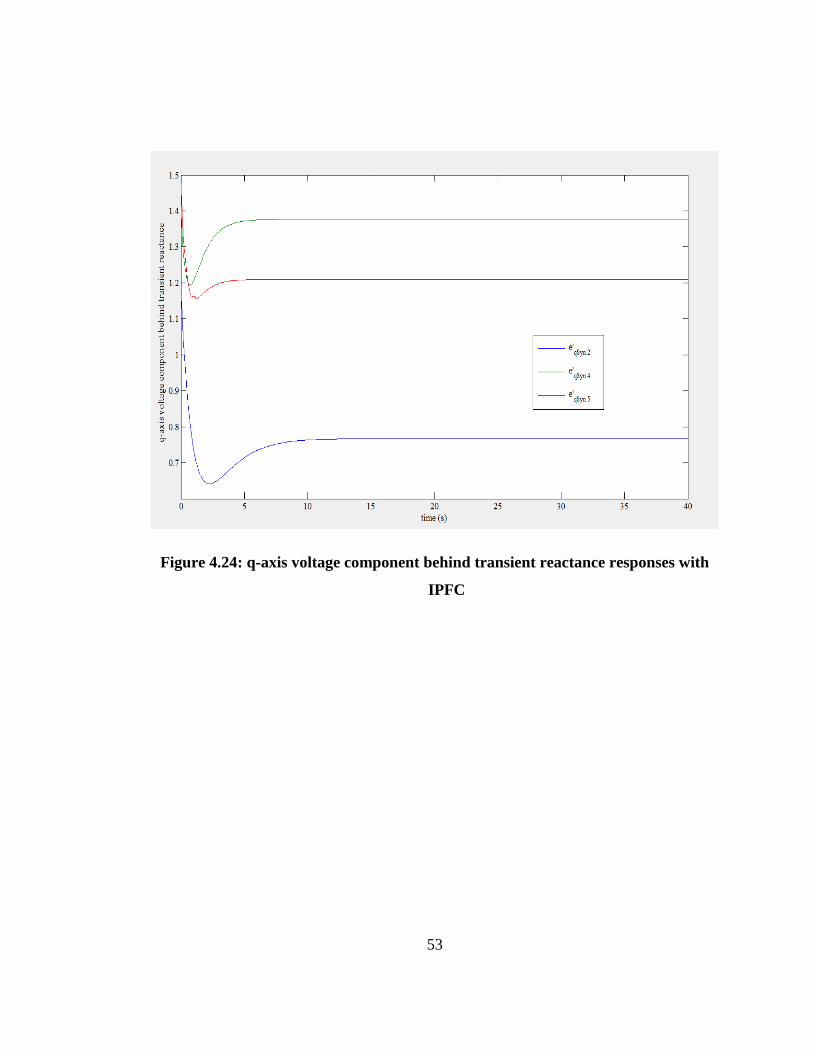
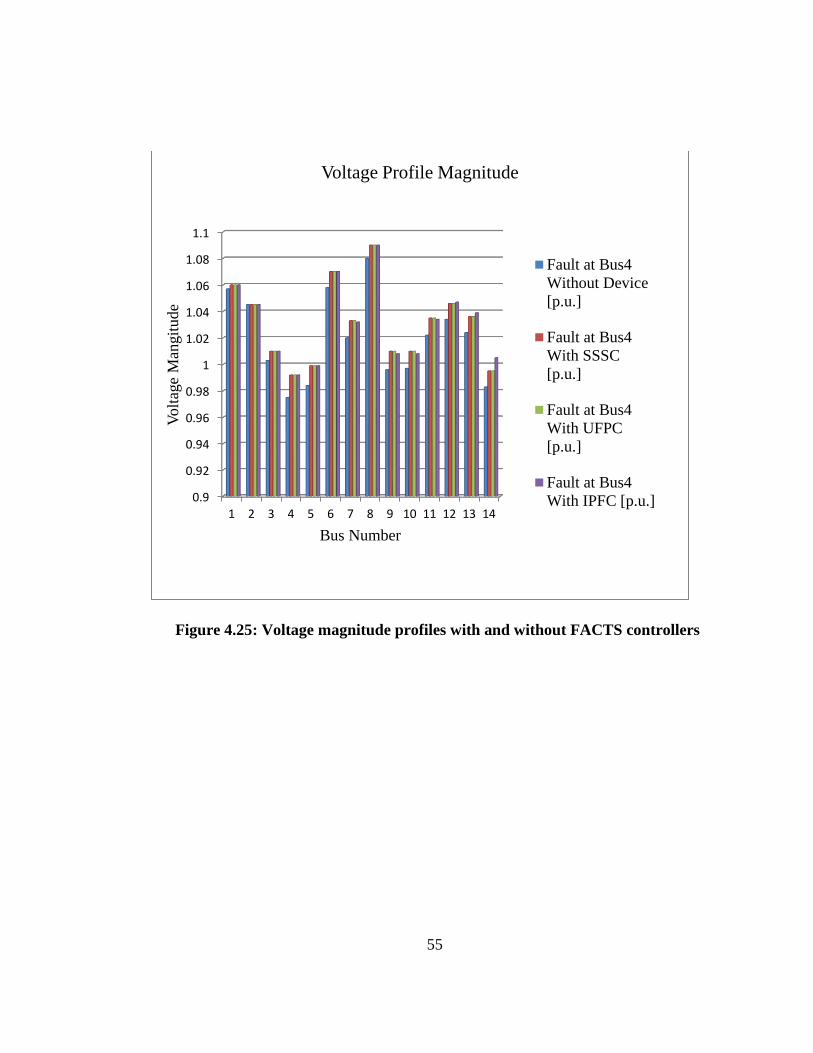
4.5 Voltage stability and loss reduction with FACTS
FACTS controllers: SSSC, IPFC and UPFC significantly enhance voltage stability.
It is evident that IPFC provides better voltage support than UPFC and SSSC as
shown in table 4.2 and figure 4.25 below. All the three FACTS reduce power losses
in poor networks with SSSC and UPFC by 0.03 p.u and IPFC by 0.14p.u hence
IPFC is best suited for loss reduction applications among the three devices.
Table 4.2: Voltage magnitude and real power losses
VOLTAGE MAGNITUDE AND REAL POWER LOSSES FROM PF REPORT
Bus Without fault
and
Device
Fault at Bus
4
Without
Device
Fault at Bus
4 With
SSSC
Fault at
Bus 4
With
UFPC
Fault at Bus
4 With
IPFC
[p.u.] [p.u.] [p.u.] [p.u.] [p.u.]
Bus 4 0.978 0.975 0.992 0.992 0.992
Bus 5 0.987 0.984 0.999 0.999 0.999
Bus 14 0.986 0.983 0.995 0.995 1.005
Real Power Losses 0.294 0.291 0.291 0.280
55
Figure 4.25: Voltage magnitude profiles with and without FACTS controllers
0.9
0.92
0.94
0.96
0.98
1
1.02
1.04
1.06
1.08
1.1
1 2 3 4 5 6 7 8 9 10 11 12 13 14
Volt
age
Man
git
ude
Bus Number
Voltage Profile Magnitude
Fault at Bus4
Without Device
[p.u.]
Fault at Bus4
With SSSC
[p.u.]
Fault at Bus4
With UFPC
[p.u.]
Fault at Bus4
With IPFC [p.u.]

56
CHAPTER FIVE
CONCLUSIONS AND RECOMMENDATIONS
5.1 Conclusions
The best location was determined using bus voltage magnitude profiles. The bus
with the least voltage profile or magnitude is best location. The standard IEEE 14
bus test system was used in this work. The suitable location/placement has been
effectively implemented through CPF P-V curves. FACTS devices best location in
IEEE 14 bus system was found to be bus 14 for placement of the three FACTS
controllers (UPFC, SSSC and IPFC). Time domain simulations were performed on
dynamic IEEE-14 bus system model. The analysis was done through specific and
comparative study with and without the three devices. It was observed that when
three phase fault occurs at bus 4 near the generator, synchronous machine
oscillations generated do not settle to steady state condition and makes the system
unstable for the simulation time under consideration.
Although individual compensations differ, all the three FACTS devices not only
damp the system oscillations of the multimachine system but also reduce the
oscillations transient periods accordingly. The transient state period of rotor speed
responses is longer than those of voltage responses hence FACTS provide better
support to system voltages compared to other parameters like rotor angle. To
achieve steady state operating condition after disturbances, UPFC and SSSC
exhibited similar oscillations damping characteristics for the variables studied. SSSC
and UPFC have better damping features for reactive power response, while IPFC
provide better damping for generator sub transient voltages, rotor angle and real
power oscillations compared than UPFC and SSSC. It’s evident that the damping
characteristics of the IPFC are comparatively superior to those of SSSC and IPFC.

57
It is unequivocal from this work that FACTS controllers play two key roles in power
networks. Firstly, FACTS have the merits of power flow control through injection
and/or absorption of voltage real and reactive power. Secondly, they enhance
transient stability. Thus, FACTS can be used to complement conventional power
system stabilizers since they have the extra advantage of damping oscillations after
occurrence of a fault. Thus, the simulations studies revealed that oscillations present
after occurrence of fault greatly reduces after the best placement of UPFC, SSSC
and IPFC. It is deduced that series compensators have superior damping of
oscillations’ properties compared to shunt ones.
It’s further construed that for the three FACTS controllers, IPFC provides
comparatively better voltage stability enhancement than UPFC and SSSC. All the
three FACTS reduce power losses in poor networks with SSSC and UPFC by
0.03p.u and IPFC by 0.14p.u hence IPFC is best placed for loss reduction
applications than the other three FACTS controllers. The results of this analysis
confirm the consistency of application and versatility of FACTS in transient
stability using other methods outlined in the literature review and goes further to
bring out the comparative advantages of the three FACTS (SSSC, UPFC and IPFC)
using PSAT TDS module.
5.2 Recommendations
The work developed throughout this thesis is a contribution to power system
stability research in the foreseeable future aiming at expanding research studies in
the dynamic analysis of power systems with FACTS devices. Suggestions are
hereby presented to develop new work undertakings taking this work as a starting
point. The future work should include introduction of the of renewable energy
technologies generator models like wind and solar for transient stability with these
devices. The use of integrated IPFC model and contrast its performance of the

58
independent model used in this work is also proposed. This is also feasible and
foreseeable.
PSAT technique and other power system simulation softwares like DigSilent Power
Factory and ETAP (Electrical Transient Analyzer Program), EuroStag and PSS/E
need to be compared for effectiveness of modeling power systems with these
controllers for the benefit of design, planning, and implementation of FACTS
devices compensation regimes. The comparative performance of integrated and
independent models of IPFC needs to be explored. Another task which is opined for
the future is superiority of series compensators to the shunt ones.
The economic analysis for application of the three FACTS controllers are also
recommended for impending future work.

59
REFERENCES
[1] A. Kumar and S. B. Dubey, “Enhancement of Transient Stability in
Transmission Line Using SVC Facts Controller”, International Journal of
Recent Technology and Engineering (IJRTE) ISSN: 2277-3878, Volume-2,
Issue-2, May 2013
[2] M.Karthik and P.Arul, “Optimal Power Flow Control Using FACTS Devices,’’
International Journal of Emerging Science and Engineering (IJESE) ISSN:
2319–6378, Volume-1, Issue-12, October 2013
[3] C. Makkar and L. Dewan, “Transient Stability Enhancement using Robust
FACTS Controllers- A Brief Tour”, Canadian Journal on Electrical &
Electronics Engineering Vol. 1, No. 7, December 2010
[4] A. Satheesh and T. Manigandan, “Maintaining power system stability with
FACTS controller using bees algorithm and NN”, Journal of Theoretical and
Applied Information Technology, Vol. 49 No.1, 10th March 2013
[5] M. Krishna and P. K. Rao, “Transient Stability Enhancement in Power System
Using DSSC and DSSC with FLC”, Journal of Electrical and Electronics
Engineering (IOSR-JEEE) ISSN: 2278-1676, PP 15-24 www.iosrjournals.or,
Volume 3, Issue 5 (Nov. - Dec. 2012)
[6] J. Machowski, J. W. Bialek and J. R. Bumby, Power System Dynamics and
Stability, John Wiley & Sons Ltd, 1997, ISBN, 1997.
[7] M. A. Abido, “Power System Stability enhancement using FACTS controllers:
a review”, The Arabian Journal for Science and Engineering, Volume 34,
Number 1B, April 2009

60
[8] K. Venkateswarlu and C. S. Babu, “Analysis and Enhancement of Transient
Stability using Shunt Controlled FACTS Controller”, International Journal of
Engineering Sciences Research-IJESR, http://technicaljournals.org, ISSN:
2230-8504; e-ISSN-2230-8512, Volume 01, Issue 02, May, 2011
[9] A. R. Sam and P.Arul, “Transient Stability Enhancement of Multi-machine
Power System Using UPFC and SSSC”, International Journal of Innovative
Technology and Exploring Engineering (IJITEE) ISSN: 2278-3075, Volume-3,
Issue-5, October 2013
[10] K. Vasudevan, “Maintaining Voltage Stability by Optimal Locating and Sizing
by Combined Evolutionary Algorithm, “International Journal of Computer
Applications 84(12):39-45, Volume 84 - Number 12, December 2013
[11] A. K. Mohanty and A.K. Barik, “Power System Stability Improvement Using
FACTS Devices”, International Journal of Modern Engineering Research
(IJMER), Vol.1, Issue.2, pp-666-672, ISSN: 2249-6645, May 2012
[12] B. Singh, K.S. Verma, P. Mishra, R. Maheshwari, U. Srivastava and A.
Baranwal, “Introduction to FACTS Controllers: A Technological Literature
Survey”, International Journal of Automation and Power Engineering, Volume
1 Issue 9, website: www.ijape.org December 2012
[13] T. Bhaskaraiah and G. U. Reddy, “Power system stability enhancement using
static synchronous series compensator(SSSC)”, International Journal of
Electrical, Electronic and Telecommunications , ISSN 2319 – 2518,
www.ijeetc.com , Vol. 2, No. 1, January 2013
[14] M. Ahsan, A. Murad, F. J. Gómez and L. Vanfretti, “Equation-Based Modeling
of FACTS using Modelica”, July 2013
61
[15] E. Acha, C. R. Fuerte-Esquivel, and H. Ambriz-Perez., FACTS: Modeling and
Simulation in Power Networks, London, U.K.: Wiley, 2004.
[16] S.S Darly, P. R. Vanaja and B. R. Justus, “Modeling, Simulation and Fault
Diagnosis of IPFC using PE.M.FC for High Power Applications, “Journal of
Electrical Engineering Technology, Vol. 8, No. 4: ppg. 760-765, 2013
[17] P. Kundur, Power System Stability and Control, New York: McGraw-Hill”,
1994.
[18] CIGRE Task Force, “Stability Terms and Definitions, “Definition and
Classification of Power System Stability”, IEEE CIGRE Task Force 38.02.05
Electra”, pp 2-10, 2002.
[19] A. Jhaetal, “Transient Stability Analysis using equal area criterion using
Simulink model”, pp. 2009.
[20] H. Saadat, Power System Analysis, New York: McGraw Hill, 1999.
[21] S.S. Vadhera, Power System Analysis and Stability, (Khanna publishers),
INDIA, 2003.
[22] B.R. Gupta, Power, System Analysis and Design, S. Chand and Company LTD,
INDIA 2009.
[23] A. Lopez and L. Alonso, “Modeling and Stability Analysis of Berlin
Geothermal Power Plant in El Salvador”, Master’s Thesis, University of Iceland
Reykjavik, pp. 3-56, April 2013.
[24] D. Aswani, R. Clarke-Johnson and G. Runyan, “The Impact of Hydroelectric
Power and Other Forms of Generation on Grid Frequency Stability for the

62
WECC Region”, in Proc. AGC-Stability-Paper Conference, pp. 3-15, June
2011.
[25] M. Basu, “ Optimal power flow with FACTS devices using differential
evolution”, International Journal of Electrical Power & Energy Systems,
Volume 30, Issue 2, February 2008, Pages 150–156
[26] B. Zhao, C. X. Guo and Y.J. Cao, “A multi agent-based particle swarm
optimization approach for optimal reactive power dispatch,” IEEE Transactions
on Power Systems 2005; Vol. 20: 1070-1078, 2005
[27] N. Mancer, B. Mahdad, K. Srairi and M. Hamed, “Multi Objective for Optimal
Reactive Power Flow Using Modified PSO Considering TCSC”, International
Journal of Energy Engineering, 2(4): 165-170, 2012
[28] K. Ravi, C. Shilaja, B. C. Babu, and D. P. Kothari, “Solving Optimal Power
Flow Using Modified Bacterial Foraging Algorithm Considering FACTS
Devices”, Journal of Power and Energy Engineering, Vol. 2, 639-64,2014
[29] P. Ramesh and M.D. Reddy, Loss reduction through optimal placement of
Unified Power-Flow Controller using Firefly Algorithm”, International Journal
of Advanced Research in Electrical, Electronics and Instrumentation
Engineering, Vol. 2, Issue 10, Oct. 2013
[30] A. Pahade and N. Saxena, “Transient stability improvement using shunt FACT
device (STATCOM) with Reference Voltage Compensation (RVC) control
scheme”, International Journal of Electrical, Electronics and Computer
Engineering, ISSN No. (Online): 2277-2626, Volume 2(1): 7- 12(2013)

63
[31] A. Kumar and A. Barik, “ Power System Stability Improvement Using FACTS
Devices”, International Journal of Modern Engineering Research
(IJMER),www.ijmer.com, Vol.1, Issue.2, pp-666-672 ISSN: 2249-6645
[32] N. M. Yasina and M. Al-eedanya, “Enhancement of Power System Transient
Stability Using Static Var Compensator”, International Journal of Current
Engineering and Technology ISSN 2277 – 4106, Vol.3, No.2 (June 2013)
[33] S. Singh, A. Ram, N. Goel and P. Kumar, “Transient Stability Enhancement of
Multi-Machine System Using FACTS Controllers”, International Journal of
Engineering Science and Innovative Technology (IJESIT), Volume 2, Issue 2,
March 2013
[34] M.A. Ashraf, S. Shojaeian and H.R. Koofigar, “Improving Transient Stability
of a Multi-Machine Power Network Using FACTS Devices and Nonlinear
Controller Tuned by PSO”, Research Journal of Applied Sciences, Engineering
and Technology, ISSN: 2040-7459; e-ISSN: 2040-7467, Vol. 5(1): 280-285,
2013
[35] H. Shirvayszadeh and M. Hayatdavoodi, “Transient Stability Enhancement
Using STATCOM with Adaptive Control”, International Journal of Software
and Hardware Research in Engineering, Volume 2, Issue1, January 2014
[36] T. Kaur1 and S. Kakran, “Transient Stability Improvement of Long
Transmission Line System by Using SVC”, International Journal of Advanced
Research in Electrical, Electronics and Instrumentation Engineering, Vol.1,
Issue 4, October 2012
[37] M. Khalilianetal., “Transient Stability Enhancement by DSSC with Fuzzy
Supplementary Controller”, Journal of Electrical Engineering & Technology,
Vol. 5, No. 3, pp. 415~422, 2010

64
[38] A. Pahade and N. Saxena, “Transient stability improvement by using shunt
FACT device (STATCOM), with Reference Voltage Compensation (RVC)
control scheme”, International Journal of Electrical, Electronics and Computer
Engineering, ISSN No. (Online): 2277-2626, Vol. 2(1): 7- 12, 2013
[39] A. Rai, “Enhancement of Voltage Stability and Reactive Power Control of
Multi-Machine Power System Using Facts Devices”, International Journal of
Engineering and Innovative Technology (IJEIT), Volume 3, Issue 1, July 2013
[40] B. T. R. Rao, “Power System Stability Enhancement Using Fact Devices’’, Int.
Journal of Engineering Research and Applications www.ijera.com ISSN: 2248-
9622, Vol. 4, Issue 4(Version 1), April 2014, pp.339-344
[41] R. K. Ahuja and M. Chankaya, “Transient Stability Analysis of Power System
with UPFC Using PSAT”, International Journal of Emerging Technology and
Advanced Engineering, Website:www.ijetae.com, (ISSN 2250-2459, ISO
9001:2008 Certified Journal, Volume 2, Issue 12, December 2012
[42] Z. Čonka and M. Kolcun, “Impact of TCSC on the Transient Stability”, Acta
Electrotechnica et Informatica, Vol. 13, No. 2, 2013, 50–53
[43] J. P. Therattil, “Dynamic Modeling and Control of Multi-Machine Power
System with FACTS Devices for Stability Enhancement, Ph.D. Thesis,
Department of Electrical Engineering, National Institute of Technology
Rourkela-769008 (Odisha), July 2012
[44] B. Mohamed and M. Mohamed, “improvement of Transient Stability of power
system by IPFC, SSSC and STATCOM”, Journal of Electrical Engineering,
www.jee.ro
65
[45] A. A. Nimje, C. K. Panigrahi and A. K. Mohanty, “Energy Function Based
Transient Stability Assessment of SSSC and IPFC”, International Electrical
Engineering Journal (IEEJ), Vol. 2 (2011) No. 2, pp. 543-549 ISSN 2078-
2365, 2011
[46] A.V. Babu and S. Sivanagaraju, “Multi-Line Flexible Alternating Current
Transmission System (FACTS) Controller for Transient Stability Analysis of a
Multi-Machine Power System Network”, World Academy of Science,
Engineering and Technology Vol: 5, 2011
[47] G. R. Krishnan and V. Gopalakrishnan, “Application of an interline power flow
controller as AGC”, Journal of Theoretical and Applied Information
Technology, Vol. 54 No.3, 31st August 2013
[48] P. Kumkratug, “Application of Interline Power Flow Controller to Increase
Transient Stability of Power System”, Journal of Computer Science, 6 (12):
1490-1493, 2010
[49] C. K. Rao, K. B Sahu, S. Yellampalli and B. B. Haskara, “Performance of a
Fuzzy Logic Based AVR in SMIB, MMIB System and Power Flow Control
Using SSSC and IPFC”, International Journal of Engineering Research and
Applications (IJERA) ISSN: 2248-9622 www.ijera.com, Vol. 2, Issue 1, Jan-Feb
2012, pp.260-268
[50] A. Samima and D. Priyanath, “Comparison of the Performance of IPFC and
UPFC FACTS Controller in Power System”, International Journal of Computer
Applications (0975 – 8887, Volume 67– No.2, April 2013
[51] S. Darly, V.Ranjan and J. Rabi, “Modeling, Simulation and Fault Diagnosis of
IPFC using PE.M.FC for High Power Applications”, Journal Electrical
Engineering Technology, Vol. 8, No. 4: 760-765, 2013
66
[52] S. Jiang, “Investigation of Small Signal Dynamic Performance of IPFC and
UPFC Devices Embedded in AC Networks”, Ph.D. Thesis, Department of
Electrical and Computer Engineering University of Manitoba Winnipeg,
Manitoba 2010
[53] L. Mathew and S. Chatterji, “Transient Stability Analysis of Multi-Machine
System Equipped with Hybrid Power Flow Controller”, IJCEM International
Journal of Computational Engineering & Management, Vol. 15 Issue 4, July
2012
[54] A. Murugan and S. Thamizmani, “A new approach for voltage control of IPFC
and UPFC for power flow management’’, IEEE transactions, 2013
[55] R. Shah, S. Gandhi and B. Trivedi, “Simulation and Performance Evaluation of
UPFC and IPFC for Power System Performance Enhancement”, International
Journal of engineering development and research, Vol.1 (2), Nov 2013
[56] H. N. Aghdam, “Analysis of Static Synchronous Series Compensators (SSSC),
on Congestion Management and Voltage Profile in Power System by PSAT
Toolbox”, Research Journal of Applied Sciences, Engineering and Technology
3(7): 660-667, 2011
[57] M. Dogan1, S. Tosun, A. Ozturk, and M. K. Dosoglu, “Investigation of TCSC
and SSSC Controller Effects on the Power System”, ELECO 2011 7th
International Conference on Electrical and Electronics Engineering, , Bursa,
TURKEY”, pp.128-132, 1-4 December
[58] G. El-Saady, A. Ahmed, E. Noby, and M. A. Mohammed, “Transient stability
improvement of multi-machine power system using UPFC tuned-based phase
angle particle swarm optimization”, Journal of Engineering Sciences Assiut
University Faculty of Engineering”, Vol. 42 No. 3, Pages: 722–745, May 2014

67
[59] C. A. Ca~nizares, “Power Flow and Transient Stability Models of FACTS
Controllers for Voltage and Angle Stability Studies”, IEEE/PES WM Panel on
Modeling, Simulation and Applications of FACTS Controllers in Angle and
Voltage Stability Studies, Singapore, Jan. 2000
[60] N. M. Yasin and M. M. Al-Eedany, “Enhancement of a Power System
Transient Stability Using Static Synchronous Series Compensator, SSSC,” Al-
Khwarizmi Engineering Journal, Vol. 9, No. 3, P.P. 26- 37 (2013)
[61] G. Panda and P.K. Rautraya, “Enhancement of Transient stability and
comparison of SSSC based damping controller using modified GA,”
International Journal of Emerging Technology and Advanced Engineering
Website: www.ijetae.com (ISSN 2250-2459, ISO 9001:2008 Certified Journal,
Volume 3, Issue 2, February 2013
[62] C. Anitha and P. Arul, “Modeling of SSSC and UPFC for Power Flow Study
and Reduce Power Losses”, International Journal of Science and Modern
Engineering (IJISME) ISSN: 2319-6386, Volume-1, Issue-11, October 2013
[63] A. Chaudhary and R.A. Jaswal, “Transient Stability Improvement of Multi
Machine Power System Using Static VAR compensator”, International Journal
of Electronic and Electrical Engineering, ISSN 0974-2174, Volume 7, Number
2 (2014), pp. 109-114
[64] M. K. Saini, N. K. Yadav and N. Mehra, “ Transient Stability Analysis of Multi
machine Power System with FACT Devices using MATLAB/Simulink
Environment”, IJCEM International Journal of Computational Engineering &
Management, Vol. 16 Issue 1, January 2013

68
[65] S. K. and S. S. Nagaraju, “Transient stability improvement using UPFC and
SVC,’’ARPN Journal of Engineering and Applied Sciences, VOL. 2, NO. 3,
JUNE 2007
[66] D.S. Babu, N. Sahu, P.S. Venkataramu and M.S. Nagaraj, “Development of a
New Model of IPFC for Power Flow in Multi-Transmission Lines”,
International Journal of Computer Applications (0975 – 8887), Volume 84 –
No 5, December 2013
[67] L. Mathew and S. Chatterji, “Transient Stability Analysis of Electrical Power
Systems by means of LabVIEW based Simulation of STATCOM”,
International Journal of Advances in Engineering Sciences Vol.1, Issue 2,
April, 2011
[68] R. D. Zimmerman C. E. Murillo-S_anchez, “Matpower Documentation and
User Manual”, Version 5.1, March 20, 2015
[69] F. Milano, “Power System Analysis Toolbox Documentation for PSAT”,
Version 2.1.9, September 6, 2014
[70] R. Patel, T. Bhatti and D. Kothari, “MATLAB/Simulink-based transient
stability analysis of a multimachine power system”, International Journal of
Electrical Engineering Education Vol.34, Issue 4, 2014
[71] J.R. Sutter, J. N. Nderu, C. M. Muriithi, “Placement of FACTS for Voltage
Profile Improvement and Loss Reduction”, International Journal of Emerging
Technology and Advanced Engineering (IJETAE, Volume 5 Issue 10, ISSN:
2250-2459, PP: 53 – 58, Volume 5, Issue 10, October 2015
[72] J. R. Sutter, J. N. Nderu and C. M. Muriithi, “Transient Stability Enhancement
with Application of FACTS Devices”, International Journal on Recent

69
Technologies in Mechanical and Electrical Engineering (IJRMEE), ISSN:
2349-7947, PP: 042 – 046, Volume 2, Issue 10, October 2015
[73] J. R. Sutter, J. N. Nderu and C. M. Muriithi, “Power System Oscillations
Damping and Transient Stability Enhancement with Application of SSSC
FACTS Devices”, European Journal of Advances in Engineering and
Technology (EJAET), ISSN: 2394 - 658X, PP: 073 - 079 Volume 2, Issue 11,
November 2015
[74] J. R. Sutter, J. N. Nderu and C. M. Muriithi, “Power System Oscillations
Damping and Transient Stability Enhancement with Application of SSSC and
IPFC FACTS Devices”, European International Journal of Science and
Technology (EIJST), ISSN: 2304-9693, PP: 085 – 096,Volume 4, Issue 09,
December 2015

70
APPENDICES
Appendix 1: Single line diagram of static IEEE 14-bus system

71
Appendix 2: Bus data of IEEE 14-bus system
Bus No Vm PG PL QL PGmin PGmax QGmin QGmax
1 1.06 0 0 0 0.5 2 -0.45 1
2 1.045 0.4 0.217 0.127 0.2 1 -0.4 0.5
3 1.07 0.1 0.112 0.075 0.2 1 -0.06 0.24
4 1.01 0 0.942 0.19 0 0 0 0.4
5 1.09 0 0 0 0 0 -0.06 0.24
6 1 0 0 0 0 0 0 0
7 1 0 0.295 0.166 0 0 0 0
8 1 0 0.076 0.016 0 0 0 0
9 1 0 0.478 -0.039 0 0 0 0
10 1 0 0.09 0.058 0 0 0 0
11 1 0 0.035 0.018 0 0 0 0
12 1 0 0.061 0.016 0 0 0 0
14 1 0 0.149 0.05 0 0 0 0

72
Appendix 3: Line data of IEEE 14-bus system
Line No From To R X Bsh Tap (full charging)
1 8 3 0 0.25202 0 0.962
2 9 6 0 0.20912 0 0.978
3 9 7 0 0.55618 0 0.969
4 1 8 0.05403 0.22304 0.0492 1
5 2 8 0.05695 0.17388 0.034 1
6 4 9 0.06701 0.17103 0.0346 1
7 9 8 0.01335 0.04211 0.0128 1
8 1 2 0.01938 0.05917 0.0528 1
9 2 4 0.04699 0.19797 0.0438 1
10 6 5 0 0.17615 0 1
11 2 9 0.05811 0.17632 0.0374 1
12 6 7 0 0.11001 0 1
13 7 10 0.03181 0.0845 0 1
14 3 11 0.09498 0.1989 0 1
15 3 12 0.12291 0.25581 0 1
16 3 13 0.06615 0.13027 0 1
17 7 14 0.12711 0.27038 0 1
18 10 11 0.08205 0.19207 0 1
19 12 13 0.22092 0.19988 0 1
20 13 14 0.17093 0.34802 0 1

73
Appendix 4: IEEE 14 bus generator data
GENERATOR G1 G2 G3 G4 G5
Power (MVA) 615 60 60 25 25
Voltage(kV) 69 69 69 18 13.8
Frequency (Hz) 60 60 60 60 60
Resistance,(ra) 0.00 0.0031 0.0031 0.0014 0.0014
Leakage (xl) 0.2396 0.00 0.00 0.134 0.134
d-axis reactances(Xd) 0.8979 1.05 1.05 1.25 1.25
d-axis reactances ( X’d) 0.6 0.1850 0.1850 0.232 0.232
d-axis reactances ( X’’d) 0.23 0.13 0.13 0.12 0.12
d-axis constants(T’d0) 7.4 6.1 6.1 4.75 4.75
d-axis constants(T’’d0) 0.03 0.04 0.04 0.06 0.06
q-axis reactances ( Xq) 0.646 0.98 0.98 1.22 1.22
q-axis reactances ( X’q) 0.646 .036 0.36 0.75 0.75
q-axis reactances ( X’’q) 0.4 0.13 0.13 0.12 0.12
q-axis constants(T’q0) 0.00 0.3 0.3 1.5 1.5
q-axis constants(T’’q0) 0.033 0.099 0.099 0.21 0.21
Inertia(M = 2H) 2*5.148 2*6.54 2*6.54 2*5.06 2*5.06
Damping(s) 2.00 2.00 2.00 2.00 2.00
Speed(Kw) 0.00 0.00 0.00 0.00 0.00
Power signals(Kp) 0.00 0.00 0.00 0.00 0.00
Percentage of active(p.u) 1.00 1.00 1.00 1.00 1.00
Reactive powers(p.u) 1.00 1.00 1.00 1.00 1.00
d-axis additional circuit
leakage time
constant(Taa)
0.00 0.00 0.00 0.00 0.00
Saturation coefficients(s) 0 0 0 0 0
Saturation coefficients(s) 0 0 0 0 0
Number of input signals 1 1 1 1 1
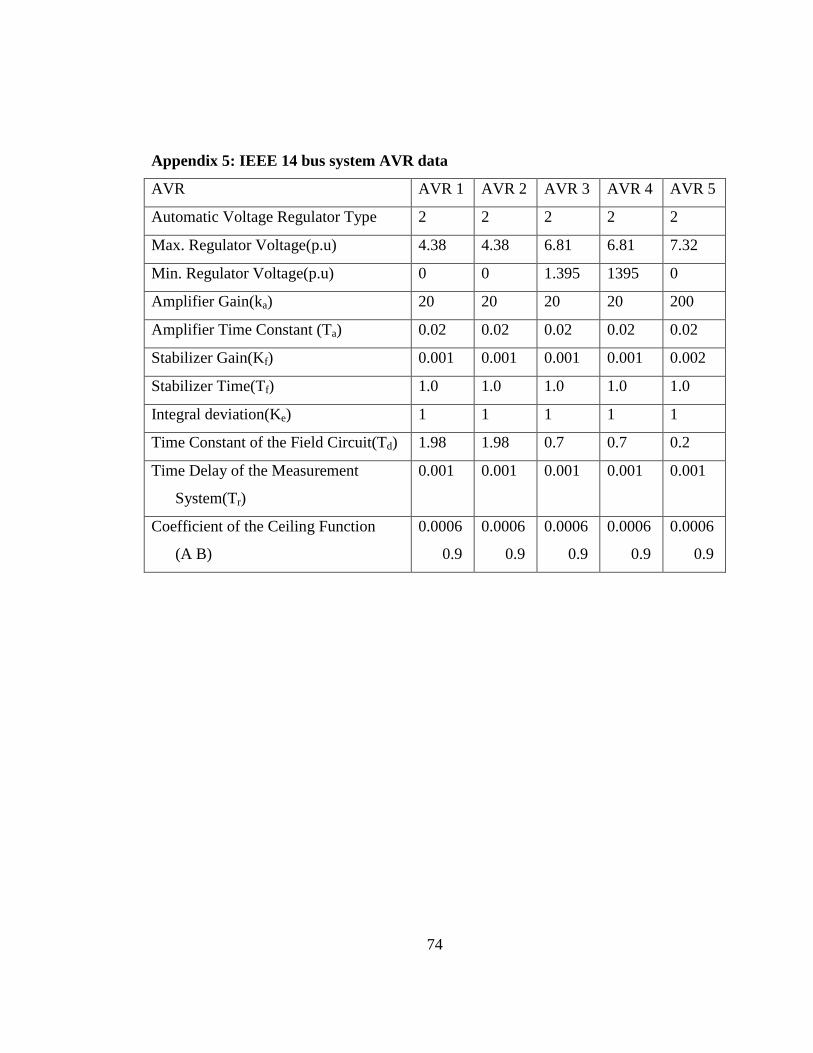
74
Appendix 5: IEEE 14 bus system AVR data
AVR AVR 1 AVR 2 AVR 3 AVR 4 AVR 5
Automatic Voltage Regulator Type 2 2 2 2 2
Max. Regulator Voltage(p.u) 4.38 4.38 6.81 6.81 7.32
Min. Regulator Voltage(p.u) 0 0 1.395 1395 0
Amplifier Gain(ka) 20 20 20 20 200
Amplifier Time Constant (Ta) 0.02 0.02 0.02 0.02 0.02
Stabilizer Gain(Kf) 0.001 0.001 0.001 0.001 0.002
Stabilizer Time(Tf) 1.0 1.0 1.0 1.0 1.0
Integral deviation(Ke) 1 1 1 1 1
Time Constant of the Field Circuit(Td) 1.98 1.98 0.7 0.7 0.2
Time Delay of the Measurement
System(Tr)
0.001 0.001 0.001 0.001 0.001
Coefficient of the Ceiling Function
(A B)
0.0006
0.9
0.0006
0.9
0.0006
0.9
0.0006
0.9
0.0006
0.9

75
Appendix 6: IEEE 14 bus compensator data
COMPENSATOR COMPENSATOR
1
COMPENSATOR
2
COMPENSATOR
3
Power(MVA) 100 100 100
Voltage(kV) 69 18 13.8
Voltage magnitude(p.u) 1.01 1.09 1.07
Qmax(p.u) 0.4 0.24 0.24
Qmin(p.u) 0.0 -0.06 -0.06
Vmax(p.u) 1.2 1.2 1.2
Vmin(p.u) 0.8 0.8 0.8
Loss Participation
Coefficients
1 1 1

76
Appendix 7: UPFC data
Power(MVA) 100
Voltage(kV) 230
Frequency Ratings(Hz) 60
Percentage of Series Compensation(Cp) 25
Gain(Kr) 50
Time constant(Tr) 0.1
Max (Vp) 1.15
Min(Vp) 0.85
Max(Vq) 1.15
Min(Vq) 0.85
Max(Iq) 1.1
Min(Iq) 0.9

77
Appendix 8: SSSC data
Power(MVA) 100
Voltage(kV) 230
Frequency Ratings(Hz) 60
Percentage of Series Compensation(Cp) 25
Regulator time constant(Tr) 0.1
Max. Voltage(p.u) 1.15
Min. Voltage(p.u) 0.85
Proportional Gains(Kp) 10
Integral gains(Ki) 50

78
Appendix 9: Equations for Modeling Synchronous machine
The dynamics of the stator winding, field winding, and damper windings are included in
the model. All stator and rotor quantities are expressed in the two-axis reference frame
(two-axis d–q frame). All rotor parameters and electrical quantities are referred to stator
and are represented by primed variables.
The mathematical equations are given by
Vd=RSid+ddtφd-ωRφq (1)
Vq=RSiq+ddtφq+ωRφd (2)
Vfd′=Rfd′ifd′+ddtφfd′ (3)
Vkd′=Rkd′ikd′+ddtφkd′ (4)
Vkq1′=Rkq1′ikq1′+ddtφkq (5)
Vkq2′=Rkq2′ikq2′+ddtφkq (6)
Where φd=Ldid+Lmd (ifd′+ikd′),
φq=Lqiq+Lmq+ikq′, φfd′=Lfd′ifd′+Lmd (id+ikd′),
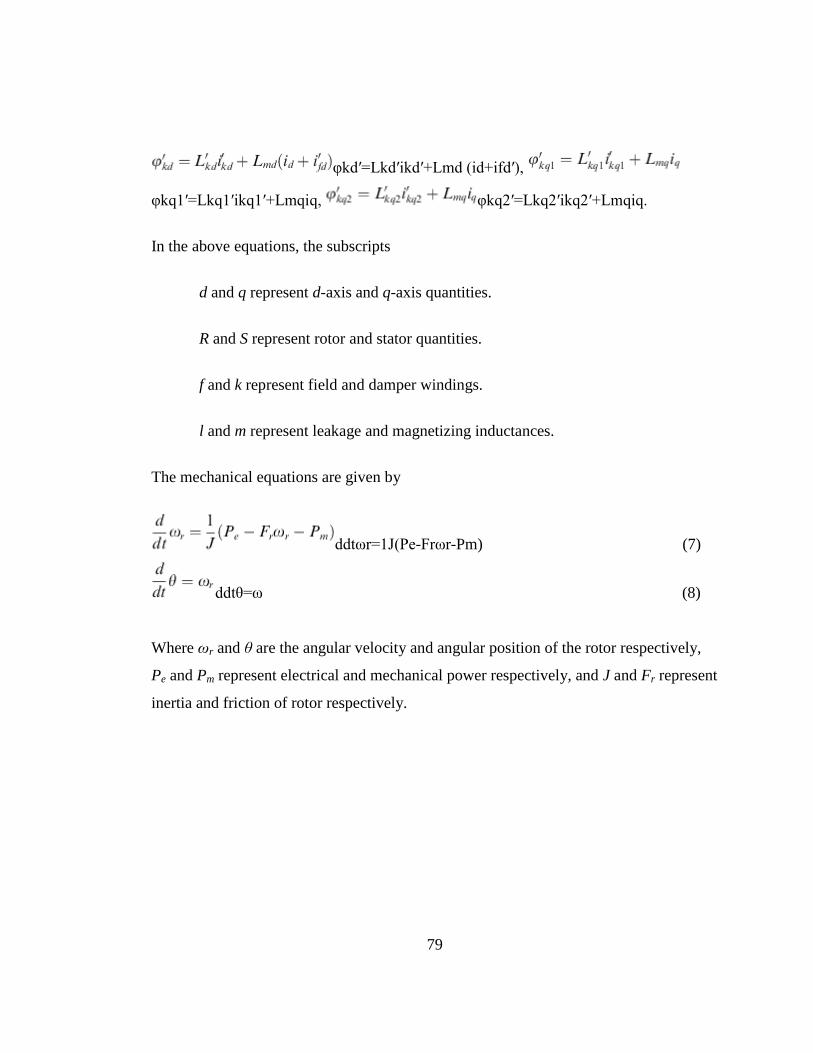
79
φkd′=Lkd′ikd′+Lmd (id+ifd′),
φkq1′=Lkq1′ikq1′+Lmqiq, φkq2′=Lkq2′ikq2′+Lmqiq.
In the above equations, the subscripts
d and q represent d-axis and q-axis quantities.
R and S represent rotor and stator quantities.
f and k represent field and damper windings.
l and m represent leakage and magnetizing inductances.
The mechanical equations are given by
ddtωr=1J(Pe-Frωr-Pm) (7)
ddtθ=ω (8)
Where ωr and θ are the angular velocity and angular position of the rotor respectively,
Pe and Pm represent electrical and mechanical power respectively, and J and Fr represent
inertia and friction of rotor respectively.

80
Appendix 10: Power flow Equations of FACTS devices
The power flow equations with FACTS is given by,
(1)
2 sin cos sin cosij i ij i j ij ij ij ij i se ij i se ij i seQ V b VV g b VV g b (2)
Appendix 11: Time domain report in PSAT
POWER FLOW RESULTS
Bus V phase P gen Q gen P load Q load
[p.u.] [rad] [p.u.] [p.u.] [p.u.] [p.u.]
Bus 01 1.05803 27.16298 3.520304 -0.28197 0 0
Bus 02 1.045723 27.03928 0.4 0.948602 0.3038 0.1778
Bus 03 1.003696 26.79922 8.88E-16 0.59736 1.3188 0.266
Bus 04 0.975418 26.83136 1.23E-14 1.62E-15 0.6692 0.056
Bus 05 0.984594 26.89136 -4.4E-15 2.29E-14 0.1064 0.0224
Bus 06 1.058936 26.73961 3.86E-15 0.444329 0.1568 0.105
Bus 07 1.020443 26.75938 1.84E-15 5.21E-15 0 0
Bus 08 1.080607 26.7588 -1.1E-16 0.334022 0 0
Bus 09 0.99707 26.72193 -8.2E-15 -8.9E-16 0.413 0.2324
Bus 10 0.997244 26.71808 1.53E-15 -5.7E-16 0.126 0.0812
Bus 11 1.022553 26.72609 7.49E-16 -1.2E-15 0.049 0.0252
2 sin cos sin cosij i ij i j ij ij ij ij i se ij i se ij i seP V b VV g b VV g b

81
Bus 12 1.03503 26.718 1.11E-15 9.75E-16 0.0854 0.0224
Bus 13 1.02504 26.71665 6.94E-16 -4.7E-16 0.189 0.0812
Bus 14 0.983328 26.6936 6.66E-16 -4.6E-16 0.2086 0.07
STATE
VARIABLES
delta_Syn_1 27.48554
omega_Syn_1 1.002577
e1q_Syn_1 1.087798
e2q_Syn_1 1.035646
e2d_Syn_1 0.127655
delta_Syn_2 26.79565
omega_Syn_2 1.002431
e1q_Syn_2 1.209946
e1d_Syn_2 0.000506
e2q_Syn_2 1.145613
e2d_Syn_2 0.000727
delta_Syn_3 27.28045
omega_Syn_3 1.002492

82
e1q_Syn_3 1.314976
e1d_Syn_3 0.142449
e2q_Syn_3 1.221713
e2d_Syn_3 0.221598
delta_Syn_4 26.75479
omega_Syn_4 1.002473
e1q_Syn_4 1.406525
e1d_Syn_4 -0.00046
e2q_Syn_4 1.244536
e2d_Syn_4 -0.00145
delta_Syn_5 26.73549
omega_Syn_5 1.002499
e1q_Syn_5 1.493844
e1d_Syn_5 -0.00018
e2q_Syn_5 1.277668
e2d_Syn_5 -0.00104
vm_Exc_1 1.058022
vr1_Exc_1 1.475705
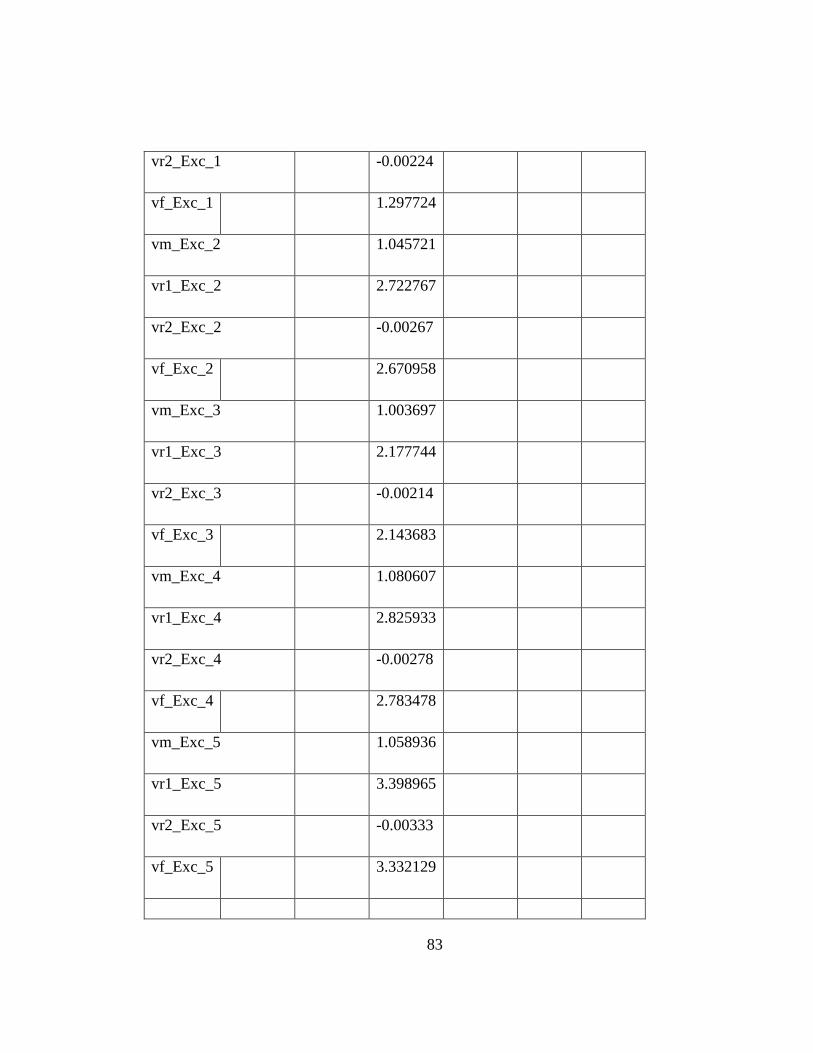
83
vr2_Exc_1 -0.00224
vf_Exc_1 1.297724
vm_Exc_2 1.045721
vr1_Exc_2 2.722767
vr2_Exc_2 -0.00267
vf_Exc_2 2.670958
vm_Exc_3 1.003697
vr1_Exc_3 2.177744
vr2_Exc_3 -0.00214
vf_Exc_3 2.143683
vm_Exc_4 1.080607
vr1_Exc_4 2.825933
vr2_Exc_4 -0.00278
vf_Exc_4 2.783478
vm_Exc_5 1.058936
vr1_Exc_5 3.398965
vr2_Exc_5 -0.00333
vf_Exc_5 3.332129
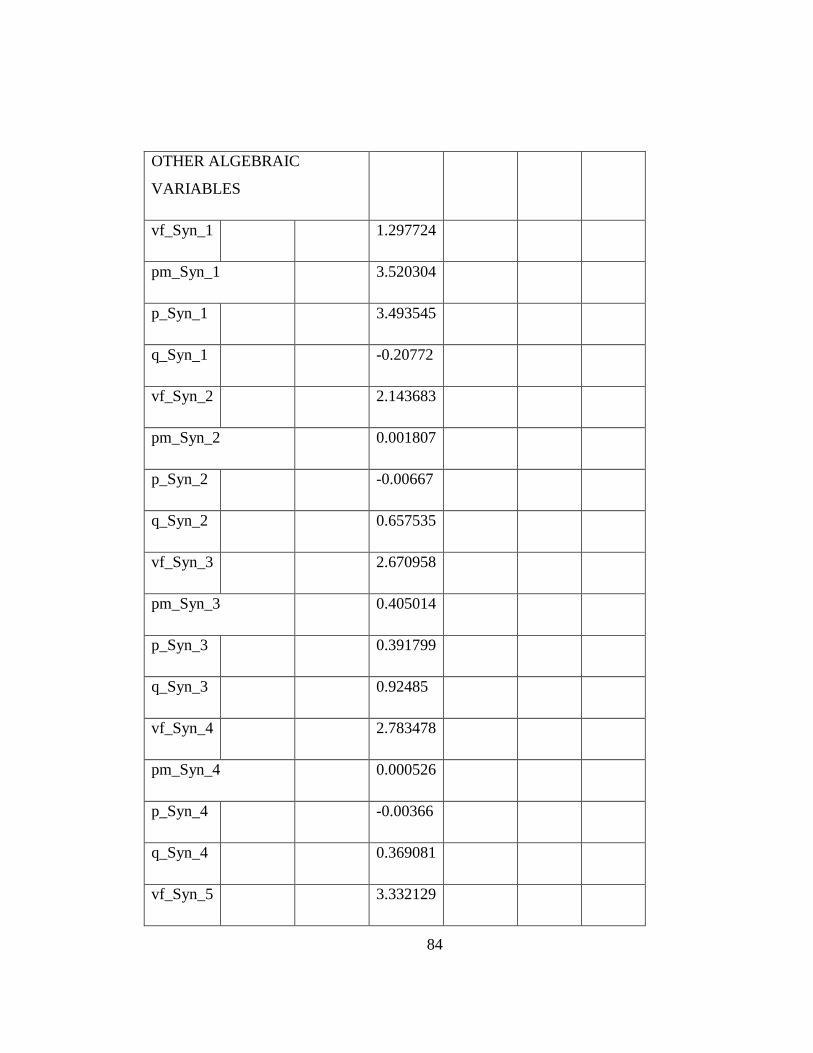
84
OTHER ALGEBRAIC
VARIABLES
vf_Syn_1 1.297724
pm_Syn_1 3.520304
p_Syn_1 3.493545
q_Syn_1 -0.20772
vf_Syn_2 2.143683
pm_Syn_2 0.001807
p_Syn_2 -0.00667
q_Syn_2 0.657535
vf_Syn_3 2.670958
pm_Syn_3 0.405014
p_Syn_3 0.391799
q_Syn_3 0.92485
vf_Syn_4 2.783478
pm_Syn_4 0.000526
p_Syn_4 -0.00366
q_Syn_4 0.369081
vf_Syn_5 3.332129

85
pm_Syn_5 0.000966
p_Syn_5 -0.00367
q_Syn_5 0.482578
vref_Exc_1 1.065623
vref_Exc_2 1.181848
vref_Exc_3 1.112638
vref_Exc_4 1.221944
vref_Exc_5 1.228917