Embed Size (px)
Citation preview
1
APPLICATION OF FLUIDISED BED COLUMN TESTING TO THE ASSESSMENT OF BEACHING AND SEGREGATION CHARACTERISTICS OF MINE TAILINGS
Gordon McPhail1, Jon Engels2 and Roxana Ugaz3
1. SLR Consulting Australia Pty Ltd, Australia)
2. Tailpro Consulting, Chile
3. SLR Consulting Australia Pty Ltd, Australia
ABSTRACT
A fluidised bed column test has been developed by the authors with the objective of obtaining data
on the segregation and segregated rheology of a tailings slurry as this flows down a beach on a
tailings facility. In making use of a column the loss of energy down the beach can be evaluated
more efficiently as gravity serves to reduce the energy in the flow stream in addition to friction and
viscous forces. Moreover, it is feasible to evaluate the characteristics of the flow stream under
laminar conditions. This paper describes the principles of the test, presents typical data, and shows
the results of the application of the data to beach prediction modelling.
INTRODUCTION
A slurry flowing down a beach undergoes changes in consistency and rheology as a result of
deposition of solids. There is a gradient of density with depth in the slurry stream with the slurry
at the depositing bed face at a higher density than the tailings at the surface of the stream. As a
result, the deposited tailings have a higher percentage of solids than the average of the flow stream
and therefore the deposited tailings entrains less water than the average in the flow stream.
Consequently the slurry percent solids progressively reduces with distance down the beach.
As the slurry percent solids reduces so does the rheology which, in turn, impacts both the beach
slope as well as the gravitational segregation characteristics of the slurry.
Measurement of the change s in slurry properties with distance down the beach presents practical
problems in terms of access to the slurry as well as representative sampling. And even if such
issues were overcome it would still not be possible to make predictions in Greenfields situations
where no tailings facility exists.
The authors have developed an approach that enables the measurement of the changing slurry
properties in a laboratory. The principles on which the approach is based are as follows:
• Particles in a non-homogeneous, settling slurry characteristic of mineral tailings slurries are
kept in suspension by energy in the flowing stream. This energy maintains shear stresses
that buoy the particles within the suspension.
2
• Energy is lost through friction and viscous effects in the flowing stream and with this loss
there is insufficient energy to continue to suspend all particles resulting in settling out of
solids and fluid. Indeed the rate of settling out is directly proportional to the rate of energy
loss.
• Energy is scalar (as opposed to a vector) ie it has no direction. The means that the energy
loss down a beach can be simulated using gravity in a vertical conduit with gravity
providing an additional component in the energy loss process without influencing the flow
regimes.
In essence, the authors postulate that the beach flow process can be simulated using a vertical
column. This is described in the next section.
FLUIDISED BED COLUMN
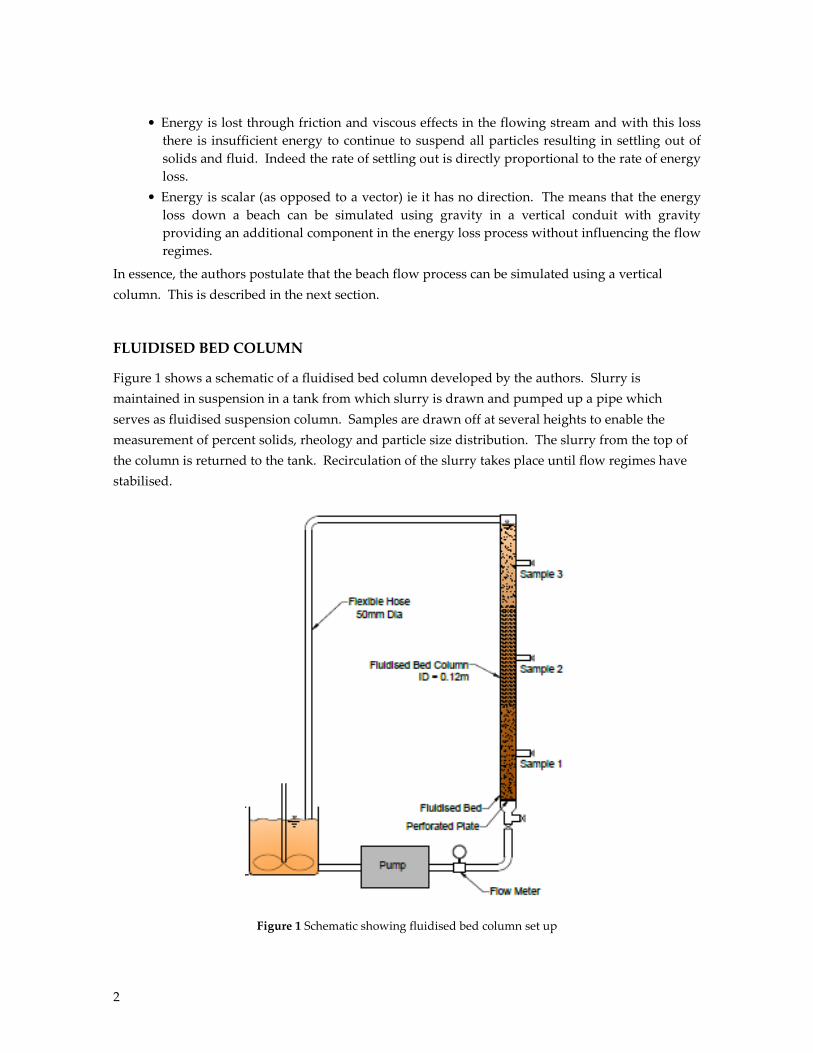
Figure 1 shows a schematic of a fluidised bed column developed by the authors. Slurry is
maintained in suspension in a tank from which slurry is drawn and pumped up a pipe which
serves as fluidised suspension column. Samples are drawn off at several heights to enable the
measurement of percent solids, rheology and particle size distribution. The slurry from the top of
the column is returned to the tank. Recirculation of the slurry takes place until flow regimes have
stabilised.
Figure 1 Schematic showing fluidised bed column set up
3
As the slurry flows up the column energy induced by the pump is lost through friction, viscous
effects as well as gravity. Stream power is energy per unit time and can be calculated from the
equation:
P = QρgH
(1)
P is the stream power, Q is the flow rate, ρ is the slurry density and H is the elevation above datum
which can be taken as the base of the column.
The loss of stream power means that not all particles can be suspended with increasing elevation in
the column. A sample drawn at a given elevation is therefore representative of the slurry at that
elevation and the percent solids, rheology and particle size distribution of the sample will be
representative of the slurry at that elevation. More importantly, the sample characteristics can be
related to the stream power at that elevation.
By sampling at a number of points changes in percent solids, rheology and particle size distribution
can be trended against stream power.
APPLICATION TO BEACH PREDICTION
The stream power-entropy method of beach prediction developed by McPhail [1995, 2008, and
2014] and Charlebois et al [2013] determines the beach profile from changes in stream power from
the discharge to the end of the beach. The value of the stream power at any point along the beach
as well as the change in stream power from point to point along the beach are applied together with
Bernoulli, continuity and force-momentum flux to determine the flow depth and velocity down the
beach. An iterative calculation process is employed friction and viscous force energy loss
determined from the slurry rheology. A closed solution is obtained when the calculated shear
stresses in the flow stream down the beach match the shear stresses from the flow curve at the same
shear rates.
Incorporation of the relationship between stream power and percent solids for the slurry at points
down the beach enables more accurate application of the appropriate rheology in the beach
simulation process. This is achieved by including correlations between percent solids and the
rheological parameters as obtained from rheological testing.
FLUIDISED BED COLUMN TESTING ON COPPER TAILINGS
Unflocculated copper tailings have been circulated through the column at three percent solids, 55%,
60% and 65% by weight. For each percent solids the following process has been followed:

4
• The tailings have been circulated for 40 minutes with samples recovered from the feed to
the column, the three sampled points up the column, and from the overflow from the
column, at 10, 20 and 30 minutes.
• Measurements of percent solids as well as rheology (using a rotary viscometer) have been
made on each of the samples.
• On samples from the three sample points up the column measurements of particle size
distribution and rheology using a flume rheometer supplemented by rotary viscometer
testing on samples from the flume rheometer have been carried out.
RESULTS
The results of the measurements made on the samples are summarised in the ensuing subsections.
The results only for the 30 minute samples are set out as it was found that the results were more
consistent indicating that the column takes time to stabilise.
Percent solids tests
Figure 2 shows the variation in percent solids with stream power calculated using equation 1 from
the elevation of the sampling point up the column, applying the slurry density determined from the
tests on the samples from the sample points, and subtracting the sampling flow rate from the prior
flow rate, for the 55%, 60% and 65% solids tests.
Figure 2 Variation of percent solids up the column
5
It is of interest to note that the variations are similar between percent solids samples and while not
insignificant, the variations with height up the column are relatively small for the sample tested. It
is likely, given the scatter of the results for the 55% solids test that the column had not yet stabilised
after 30 minutes
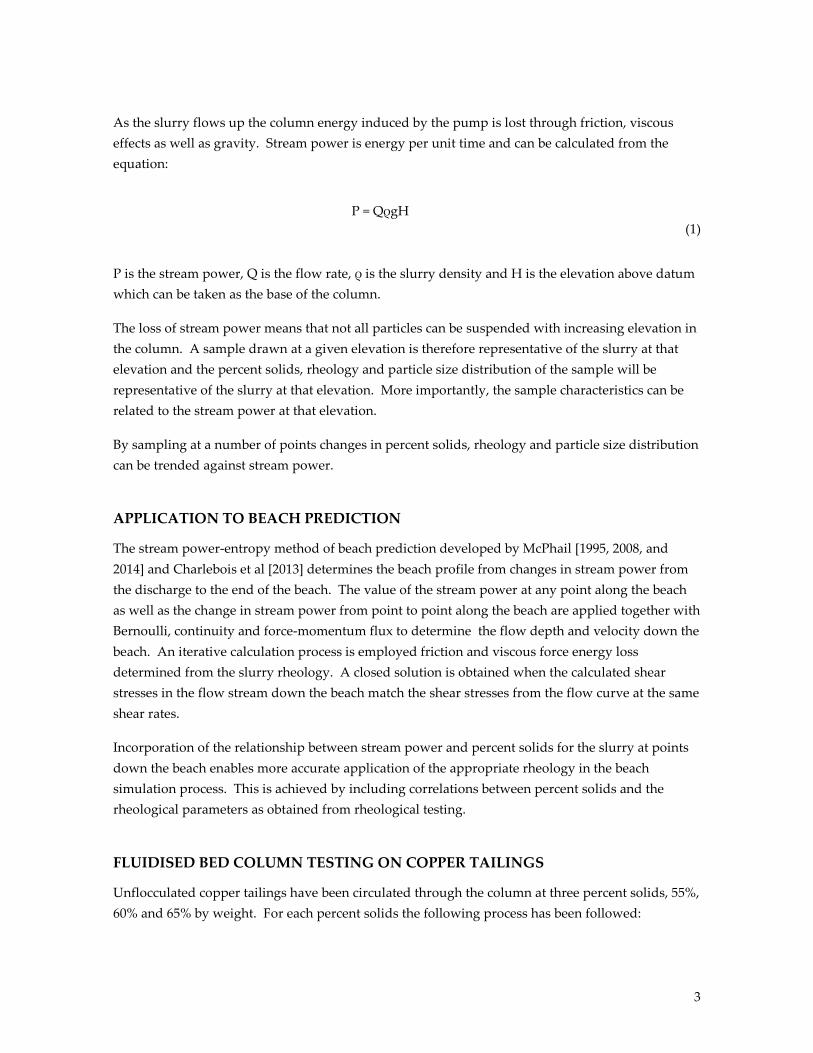
Particle size distribution tests
Figure 3 shows the results of particle size distribution tests on samples from the three sample points
for each percent solids tested.
Figure 3 Variation of particle size distribution up the column
It is evident that there is practically no segregation up the column. This is in line with observations
on copper tailings facilities where gravitational segregation is observed to be low.
Rotary viscometer tests
The results of rotary viscometer tests from which Bingham plastic parameters have been derived
are shown in Figure 4

6
Figure 4 Bingham parameters from rotary viscometer testing on the feed, column and overflow samples
It is evident that the change in percent solids has a measurable effect on the Bingham yield stress
and Bingham viscosity. The contrary trend for the 55% solids is a further indication that the
column had not stabilised.
Flume rheometer tests
Rotary viscometer tests are unreliable at low shear rates but are generally useful above 50s-1. Flume
rheometer testing enables the flow curve from 1 to 50s-1 to be estimated. A typical result is
indicated in Figure 5
7
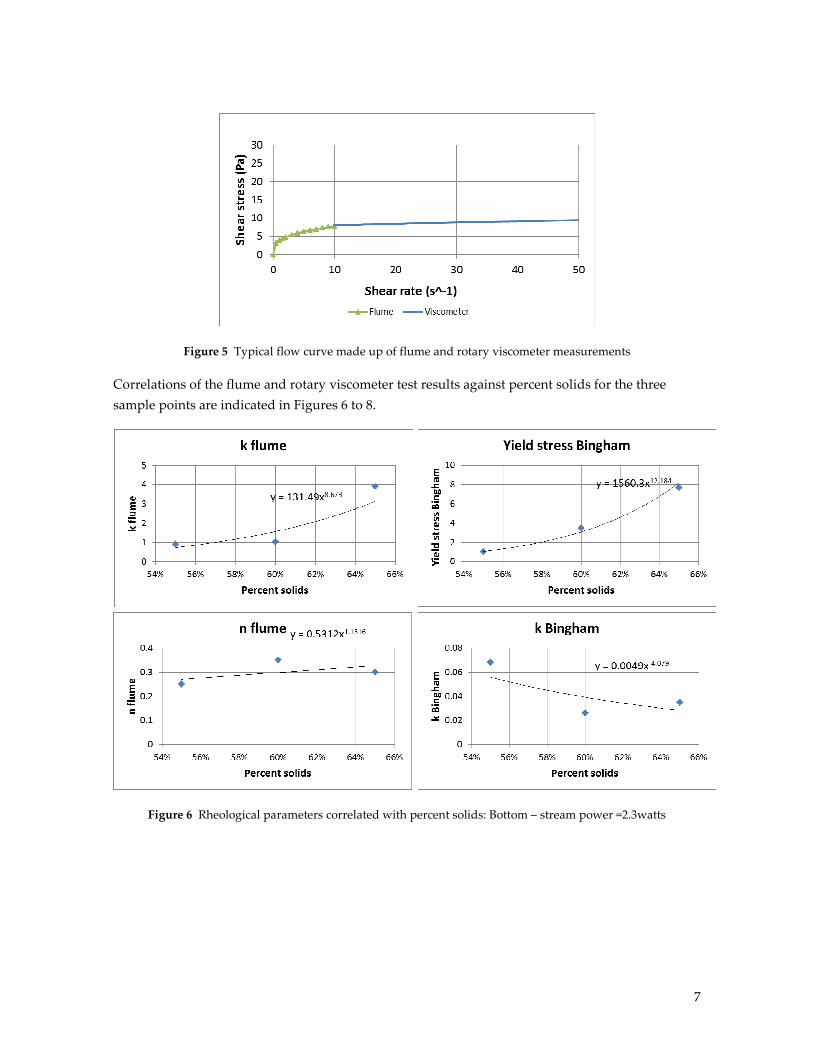
Figure 5 Typical flow curve made up of flume and rotary viscometer measurements
Correlations of the flume and rotary viscometer test results against percent solids for the three
sample points are indicated in Figures 6 to 8.
Figure 6 Rheological parameters correlated with percent solids: Bottom – stream power =2.3watts
8
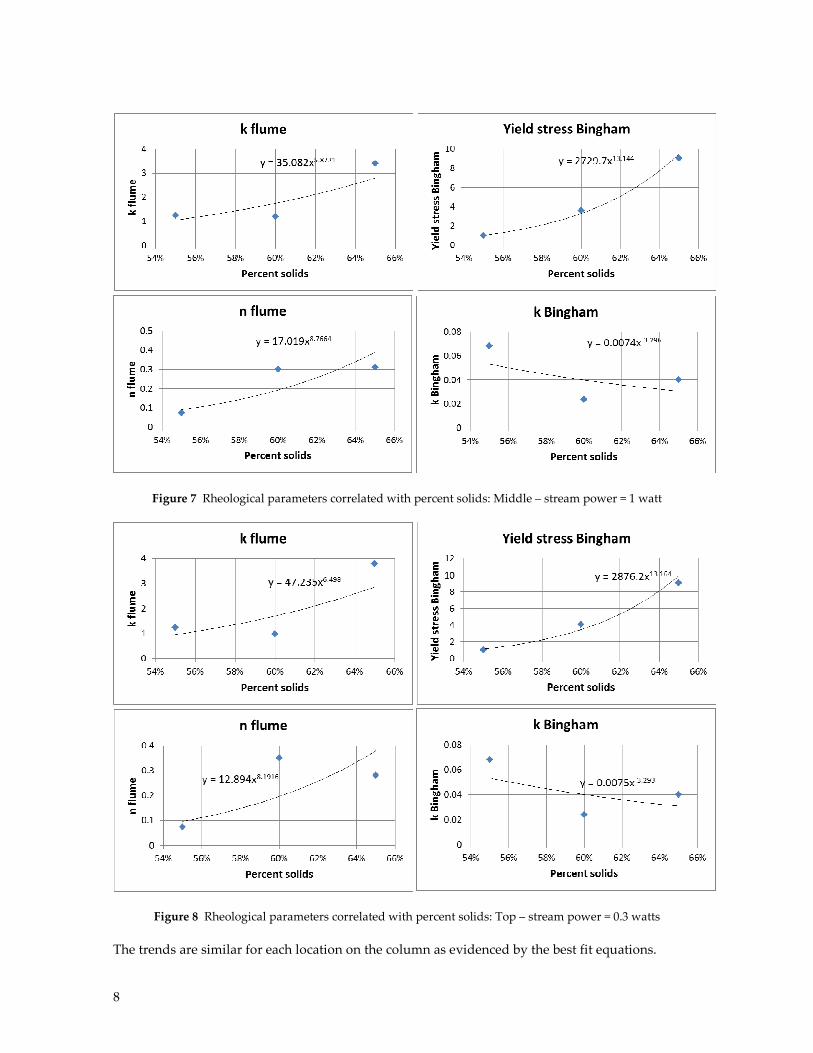
Figure 7 Rheological parameters correlated with percent solids: Middle – stream power = 1 watt
Figure 8 Rheological parameters correlated with percent solids: Top – stream power = 0.3 watts
The trends are similar for each location on the column as evidenced by the best fit equations.
9
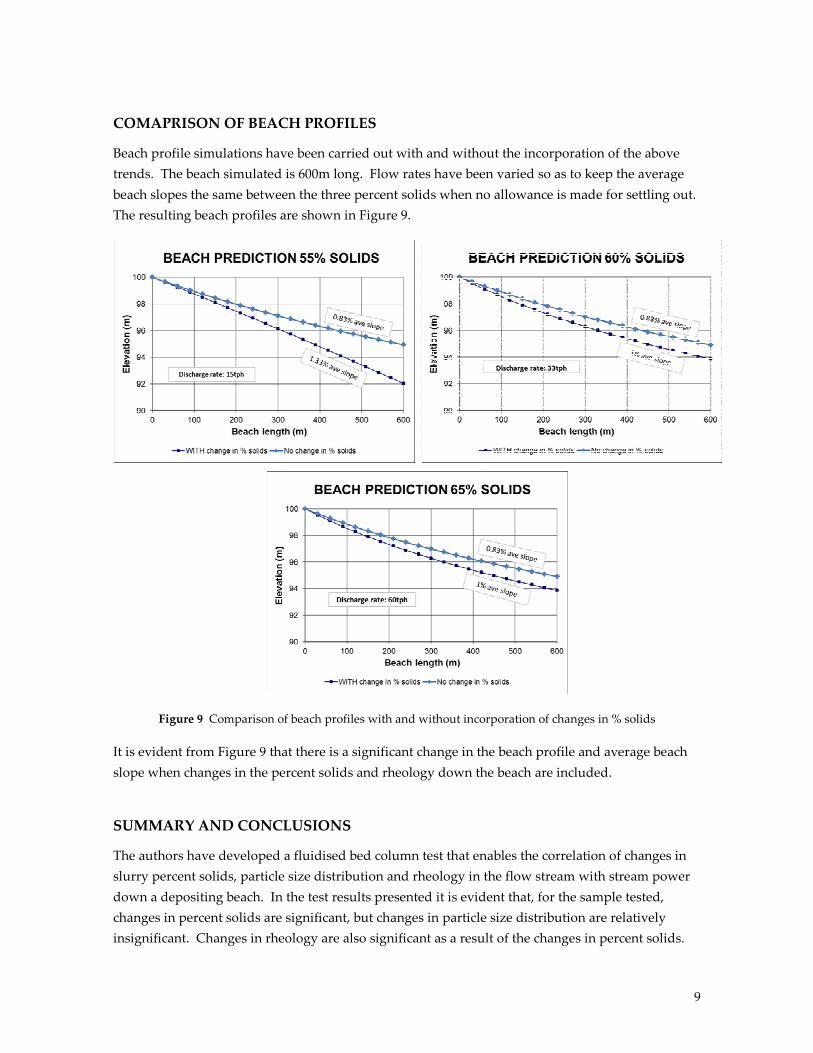
COMAPRISON OF BEACH PROFILES
Beach profile simulations have been carried out with and without the incorporation of the above
trends. The beach simulated is 600m long. Flow rates have been varied so as to keep the average
beach slopes the same between the three percent solids when no allowance is made for settling out.
The resulting beach profiles are shown in Figure 9.
Figure 9 Comparison of beach profiles with and without incorporation of changes in % solids
It is evident from Figure 9 that there is a significant change in the beach profile and average beach
slope when changes in the percent solids and rheology down the beach are included.
SUMMARY AND CONCLUSIONS
The authors have developed a fluidised bed column test that enables the correlation of changes in
slurry percent solids, particle size distribution and rheology in the flow stream with stream power
down a depositing beach. In the test results presented it is evident that, for the sample tested,
changes in percent solids are significant, but changes in particle size distribution are relatively
insignificant. Changes in rheology are also significant as a result of the changes in percent solids.

10
Variation in the percent solids and rheology with stream power has been incorporated into a
beaching simulation that is based on the stream power entropy approach. It is evident that the
impact of the changes on beach slope is significant.
AFTERWORD
The authors would like to note that the fluidised bed column test results are strongly slurry and
tailings dependent. Specifically clay minerals in the tailings solids have a significant effect on
segregation levels. This has been found in testing oil sands tailings using the same methodology as
described in this paper. There are, at this stage, restrictions on publishing this data.
REFERENCES
McPhail, G. (1995) Prediction of the Beaching Characteristics of Hydraulically Placed Tailings, PhD Dissertation submitted
to the University of the Witwatersrand, Johannesburg, South Africa.
McPhail, G. (2008) Prediction of the Beach Profile of High Density Thickened Tailings from Rheological and Small Scale
Trial Deposition Data, Proceedings 11th International Seminar on Paste and Thickened Tailings (Paste08), A.B.
Fourie, R.J. Jewell, P. Slatter and A. Paterson (eds), 5‒9 May 2008, Kasane, Botswana, Australian Centre for
Geomechanics, Perth, pp. 179–188.
McPhail, G. (2014) Using small scale flumes to determine rheology at low shear rates, Proceedings Second International
Seminar on Tailings Management, 20 – 22 August 2014, Antofagasta, Chile.
Charlebois, L.E., McPhail, G.I., Revington, A., and van Zyl, D. (2013) Observations of tailings flow and application of the
McPhail beach profile model to oil sands and metal mine tailings, Proceedings Tailings and Mine Waste 2013, 3 –
5 November, 2013, Banff, Calgary, Canada