Embed Size (px)
Citation preview

Spectroscopy 25 (2011) 243–250 243DOI 10.3233/SPE-2011-0509IOS Press
Application of FTIR spectroscopy coupledwith chemometrics for authentication ofNigella sativa seed oil
A.F. Nurrulhidayah a, Y.B. Che Man a,b,c,∗, H.A. Al-Kahtani c and A. Rohman d,e
a Halal Products Research Institute, Universiti Putra Malaysia, Serdang, Selangor, Malaysiab Department of Food Technology, Faculty of Food Science and Technology, Universiti Putra Malaysia,Serdang, Selangor, Malaysiac College of Food and Agriculture Science, Department of Food Science and Nutrition, King SaudUniversity, Riyadh, Saudi Arabiad Department of Pharmaceutical Chemistry, Faculty of Pharmacy, Gadjah Mada University,Yogyakarta, Indonesiae Halal Research Group, Gadjah Mada University, Yogyakarta, Indonesia
Abstract. The present study is intended to analyze the presence of grape seed oil (GSO) in Nigella sativa L. seed oil (NSO) us-ing Fourier transform infrared (FTIR) spectroscopy and gas chromatography (GC). FTIR spectroscopy coupled with multivari-ate calibration of partial least square can quantify the levels of GSO in NSO at wavelength number of 1114–1074, 1734–1382and 3005–3030 cm−1. The coefficient of correlation (R2) obtained for the relationship between actual (x-axis) and FTIR pre-dicted (y-axis) values are 0.981. The errors in cross validation and in prediction are 2.34% (v/v) and 2.37% (v/v), respectively.
Keywords: FTIR spectroscopy, grape seed oil, Nigella sativa L. seed oil, multivariate calibration
1. Introduction
Nigella sativa L. also known as black cumin has been consumed for centuries, especially in the MiddleEast and Southeast Asia. It has been widely distributed in Arab countries and other parts of the Mediter-ranean region [14]. This plant is one of the annual herbaceous plants that belong to Ranunculaceaefamily and widely known by various Arabic names such as ‘Al-Habba Al-Sawdaa’ or ‘Al-KammoonAl-Aswad’, ‘Habbet el Baraka’ and ‘Shunez’ [2].
Nigella sativa L. seed oils (NSO) is one of the most extensively studied oils in recent years as a naturalremedy for many ailments. NSO or extract has protective and curative actions. The extracts of NSOhave been used as a natural remedy for asthma, hypertension, diabetes, inflammation, cough, bronchitis,headache, eczema, fever, dizziness and influenza [1,22]. The seeds have been known to be carminative,stimulant, diuretic, emmenagogue and galactogogue, and used in treating fever [27]. In addition, theywere used as a condiment in bread and other dishes [19]. The lipid oil from the seed of NSO is rich inlinoleic and oleic acids which are believed to be good for human health [7].
*Corresponding author: Y.B. Che Man, Halal Products Research Institute, Universiti Putra Malaysia, 43400 Serdang,Selangor, Malaysia. Tel.: +603 8943 0405; Fax: +603 8943 9745; E-mail: [email protected]. Currently, visiting Professorat Department of Food Science and Nutrition, King Saud University, Riyadh 1145, Saudi Arabia.
0712-4813/11/$27.50 © 2011 – IOS Press and the authors. All rights reserved
244 A.F. Nurrulhidayah et al. / Application of FTIR spectroscopy coupled with chemometrics
The chemical composition of NSO is very rich and diverse. It contains amino acids, proteins, car-bohydrates, fixed and volatile oils [15]. The main active constituent of the volatile oil of the NSO isThymoquinone. Besides, NSO has pleasant taste and specific odor. NSO oil is 10–15 times more ex-pensive than other edible oils such as grape seed oil, walnut oil and soybean oil. This fact has led theunscrupulous market players to adulterate this oil with the cheaper oils to increase their economic profit.Therefore, the detection and quantification of NSO must be addressed to assure its quality and safety.
Various accurate and reliable methods such as chromatography as reviewed by [11], differential scan-ning calorimetry [8], electronic nose [18] and wet chemical methods have been continuously proposedand developed by researchers to detect the oil blended into the authentic oil in order to protect the con-sumers from economic loss and incorrectly labeled oils. Some of these methods are impractical and toolaborious. Therefore, rapid and accurate analytical methods must be developed in order to detect and toquantify the oil adulterants. In this study, we developed FTIR spectroscopy combined with chemometricsanalysis for such purpose.
FTIR spectroscopy has received great attention in quantitative analysis of fats and oils over the yearsdue to the main advantage of easy sample preparation with reduced or no-sample pre-treatment steps[28]. Its application to analysis of edible fats and oils can be considered as “green analytical chemistry”because this technique reduces or eliminates solvents and chemical reagents used in analysis whichmight be hazardous to human health and environment [21]. This technique has been successfully usedto analyze VCO in ternary mixture system with palm oil and olive oil [25], palm kernel oil [17], lard incod liver oil [24] and lard in animal fats [5].
Nowadays, the progress in computer technology and multivariate chemometric analysis has been fre-quently used in combination with FTIR spectroscopy for quantitative analysis [16]. In addition, the fattyacid compositions appear to be a useful technique for monitoring the adulteration practices of high priceoils [12]. In this research, we developed an FTIR spectroscopic method combined with multivariatecalibrations of PLS and PCR for quantitative analyses of NSO adulterated with GSO.
2. Experimental section
2.1. Materials
Nigella sativa L. seed oil (NSO) and other vegetable oils, including grape seed oil (GSO) were pur-chased from the local market in Selangor, Malaysia. These both oil samples were packaged in polyethy-lene terephthalate (PET) bottles and manufacturing date was identified as August 2010 and expirationdate was at July 2014. The standard of fatty acid methyl esters (FAMEs) of 37 compounds (C4 to C24)was bought from Sigma Chemicals, St. Louis, MO, USA. All chemicals and reagents used were ofanalytical grade.
2.2. Preparation of oil samples
For FTIR spectroscopy analysis, the calibration and prediction samples composed of binary mixturesof NSO and GSO were prepared separately in the concentration ranges of 0.5–60.0% (v/v).
2.3. Fatty acid analysis
Fatty acid (FA) compositions of NSO and other vegetable oils were determined using a gas chromato-graph (Shimadzu GC-2010, Shimadzu Corp., Tokyo, Japan), equipped with flame ionization detector.
A.F. Nurrulhidayah et al. / Application of FTIR spectroscopy coupled with chemometrics 245
The oven temperature was programmed as follows: the initial temperature was 100◦C (hold for 1 min),then ramped into 180◦C (8◦C/min), increased from 180 to 240◦C (10◦C/min) and finally held at 240◦Cfor 5 min. The temperatures of detector and injector were maintained at 240◦C during the analysis. Theflow rate of carrier gas (helium) was 6.8 ml/min. Before being analyzed, the samples of oils were treatedwith sodium methoxyde to form FAMEs forms according to method described by Chin et al. [9]. Thecolumn, oven and other conditions used during FA analysis are similar with those reported in Rohmanet al. [23]. The qualitative analysis of FAMEs in samples was carried out by comparing retention timesof the peaks with those of FAMEs standards. Quantification of FAs was performed using the techniqueof internal normalization and expressed as percentage based on peak areas.
2.4. Measurement of FTIR spectra
FTIR spectra of oil samples (either pure or admixtures) were measured using a Nicolet 6700 FTIRspectrometer (Thermo Nicolet Corp., Madison, WI, USA) equipped with deuterated triglycine sulphate(DTGS) detector and KBr/Germanium as beam splitter. The instrument was connected to the OMNICsoftware. The sampling compartment was a Smart Attenuated Total Reflectance accessory with dimen-sions of 10 × 60 mm, producing 12 internal reflections with a penetration depth (infrared beam) of2.0 µm, composed of zinc selenide (ZnSe) crystal having refractive index of 2.4 at 1000 cm−1. FTIRspectra were collected at mid-infrared region (4000–650 cm−1), using 32 scans at a resolution of 4 cm−1.These spectra were subtracted against the background of air spectrum. After every scan, a backgroundof new reference air spectrum was taken. These spectra were recorded as absorbance values at each datapoint in triplicate.
2.5. Statistical analysis
PCA of NSO and other oils using fatty acid profiles as variable matrix was performed with the aid ofThe Unscrambler version 9.7 software from Camo, USA. The multivariate calibration for FTIR spectraldata was done by TQ Analyst™ software included in FTIR spectrophotometer.
3. Results and discussion
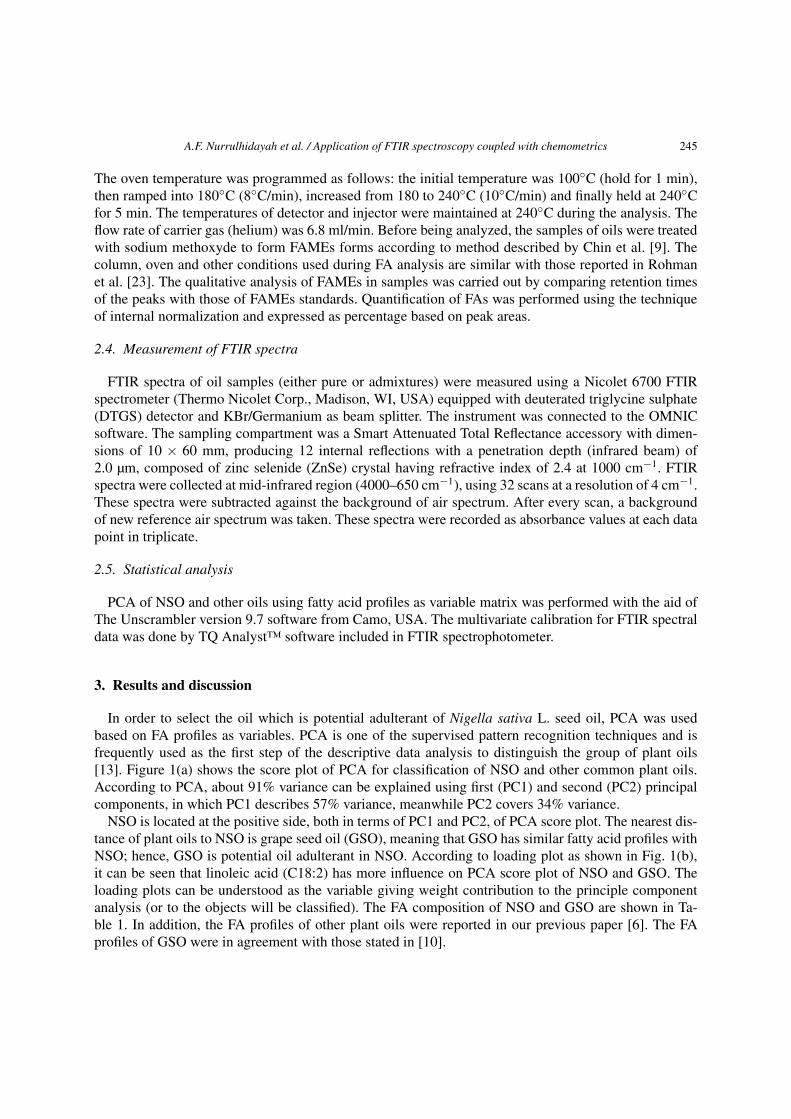
In order to select the oil which is potential adulterant of Nigella sativa L. seed oil, PCA was usedbased on FA profiles as variables. PCA is one of the supervised pattern recognition techniques and isfrequently used as the first step of the descriptive data analysis to distinguish the group of plant oils[13]. Figure 1(a) shows the score plot of PCA for classification of NSO and other common plant oils.According to PCA, about 91% variance can be explained using first (PC1) and second (PC2) principalcomponents, in which PC1 describes 57% variance, meanwhile PC2 covers 34% variance.
NSO is located at the positive side, both in terms of PC1 and PC2, of PCA score plot. The nearest dis-tance of plant oils to NSO is grape seed oil (GSO), meaning that GSO has similar fatty acid profiles withNSO; hence, GSO is potential oil adulterant in NSO. According to loading plot as shown in Fig. 1(b),it can be seen that linoleic acid (C18:2) has more influence on PCA score plot of NSO and GSO. Theloading plots can be understood as the variable giving weight contribution to the principle componentanalysis (or to the objects will be classified). The FA composition of NSO and GSO are shown in Ta-ble 1. In addition, the FA profiles of other plant oils were reported in our previous paper [6]. The FAprofiles of GSO were in agreement with those stated in [10].
246 A.F. Nurrulhidayah et al. / Application of FTIR spectroscopy coupled with chemometrics
(a)
(b)
Fig. 1. (a) PCA score plot for classification of NSO and other oils. SeO – sesame oil; CO – corn oil; RBO – rice bran oil; GSO –grape seed oil; PO – palm oil; PKO – pumpkin oil; EVOO – extra virgin olive oil; SO – soybean oil; SFO – sunflower oil;CaO – canola oil; WO – walnut oil; VCO – virgin coconut oil. (b) PCA score plot for classification of NSO and other oils infatty acid profiles. (Colors are visible in the online version of the article; http://dx.doi.org/10.3233/SPE-2011-0509.)

A.F. Nurrulhidayah et al. / Application of FTIR spectroscopy coupled with chemometrics 247
Table 1
The fatty acid compositions of Nigella seed oil (NSO) and grape seed oil (GSO)
FA† GSO NSOC14:0 0.121 ± 0.007 0.048 ± 0.001C16:0 9.219 ± 0.062 7.711 ± 0.038C18:0 2.741 ± 0.208 3.513 ± 0.013C18:1 36.498 ± 0.203 21.767 ± 0.011C18:2 47.805 ± 0.123 65.310 ± 0.164C18:3 0.307 ± 0.001 0.805 ± 0.008C20:0 0.332 ± 0.002 0.212 ± 0.001C20:1 0.580 ± 0.003 0.166 ± 0.001
Notes: FA – fatty acid; †each value in the table represents the means of triplicate analysis.
Fig. 2. FTIR spectra of Nigella sativa L. seed oil and grape seed oil at mid-infrared region range of 4000–650 cm−1. (Colorsare visible in the online version of the article; http://dx.doi.org/10.3233/SPE-2011-0509.)
3.1. Analysis using FTIR spectroscopy
Figure 2 exhibits FTIR spectra of NSO and GSO at mid-infrared region range of 4000–650 cm−1.FTIR spectra of both oils appear fairly similar. However, careful examination of FTIR spectra of bothoils reveals some significant differences either in number of peaks at region 1750–1700 cm−1 (assignedwith a) or in the peak intensities at frequencies of especially at 1117 and 1098 cm−1, marked with b inFig. 2. In the ranges of 1750–1700 cm−1, NSO has two sharp peaks in 1744 and 1710 cm−1; meanwhileGSO has one peak at 1744 cm−1. These peaks were attributed to carbonyl (C=O) stretching vibration[26]. The functional groups responsible for absorption of IR by the common edible fats and oils havebeen reported in our previous papers. These frequency regions were further optimized in order to quan-tify the level of GSO in NSO with the aid of multivariate calibration [4].
248 A.F. Nurrulhidayah et al. / Application of FTIR spectroscopy coupled with chemometrics
The first step in quantitative analysis using multivariate calibration involves the selection of frequencyregion. The frequency region selected should include information providing the concentration variationin oil of interest and other oils in the mixtures, while excluding of spectral regions dominated by noisethat might be built-in into the model [3]. This is carried out by computing the coefficient of correlation(R2) determining the peak absorbancies at selected frequency regions to the concentration of oils. FTIRspectral (frequency) regions contributed to the high correlation between the actual and FTIR predictedvalues (high R2) were selected; meanwhile regions that reveal low R2 should be ignored [4].
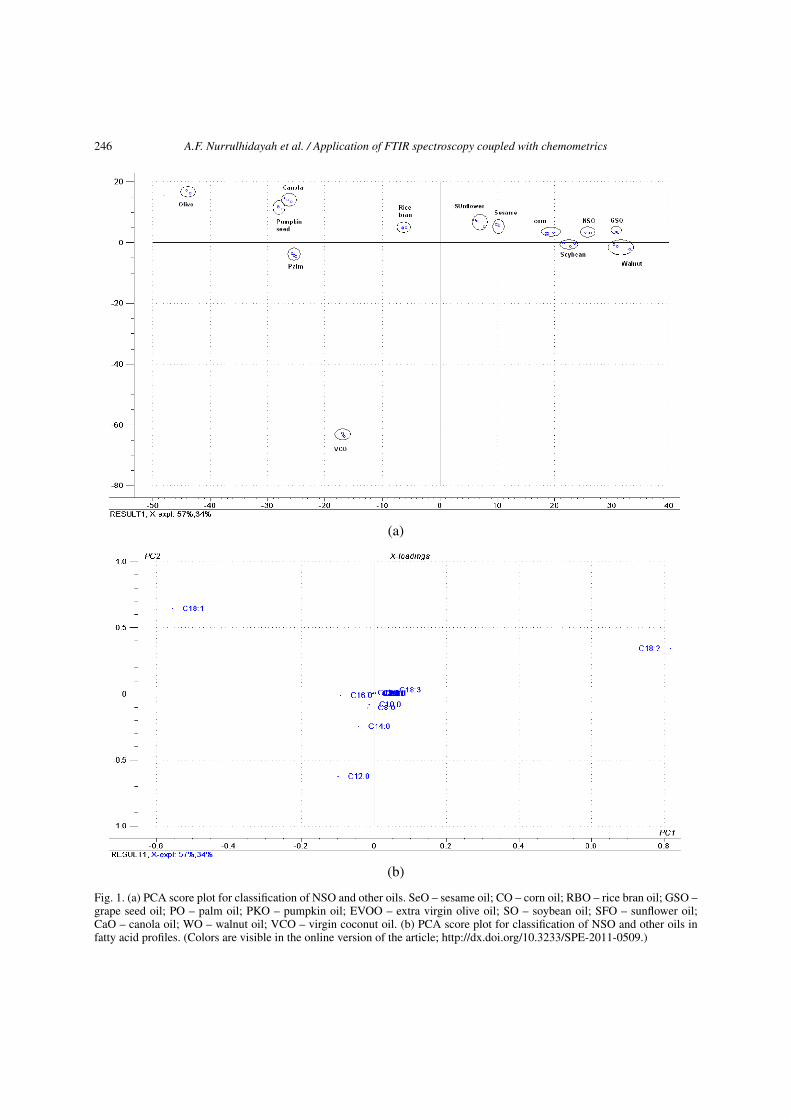
Taking into account the high R2 value (for the relationship between actual and calculated value us-ing FTIR spectra) and the lower error in calibration (expressed as root mean square error of calibrationor RMSEC), the combined wavelength number of 1114–1074, 1734–1382 and 3005–3030 cm−1 werechosen for analysis of GSO in NSO. Partial least square (PLS) model was exploited to facilitate the quan-titative analysis of GSO in NSO. The scatter plot describing this relationship together with the residualplot (difference between actual and calculated values) were shown in Fig. 3(a) and (b), respectively.
(a)
(b)
Fig. 3. (a) The scatter plot describing the relationship between actual (x-axis) and FTIR predicted (y-axis) values. (b) Theresidual (difference between actual and predicted values) of GSO. (Colors are visible in the online version of the article; http://dx.doi.org/10.3233/SPE-2011-0509.)
A.F. Nurrulhidayah et al. / Application of FTIR spectroscopy coupled with chemometrics 249
In order to check of the performance of the PLS calibration model, we used two approaches. Firstly,a cross validation using “leave-one-out technique” was explored. In this technique, one GSO samplein PLS calibration samples was removed. The remaining calibration samples were used to predict thelevel of removed samples and the error between actual and calculated values of the removed sample iscalculated. This process is repeated until all calibration samples were removed one by one. The totalerror, expressed as root mean square error of cross validation obtained is 2.34% (v/v) with R2 of 0.981.Secondly, we use a set of independent samples called as prediction/validation samples. PLS calibrationmodel was further used to evaluate the level of the prediction samples. The error, expressed as root meansquare error of prediction (RMSEP) obtained is 2.37% (v/v). The difference between actual and FTIRcalculated values of GSO in prediction samples was also included in Fig. 3(b).
PLS calibration model is also called “factor analysis”, because this technique relies on the linearcombination of the FTIR spectral variables called as factors or “principal components or PCs” rather thanoriginal spectra [20]. The software TQ Analyst was designed to select the number of PCs appropriate forquantitative analysis automatically. The number of PCs suggested is 6 because this number provides theminimum level of predicted residual error sum of square (PRESS) during cross validation for quantifyingGSO in NSO. Based on the results in terms of high value of R2 in calibration and prediction samples aswell as the low value of errors, it deems that FTIR spectra coupled with PLS is powerful enough for themonitoring the adulteration practice of GSO in NSO.
4. Conclusion
It can be concluded that the combination of two analytical techniques of FTIR spectroscopy and gaschromatography can be an effective mean for detecting the adulteration practice of NSO with GSO.Using FTIR spectroscopy, the levels of GSO can be quantified using the combined frequency regions of1114–1074, 1734–1382 and 3005–3030 cm−1 with the aid of partial least square.
Acknowledgement
The authors were grateful and would like to thank Universiti Putra Malaysia (UPM) for providing thefunding support awarded to Prof. Dr. Yaakob B. Che Man through RUGS 91032 grant.
References
[1] B.H. Ali and G. Blunden, Phytother. Res. 7 (2003), 299–305.[2] M. Burits and F. Bucar, Phytother. Res. 14 (2000), 323–328.[3] F. Cadet, D. Bertrand, P. Robert, J. Maillot, J. Dieudonne and C. Rouch, Appl. Spectrosc. 45 (1990), 166–170.[4] F. Cadet and M. de la Guardia, Quantitative analysis, infrared, in: Encyclopedia of Analytical Chemistry, R.A. Meyers,
ed., Wiley, New York, 2001, pp. 1–26.[5] Y.B. Che Man and M.E.S. Mirghani, J. Am. Oil Chem. Soc. 78 (2001), 753–761.[6] Y.B. Che Man, A. Rohman and T.S.T. Mansor, J. Am. Oil. Chem. Soc. 88 (2011), 187–192.[7] S. Cheikh-Rouhou, S. Besbes, B. Hentati, C. Blecker, C. Deroanne and H. Attia, Food Chem. 101 (2007), 673–681.[8] E. Chiavaro, E. Vittadini, M.T. Rodriguez-Estrada, L. Cerretani and A. Bendini, Food Chem. 110 (2008), 248–256.[9] S.-T. Chin, Y.B. Che Man, C.P. Tan and D.M. Hashim, J. Am. Oil Chem. Soc. 86 (2009), 949–958.
[10] Codex Alimentarius Commision, Standard for named vegetable oils, CX-Stan 210–1999, 2nd edn, Revised, Codex, 2001.[11] T. Cserhati, E. Forgacs, Z. Deyl and I. Miksik, Biomed. Chromatogr. 19 (2005), 183–190.
250 A.F. Nurrulhidayah et al. / Application of FTIR spectroscopy coupled with chemometrics
[12] V.G. Dourtoglou, T. Dourtoglou, A. Antonopoulos, E. Stefanou, S. Lalas and C. Poulos, J. Am. Oil. Chem. Soc. 80 (2003),203–208.
[13] O. Galtier, O. Abbas, Y. Le Dréau, C. Rebufa, J. Kister, J. Artaud and N. Dupuy, Vib. Spectrosc. 55 (2011), 132–137.[14] P.C.M. Jansen, Spices, Condiments and Medicinal Plants in Ethiopia, Their Taxonomy and Agricultural Significance,
Center for Agricultural Publishing and Documentation, Addis Ababa, 1981.[15] M.A. Khan, Inflammopharmacol. 7 (1999), 15–35.[16] N. Koca, N.A. Kocaoglu-Vurma, W.J. Harper and L.E. Rodriguez-Saona, Food Chem. 121 (2010), 778–782.[17] M.A. Manaf, Y.B. Che Man, N.S.A. Hamid, A. Ismail and Z.A. Syahariza, J. Food Lipids 14 (2007), 111–121.[18] A.M. Marina, Y.B. Che Man and I. Amin, J. Am. Oil. Chem. Soc. 87 (2009), 263–268.[19] I. Merfort, V. Wray, H.H. Barakat, S.A.M. Hussein, M.A.M. Nawwar and G. Willuhn, Phytochemistry 46 (1997), 359–
363.[20] J.N. Miller and J.C. Miller, Statistics and Chemometrics for Analytical Chemistry, Pearson Education Ltd, UK, 2005.[21] J. Namiésnik, J. Sep. Sci. 24 (2001), 151–153.[22] M.F. Ramadan, Int. J. Food Sci. Technol. 42 (2007), 1208–1218.[23] A. Rohman and Y.B. Che Man, J. Food Lipids 16 (2009), 618–628.[24] A. Rohman and Y.B. Che Man, J. Am. Oil Chem. Soc. 86 (2010), 1149–1153.[25] A. Rohman and Y.B. Che Man, Food Anal. Methods 4(2) (2011), 155–162.[26] A. Rohman and Y.B. Che Man, Food Res. Int. 43 (2010), 886–892.[27] S. Shah and K.S. Ray, J. Food Sci. Technol. 40 (2003), 70–73.[28] S.T.H. Sherazi, M. Ali and S.A. Mahesar, Vib. Spectrosc. 55 (2010), 115–120.

Submit your manuscripts athttp://www.hindawi.com
Hindawi Publishing Corporationhttp://www.hindawi.com Volume 2014
Inorganic ChemistryInternational Journal of
Hindawi Publishing Corporation http://www.hindawi.com Volume 2014
International Journal ofPhotoenergy
Hindawi Publishing Corporationhttp://www.hindawi.com Volume 2014
Carbohydrate Chemistry
International Journal of
Hindawi Publishing Corporationhttp://www.hindawi.com Volume 2014
Journal of
Chemistry
Hindawi Publishing Corporationhttp://www.hindawi.com Volume 2014
Advances in
Physical Chemistry
Hindawi Publishing Corporationhttp://www.hindawi.com
Analytical Methods in Chemistry
Journal of
Volume 2014
Bioinorganic Chemistry and ApplicationsHindawi Publishing Corporationhttp://www.hindawi.com Volume 2014
SpectroscopyInternational Journal of
Hindawi Publishing Corporationhttp://www.hindawi.com Volume 2014
The Scientific World JournalHindawi Publishing Corporation http://www.hindawi.com Volume 2014
Medicinal ChemistryInternational Journal of
Hindawi Publishing Corporationhttp://www.hindawi.com Volume 2014
Chromatography Research International
Hindawi Publishing Corporationhttp://www.hindawi.com Volume 2014
Applied ChemistryJournal of
Hindawi Publishing Corporationhttp://www.hindawi.com Volume 2014
Hindawi Publishing Corporationhttp://www.hindawi.com Volume 2014
Theoretical ChemistryJournal of
Hindawi Publishing Corporationhttp://www.hindawi.com Volume 2014
Journal of
Spectroscopy
Analytical ChemistryInternational Journal of
Hindawi Publishing Corporationhttp://www.hindawi.com Volume 2014
Journal of
Hindawi Publishing Corporationhttp://www.hindawi.com Volume 2014
Quantum Chemistry
Hindawi Publishing Corporationhttp://www.hindawi.com Volume 2014
Organic Chemistry International
ElectrochemistryInternational Journal of
Hindawi Publishing Corporation http://www.hindawi.com Volume 2014
Hindawi Publishing Corporationhttp://www.hindawi.com Volume 2014
CatalystsJournal of