Embed Size (px)
Citation preview
PACS №: 41.20.Jb
Richard J. YelfGeoradar Research Pty Ltd,412 Eastbank Road,Coramba, Coffs Harbour,NSW 2450, Australiae-mail: [email protected]: +61 266 544 162
Application of Ground Penetrating Radar to Civil and
Geotechnical Engineering
Contents
1. Introduction 103
2. Appropriate Application Targets 104
3. Planning of GPR Surveys 1063.1. Review of existing material . . . . . . . . . . . . . . . . . . . . . . . . . . . . . . . . . . . . . . . . 1063.2. Choice of transmitting frequency . . . . . . . . . . . . . . . . . . . . . . . . . . . . . . . . . . . . . 1063.3. Arrangement of survey lines . . . . . . . . . . . . . . . . . . . . . . . . . . . . . . . . . . . . . . . . 1073.4. Depth of investigation . . . . . . . . . . . . . . . . . . . . . . . . . . . . . . . . . . . . . . . . . . . 108
4. Conducting Field GPR Measurements 1084.1. Equipment required . . . . . . . . . . . . . . . . . . . . . . . . . . . . . . . . . . . . . . . . . . . . 1084.2. Preparation for the GPR survey . . . . . . . . . . . . . . . . . . . . . . . . . . . . . . . . . . . . . 1084.3. Field survey procedure . . . . . . . . . . . . . . . . . . . . . . . . . . . . . . . . . . . . . . . . . . . 1094.4. Assessment of measurement results . . . . . . . . . . . . . . . . . . . . . . . . . . . . . . . . . . . . 1104.5. Safety aspects . . . . . . . . . . . . . . . . . . . . . . . . . . . . . . . . . . . . . . . . . . . . . . . . 110
5. Data Processing 1105.1. Production of survey location plan . . . . . . . . . . . . . . . . . . . . . . . . . . . . . . . . . . . . 1105.2. Production of GPR sections . . . . . . . . . . . . . . . . . . . . . . . . . . . . . . . . . . . . . . . . 110
6. Data Analysis 111
7. Interpretation 1127.1. Collation of existing information and calibration of GPR data . . . . . . . . . . . . . . . . . . . . . 1127.2. Interpretation of results . . . . . . . . . . . . . . . . . . . . . . . . . . . . . . . . . . . . . . . . . . 112
8. Outcomes of Survey and Reporting 115
9. Future Developments 116
10.Conclusion 116
Abstract
Ground Penetrating Radar (GPR) is an imaging technique that uses wide-band nonsinusoidal electromagneticwaves to produce high-resolution images of the subsurface typically from 0-–10 m depth. GPR is an effective toolfor subsurface inspection and quality control on engineering construction projects. The survey method is rapid,nondestructive and noninvasive. GPR has been successfully applied to a very wide range of tasks ranging frommapping geological structures, to identifying defects in concrete.
102
Application of Ground Penetrating Radar to Civil and Geotechnical Engineering
1. Introduction
GPR is a subsurface imaging method that provideshigh-resolution information to a depth of typically 0–10 m, although depths up to 40 m (Franke & Yelf 2003,Jol 2003, Bakker 2004) are possible in some geologicalenvironments. GPR was first put to practical use inthe 1970’s for ice sounding in Antarctica and has sincegained wide acceptance internationally. The techniqueis nondestructive and noninvasive, utilizing low-powernonsinusoidal electromagnetic waves with frequenciesranging from 10 MHz to 4 GHz. GPR may be appliedto a wide range of inspection tasks, for example todetect buried services (pipes, cables), for inspection oflayering in roads and railway ballast, or for detailedmapping of steel reinforcing in concrete structures.
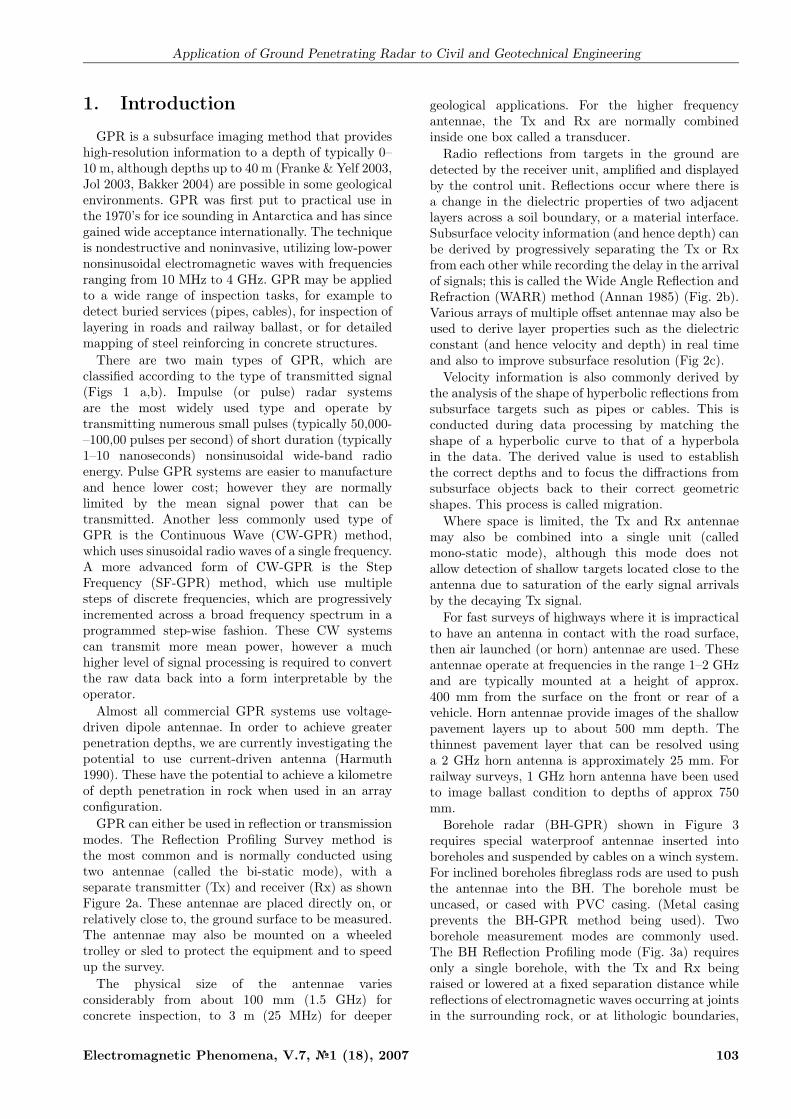
There are two main types of GPR, which areclassified according to the type of transmitted signal(Figs 1 a,b). Impulse (or pulse) radar systemsare the most widely used type and operate bytransmitting numerous small pulses (typically 50,000-–100,00 pulses per second) of short duration (typically1–10 nanoseconds) nonsinusoidal wide-band radioenergy. Pulse GPR systems are easier to manufactureand hence lower cost; however they are normallylimited by the mean signal power that can betransmitted. Another less commonly used type ofGPR is the Continuous Wave (CW-GPR) method,which uses sinusoidal radio waves of a single frequency.A more advanced form of CW-GPR is the StepFrequency (SF-GPR) method, which use multiplesteps of discrete frequencies, which are progressivelyincremented across a broad frequency spectrum in aprogrammed step-wise fashion. These CW systemscan transmit more mean power, however a muchhigher level of signal processing is required to convertthe raw data back into a form interpretable by theoperator.
Almost all commercial GPR systems use voltage-driven dipole antennae. In order to achieve greaterpenetration depths, we are currently investigating thepotential to use current-driven antenna (Harmuth1990). These have the potential to achieve a kilometreof depth penetration in rock when used in an arrayconfiguration.
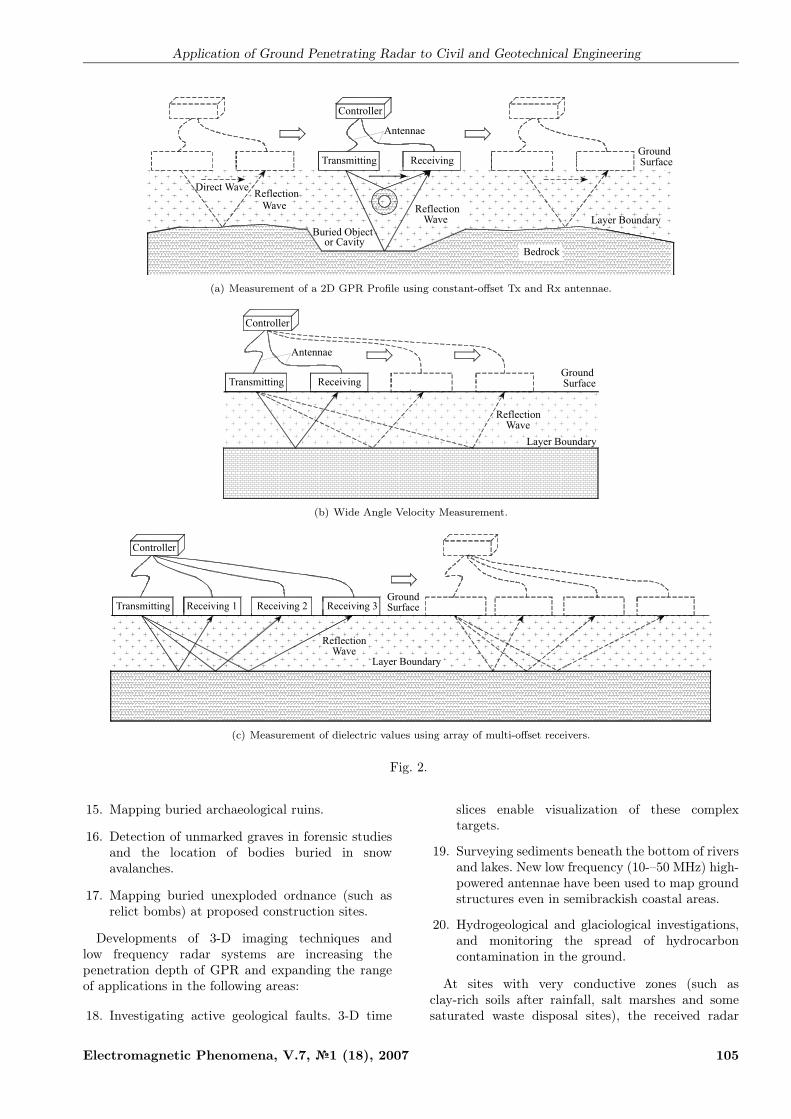
GPR can either be used in reflection or transmissionmodes. The Reflection Profiling Survey method isthe most common and is normally conducted usingtwo antennae (called the bi-static mode), with aseparate transmitter (Tx) and receiver (Rx) as shownFigure 2a. These antennae are placed directly on, orrelatively close to, the ground surface to be measured.The antennae may also be mounted on a wheeledtrolley or sled to protect the equipment and to speedup the survey.
The physical size of the antennae variesconsiderably from about 100 mm (1.5 GHz) forconcrete inspection, to 3 m (25 MHz) for deeper
geological applications. For the higher frequencyantennae, the Tx and Rx are normally combinedinside one box called a transducer.
Radio reflections from targets in the ground aredetected by the receiver unit, amplified and displayedby the control unit. Reflections occur where there isa change in the dielectric properties of two adjacentlayers across a soil boundary, or a material interface.Subsurface velocity information (and hence depth) canbe derived by progressively separating the Tx or Rxfrom each other while recording the delay in the arrivalof signals; this is called the Wide Angle Reflection andRefraction (WARR) method (Annan 1985) (Fig. 2b).Various arrays of multiple offset antennae may also beused to derive layer properties such as the dielectricconstant (and hence velocity and depth) in real timeand also to improve subsurface resolution (Fig 2c).
Velocity information is also commonly derived bythe analysis of the shape of hyperbolic reflections fromsubsurface targets such as pipes or cables. This isconducted during data processing by matching theshape of a hyperbolic curve to that of a hyperbolain the data. The derived value is used to establishthe correct depths and to focus the diffractions fromsubsurface objects back to their correct geometricshapes. This process is called migration.
Where space is limited, the Tx and Rx antennaemay also be combined into a single unit (calledmono-static mode), although this mode does notallow detection of shallow targets located close to theantenna due to saturation of the early signal arrivalsby the decaying Tx signal.
For fast surveys of highways where it is impracticalto have an antenna in contact with the road surface,then air launched (or horn) antennae are used. Theseantennae operate at frequencies in the range 1–2 GHzand are typically mounted at a height of approx.400 mm from the surface on the front or rear of avehicle. Horn antennae provide images of the shallowpavement layers up to about 500 mm depth. Thethinnest pavement layer that can be resolved usinga 2 GHz horn antenna is approximately 25 mm. Forrailway surveys, 1 GHz horn antenna have been usedto image ballast condition to depths of approx 750mm.
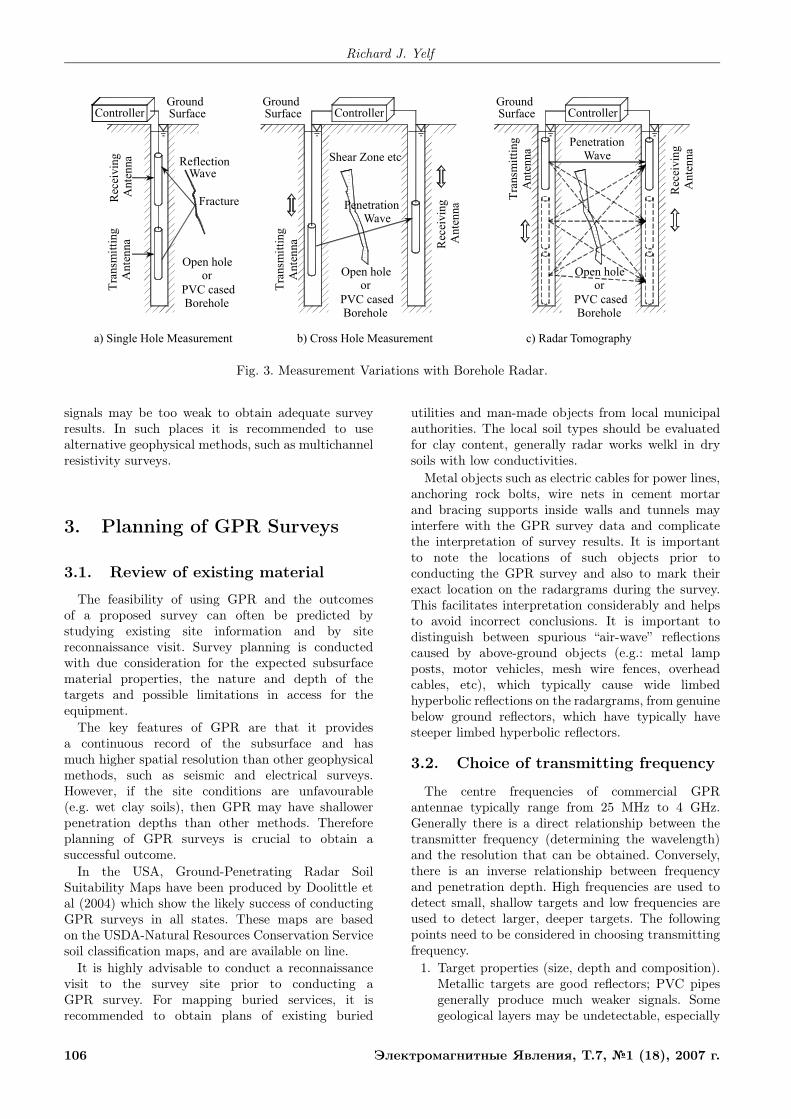
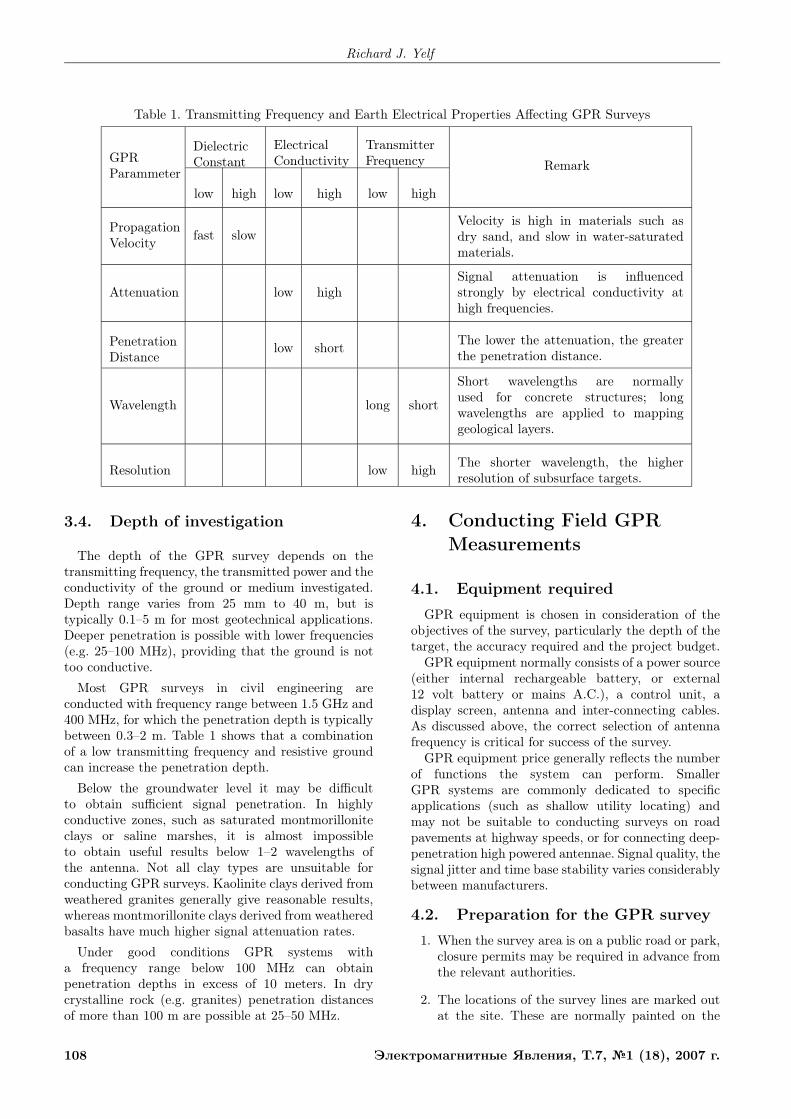
Borehole radar (BH-GPR) shown in Figure 3requires special waterproof antennae inserted intoboreholes and suspended by cables on a winch system.For inclined boreholes fibreglass rods are used to pushthe antennae into the BH. The borehole must beuncased, or cased with PVC casing. (Metal casingprevents the BH-GPR method being used). Twoborehole measurement modes are commonly used.The BH Reflection Profiling mode (Fig. 3a) requiresonly a single borehole, with the Tx and Rx beingraised or lowered at a fixed separation distance whilereflections of electromagnetic waves occurring at jointsin the surrounding rock, or at lithologic boundaries,
Electromagnetic Phenomena, V.7, №1 (18), 2007 103
Richard J. Yelf
Transmitted
Pulse
a) Pulse Radar
MeasuredWaveform
Transmitted
Wave Wave
Received
PulseCompression
b) Compression Wave Radar
WaveformMeasured
Fig. 1. Schematic Diagrams of Pulse Radar and Continuous Wave Radar.
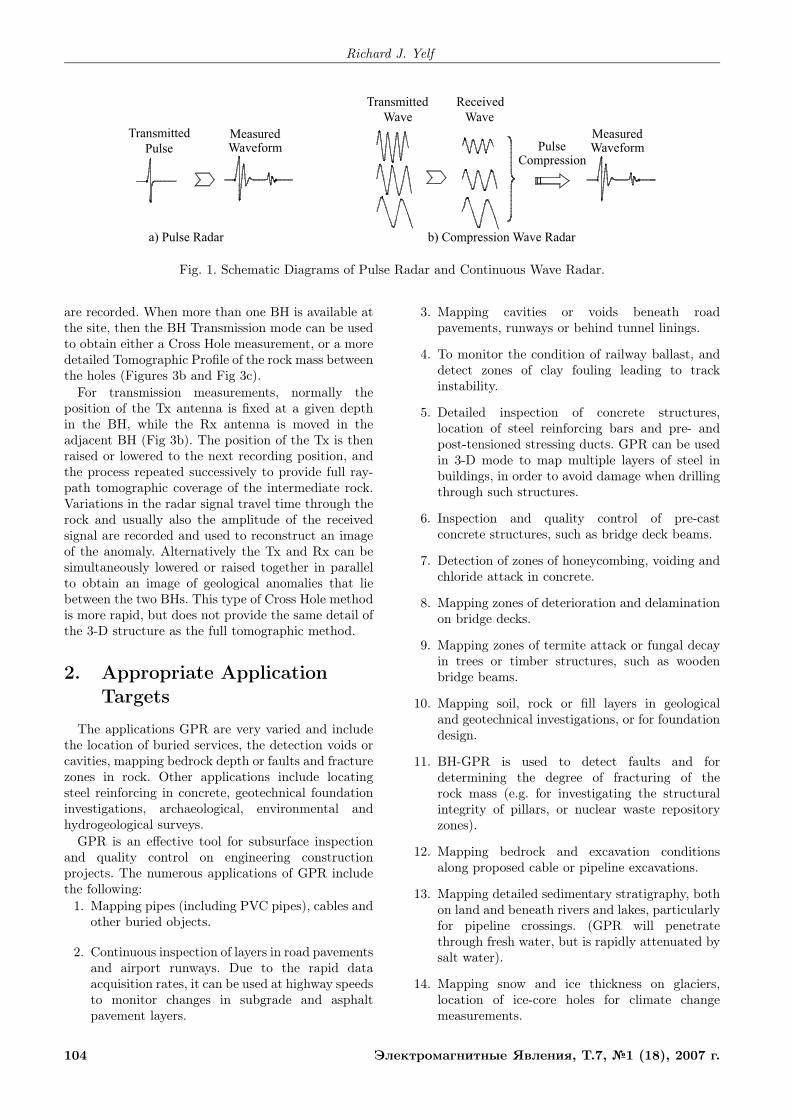
are recorded. When more than one BH is available atthe site, then the BH Transmission mode can be usedto obtain either a Cross Hole measurement, or a moredetailed Tomographic Profile of the rock mass betweenthe holes (Figures 3b and Fig 3c).
For transmission measurements, normally theposition of the Tx antenna is fixed at a given depthin the BH, while the Rx antenna is moved in theadjacent BH (Fig 3b). The position of the Tx is thenraised or lowered to the next recording position, andthe process repeated successively to provide full ray-path tomographic coverage of the intermediate rock.Variations in the radar signal travel time through therock and usually also the amplitude of the receivedsignal are recorded and used to reconstruct an imageof the anomaly. Alternatively the Tx and Rx can besimultaneously lowered or raised together in parallelto obtain an image of geological anomalies that liebetween the two BHs. This type of Cross Hole methodis more rapid, but does not provide the same detail ofthe 3-D structure as the full tomographic method.
2. Appropriate Application
Targets
The applications GPR are very varied and includethe location of buried services, the detection voids orcavities, mapping bedrock depth or faults and fracturezones in rock. Other applications include locatingsteel reinforcing in concrete, geotechnical foundationinvestigations, archaeological, environmental andhydrogeological surveys.
GPR is an effective tool for subsurface inspectionand quality control on engineering constructionprojects. The numerous applications of GPR includethe following:
1. Mapping pipes (including PVC pipes), cables andother buried objects.
2. Continuous inspection of layers in road pavementsand airport runways. Due to the rapid dataacquisition rates, it can be used at highway speedsto monitor changes in subgrade and asphaltpavement layers.
3. Mapping cavities or voids beneath roadpavements, runways or behind tunnel linings.
4. To monitor the condition of railway ballast, anddetect zones of clay fouling leading to trackinstability.
5. Detailed inspection of concrete structures,location of steel reinforcing bars and pre- andpost-tensioned stressing ducts. GPR can be usedin 3-D mode to map multiple layers of steel inbuildings, in order to avoid damage when drillingthrough such structures.
6. Inspection and quality control of pre-castconcrete structures, such as bridge deck beams.
7. Detection of zones of honeycombing, voiding andchloride attack in concrete.
8. Mapping zones of deterioration and delaminationon bridge decks.
9. Mapping zones of termite attack or fungal decayin trees or timber structures, such as woodenbridge beams.
10. Mapping soil, rock or fill layers in geologicaland geotechnical investigations, or for foundationdesign.
11. BH-GPR is used to detect faults and fordetermining the degree of fracturing of therock mass (e.g. for investigating the structuralintegrity of pillars, or nuclear waste repositoryzones).
12. Mapping bedrock and excavation conditionsalong proposed cable or pipeline excavations.
13. Mapping detailed sedimentary stratigraphy, bothon land and beneath rivers and lakes, particularlyfor pipeline crossings. (GPR will penetratethrough fresh water, but is rapidly attenuated bysalt water).
14. Mapping snow and ice thickness on glaciers,location of ice-core holes for climate changemeasurements.
104 Электромагнитные Явления, Т.7, №1 (18), 2007 г.
Application of Ground Penetrating Radar to Civil and Geotechnical Engineering
Controller
Antennae
Transmitting Receiving
Buried Objector Cavity
WaveReflection
Bedrock
Layer Boundary
Direct WaveReflection
Wave
GroundSurface
(a) Measurement of a 2D GPR Profile using constant-offset Tx and Rx antennae.
Controller
Antennae
Transmitting Receiving
WaveReflection
Layer Boundary
GroundSurface
(b) Wide Angle Velocity Measurement.
Controller
Transmitting Receiving 1
WaveReflection
Layer Boundary
GroundSurfaceReceiving 2 Receiving 3
(c) Measurement of dielectric values using array of multi-offset receivers.
Fig. 2.
15. Mapping buried archaeological ruins.
16. Detection of unmarked graves in forensic studiesand the location of bodies buried in snowavalanches.
17. Mapping buried unexploded ordnance (such asrelict bombs) at proposed construction sites.
Developments of 3-D imaging techniques andlow frequency radar systems are increasing thepenetration depth of GPR and expanding the rangeof applications in the following areas:
18. Investigating active geological faults. 3-D time
slices enable visualization of these complextargets.
19. Surveying sediments beneath the bottom of riversand lakes. New low frequency (10-–50 MHz) high-powered antennae have been used to map groundstructures even in semibrackish coastal areas.
20. Hydrogeological and glaciological investigations,and monitoring the spread of hydrocarboncontamination in the ground.
At sites with very conductive zones (such asclay-rich soils after rainfall, salt marshes and somesaturated waste disposal sites), the received radar
Electromagnetic Phenomena, V.7, №1 (18), 2007 105
Richard J. Yelf
ControllerGroundSurface
ReflectionWave
Ante
nna
Rec
eivin
gT
ransm
itti
ng
Ante
nna
Fracture
Open holeor
PVC casedBorehole
SurfaceGround
Ante
nna
Tra
nsm
itti
ng
Controller
or
BoreholePVC cased
Open hole
Rec
eivin
gA
nte
nna
Ante
nna
Rec
eivin
g
Ante
nna
Tra
nsm
itti
ng
Open hole
PVC casedBorehole
or
GroundSurface Controller
PenetrationWave
Shear Zone etc
PenetrationWave
a) Single Hole Measurement b) Cross Hole Measurement c) Radar Tomography
Fig. 3. Measurement Variations with Borehole Radar.
signals may be too weak to obtain adequate surveyresults. In such places it is recommended to usealternative geophysical methods, such as multichannelresistivity surveys.
3. Planning of GPR Surveys
3.1. Review of existing material
The feasibility of using GPR and the outcomesof a proposed survey can often be predicted bystudying existing site information and by sitereconnaissance visit. Survey planning is conductedwith due consideration for the expected subsurfacematerial properties, the nature and depth of thetargets and possible limitations in access for theequipment.
The key features of GPR are that it providesa continuous record of the subsurface and hasmuch higher spatial resolution than other geophysicalmethods, such as seismic and electrical surveys.However, if the site conditions are unfavourable(e.g. wet clay soils), then GPR may have shallowerpenetration depths than other methods. Thereforeplanning of GPR surveys is crucial to obtain asuccessful outcome.
In the USA, Ground-Penetrating Radar SoilSuitability Maps have been produced by Doolittle etal (2004) which show the likely success of conductingGPR surveys in all states. These maps are basedon the USDA-Natural Resources Conservation Servicesoil classification maps, and are available on line.
It is highly advisable to conduct a reconnaissancevisit to the survey site prior to conducting aGPR survey. For mapping buried services, it isrecommended to obtain plans of existing buried
utilities and man-made objects from local municipalauthorities. The local soil types should be evaluatedfor clay content, generally radar works welkl in drysoils with low conductivities.
Metal objects such as electric cables for power lines,anchoring rock bolts, wire nets in cement mortarand bracing supports inside walls and tunnels mayinterfere with the GPR survey data and complicatethe interpretation of survey results. It is importantto note the locations of such objects prior toconducting the GPR survey and also to mark theirexact location on the radargrams during the survey.This facilitates interpretation considerably and helpsto avoid incorrect conclusions. It is important todistinguish between spurious “air-wave” reflectionscaused by above-ground objects (e.g.: metal lampposts, motor vehicles, mesh wire fences, overheadcables, etc), which typically cause wide limbedhyperbolic reflections on the radargrams, from genuinebelow ground reflectors, which have typically havesteeper limbed hyperbolic reflectors.
3.2. Choice of transmitting frequency
The centre frequencies of commercial GPRantennae typically range from 25 MHz to 4 GHz.Generally there is a direct relationship between thetransmitter frequency (determining the wavelength)and the resolution that can be obtained. Conversely,there is an inverse relationship between frequencyand penetration depth. High frequencies are used todetect small, shallow targets and low frequencies areused to detect larger, deeper targets. The followingpoints need to be considered in choosing transmittingfrequency.
1. Target properties (size, depth and composition).Metallic targets are good reflectors; PVC pipesgenerally produce much weaker signals. Somegeological layers may be undetectable, especially
106 Электромагнитные Явления, Т.7, №1 (18), 2007 г.
Application of Ground Penetrating Radar to Civil and Geotechnical Engineering
if they are thin, or have poor radio contrast withthe adjacent layers.
2. Radio frequency properties of the soil, rock, ormedium in which target is buried.
3. The required resolution of the target. Millimetreresolution is possible at 4 GHz, whereas onlymeter resolution may be obtainable at 25 MHz.With some GPR systems it is possible torecord two or more frequencies simultaneously;this can provide both high resolution and deeppenetration simultaneously in one recording pass,thus reducing the overall survey time and cost.
4. Presence of moisture and clays, which limit signalpenetration.
5. Site topography, vegetation cover, access for theantenna and for vehicles pulling antenna (ifapplicable).
6. Weather conditions; generally better results areobtained with dry ground.
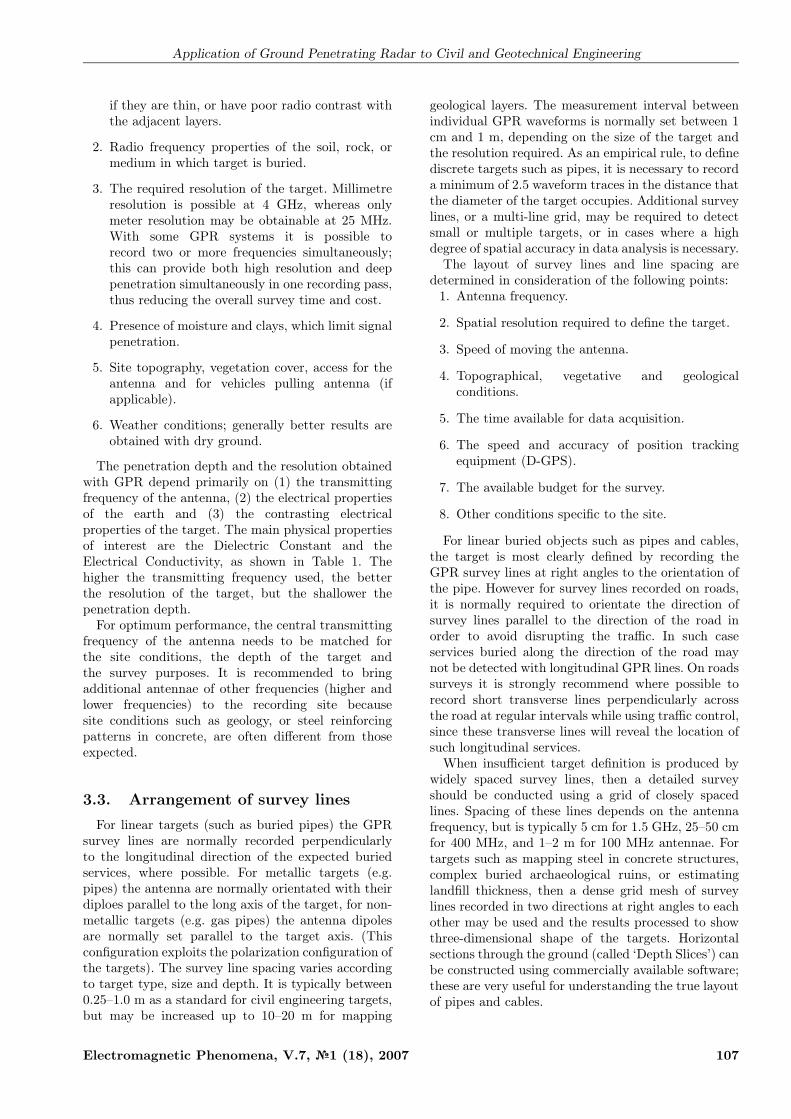
The penetration depth and the resolution obtainedwith GPR depend primarily on (1) the transmittingfrequency of the antenna, (2) the electrical propertiesof the earth and (3) the contrasting electricalproperties of the target. The main physical propertiesof interest are the Dielectric Constant and theElectrical Conductivity, as shown in Table 1. Thehigher the transmitting frequency used, the betterthe resolution of the target, but the shallower thepenetration depth.
For optimum performance, the central transmittingfrequency of the antenna needs to be matched forthe site conditions, the depth of the target andthe survey purposes. It is recommended to bringadditional antennae of other frequencies (higher andlower frequencies) to the recording site becausesite conditions such as geology, or steel reinforcingpatterns in concrete, are often different from thoseexpected.
3.3. Arrangement of survey lines
For linear targets (such as buried pipes) the GPRsurvey lines are normally recorded perpendicularlyto the longitudinal direction of the expected buriedservices, where possible. For metallic targets (e.g.pipes) the antenna are normally orientated with theirdiploes parallel to the long axis of the target, for non-metallic targets (e.g. gas pipes) the antenna dipolesare normally set parallel to the target axis. (Thisconfiguration exploits the polarization configuration ofthe targets). The survey line spacing varies accordingto target type, size and depth. It is typically between0.25–1.0 m as a standard for civil engineering targets,but may be increased up to 10–20 m for mapping
geological layers. The measurement interval betweenindividual GPR waveforms is normally set between 1cm and 1 m, depending on the size of the target andthe resolution required. As an empirical rule, to definediscrete targets such as pipes, it is necessary to recorda minimum of 2.5 waveform traces in the distance thatthe diameter of the target occupies. Additional surveylines, or a multi-line grid, may be required to detectsmall or multiple targets, or in cases where a highdegree of spatial accuracy in data analysis is necessary.
The layout of survey lines and line spacing aredetermined in consideration of the following points:
1. Antenna frequency.
2. Spatial resolution required to define the target.
3. Speed of moving the antenna.
4. Topographical, vegetative and geologicalconditions.
5. The time available for data acquisition.
6. The speed and accuracy of position trackingequipment (D-GPS).
7. The available budget for the survey.
8. Other conditions specific to the site.
For linear buried objects such as pipes and cables,the target is most clearly defined by recording theGPR survey lines at right angles to the orientation ofthe pipe. However for survey lines recorded on roads,it is normally required to orientate the direction ofsurvey lines parallel to the direction of the road inorder to avoid disrupting the traffic. In such caseservices buried along the direction of the road maynot be detected with longitudinal GPR lines. On roadssurveys it is strongly recommend where possible torecord short transverse lines perpendicularly acrossthe road at regular intervals while using traffic control,since these transverse lines will reveal the location ofsuch longitudinal services.
When insufficient target definition is produced bywidely spaced survey lines, then a detailed surveyshould be conducted using a grid of closely spacedlines. Spacing of these lines depends on the antennafrequency, but is typically 5 cm for 1.5 GHz, 25–50 cmfor 400 MHz, and 1–2 m for 100 MHz antennae. Fortargets such as mapping steel in concrete structures,complex buried archaeological ruins, or estimatinglandfill thickness, then a dense grid mesh of surveylines recorded in two directions at right angles to eachother may be used and the results processed to showthree-dimensional shape of the targets. Horizontalsections through the ground (called ‘Depth Slices’) canbe constructed using commercially available software;these are very useful for understanding the true layoutof pipes and cables.
Electromagnetic Phenomena, V.7, №1 (18), 2007 107
Richard J. Yelf
Table 1. Transmitting Frequency and Earth Electrical Properties Affecting GPR Surveys
GPRParammeter
DielectricConstant
ElectricalConductivity
TransmitterFrequency Remark
low high low high low high
PropagationVelocity
fast slowVelocity is high in materials such asdry sand, and slow in water-saturatedmaterials.
Attenuation low highSignal attenuation is influencedstrongly by electrical conductivity athigh frequencies.
PenetrationDistance
low shortThe lower the attenuation, the greaterthe penetration distance.
Wavelength long short
Short wavelengths are normallyused for concrete structures; longwavelengths are applied to mappinggeological layers.
Resolution low highThe shorter wavelength, the higherresolution of subsurface targets.
3.4. Depth of investigation
The depth of the GPR survey depends on thetransmitting frequency, the transmitted power and theconductivity of the ground or medium investigated.Depth range varies from 25 mm to 40 m, but istypically 0.1–5 m for most geotechnical applications.Deeper penetration is possible with lower frequencies(e.g. 25–100 MHz), providing that the ground is nottoo conductive.
Most GPR surveys in civil engineering areconducted with frequency range between 1.5 GHz and400 MHz, for which the penetration depth is typicallybetween 0.3–2 m. Table 1 shows that a combinationof a low transmitting frequency and resistive groundcan increase the penetration depth.
Below the groundwater level it may be difficultto obtain sufficient signal penetration. In highlyconductive zones, such as saturated montmorilloniteclays or saline marshes, it is almost impossibleto obtain useful results below 1–2 wavelengths ofthe antenna. Not all clay types are unsuitable forconducting GPR surveys. Kaolinite clays derived fromweathered granites generally give reasonable results,whereas montmorillonite clays derived from weatheredbasalts have much higher signal attenuation rates.
Under good conditions GPR systems witha frequency range below 100 MHz can obtainpenetration depths in excess of 10 meters. In drycrystalline rock (e.g. granites) penetration distancesof more than 100 m are possible at 25–50 MHz.
4. Conducting Field GPR
Measurements
4.1. Equipment required
GPR equipment is chosen in consideration of theobjectives of the survey, particularly the depth of thetarget, the accuracy required and the project budget.
GPR equipment normally consists of a power source(either internal rechargeable battery, or external12 volt battery or mains A.C.), a control unit, adisplay screen, antenna and inter-connecting cables.As discussed above, the correct selection of antennafrequency is critical for success of the survey.
GPR equipment price generally reflects the numberof functions the system can perform. SmallerGPR systems are commonly dedicated to specificapplications (such as shallow utility locating) andmay not be suitable to conducting surveys on roadpavements at highway speeds, or for connecting deep-penetration high powered antennae. Signal quality, thesignal jitter and time base stability varies considerablybetween manufacturers.
4.2. Preparation for the GPR survey
1. When the survey area is on a public road or park,closure permits may be required in advance fromthe relevant authorities.
2. The locations of the survey lines are marked outat the site. These are normally painted on the
108 Электромагнитные Явления, Т.7, №1 (18), 2007 г.
Application of Ground Penetrating Radar to Civil and Geotechnical Engineering
ground or marked with chalk. The start and endpositions of each survey line are recorded on fielddata sheets and marked on a site plan.
3. The antennae are mounted on a sled or wheeledtrolley to enable them to be pulled smoothlyacross the ground.
4. For ground-coupled antennae, best survey resultsare generally obtained with the GPR antennaplaced close to the ground surface which shouldbe as flat as possible. Grass at the site shouldbe mown short and bushes or shrubs along thesurvey route should are cut away where practical.
5. On sites with rough ground the surface mayrequire smoothing with a bulldozer or graderto allow good contact between the base of theantenna and the ground surface. This is mainlyapplicable on large scale geotechnical projects.
Permits for the survey are obtained from therelevant landowners, local community and authorities.Due to FCC regulations, it may be required to registerthe intended use of the antenna.
The survey lines are usually laid at the site usingsimple survey equipment such as measuring tapes.A site plan with an appropriate scale makes thisoperation easier. Features such as roads, utilities,buildings, topography and vegetation should benoted. For larger projects, differential GPS or laserpositioning equipment is commonly used for trackingthe location of the survey lines. Base stations are setup at appropriate locations to facilitate this.
4.3. Field survey procedure
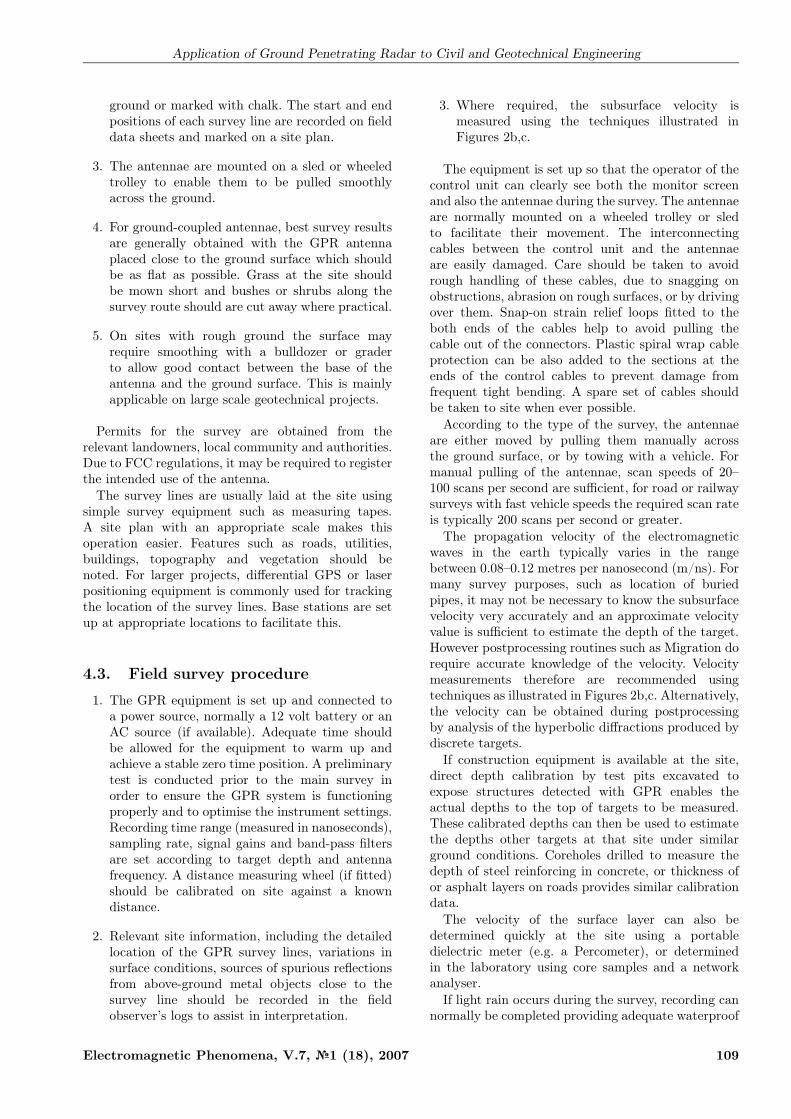
1. The GPR equipment is set up and connected toa power source, normally a 12 volt battery or anAC source (if available). Adequate time shouldbe allowed for the equipment to warm up andachieve a stable zero time position. A preliminarytest is conducted prior to the main survey inorder to ensure the GPR system is functioningproperly and to optimise the instrument settings.Recording time range (measured in nanoseconds),sampling rate, signal gains and band-pass filtersare set according to target depth and antennafrequency. A distance measuring wheel (if fitted)should be calibrated on site against a knowndistance.
2. Relevant site information, including the detailedlocation of the GPR survey lines, variations insurface conditions, sources of spurious reflectionsfrom above-ground metal objects close to thesurvey line should be recorded in the fieldobserver’s logs to assist in interpretation.
3. Where required, the subsurface velocity ismeasured using the techniques illustrated inFigures 2b,c.
The equipment is set up so that the operator of thecontrol unit can clearly see both the monitor screenand also the antennae during the survey. The antennaeare normally mounted on a wheeled trolley or sledto facilitate their movement. The interconnectingcables between the control unit and the antennaeare easily damaged. Care should be taken to avoidrough handling of these cables, due to snagging onobstructions, abrasion on rough surfaces, or by drivingover them. Snap-on strain relief loops fitted to theboth ends of the cables help to avoid pulling thecable out of the connectors. Plastic spiral wrap cableprotection can be also added to the sections at theends of the control cables to prevent damage fromfrequent tight bending. A spare set of cables shouldbe taken to site when ever possible.
According to the type of the survey, the antennaeare either moved by pulling them manually acrossthe ground surface, or by towing with a vehicle. Formanual pulling of the antennae, scan speeds of 20–100 scans per second are sufficient, for road or railwaysurveys with fast vehicle speeds the required scan rateis typically 200 scans per second or greater.
The propagation velocity of the electromagneticwaves in the earth typically varies in the rangebetween 0.08–0.12 metres per nanosecond (m/ns). Formany survey purposes, such as location of buriedpipes, it may not be necessary to know the subsurfacevelocity very accurately and an approximate velocityvalue is sufficient to estimate the depth of the target.However postprocessing routines such as Migration dorequire accurate knowledge of the velocity. Velocitymeasurements therefore are recommended usingtechniques as illustrated in Figures 2b,c. Alternatively,the velocity can be obtained during postprocessingby analysis of the hyperbolic diffractions produced bydiscrete targets.
If construction equipment is available at the site,direct depth calibration by test pits excavated toexpose structures detected with GPR enables theactual depths to the top of targets to be measured.These calibrated depths can then be used to estimatethe depths other targets at that site under similarground conditions. Coreholes drilled to measure thedepth of steel reinforcing in concrete, or thickness ofor asphalt layers on roads provides similar calibrationdata.
The velocity of the surface layer can also bedetermined quickly at the site using a portabledielectric meter (e.g. a Percometer), or determinedin the laboratory using core samples and a networkanalyser.
If light rain occurs during the survey, recording cannormally be completed providing adequate waterproof
Electromagnetic Phenomena, V.7, №1 (18), 2007 109
Richard J. Yelf
covering is provided for the survey equipment. It isadvisable to manufacture waterproof plastic coversfor the antennae that can easily be attached whenrequired. Heavy rain may saturate the ground,adversely affecting GPR signals, and may cause failureto the survey equipment. Note that a variable moisturecontent across a site, or along a section of road, mayresult in inaccurate depth measurements unless thelocal moisture variations are included in the velocitycalculations.
4.4. Assessment of measurement
results
The quality of results acquired on site shouldbe assessed during, or immediately after, the fieldsurvey by examining the GPR images displayed onthe monitor screen. Where required, lines should berepeated to ensure the data is adequate to achieve theobjectives of the survey.
The data needs to be critically reviewed at the siteto check that it is of good quality and to eliminatesources of radio noise, or spurious airwave reflectionsfrom above-ground objects such as pedestrians ormoving cars.
Sources of unwanted signal noise, or abnormalsignals, should be identified and the causes removedwhere possible. Mobile phones or two-way radios maycause interference should not be operated close to thereceiver during recording operations.
Well defined subsurface anomalies (pipes andcables) may be interpreted on site and marked directlyon the ground using chalk, paint or survey pegs.More complex targets, for example archaeologicalruins, may require signal processing which is normallyconducted subsequently in the office.
4.5. Safety aspects
1. Risk factors related to on-site hazards should beassessed prior to commencing the fieldwork.
2. The average signal power transmitted by smallcommercial GPR systems is in the order of1 milliwatt, which is approximately 600 timesless than that transmitted by a mobile phone.Therefore the levels electromagnetic radiationproduced by small commercial GPR transmittersare not considered a health risk to operatingpersonnel.
During field survey operations, care needs to betaken prevent injury to the operators, or damageto the equipment and cables, especially when trafficor construction vehicles are moving around the site.Safe traffic control is required to avoid accidentsduring surveys on roads. Special care should betaken when conducting surveys on inclined slopes
(e.g. scree slopes) or on high buildings to preventinjuries from falling or rolling. Working undergroundin confined spaces, such as sewers, may require specialprocedures. Operations in confined spaces with highmethane levels may present a risk from gas explosions,or poisoning from noxious gases. Prior to operationat sites, the GPR equipment may require safetyinspection from regulatory staff to ensure it complieswith local safety standards, especially with regard togas explosion risk.
In order to avoid accidents during GPR surveyson public roads it is recommended to arrange trafficcontrollers, plus speed control signs and barriers.At night reflective barriers should be used and theoperators should wear appropriate reflective clothing.Flashing lights and reflective tape may also beattached to the antennae. For continuous surveysalong busy roads, guard cars with flashing signs maybe required to protect the operators and equipment.
The averaged transmitted power density levelsof small commercial GPR systems are less than0.0001 W/m2 at 5 cm. This is approximately 1,000,000times below the critical 10 mW/cm2 (100 W/m2)levels established by the United Sates OccupationalHealth and Safety Administration (OHSA). Thereforethe levels of electromagnetic radiation producedby small commercial GPR transmitters are notconsidered a health risk to operating personnel.
The transmitted power levels also do not generallycause significant interference to other electronicequipment.
5. Data Processing
5.1. Production of survey location
plan
A survey location plan at an appropriate scale isnormally produced showing the layout of the GPRlines and relative locations of pertinent site features.
The site plan should include a scale, north directionand clearly show the layout of the GPR survey lines.Interpreted features may be marked on the planas appropriate. The coordinate positions of utilitiesdetected with GPR should be measured with a surveytape, or recorded using differential GPS or a totalstation theodolite and plotted as a CAD drawing ifrequired. Sketches and photos of the site are also veryuseful for interpreting the survey results.
5.2. Production of GPR sections
To enable analysis and interpretation the GPRresults, the profiles are normally displayed as 2-Dtime sections, or as depth sections if the propagationvelocity is known. Digital signal processing is applied
110 Электромагнитные Явления, Т.7, №1 (18), 2007 г.
Application of Ground Penetrating Radar to Civil and Geotechnical Engineering
to the data as required. This varies according toeach survey, but normally involves filtering to removeunwanted noise, gain adjustment to balance signalstrengths, migration to remove diffraction effects,corrections for variations in surface topographicelevation and graphic display using various colourpalettes or wiggle-trace formats.
The GPR profile (or ‘radargram’) is displayedon screen or printed out for each survey line. Theinterpretation of a 2-D survey section is based on theseprofile sections. In many cases the raw GPR data isadequate for the interpretation to be conducted. Formore complex targets and deeper layers, geophysicalprocessing is applied using similar techniques to thoseused in shallow seismic reflection surveys.
GPR processing routines vary per site andaccording to the type of equipment used, and mayinclude the following:
1. Adjustment of Time Zero position [33].
2. Band-pass filtering (to remove unwanted high orlow frequency noise or DC bias).
3. Stacking (if required) to improve the signal-to-noise ratio and to shorten long profiles so theentire line may be seen on one computer screen.
4. Moving average filtering (to smooth out jitterbetween waveforms).
5. Background removal via subtraction of meantrace or moving average window to removeconstant horizontal noise bands (e.g. ringing)from the data.
6. Deconvolution filtering (to remove unwantedmultiple echoes, or signal ‘ringing’).
7. Migration (to focus the hyperbolic diffractionsfrom buried objects back to their true positions).(Yilmaz, 1987).
8. Gain to increase signal amplitude. This maybe applied manually, or automatically usingautomatic gain control (AGC).
9. Conversion to depth sections and correction forvariations in surface elevation.
10. Redatuming to remove distortion effects causedby layers with different velocities.
11. Construction of 3D sections.
For large projects, the data processing is commonlyautomated by writing macros and the processingconducted as a batch sequence. Prior to this, testprocessing is conducted on selected lines to optimisethe processing routines. Usually the processed datais recorded digitally onto the hard disc of a personalcomputers, or stored on removable external media
(CD-RW, DVD-RW, USB memory sticks). The GPRprofiles are printed using standard printers or plotters.
GPR profiles are displayed using as followinggraphic modes:
1. Wiggle-trace waveforms (Fig 5a). This is thesimplest display mode, but may be difficult tointerpret.
2. Grey scale intensity. This mode is good foridentifying structures in the ground, e.g. steelbars in concrete.
3. Colour palettes. These are used to display moresubtle features, or highlight required targets orlayers. Colour palettes may be user-customizedto optimally display the required features, whileremoving unwanted visual clutter.
6. Data Analysis
1. GPR results are interpreted by recognizingdiagnostic reflection patterns on the radargrams.
2. Discrete buried objects typically appear ashyperbolic reflections in the raw data, with thelimbs of the hyperbolae projected downwardslike an inverted “V” shape. These hyperbolicdiffraction patterns can be converted back totheir true shape and size by applying a signalprocessing routine called Migration.
3. Subsurface layers appear as continuous reflectorson the radargrams. These layers are normallydigitised on screen and plotted as 2-D sectionsusing commercially available graphical programs.
4. Where the data has been recorded as multiplelines on a grid, then the results can be processedand displayed as a 3-D plot, with time-slicesections made at user specified depths to showthe relative orientations of subsurface targets.
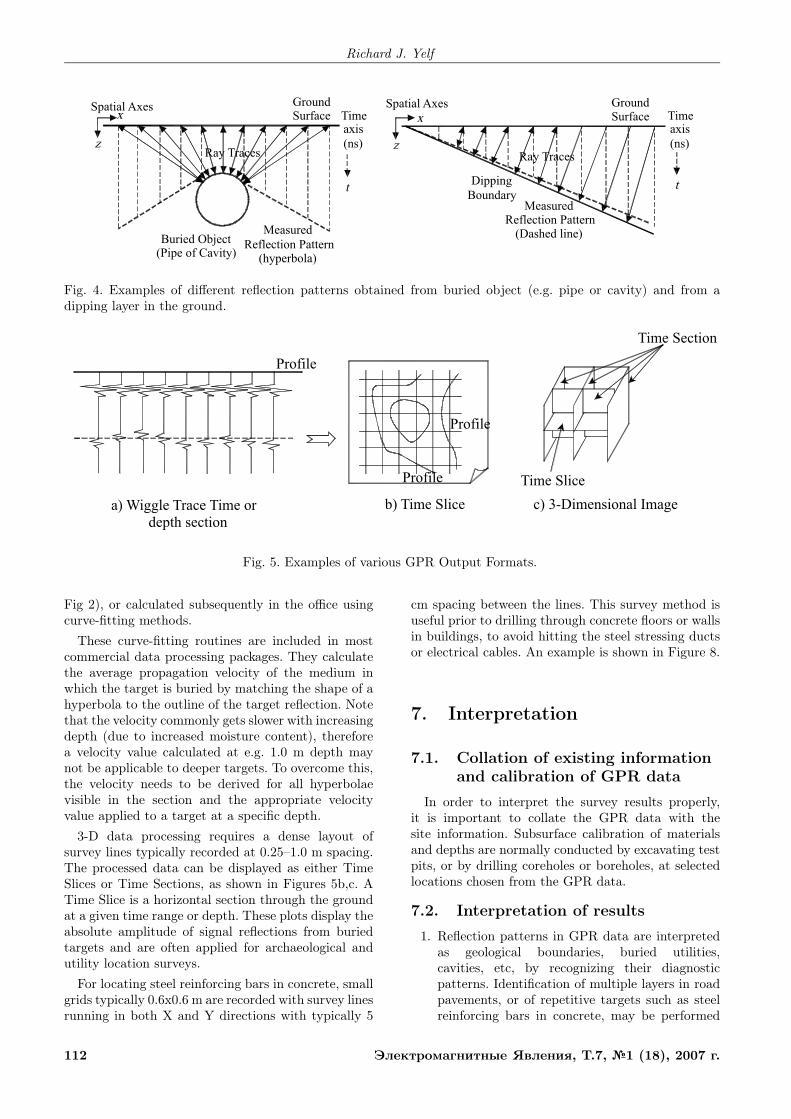
Reflection patterns in the raw GPR profiles do notrepresent the true shape or orientation of subsurfaceobjects. Discrete buried objects (e.g. pipes, cavities)typically appear as complex hyperbolic reflections inthe raw data, whereas dipping layers appear as linearinterfaces with shallower angles of dip than their trueposition in the ground, as shown in Figure 4. Forsimple targets that are widely spaced apart, theseraw reflection patterns are normally adequate forinterpretation by trained operators. For complex orclosely spaced targets, signal processing is applied toimprove the clarity and resolution of the radar images.
The true shape and orientation of the targets canbe obtained by applying Migration routines, usingvelocity values measured in the field (as shown in
Electromagnetic Phenomena, V.7, №1 (18), 2007 111
Richard J. Yelf
GroundSurface
Spatial AxesTimeaxis
(ns)
Buried Object(Pipe of Cavity)
Measured
Reflection Pattern(hyperbola)
Spatial Axes GroundSurface
(ns)
axisTime
Ray Traces Ray Traces
Dipping
BoundaryMeasured
Reflection Pattern(Dashed line)
Fig. 4. Examples of different reflection patterns obtained from buried object (e.g. pipe or cavity) and from adipping layer in the ground.
a) Wiggle Trace Time or b) Time Slice
Profile
depth section
Time Slice
c) 3-Dimensional Image
Time Section
Profile
Profile
Fig. 5. Examples of various GPR Output Formats.
Fig 2), or calculated subsequently in the office usingcurve-fitting methods.
These curve-fitting routines are included in mostcommercial data processing packages. They calculatethe average propagation velocity of the medium inwhich the target is buried by matching the shape of ahyperbola to the outline of the target reflection. Notethat the velocity commonly gets slower with increasingdepth (due to increased moisture content), thereforea velocity value calculated at e.g. 1.0 m depth maynot be applicable to deeper targets. To overcome this,the velocity needs to be derived for all hyperbolaevisible in the section and the appropriate velocityvalue applied to a target at a specific depth.
3-D data processing requires a dense layout ofsurvey lines typically recorded at 0.25–1.0 m spacing.The processed data can be displayed as either TimeSlices or Time Sections, as shown in Figures 5b,c. ATime Slice is a horizontal section through the groundat a given time range or depth. These plots display theabsolute amplitude of signal reflections from buriedtargets and are often applied for archaeological andutility location surveys.
For locating steel reinforcing bars in concrete, smallgrids typically 0.6x0.6 m are recorded with survey linesrunning in both X and Y directions with typically 5
cm spacing between the lines. This survey method isuseful prior to drilling through concrete floors or wallsin buildings, to avoid hitting the steel stressing ductsor electrical cables. An example is shown in Figure 8.
7. Interpretation
7.1. Collation of existing information
and calibration of GPR data
In order to interpret the survey results properly,it is important to collate the GPR data with thesite information. Subsurface calibration of materialsand depths are normally conducted by excavating testpits, or by drilling coreholes or boreholes, at selectedlocations chosen from the GPR data.
7.2. Interpretation of results
1. Reflection patterns in GPR data are interpretedas geological boundaries, buried utilities,cavities, etc, by recognizing their diagnosticpatterns. Identification of multiple layers in roadpavements, or of repetitive targets such as steelreinforcing bars in concrete, may be performed
112 Электромагнитные Явления, Т.7, №1 (18), 2007 г.
Application of Ground Penetrating Radar to Civil and Geotechnical Engineering
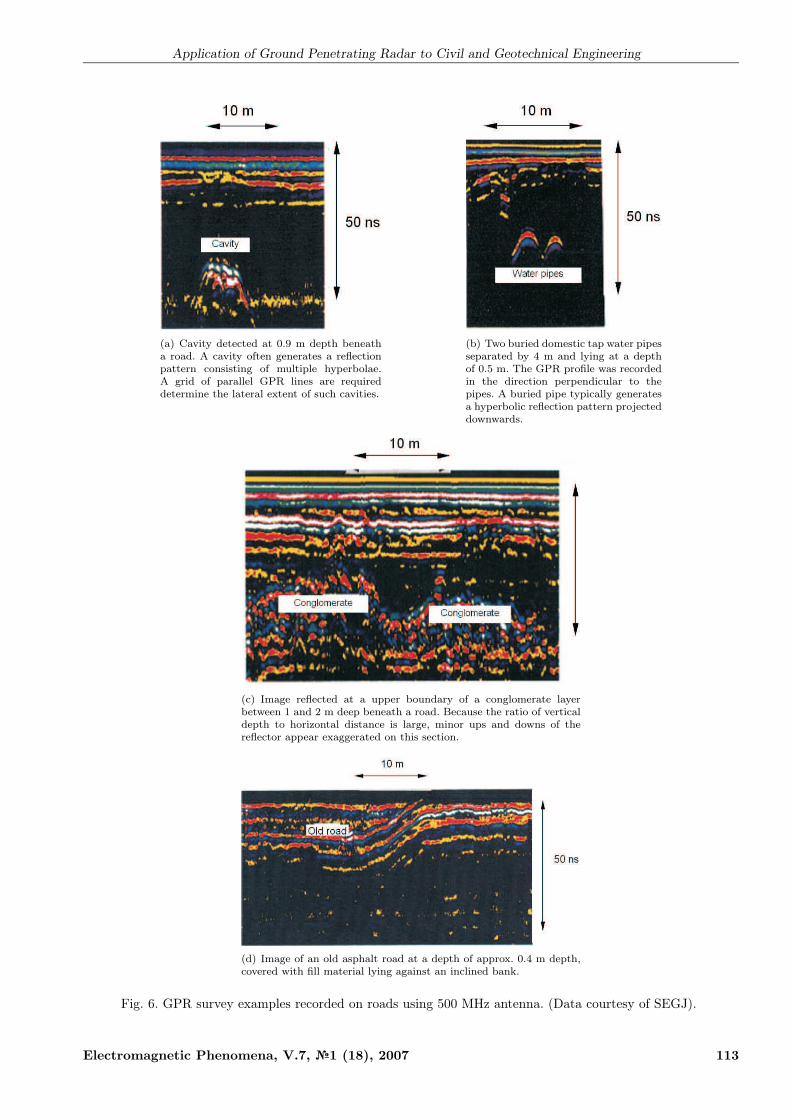
(a) Cavity detected at 0.9 m depth beneatha road. A cavity often generates a reflectionpattern consisting of multiple hyperbolae.A grid of parallel GPR lines are requireddetermine the lateral extent of such cavities.
(b) Two buried domestic tap water pipesseparated by 4 m and lying at a depthof 0.5 m. The GPR profile was recordedin the direction perpendicular to thepipes. A buried pipe typically generatesa hyperbolic reflection pattern projecteddownwards.
(c) Image reflected at a upper boundary of a conglomerate layerbetween 1 and 2 m deep beneath a road. Because the ratio of verticaldepth to horizontal distance is large, minor ups and downs of thereflector appear exaggerated on this section.
(d) Image of an old asphalt road at a depth of approx. 0.4 m depth,covered with fill material lying against an inclined bank.
Fig. 6. GPR survey examples recorded on roads using 500 MHz antenna. (Data courtesy of SEGJ).
Electromagnetic Phenomena, V.7, №1 (18), 2007 113
Richard J. Yelf
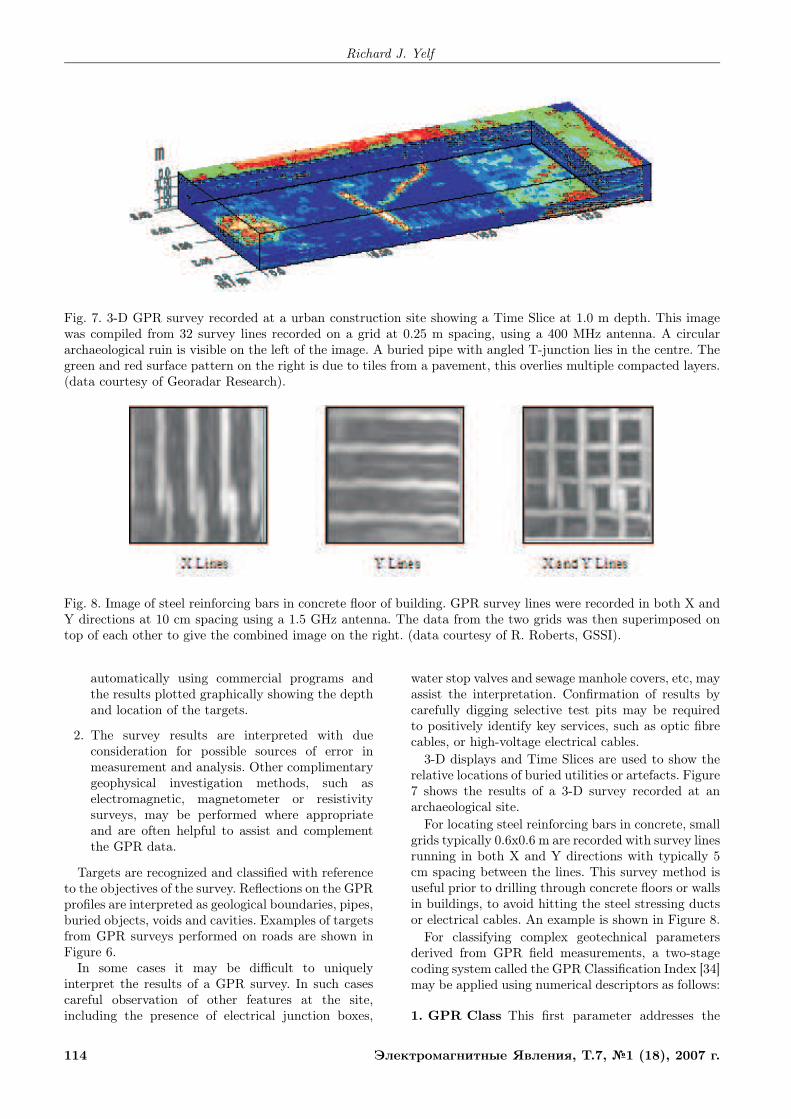
Fig. 7. 3-D GPR survey recorded at a urban construction site showing a Time Slice at 1.0 m depth. This imagewas compiled from 32 survey lines recorded on a grid at 0.25 m spacing, using a 400 MHz antenna. A circulararchaeological ruin is visible on the left of the image. A buried pipe with angled T-junction lies in the centre. Thegreen and red surface pattern on the right is due to tiles from a pavement, this overlies multiple compacted layers.(data courtesy of Georadar Research).
Fig. 8. Image of steel reinforcing bars in concrete floor of building. GPR survey lines were recorded in both X andY directions at 10 cm spacing using a 1.5 GHz antenna. The data from the two grids was then superimposed ontop of each other to give the combined image on the right. (data courtesy of R. Roberts, GSSI).
automatically using commercial programs andthe results plotted graphically showing the depthand location of the targets.
2. The survey results are interpreted with dueconsideration for possible sources of error inmeasurement and analysis. Other complimentarygeophysical investigation methods, such aselectromagnetic, magnetometer or resistivitysurveys, may be performed where appropriateand are often helpful to assist and complementthe GPR data.
Targets are recognized and classified with referenceto the objectives of the survey. Reflections on the GPRprofiles are interpreted as geological boundaries, pipes,buried objects, voids and cavities. Examples of targetsfrom GPR surveys performed on roads are shown inFigure 6.
In some cases it may be difficult to uniquelyinterpret the results of a GPR survey. In such casescareful observation of other features at the site,including the presence of electrical junction boxes,
water stop valves and sewage manhole covers, etc, mayassist the interpretation. Confirmation of results bycarefully digging selective test pits may be requiredto positively identify key services, such as optic fibrecables, or high-voltage electrical cables.
3-D displays and Time Slices are used to show therelative locations of buried utilities or artefacts. Figure7 shows the results of a 3-D survey recorded at anarchaeological site.
For locating steel reinforcing bars in concrete, smallgrids typically 0.6x0.6 m are recorded with survey linesrunning in both X and Y directions with typically 5cm spacing between the lines. This survey method isuseful prior to drilling through concrete floors or wallsin buildings, to avoid hitting the steel stressing ductsor electrical cables. An example is shown in Figure 8.
For classifying complex geotechnical parametersderived from GPR field measurements, a two-stagecoding system called the GPR Classification Index [34]may be applied using numerical descriptors as follows:
1. GPR Class This first parameter addresses the
114 Электромагнитные Явления, Т.7, №1 (18), 2007 г.
Application of Ground Penetrating Radar to Civil and Geotechnical Engineering
DISTANCE FROM START OF GPR LINE (m)
0
GP
RC
LA
SS
10020 40 60 80 120 140 160 180
200220 240 260 280
300320 340 360 380
400420 440 460 480
500
RIPPABLE LIMIT
2
3
4
5
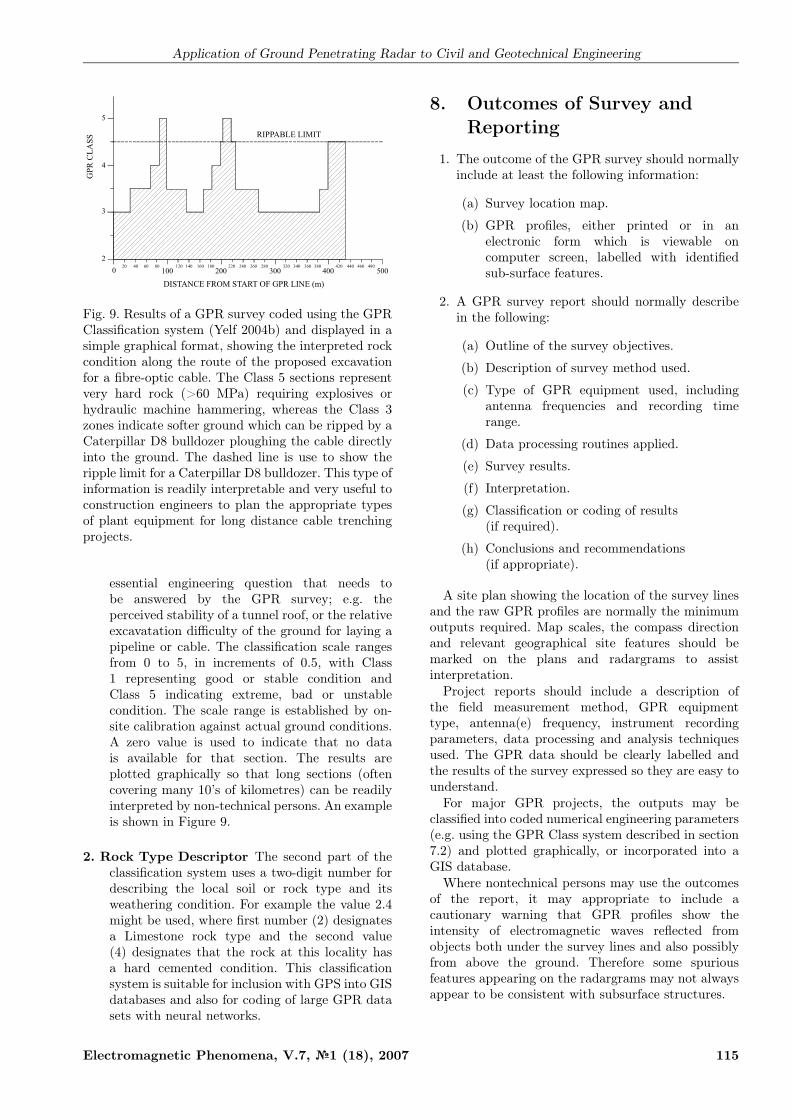
Fig. 9. Results of a GPR survey coded using the GPRClassification system (Yelf 2004b) and displayed in asimple graphical format, showing the interpreted rockcondition along the route of the proposed excavationfor a fibre-optic cable. The Class 5 sections representvery hard rock (>60 MPa) requiring explosives orhydraulic machine hammering, whereas the Class 3zones indicate softer ground which can be ripped by aCaterpillar D8 bulldozer ploughing the cable directlyinto the ground. The dashed line is use to show theripple limit for a Caterpillar D8 bulldozer. This type ofinformation is readily interpretable and very useful toconstruction engineers to plan the appropriate typesof plant equipment for long distance cable trenchingprojects.
essential engineering question that needs tobe answered by the GPR survey; e.g. theperceived stability of a tunnel roof, or the relativeexcavatation difficulty of the ground for laying apipeline or cable. The classification scale rangesfrom 0 to 5, in increments of 0.5, with Class1 representing good or stable condition andClass 5 indicating extreme, bad or unstablecondition. The scale range is established by on-site calibration against actual ground conditions.A zero value is used to indicate that no datais available for that section. The results areplotted graphically so that long sections (oftencovering many 10’s of kilometres) can be readilyinterpreted by non-technical persons. An exampleis shown in Figure 9.
2. Rock Type Descriptor The second part of theclassification system uses a two-digit number fordescribing the local soil or rock type and itsweathering condition. For example the value 2.4might be used, where first number (2) designatesa Limestone rock type and the second value(4) designates that the rock at this locality hasa hard cemented condition. This classificationsystem is suitable for inclusion with GPS into GISdatabases and also for coding of large GPR datasets with neural networks.
8. Outcomes of Survey and
Reporting
1. The outcome of the GPR survey should normallyinclude at least the following information:
(a) Survey location map.
(b) GPR profiles, either printed or in anelectronic form which is viewable oncomputer screen, labelled with identifiedsub-surface features.
2. A GPR survey report should normally describein the following:
(a) Outline of the survey objectives.
(b) Description of survey method used.
(c) Type of GPR equipment used, includingantenna frequencies and recording timerange.
(d) Data processing routines applied.
(e) Survey results.
(f) Interpretation.
(g) Classification or coding of results(if required).
(h) Conclusions and recommendations(if appropriate).
A site plan showing the location of the survey linesand the raw GPR profiles are normally the minimumoutputs required. Map scales, the compass directionand relevant geographical site features should bemarked on the plans and radargrams to assistinterpretation.
Project reports should include a description ofthe field measurement method, GPR equipmenttype, antenna(e) frequency, instrument recordingparameters, data processing and analysis techniquesused. The GPR data should be clearly labelled andthe results of the survey expressed so they are easy tounderstand.
For major GPR projects, the outputs may beclassified into coded numerical engineering parameters(e.g. using the GPR Class system described in section7.2) and plotted graphically, or incorporated into aGIS database.
Where nontechnical persons may use the outcomesof the report, it may appropriate to include acautionary warning that GPR profiles show theintensity of electromagnetic waves reflected fromobjects both under the survey lines and also possiblyfrom above the ground. Therefore some spuriousfeatures appearing on the radargrams may not alwaysappear to be consistent with subsurface structures.
Electromagnetic Phenomena, V.7, №1 (18), 2007 115
Richard J. Yelf
9. Future Developments
The penetration depth of GPR systems in use todayis limited by the transmitted power. They use highvoltages (up to 1,000 volt impulses) and low frequency(25–50 MHz antennae), which can reach up to 40 mdepth in low conductivity ground conditions. FutureGPR systems will deploy a new generation of UWBcurrent-driven antenna, rather than voltage-drivenantenna. These have the advantage of being able totransmit much higher mean power into the ground,and also use a smaller footprint, enabling them to bemounted inside robotic mining machines. Penetrationdepths of the order of 1,000 m are feasible using arraybased systems (Harmuth pers. com. 2006).
10. Conclusion
GPR is a powerful diagnostic tool for civil andgeotechnical engineering. To obtain the best resultsit must be applied correctly by properly trainedpersonnel, who are familiar both with the physicalprinciples of the method and also of its limitations.The resultant data should be interpreted carefully,combining the relevant information of above groundand subsurface features. Calibration of the resultsusing boreholes or test pits is recommended.
Acknowledgment
The original version of this document was preparedin cooperation with the Society of ExplorationGeophysicists Japan and the Australian Society ofExploration Geophysicists. The author gratefullyacknowledges the contribution of SEGJ and ASEGgeophysicists and engineers to this paper, notablyProf. Yuzuru Ashida of Kyoto University, ToshiakiTakeuchi of OYO Corporation Japan, Hidetoshi Miuraof Terra Corporation Japan and Koya Suto of TerraAustralis Geophysica.
Manuscript received November 15, 2006
References
[1] Allred B., Daniels J. and Vendl M. Basics ofGPR // Workshop notes presented at 11–thInternational GPR Conference (Ohio State Univ.,Ohio, USA). – 2006 – 41 P. (on CD-ROM)
[2] Annan A.P. Radar CDP and WARR Soundings:Principles and Interpretation // A-CubedTechnical Note 15. – 1985. (Sensors & Software,Canada).
[3] Bakker M. The internal structure of Pleistocenepush moraines – PhD Thesis, Queen Mary
College, Univ. of London: Published by TNONetherlands. – 2004. – 177 P.
[4] Benson A.K. Applications of ground penetratingradar in assessing some geological hazards //Journal of Applied Geophysics – 1995. – V. 33.– P. 177–193.
[5] Daniels D.J. Ground Penetrating Radar. 2-ndEdition. – London: The Institute of ElectricalEngineers. United Kingdom. – 2004.
[6] Davies J.L. and Annan A.P. Ground -penetratingradar for high-resolution mapping of soil and rockstratigraphy // Geophysical Prospecting – 1989.– V. 37. – P. 531–551.
[7] Doolittle J.A. Minzenmayer F.E., Waltman S.W.and Benham E.C. Ground penetrating radarsoil suitability map of the conterminous UnitedStates // Proc. of the 9-th International GPRConference SPIE Vol 4758 (Santa Barbara, CA,U.S.A.) – 2002. – P. 7–12. (on CD-ROM)
[8] Doolittle J.A., Collins M. and Mount H.Assessing the appropriateness of GPR with soilgeographic data base // Proc. of the 7-thInternational GPR Conference (Univ. of Kansas,Lawrence, USA). – 1998. – P. 393–397. (on CD-ROM)
[9] Davis J.L., Rossiter J.R., Mesher D. and DawleyC.B. Quantitative Measurements of PavementStructures Using GPR // Proc. of the 5-thInternational GPR Conference, V. 1 (Kitchener,Ontario, Canada). – 1994 – P. 319–334.
[10] Goodman D. GPR Time Slices of the Villa ofEmperor Trajanus, Arcinazzo, Italy (AD 52—117) // Proc. of the 9-th International GPRConference (Santa Barbara, CA, U.S.A.) – 2002.– P. 268–272. (on CD-ROM)
[11] Green A., Holliger K., Horstmeyer H., MaurerH., Tronicke J., and Van de Kruk J. Three-dimensional Acquisition, Processing and Imagingof GPR Data // Applied EnvironmentalGeophysics Group, ETH Zurich, Switzerland,presented at Advanced GPR Workshop, Proc. ofthe 9-th International GPR Conference (SantaBarbara, CA, USA). – 2002 (on CD-ROM)
[12] Francke J. and Yelf R. Applications of GPR forSurface Mining // Proc. of the 2nd InternationalWorkshop on Advanced GPR . A Yarovoy(ed). Published by IEEE. (International ResearchCentre for Telecommunications and Radar, DelftUniversity, Netherlands). – 2003. – P. 115–119.
[13] Harmuth, H.F. Radiation of NonsinusoidalElectromagnetic Wave Advances in Electronics
116 Электромагнитные Явления, Т.7, №1 (18), 2007 г.
Application of Ground Penetrating Radar to Civil and Geotechnical Engineering
& Electron Physics // Suppplement. AcademicPress Inc., USA. – 1990. – V. 23.
[14] Harmuth H.F., Boules R. and Hussain M.Electromagnetic Signals : Reflection, Focusing,Distortion, and Their Practical Applications.– New York: Kluwer Academic/PlenumPublishers, USA. – 1999.
[15] Hugenschmidt H. Railway track inspection withGPR: some examples from Switzerland // Proc.of the 7–th International GPR Conference (Univ.of Kansas, Lawrence, USA) – 1998. – P. 197—202.
[16] Jol H.M. and Bristow C.S. GPR in sediments:advice on data collection, basic processing andinterpretation, a good practice guide. In: Bristow,C.S. and Jol, H.M. (eds.), GPR in Sediments,Geological Society of London, Special Publication211. – 2003. – P. 9–27.
[17] Kong F. Choice of antenna type and frequencyrange for testing concrete structures // Proc.of the 8-th International GPR Conference (GoldCoast, Australia). – 2000. – P. 268–272.
[18] Liu L. and Zhu L. GPR Signal Analysis:can we get deep penetration and highresolution simultaneously? // Proc. of the10-th International GPR Conference V. 1 (Delft,Netherlands). – 2004. – P. 263–266.
[19] Maierhofer C. and Kind T. Application ofimpulse radar for non-destructive investigationsof concrete structures // Proc. of the 9-thInternational GPR Conference SPIE Vol 4758(Santa Barbara, CA, U.S.A.) – 2002.– P. 382–387.
[20] McCann D.M. and Forde M.C.Review of NDTMethods in the Assessment of Concrete andMasonry Structures // NDT & E International– 2001. – V. 34, Issue 2. – P. 71–84.
[21] Noon D., Longstaff L. and Yelf. R.J. Advancesin the development of Step Frequency GPR //Proc. of the 5-th International GPR ConferenceV. 1 (Kitchener, Ontario, Canada). – 1994.– P. 117–131.
[22] Roberts R. Enhanced Target Imaging in 3D UsingGPR Data from Orthogonal Profile Lines //Proc. of the 9-th International GPR ConferenceSPIE (Santa Barbara, CA, U.S.A.). – 2002.– V. 4758. – P. 256–260.
[23] Saarenketo T. Electrical properties of waterin clay and silty soils // Journal of AppliedGeophysics – 1998. – V. 40. – P. 73–88.
[24] Shihab S. and Al-Nuaimy W. Hyperbola Fitterfor Characterisation of Cylindrical Targets inGPR Data // Proc. of the 11-th InternationalGPR Conference (Ohio State Univ., Ohio, USA).– 2006. (on CD-ROM)
[25] Smith D.G. and Jol H.M. Ground-penetratingradar: antenna frequencies and maximumprobable depths of penetration in Quaternarysediments // Journal of Applied Geophysics– 1995. – V. 33. – P. 93-1.
[26] Society of Exploration Geophysicists of JapanAdvisory Committee on Standardization// Application of Geophysical Methods toEngineering and Environmental Problems– 2004. – 301 P.
[27] The Concrete Society. Guidance on RadarTesting of Concrete Structures, Slough, UK:Concrete Soc. Technical Report. – 1997.– 114 P.
[28] Turner G. The Influence of Subsurface Propertieson GPR Pulses // PhD Thesis. Macquarie Univ,Sydney Australia. – 1993. – 174 P.
[29] Utsi E. Improving Definition — GPRInvestigations At Westminster Abbey //Proc. of the 11th International GPR Conference(Ohio State Univ., Ohio, USA). – 2006. (onCD-ROM)
[30] Ulriksen C.P. Application of impulse radar tocivil engineering // PhD Thesis Lund Universityof Technology, Sweden. Published by GeophysicalSurvey Systems Inc, Salem, NH, USA. – 1982– 178 P.
[31] Wensik W., Greeuw G., Hofman J. and VanDeen J. Measured underwater near field E-patterns of a pulsed, horizontal dipole antennain air: comparison with theory of continuouswave, infinitesimal electric dipole // GeophysicalProspecting – 1990. – V. 38. – P. 805–830.
[32] Wollny G. and Berktold A. GPR measurementson active, stabilised and potential landslides //Proc. of the 7th International GPR Conferenceon CD-ROM (Univ. of Kansas, Lawrence, USA).– 1998. – P. 401–406.
[33] Yelf R.J. Where is True Time Zero? // Proc. ofthe 10-th International GPR Conference Vol. 1(Delft University, Netherlands). – 2004a.– P. 279–282. (on CD-ROM)
[34] Yelf R.J. and Al-Nuaimy W. ClassificationSystem for GPR Parameters // Proc. of the 10-th International GPR Conference V. 1 (DelftUniversity, Netherlands). – 2004b. – P. 407–410.(on CD-ROM)
Electromagnetic Phenomena, V.7, №1 (18), 2007 117