Embed Size (px)
Citation preview
Application of High-Tech Bridge Safety Monitoring System on monitoring results
Chin-Kuo Huang1), Chung I Yen2), Wei F. Lee3), Cheng-Hsing Chen4), Ming-Cheng Chen5)
1),2)
Facilities and Assets Management Center for Infrastructures, National Taiwan University of Science and Technology, Taipei
3)Taoyuan County Government, TYCG, Taoyuan
4)Department of Civil Engineering, National Taiwan University, Taipei 5)
Department of Civil Engineering, Chien‐ Hsin University, Zhongli
Abstract
In 2008, Typhoon Sinlaku resulted in the collapse of the Houfeng Bridge. This occurrence revealed that judging whether or not a bridge is safe according to water level is no longer a sufficient method. Therefore, we will attempt to construct a high-tech safety monitoring system which measures the structural vibrations of the bridge and environmental parameters. We will use measurements of the riverbed scour depth monitoring system located around the pier cap as an authentication mechanism. We will obtain acceleration and inclination of the bridge as well as environmental parameters (water level, flow velocity) and use the scour depth to verify the effectiveness of the high-tech bridge safety monitoring system. By comparing the relationship between the bridge’s acceleration, inclination with environmental factors including water level, flow velocity and scour depth. We hope to gain a better understanding of the bridge’s reactions before, during and after typhoon flooding, which in turn would give us a better understanding of the influence of scouring and deposits on a bridge during a typhoon. Our monitoring results showed that during periods of flooding the scouring on the bridge significantly impacted the amplitude of its acceleration and the frequency of its inclination. Before the occurrence of scouring the acceleration amplitude and inclination frequency already accounted for the influence of the lateral thrust of the water. With the increase in acceleration amplitude and decrease in inclination frequency the creation of scouring can be effectively represented. For these reasons we can determine that the high-tech bridge monitoring system can be used as an early warning system.
1 Postdoctoral Research Fellow
2 Project Assistant Professor
3 Adviser
4 Professor
5 Associate Professor
212
1. INTRODUCTION
2008’s Typhoon Sinlakuand 2009’s Typhoon Morakot inflected serious damage on
Taiwan, causing the collapse of over 100 bridges, many human casualties as well as serious economic damage. Monitoring and early warning systems for bridges are important because bridges are a main channel of traffic and affect the condition of safe driving. Most bridge monitoring systems only monitor the water level and scour depth, using the depth of the water to determine if a bridge should be closed. With the collapses of the Houfong and Shuangyuan Bridges we can see that water level monitoring is not sufficient. The main reason for the collapse of these two bridges was the scouring of their foundation. It is very difficult to monitor scouring depth because the equipment must be buried in the riverbed. Not only is the required construction difficult and costly, often times it is destroyed by flood waters, rocks, floating logs and other debris during typhoon flooding. When we know the scour depth but are not able to directly deduce the safety level of the bridge it is necessary to use structural stability analysis to judge the safety condition of the bridge. Therefore it is impossible to determine a bridge’s safety by looking at the scour depth alone.
As for research related to the scouring of the area surrounding bridge piers during flooding, in 2008 Lu and others proposed a method by which the normal scour depth could be separated from total scour depth. They used the Xiluo Bridge on the Choshui River to test this method and found that over 79% of scour depth could be attributed to partial scouring. In 2011 Ali and others used a detection rod of known size and frequency change to monitor the change in the detection rod frequency and calculate the scouring depth of the river bed using a FBG sensor attached to the rod, but this method is only appropriate for use with very shallow levels of scouring. Terng and others (2011) developed a corresponding safety early warning monitoring platform for bridge safety monitoring. They tested the platform by installing it on the Zhongsha Bridge but are waiting for typhoon flooding so that they can verify its effectiveness. Kallaks and others used data model to test the current speed, water density and change in frequency around a bridge pier during flooding. The results showed that when the vortex-flow velocity reached 4-5m/s that the bridge pier may be damaged from the vibrations. Lin and others (2005, 2006, 2010) used fiber optics and a MEMS sensor to perform research on the relationship of water pressure and scour depth. They verified in laboratory tests that the sensor was usable and plan to try to use it in actual bridge safety monitoring. Most of the current bridge safety monitoring systems cannot withstand the test of typhoon flooding, usually during these times they are rendered ineffective and lose their practical value. Therefore with this paper we hope to develop a high-tech bridge safety monitoring system that monitors the vibrations of the bridge itself. By installing the monitoring instrument on the bridge pier caps it lowers the chance of them being damaged during flooding. They are able to directly measure the vibrations of the bridge and assist in monitoring the conditions of the surrounding environment such as the water level of the river, current speed and riverbed scour depth. Using comparative analysis of the monitoring data collected during periods of flooding we can understand how the bridge is influenced by these factors.
213
2. HIGH-TECH BRIDGE SAFETY MONITORING SYSTEM
2.1 Foundation for Monitoring System
1. Directly Obtain Bridge Stability Data
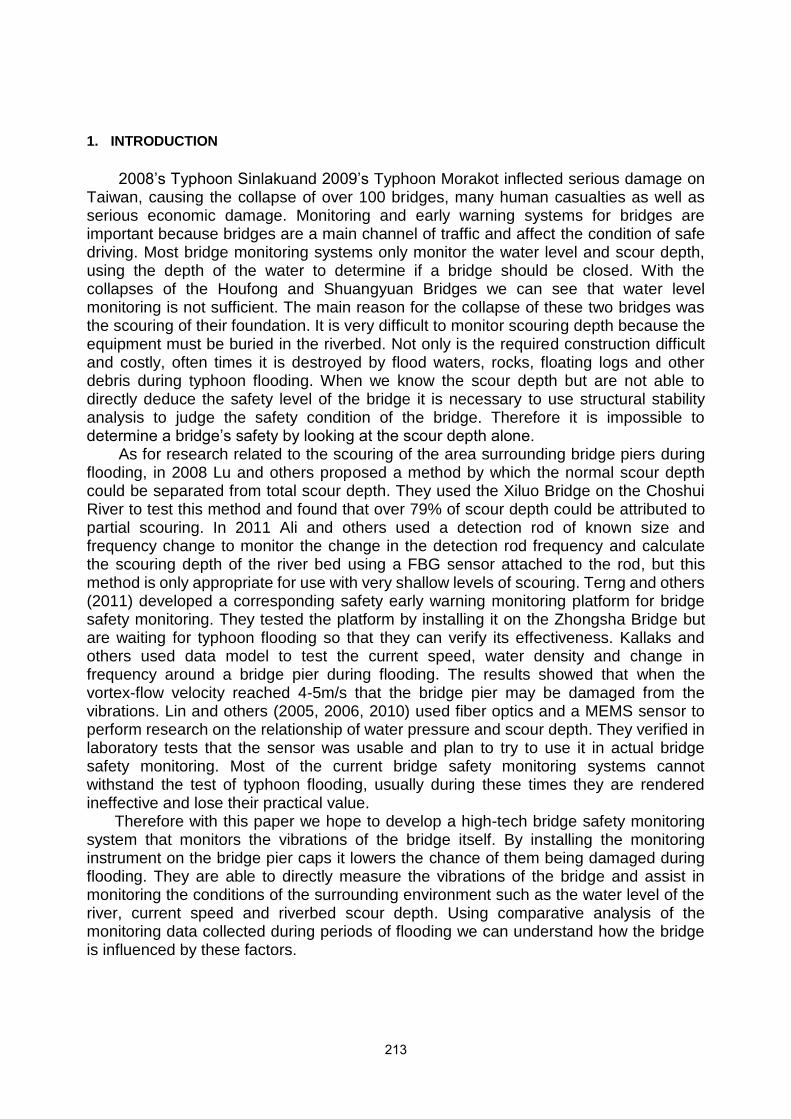
In this paper, we attempt to use a method of vibration monitoring [8-9] using monitoring equipment installed on the bridge’s pier cap. By measuring the vibration amplitude and change in frequency of the bridge pier itself we are able to understand the changes due to scouring of the bridge pier, this mechanics mechanism can be seen in Figure 1. After the bridge has been constructed or has been in operation for some time, the starting frequency should first be recorded as a reference, afterwards the changes in frequency and amplitude should be measured over time. When the bridge pier is faced with scouring from flood waters and becomes exposed, the frequency will decrease and the amplitude will greatly increase. Conversely, when depositing occurs the opposite is true, the frequency rises and the amplitude falls. In this way we are able to directly obtain the bridge’s structural reactions to typhoon flooding and then use the bridge’s vibration data to directly diagnose the stability of the bridge.
2. Optimal Construction
Because the monitoring equipment is installed on the bridge pier cap it can effectively lower the installation cost and increase the convenience of future maintenance.
3. Long Durability
The advantage of the high-tech bridge safety monitoring system used in this paper is that it avoids the risks associated with equipment installed directly into the riverbed and increases survivability during times of typhoon flooding.
Fig.1 Mechanism of pier in frequency change and amplitude change
Pier cap
Pile
Pile cap
Pier
Silt up
Initial
Scour
Concentrate
loading 1
Initial frequency
Initial amplitude
Frequency up
Amplitude down
Frequency down
Amplitude up
1
2
3
12 3
Complex
vibrate
Concentrate
loading 1
Concentrate
loading 1
Concentrate
loading 2
214
2.2 System Structure
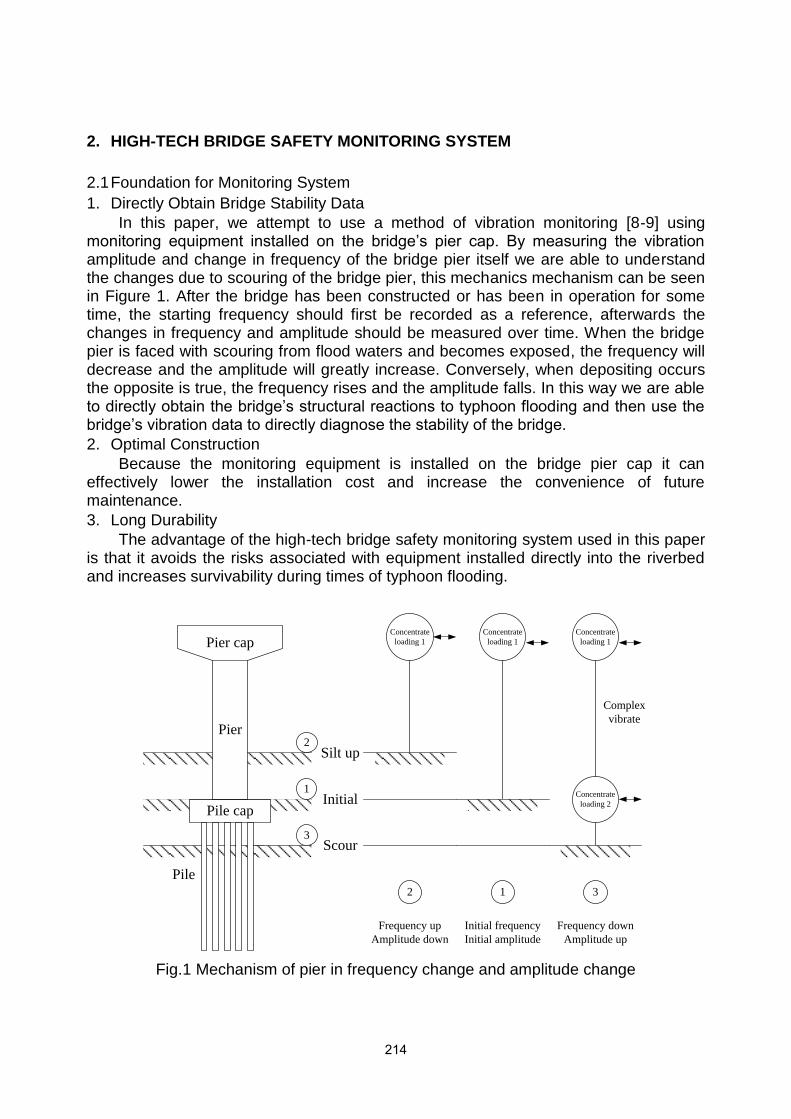
The structure of the high-tech bridge safety monitoring equipment developed for this paper can be seen in Figure 2. The main part is the data monitoring box whose inner components include a tri-axial accelerometer, biaxial inclinometer and an intelligent capture chip module. Outer parts include a thermometer, water level gauge and flow rate meter. With these instruments the system can immediately monitor the bridge’s acceleration, inclination and temperature change and can also monitor the river’s water level and change in flow velocity. When this is combined with the scour depth monitoring system and the CCTV image monitoring we can effectively clarify the influence of the water level, flood velocity and scour depth on the bridge’s vibration behavior. The system’s information transfer component includes a wifi wireless transmitter, fiber optic transmitter and 3G wireless transmission. These instruments send the monitoring data back to the remote server which can be immediately viewed on a website.
Fig.2 Architecture of monitoring system
2.3 Trial Plan
The Sinlaku Typhoon of 2008 caused heavy damage to Taiwan, including the collapse of many bridges, serious casualties as well as economic losses. In response the Directorate General of Highways set in motion a plan for a series of research projects in order to develop a high-tech bridge safety monitoring system to ensure the safety of bridges and their users. Because the Choshui River basin has significant scouring problems we chose the Xibin Bridge as the subject of our case study.
Cluster Box
3G
VNC virtual server
Personal
computer
FTP/Web
Server
1.scour monitoring system
ADSL/optical fiber
2.CCTV
215
3. CASE STUDY – XIBIN BRIDGE
3.1 Basic Information on the Xibin Bridge
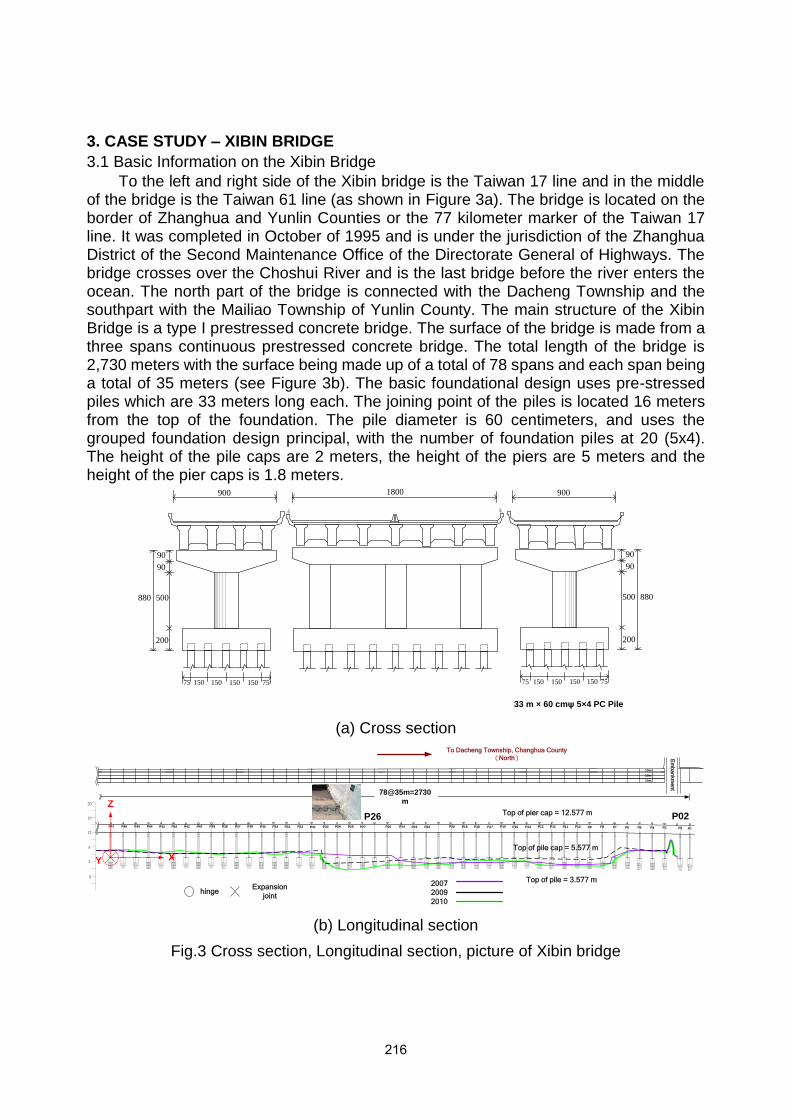
To the left and right side of the Xibin bridge is the Taiwan 17 line and in the middle of the bridge is the Taiwan 61 line (as shown in Figure 3a). The bridge is located on the border of Zhanghua and Yunlin Counties or the 77 kilometer marker of the Taiwan 17 line. It was completed in October of 1995 and is under the jurisdiction of the Zhanghua District of the Second Maintenance Office of the Directorate General of Highways. The bridge crosses over the Choshui River and is the last bridge before the river enters the ocean. The north part of the bridge is connected with the Dacheng Township and the southpart with the Mailiao Township of Yunlin County. The main structure of the Xibin Bridge is a type I prestressed concrete bridge. The surface of the bridge is made from a three spans continuous prestressed concrete bridge. The total length of the bridge is 2,730 meters with the surface being made up of a total of 78 spans and each span being a total of 35 meters (see Figure 3b). The basic foundational design uses pre-stressed piles which are 33 meters long each. The joining point of the piles is located 16 meters from the top of the foundation. The pile diameter is 60 centimeters, and uses the grouped foundation design principal, with the number of foundation piles at 20 (5x4). The height of the pile caps are 2 meters, the height of the piers are 5 meters and the height of the pier caps is 1.8 meters.
(a) Cross section
(b) Longitudinal section
Fig.3 Cross section, Longitudinal section, picture of Xibin bridge
880
75 150 150 150 150 75
500
200
90
90
880
7515015015015075
500
200
90
90
900 9001800
33 m × 60 cmψ 5×4 PC Pile
10m
10m
19m
78@35m=2730
m
P2 P1P3P4P5P6P7P8P9P10P11P12P13P14P15P16P17P18P19P20P22P23P24P25P27P28P29P30P31P32P33P34P35P36P37P38P39P40P41P42P43P44P45P46P47
Top of pile cap = 5.577 m
Top of pile = 3.577 m
Top of pier cap = 12.577 m
Em
ba
nkm
en
t
P26 P02
hingeExpansion
joint
To Dacheng Township, Changhua County
(North)
0
4
8
12
16
20
2007
2009
2010
X
Z
Y
216
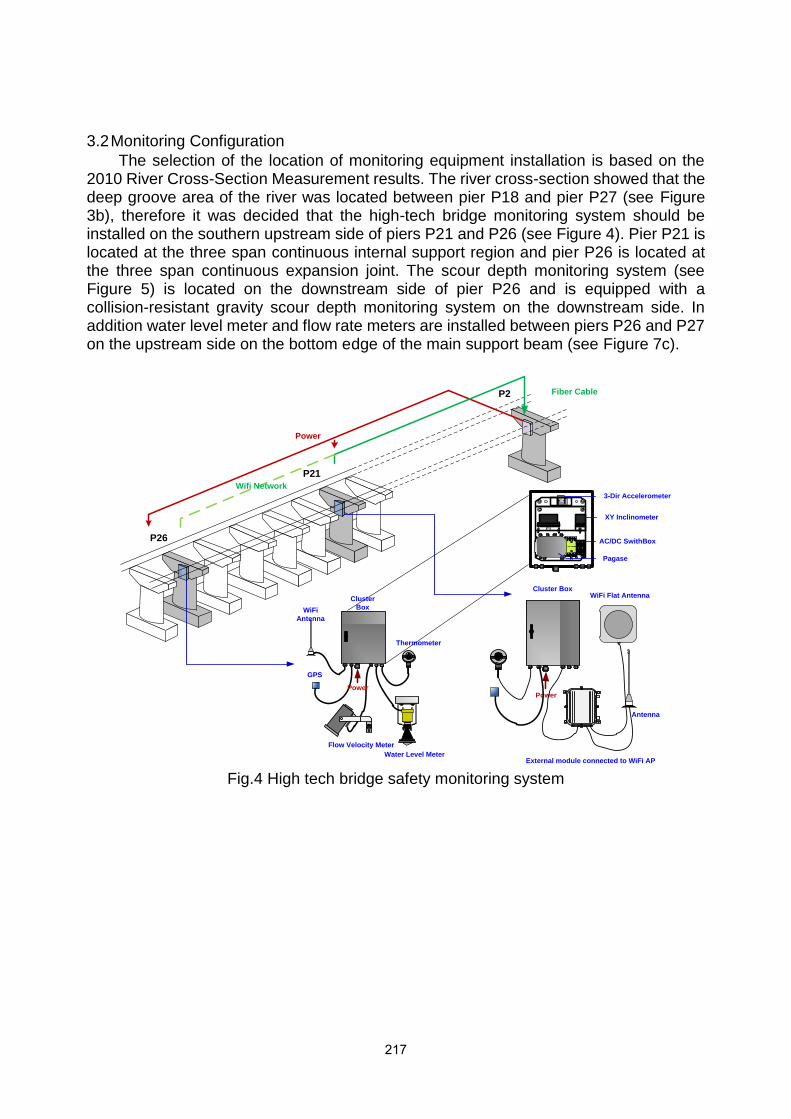
3.2 Monitoring Configuration
The selection of the location of monitoring equipment installation is based on the 2010 River Cross-Section Measurement results. The river cross-section showed that the deep groove area of the river was located between pier P18 and pier P27 (see Figure 3b), therefore it was decided that the high-tech bridge monitoring system should be installed on the southern upstream side of piers P21 and P26 (see Figure 4). Pier P21 is located at the three span continuous internal support region and pier P26 is located at the three span continuous expansion joint. The scour depth monitoring system (see Figure 5) is located on the downstream side of pier P26 and is equipped with a collision-resistant gravity scour depth monitoring system on the downstream side. In addition water level meter and flow rate meters are installed between piers P26 and P27 on the upstream side on the bottom edge of the main support beam (see Figure 7c).
Fig.4 High tech bridge safety monitoring system
P21
P26
P2 Fiber Cable
Power
Wifi Network3-Dir Accelerometer
XY Inclinometer
AC/DC SwithBox
Pagase
Thermometer
Cluster
Box
Water Level Meter
WiFi
Antenna
GPS
Flow Velocity Meter
Power
Cluster Box
Power
External module connected to WiFi AP
WiFi Flat Antenna
Antenna
217
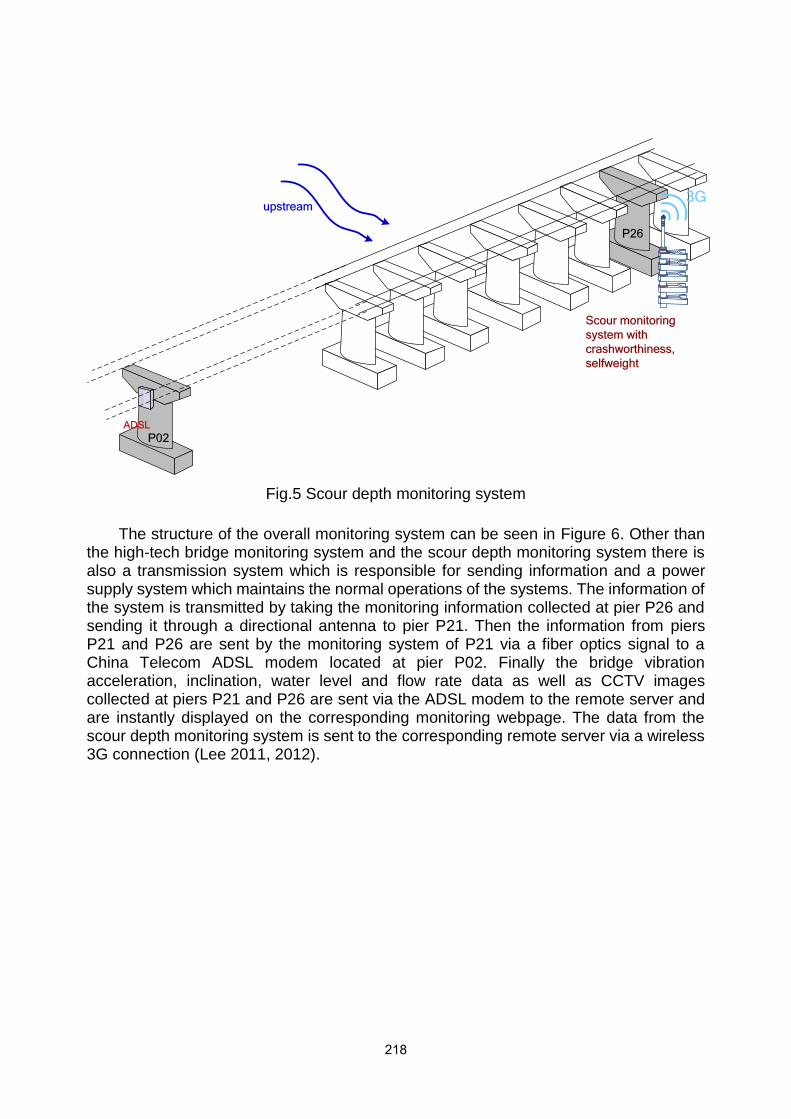
Fig.5 Scour depth monitoring system
The structure of the overall monitoring system can be seen in Figure 6. Other than the high-tech bridge monitoring system and the scour depth monitoring system there is also a transmission system which is responsible for sending information and a power supply system which maintains the normal operations of the systems. The information of the system is transmitted by taking the monitoring information collected at pier P26 and sending it through a directional antenna to pier P21. Then the information from piers P21 and P26 are sent by the monitoring system of P21 via a fiber optics signal to a China Telecom ADSL modem located at pier P02. Finally the bridge vibration acceleration, inclination, water level and flow rate data as well as CCTV images collected at piers P21 and P26 are sent via the ADSL modem to the remote server and are instantly displayed on the corresponding monitoring webpage. The data from the scour depth monitoring system is sent to the corresponding remote server via a wireless 3G connection (Lee 2011, 2012).
P26
P02ADSL
upstream
Scour monitoring
system with
crashworthiness,
selfweight
3G
218

Fig.6 Bridge safety monitoring system
3.3 Monitoring Instruments
The high-tech bridge monitoring system includes two parts: (1) structural vibration monitoring and (2) bridge environment monitoring. The system is installed on the southern upstream side of the bridge pier caps of piers P21 and P26 (see Image 7a). The main components of the system include:
(1) Structural vibration monitoring (Figure 7b): (a) A tri-axial accelerometer designed by the Silicon Designs Company and used to monitor the acceleration of the bridge’s vibrations, and (b) two (one for the XZ plane and one for the YZ plane) uniaxial inclinometers designed by Sherborne Sensors and used to monitor the change in vibrational inclination of the bridge.
(2) Bridge environment monitoring (Figure 7c): (a) A concrete thermometer designed by Sondex which is used to monitor the temperature change of the concrete, (b) a water level meter designed by VEGA Grieshaber KG used to monitor the change in water level and (c) a flow rate meter designed by Sommer GmbH & Co KG which is used to monitor the change in flow velocity.
The monitoring system is also equipped with a CCTV video camera which can monitor the images of changes in the river state or water level and an information processor and capture unit which is responsible for processing information and signal transmission.
Triaxial
accelerometer
(X、Y、Z)
Inclinometer
XZ、YZ plane
Concrete
thermometer
Scour monitoring
system with
embedded ,water
proof,
crashworthiness,
vibration sensing
CCTV
Data
logg
er
(CB)
Remotely
server
(NTUST)
Web page
Real time CCTV
logge
r
Alert system
GPS
Wifi AP Antenna
GPR
S
Scour monitoring
system with
crashworthiness
and self-weight
logge
r
GPR
S
GPS
Antenna
Triaxial
accelerometer
(X、Y、Z)
Inclinometer
XZ、YZ plane
Concrete
thermometer Data
logg
er
(CB)
Water level
meter
Flood velocity
meter
Pier 21
Pier 26
ADSL
BOX
P02
Power BOX
無線區域網路
Optical
fiber
DAQ
DAQ
Optical
converterpower
power
network
power
wifiUPS
UPS
219
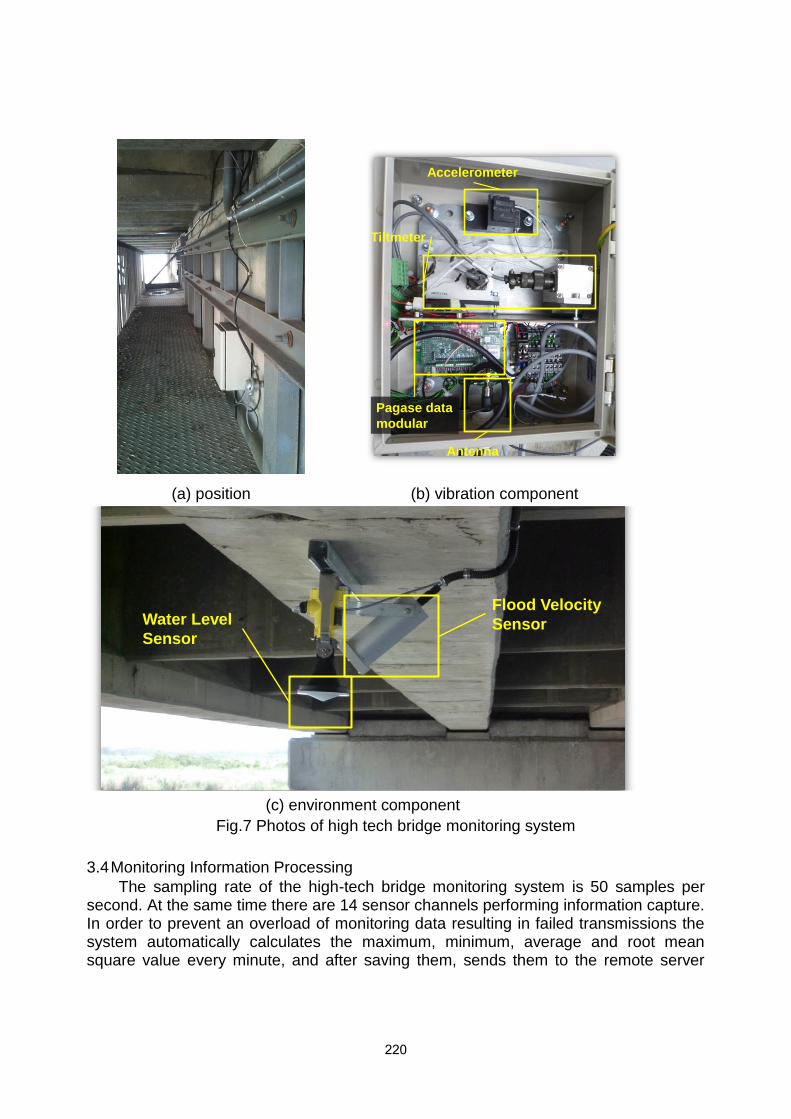
(a) position (b) vibration component
(c) environment component
Fig.7 Photos of high tech bridge monitoring system
3.4 Monitoring Information Processing
The sampling rate of the high-tech bridge monitoring system is 50 samples per second. At the same time there are 14 sensor channels performing information capture. In order to prevent an overload of monitoring data resulting in failed transmissions the system automatically calculates the maximum, minimum, average and root mean square value every minute, and after saving them, sends them to the remote server
Accelerometer
Tiltmeter
Pagase data
modular
Antenna
Flood Velocity
SensorWater Level
Sensor
220
where they are instantly displayed on the monitoring website. As for the raw data, the data for every 10 minutes is compressed into a file and sent back to the remote server where it is saved.
3.5 Collision-Resistant Gravity Scour Depth Monitoring System
The main purpose for using the scour depth monitoring system is to verify the applicability of the use of the high-tech bridge monitoring system to estimate scour depth. Two different type of scour depth monitoring systems were used in this paper.
The collision-resistant gravity scour depth monitoring system (see Figure 8) is installed on the downstream side of pier P26. Its main components include (1) a gravity detection rod, (2) a double layered protective casing and (3) a fixed bridge pillar guide groove and information capture system. These components are explained in detail below:
(1) The main function of the gravity detection rod is for self-protection. When scouring occurs the detection rod will automatically sink to the scouring depth. Therefore it is only able to measure scouring of the riverbed and cannot measure occurrences of deposit in the riverbed.
(2) The double layered protective casing is made up of two layers of casings with different diameters and is made up of the same material as the detective rod. There is strengthening material placed between the two casing layers which bind the two layers together into one unit (But there still needs to be a certain amount of distance between the wall of the outer casing and wall of the inner casing to allow the detective rode to act as a buffer when the rod collides with other objects). A gravity detection rod which has the ability to slide around is placed inside the inner walls of the inner casing layer. When the rod is stuck by foreign objects and the outer casing splits or bends, the inner casing will not be influenced due to the buffer effect between the two casing walls. Also the bottom of the protective casing can touch the riverbed at any time due to the effects of gravity allowing for the detective rod to protect itself.
(3) The function of the guiding grooves is to make sure that the protective casing only slides along the Z direction (perpendicular to the river’s surface). The material used to make the guiding grooves is also made up of stainless steel or galvanized anti-corrosive materials. For the guiding grooves to work during flood waters the more grooves there are the more stable it will be. In this way even if the lower equipment of guiding grooves are destroyed by flood waters or the detective rod is bent out of shape we can be sure that the protective casing and detective rode (or only the detective rod) move along the perpendicular (Z) direction. The total length of the collision-resistant gravity scour depth monitoring rod is 8.5 meters. The length of the double layered protective casing is 7 meters and is fixed to the H-shaped steel which connects the pier cap with the foundation cap. There is a ring at every 50 centimeters which connects the H-shaped steel with the scour meter. Also there are strengtheners attached at every 1.5 meters under the pier cap to prevent the scour meter rod from being damaged by flood waters.
221
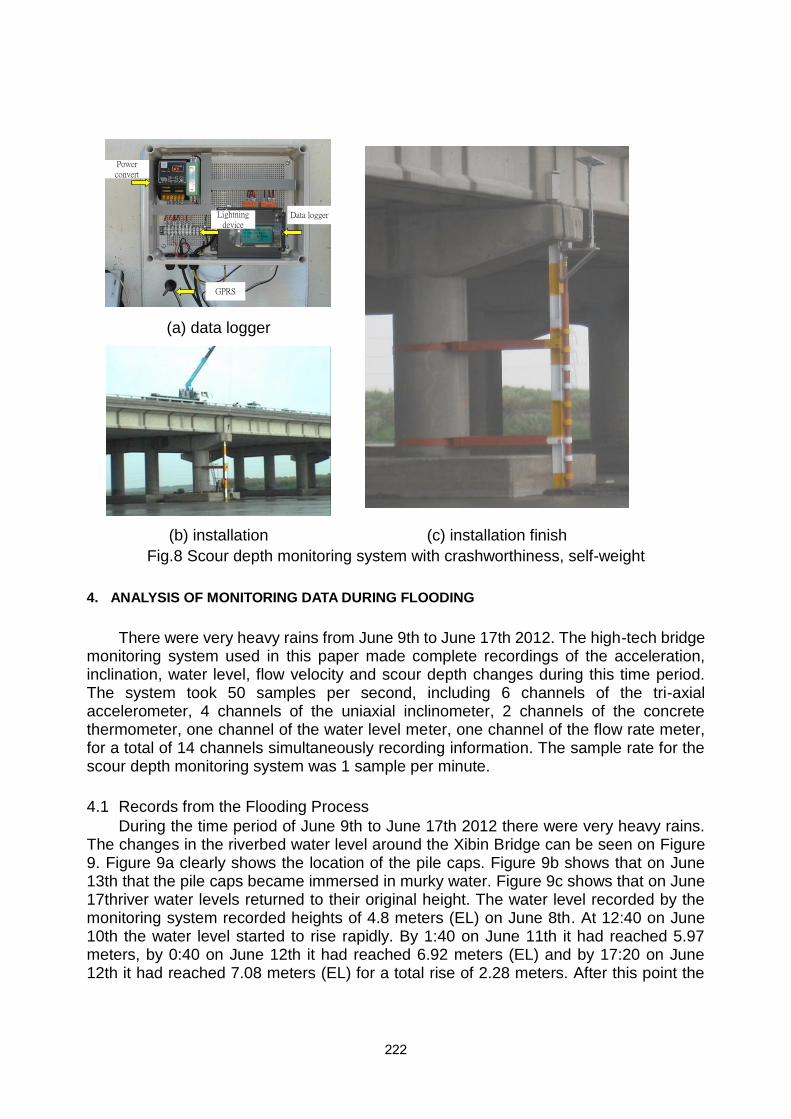
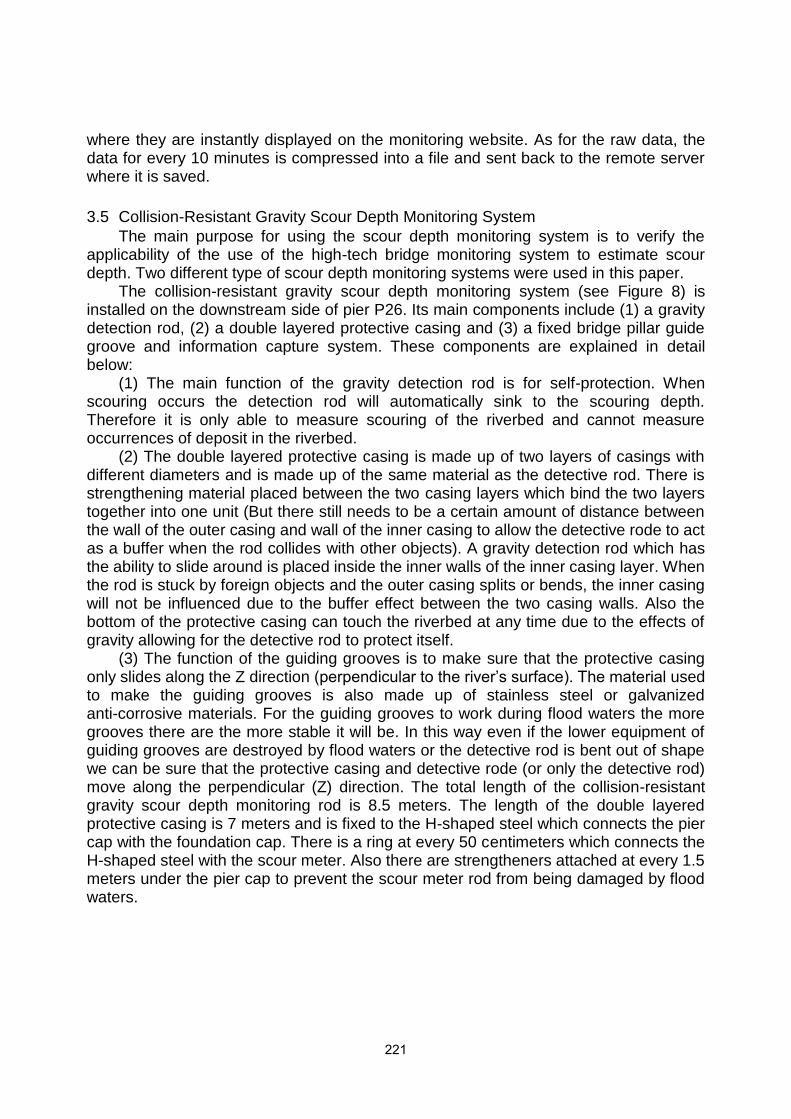
(a) data logger
(b) installation (c) installation finish
Fig.8 Scour depth monitoring system with crashworthiness, self-weight
4. ANALYSIS OF MONITORING DATA DURING FLOODING
There were very heavy rains from June 9th to June 17th 2012. The high-tech bridge monitoring system used in this paper made complete recordings of the acceleration, inclination, water level, flow velocity and scour depth changes during this time period. The system took 50 samples per second, including 6 channels of the tri-axial accelerometer, 4 channels of the uniaxial inclinometer, 2 channels of the concrete thermometer, one channel of the water level meter, one channel of the flow rate meter, for a total of 14 channels simultaneously recording information. The sample rate for the scour depth monitoring system was 1 sample per minute.
4.1 Records from the Flooding Process
During the time period of June 9th to June 17th 2012 there were very heavy rains. The changes in the riverbed water level around the Xibin Bridge can be seen on Figure 9. Figure 9a clearly shows the location of the pile caps. Figure 9b shows that on June 13th that the pile caps became immersed in murky water. Figure 9c shows that on June 17thriver water levels returned to their original height. The water level recorded by the monitoring system recorded heights of 4.8 meters (EL) on June 8th. At 12:40 on June 10th the water level started to rise rapidly. By 1:40 on June 11th it had reached 5.97 meters, by 0:40 on June 12th it had reached 6.92 meters (EL) and by 17:20 on June 12th it had reached 7.08 meters (EL) for a total rise of 2.28 meters. After this point the
Power convert
Data logger
GPRS
Lightning device
222
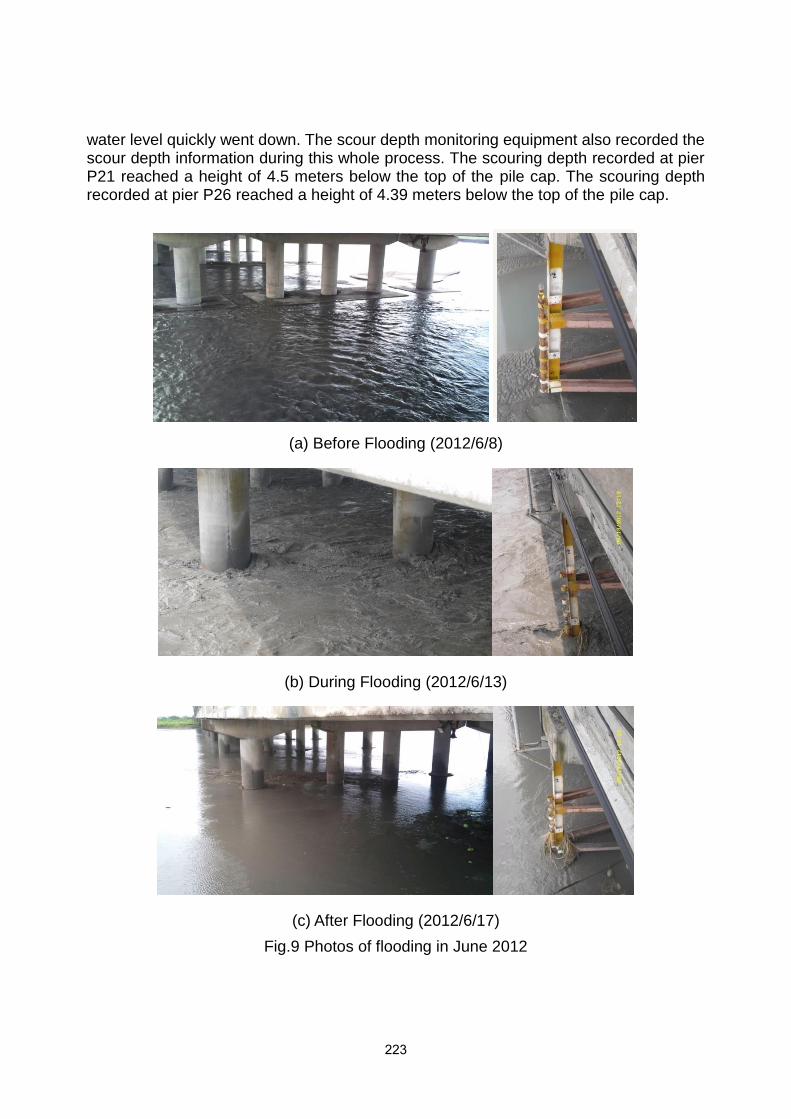
water level quickly went down. The scour depth monitoring equipment also recorded the scour depth information during this whole process. The scouring depth recorded at pier P21 reached a height of 4.5 meters below the top of the pile cap. The scouring depth recorded at pier P26 reached a height of 4.39 meters below the top of the pile cap.
(a) Before Flooding (2012/6/8)
(b) During Flooding (2012/6/13)
(c) After Flooding (2012/6/17)
Fig.9 Photos of flooding in June 2012
223
4.2 Comparison of Acceleration Amplitude and Water Level, Flow Rate and Scour Depth
Figure 10 show the relationship between the acceleration amplitude and the water level, flow rate, scour depths recorded at piers P26. A detailed comparison can be found
below:
4.2.1 Comparison of Water Level and Flow Velocity
Comparing the water level and flow velocity we can see that when the water level increases rapidly that the flow velocity rapidly rises with it. However when the water level slowly rises or lowers the flow velocity increases until it reaches a maximum level, after which it begins to decrease. Similarly when the water level slowly decreases the flow velocity also reaches a peak during the process.
4.2.2 Comparison of Water Level, Flow velocity and Scour Depth
From Figure 10 we can see the comparison curves of water level, flow velocity and scour depth. When scouring occurs the water level is always in the process of rising and the flow velocity is in the process of going down. This shows us that when the water level is increasing but the flow rate is decreasing that we should be on the lookout for occurrences of scouring.
4.2.3 Comparison of Water Level, Flow Velocity and Acceleration Amplitude
When comparing water level, flow velocity and acceleration amplitude we find that when the water level and flow velocity gradual goes up that the acceleration amplitude also gradually rises. This tells us that the bridge is first influenced by the increase in water level and flow velocity, taking on a larger lateral thrust force and resulting in an increase of acceleration amplitude. After scouring occurs the acceleration reaches its max. From these findings we can see that by monitoring the acceleration amplitude changes we are able to gain additional warning time. The changes in the water level and flow velocity can directly show the lateral thrust condition of the bridge. With the riverbed also possibly having occurrences of scouring or deposits the acceleration amplitude will show a pattern of first increasing then decreasing.
4.2.4 Comparison of Acceleration Amplitude and Scour Depth
Figure 10 shows the acceleration amplitude of pier P26 when the scour depth is at heights between -0.79 meters and -2.09 meters, there is no significant change in the acceleration. When the scour depth is between -2.09 meters to -2.49 meters there is a slight increase in acceleration. When the scour depth is between -2.49 meters to -3.69 meters it is obvious the acceleration has started to occur before the scouring. This is because the effects of flood waters cause the amplitude to gradually rise about 10 hours in advance. When the scour depth is between -3.69 meters and -4.39 meters the acceleration gradually increases about 17 hours in advance due to the effects of flood waters.
The acceleration amplitude of the x-axis and y-axis of pier P26 is roughly the same, around 0.01g. When flooding occurs the acceleration amplitude increases to around 0.03g, but the x-axis and y-axis amplitude are still close to the same. After flooding recedes acceleration amplitude gradually returns to normal vibration levels. The measurement of the acceleration amplitude allows us to directly observe the vibrational effects on the bridge during times of flooding. And after flooding has receded we can see from the acceleration amplitude response if the riverbed is in a state of scouring or
224
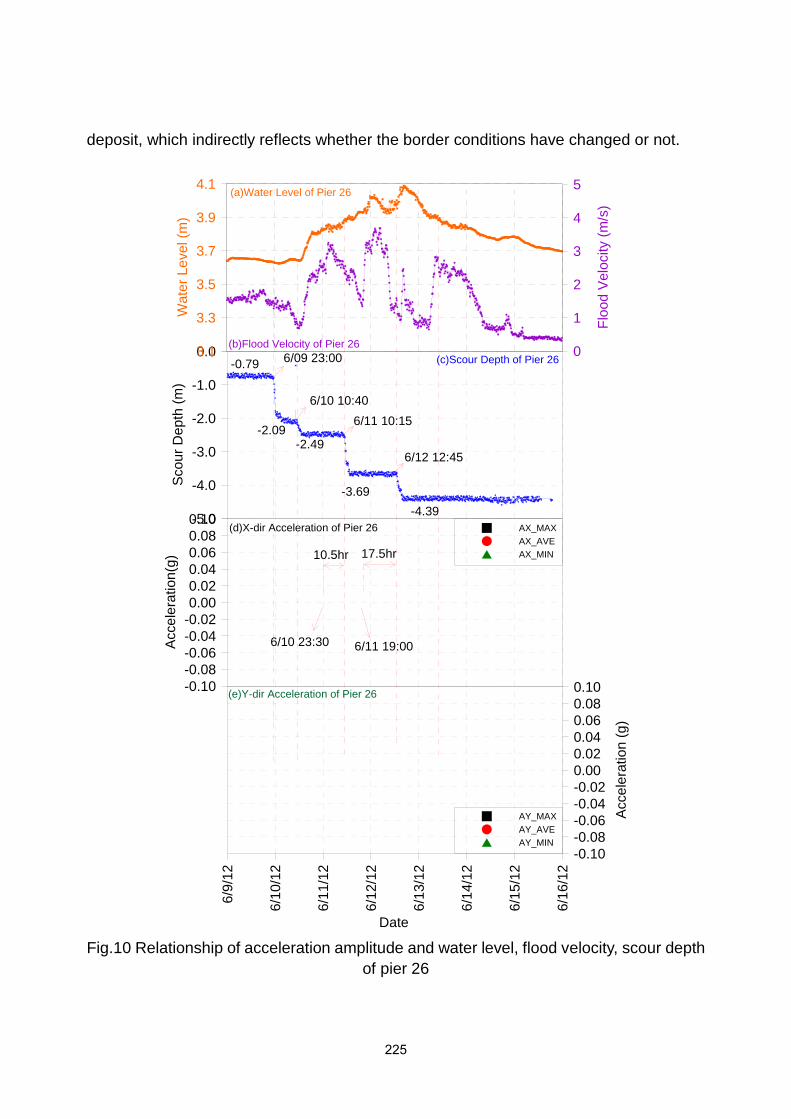
deposit, which indirectly reflects whether the border conditions have changed or not.
Fig.10 Relationship of acceleration amplitude and water level, flood velocity, scour depth
of pier 26
-5.0
-4.0
-3.0
-2.0
-1.0
0.0
Sco
ur
De
pth
(m
)
-0.10
-0.08
-0.06
-0.04
-0.02
0.00
0.02
0.04
0.06
0.08
0.10
Accele
ratio
n(g
)
AX_MAX
AX_AVE
AX_MIN
6/9
/12
6/1
0/1
2
6/1
1/1
2
6/1
2/1
2
6/1
3/1
2
6/1
4/1
2
6/1
5/1
2
6/1
6/1
2
Date
-0.10
-0.08
-0.06
-0.04
-0.02
0.00
0.02
0.04
0.06
0.08
0.10
Acce
lera
tio
n (
g)
AY_MAX
AY_AVE
AY_MIN
6/09 23:00-0.79
-2.09
6/10 10:40
6/11 10:15
6/12 12:45
-3.69
-2.49
-4.39
6/11 19:00
17.5hr
6/10 23:30
10.5hr
3.1
3.3
3.5
3.7
3.9
4.1W
ate
r L
eve
l (m
)
0
1
2
3
4
5
Flo
od V
elo
city (
m/s
)
(a)Water Level of Pier 26
(b)Flood Velocity of Pier 26
(d)X-dir Acceleration of Pier 26
(e)Y-dir Acceleration of Pier 26
(c)Scour Depth of Pier 26
225

4.3 Comparison of Inclination Frequency with Flow Velocity and Scour Depth
In this section we will explain the calculation method used to obtain the inclination frequency and take a look at the relationship of the inclination frequency with the flow
velocity and scour depth. The comparison results of pier P26 are as follows:
4.3.1 Inclination Frequency Analysis
The sample rate of the tilt meter was 50 samples per second and in this paper we separated time segments into units of 30 seconds. FFT analysis require that the number of time points are squared, therefore with original 30 seconds (1,500 points) of data, there was 548 points left over, after taking 548 points from the next 30 seconds we get a total of 2,048 points (40.96 seconds) of data that we can use as an spectrum analysis. From the results of the vibration measurements we know that the frequency of the bridge came at a range of 5Hz and below, therefore the range of 0Hz – 5Hz was a range of peak intensity value frequency and was chosen as a representative for the frequency value of the 30 seconds in question.
In Figure 11 we can see the comparison of the change over time in the inclination frequency and the scour depth. The image labels TX as the rotation around the x-axis (the changes of the YZ plane) and TY as the rotation around the y-axis (the rotation of the XZ plane). The figure shows that the changes in TY frequency have no significant relationship with the scour depth but the frequency of TX decreases as the scour depth increases. The figure shows that for frequencies of around 2.0Hz that there existed a change relationship between the significant frequency and the scour depth. The second level modal frequency of the y-axis of the significant frequency and vibration measurement remained constant (f=1.83Hz), showing that the modal frequency of this time period was more sensitive to environmental influences.
Figure 11 shows that among a few of the significant frequencies of the TX tilt meter only frequencies close to 2Hz obviously changed with the movements of scour depth. Therefore during our analysis we performed a fixed frequency range analysis on this significant frequency. We did an additional time-frequency analysis, but this time we limited the frequency range to 1.4Hz – 2.2Hz, and selected those frequencies in this range which had maximum intensity to represent the frequency of this 30 second time period. Afterwards we took the average of 1 hour of data (120 points) and got the average frequency of this hour and used it together with the water level, flow velocity and scour depth to organize a 1 hour relationship chart between the average frequency (which used the regressive curve) and scour depth (seen in Figure 12).
226
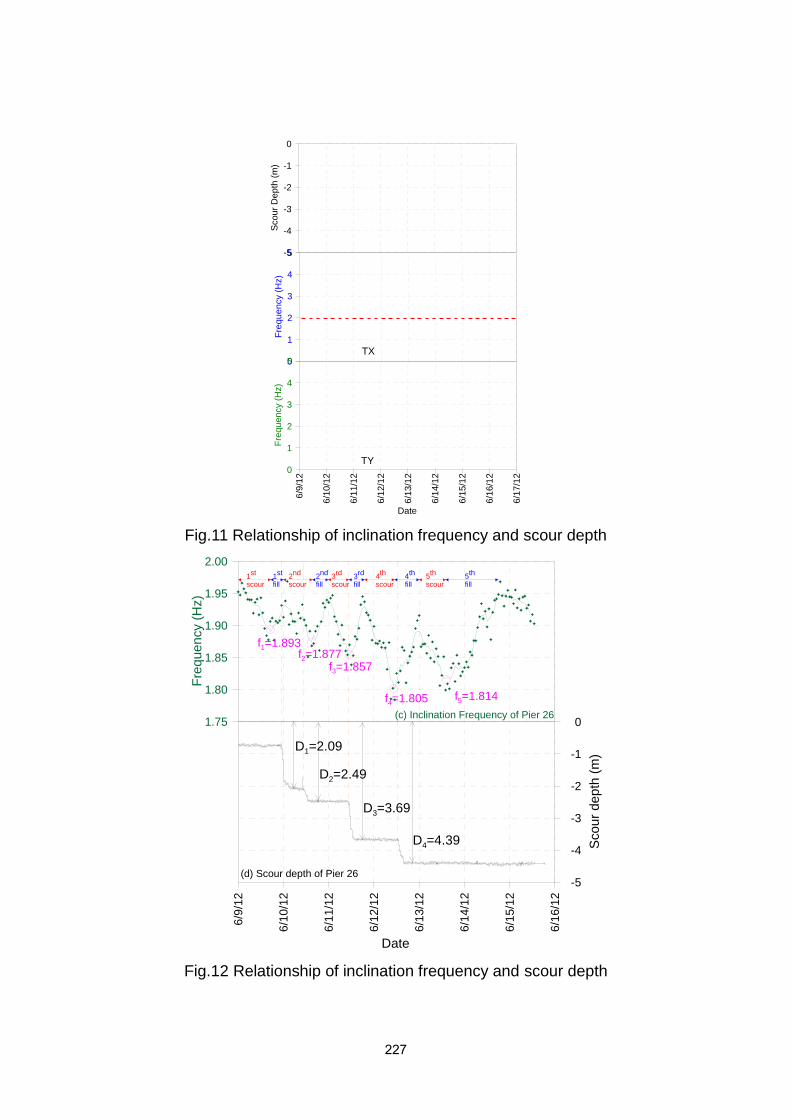
Fig.11 Relationship of inclination frequency and scour depth
Fig.12 Relationship of inclination frequency and scour depth
0
1
2
3
4
5
Fre
quency (
Hz)
-5
-4
-3
-2
-1
0
Scour
Depth
(m
)
6/9
/12
6/1
0/1
2
6/1
1/1
2
6/1
2/1
2
6/1
3/1
2
6/1
4/1
2
6/1
5/1
2
6/1
6/1
2
6/1
7/1
2Date
0
1
2
3
4
5
Fre
quency (
Hz)
TX
TY
1.75
1.80
1.85
1.90
1.95
2.00
Fre
qu
en
cy (
Hz)
6/9
/12
6/1
0/1
2
6/1
1/1
2
6/1
2/1
2
6/1
3/1
2
6/1
4/1
2
6/1
5/1
2
6/1
6/1
2
Date
-5
-4
-3
-2
-1
0
Sco
ur
de
pth
(m
)
D1=2.09
D2=2.49
D3=3.69
D4=4.39
(d) Scour depth of Pier 26
(c) Inclination Frequency of Pier 26
f1=1.893f2=1.877
f3=1.857
f4=1.805 f5=1.814
1st
scour2
nd
scour3
rd
scour4th
scour5
th
scour1
st
fill2
nd
fill3
rd
fill4
th
fill5
th
fill
227
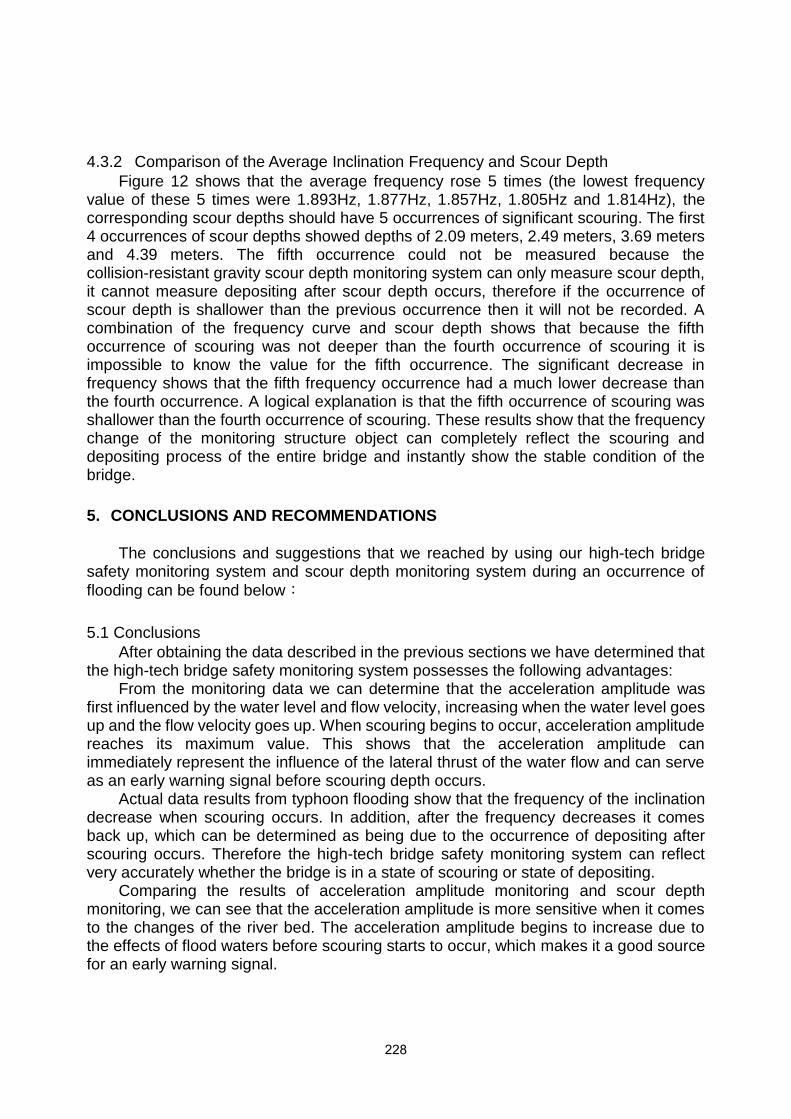
4.3.2 Comparison of the Average Inclination Frequency and Scour Depth
Figure 12 shows that the average frequency rose 5 times (the lowest frequency value of these 5 times were 1.893Hz, 1.877Hz, 1.857Hz, 1.805Hz and 1.814Hz), the corresponding scour depths should have 5 occurrences of significant scouring. The first 4 occurrences of scour depths showed depths of 2.09 meters, 2.49 meters, 3.69 meters and 4.39 meters. The fifth occurrence could not be measured because the collision-resistant gravity scour depth monitoring system can only measure scour depth, it cannot measure depositing after scour depth occurs, therefore if the occurrence of scour depth is shallower than the previous occurrence then it will not be recorded. A combination of the frequency curve and scour depth shows that because the fifth occurrence of scouring was not deeper than the fourth occurrence of scouring it is impossible to know the value for the fifth occurrence. The significant decrease in frequency shows that the fifth frequency occurrence had a much lower decrease than the fourth occurrence. A logical explanation is that the fifth occurrence of scouring was shallower than the fourth occurrence of scouring. These results show that the frequency change of the monitoring structure object can completely reflect the scouring and depositing process of the entire bridge and instantly show the stable condition of the bridge.
5. CONCLUSIONS AND RECOMMENDATIONS
The conclusions and suggestions that we reached by using our high-tech bridge
safety monitoring system and scour depth monitoring system during an occurrence of
flooding can be found below:
5.1 Conclusions
After obtaining the data described in the previous sections we have determined that the high-tech bridge safety monitoring system possesses the following advantages:
From the monitoring data we can determine that the acceleration amplitude was first influenced by the water level and flow velocity, increasing when the water level goes up and the flow velocity goes up. When scouring begins to occur, acceleration amplitude reaches its maximum value. This shows that the acceleration amplitude can immediately represent the influence of the lateral thrust of the water flow and can serve as an early warning signal before scouring depth occurs.
Actual data results from typhoon flooding show that the frequency of the inclination decrease when scouring occurs. In addition, after the frequency decreases it comes back up, which can be determined as being due to the occurrence of depositing after scouring occurs. Therefore the high-tech bridge safety monitoring system can reflect very accurately whether the bridge is in a state of scouring or state of depositing.
Comparing the results of acceleration amplitude monitoring and scour depth monitoring, we can see that the acceleration amplitude is more sensitive when it comes to the changes of the river bed. The acceleration amplitude begins to increase due to the effects of flood waters before scouring starts to occur, which makes it a good source for an early warning signal.
228
5.2 Recommendations
After performing a comparison analysis on the data collected from the Xibin Bridge on the Taiwan 17 Line we can see that for the topic of bridge safety monitoring it is advisable to perform real-time monitoring of the bridge structure’s vibration behavior in order to understand the stability of the bridge. The changes in acceleration amplitude and inclination frequency before and after the typhoon flooding allow us to directly understand the stability and safety of the bridge before and after the typhoon. We have seen that the bridge safety monitoring system can be a big help to bridge management organizations for performing bridge safety maintenance work during times of typhoon flooding.
Reference
Lu, J.Y. Hong, J.H. Su, C.C. Wang, C.Y. and Lai, J.S. (2008) "Field measurements and simulation of bridge scour depth variations during floods," Journal of Hydraulic Engineering, pp. 810-821.
Zarafshan, A., Iranmanesh, A., and Ansari, F. (2012) "Vibration-Based Method and Sensor for Monitoring of Bridge Scour, " Journal of Bridge Engineering, ASCE,No. 17, pp. 829-838.
Tserng, H.P.S. Ju, H. K. Chang, C.C. Feng, W. Lin, C.T. J. Han, Y. Weng, K.W. Peng, N.H. Chung, H.C. Chang, P.S. Chen, P.C. (2011), "Development and testing of integrated bridge disaster prevention and management platform, " Proceedings of the 28th ISARC, Seoul, Korea, pp. 772-776.
Thanut Kallaka, Wang, C.J. (2011), "Efficient numerical model for studying bridge pier collapse in floods, " World Academy of Science, Engineering and Technology, No. 60, pp. 1011-1016 .
Lin, Y.B. Chen, J.C. Chang, K.C. Chen, J.C. and Lai, J.S. (2005), "Real-time monitoring of local scour by using fiber Bragg grating sensors," Smart Materials and Structures, No. 14, pp. 664-670.
Lin, Y.B. Lee, C.C. Chen, J.C. Chang, K.C. and Lai, J.S. (2006), "Bridge local scour monitoring system using MEMS sensor zigbee network," NSTI Nanotechnology Conference and Trade Show – Nanotech 2006 - 9th Annua, pp. 451-454.
Lin, Y.B. Lai, J.S. Chang, K.C. Chang, W.Y. Lee, F.Z. and Tan, Y.C. (2010), "Using MEMS Sensors in The Bridge Scour Monitoring System," Journal of the Chinese Institute of Engineers, ASCE, Vol. 33, No. 1, pp.10 25-35.
Ko, Y.Y. Lee, W.F. Chang, W.K. Mei, H.T. and Chen, C.H. (2010), "Scour evaluation of bridge foundation using vibration measurement," International Conference on Scour and Erosion (ICSE-5), San Francisco, CA, USA, pp. 884-893.
Lee, W.F. Cheng, T.T. Huang, D.J. Yen, C.I. and Mei, HT. (2012), "Performance of a highway bridge under extreme natural hazards - A case study on bridge performance during 2009 typhoon Morakot," Journal of Performance of Constructed Facilities, Accepted.
229

Chang, W.K. Lee, W.F. Mei, H.T. and Chen, C.H. (2011), "Structures health monitoring and damage diagnosis," The Magazine of the Chinese Institute of Civil and Hydraulic Engineering, Vol. 38, No.3, pp.17-25.
Cheng, T.T. Huang, C.K. Lee, W.F. Yen, C.I. (2012) "Study on bridge long term vibration characters monitoring," The eleven national conference on structural engineering and
the first national conference on earthquake engineering, Taichung,paper number:
11NCSE-16022 . Lee, W.F. Chen, C.H. Yen, C.I. Lin, Y.C. Lien, H.P. Chen, M.C. Huang, C.K. Chang,
W.K. Mei, H.T. Li, K.W. Wang, C.W. Cheng, T.T. (2012 )Build and test plan of high
tech bridge real-time monitoring system (Xibin bridge) report,Taipei.
230