Embed Size (px)
Citation preview
Application of Lean Process To Software Engineering via
Value-Stream Mapping13th Annual NDIA Systems Engineering Conference – Oct 2010
Prepared by:Shawn Rahmani, Lew Nelson, and Tom TreffnerBoeing Defense, Space & SecurityHuntington Beach, California
2
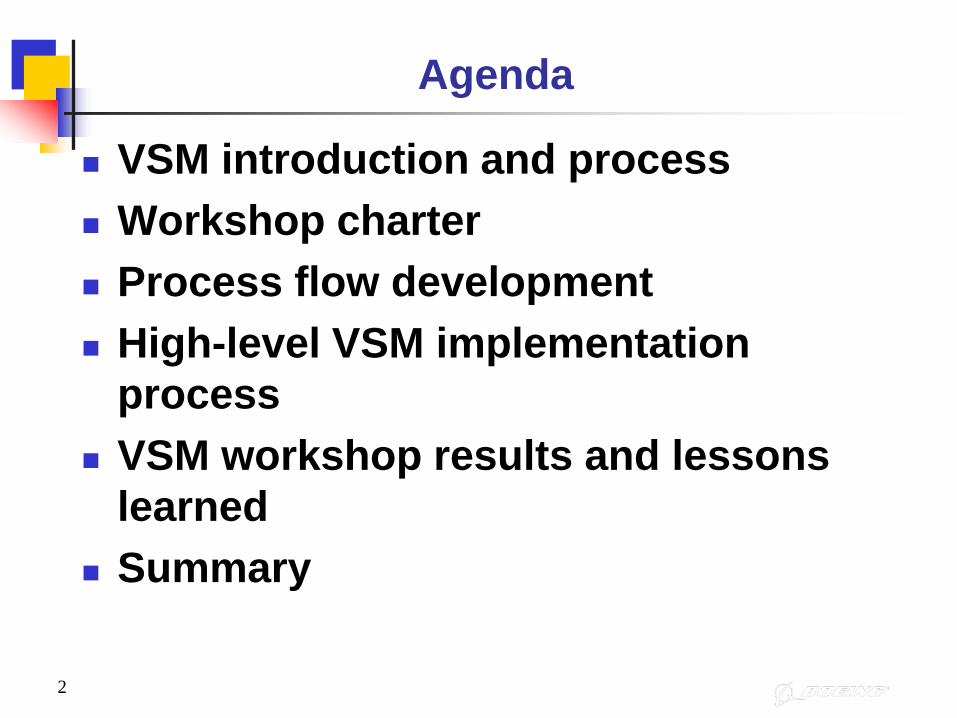
Agenda
VSM introduction and process Workshop charter Process flow development High-level VSM implementation
process VSM workshop results and lessons
learned Summary
3
Definition
Value stream mapping is a technique used to identify and strip wasteful steps out of a company's flow of information and materials. The end goal of the technique is to make the company "lean," meaning free of wasted effort. Toyota is generally given credit for the development of lean production techniques, which have been adapted and added to by succeeding generations of managers and consultants .
4
VSM – Process Example When we talk about process, we mean every
step that occurs from the supply chain to the point where the customer receives the finished product. For example, value stream mapping for a paper mill might begin at the receipt of raw materials, such as wood and chemicals, and end at the shipment of finished, packaged paper products. Note that lean techniques such as value stream mapping may be applied to any segment of the larger process. More often than not, companies divide their process into discrete sections, allowing several teams of experts to apply lean techniques simultaneously.
5
VSM – Value and Waste Value is adding to the product something which the
customer wants or needs. Returning to the paper mill example, value steps are those that give the paper the desired dimensions, color, composition, etc. Waste, on the other hand, is any step that does not add value. The most commonly cited forms of waste are movement of the product, equipment or employees unnecessarily; maintaining an inventoryof raw materials or products waiting to be worked upon; making more parts or products than there is customer demand for; processing a component more than the customer actually needs or expects; quality checks; or the subsequent reprocessing of defects.
6
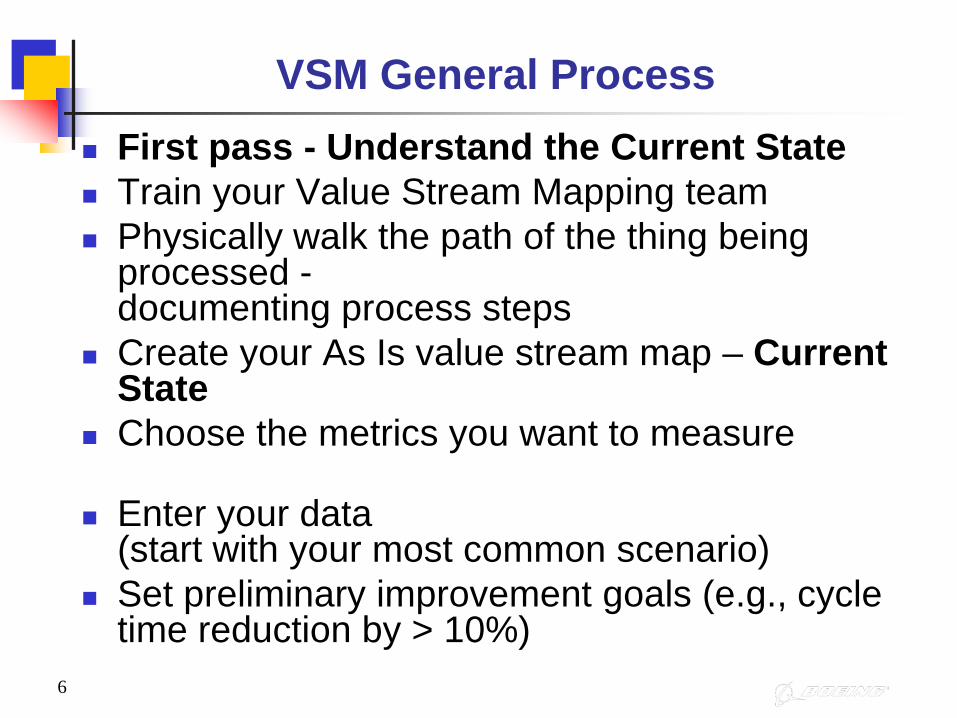
VSM General Process First pass - Understand the Current State Train your Value Stream Mapping team Physically walk the path of the thing being
processed -documenting process steps
Create your As Is value stream map – Current State
Choose the metrics you want to measure
Enter your data (start with your most common scenario)
Set preliminary improvement goals (e.g., cycle time reduction by > 10%)
7
VSM General Process
Second Pass - Analyze and Reflect Analyze and gain consensus for your value
stream analysis Identify problems and root causes Reflect, ponder, and think...
8
VSM General Process Third Pass – Improve – Set/update improvement
goal It is common to improve your value stream in phases:
Meet customer demand (immediately) Organize for continuous flow Level the work flow
For each phase, create a Value Stream Plan, with specific assignments and deadlines
Each "next phase" should have a timeline of no more than six months to have everything on that Value Stream Plan completely implemented.
Continuously Improve Add data for multiple scenarios

9
Steps to Analyze a Current State Value Stream Map
Look for Typical Types of Waste1. Excessive hand-offs2. Review cycles (lengthy/ multiple)3. Product sitting in long queues4. Series steps that could be performed in parallel5. Built-in rework loops6. Product moving to pre-defined schedules7. Excessive Inventory8. Products being pushed throughout system9. Observed cycle times not captured (missing/
estimated)10. Multiple (or no) info-arrows going into process
boxes (Unclear communication of requirements)11. Cycle time imbalance (between processes)12. Lack of continuous flow – decoupled processes13. Unnecessary movement of product via crane/
forklift/ etc.14. Lots of shared resources (less than 100%
utilization/ availability)15. Defects/ rework loops
10
VSM Workshop Charter Title: Lean/VSM Assessment Workshop for
Software Engineering Process Mission Statement: Perform an initial lean
assessment of SW Eng process using Value Stream Mapping. Main objective is to reduce the Cycle Time.
Duration: Preparation, 3 day workshop, post workshop tasks
Deliverables: Future state of SW process (flow diagram)
based on lean/VSM assessment Prioritized list of opportunities for SW process
cycle time reduction
11
Development of Product Flow Timing Diagram (Current State)
A hypothetical (typical) program was defined for high-level VSM assessment
Assumptions: size of 500 KSLOC, mission critical, C2 application, with nominal complexity, resources, etc.
Existing process data flow was converted to a product flow for timing allocation
% of Development Cycle-Time/Effort was estimated for each activity
12
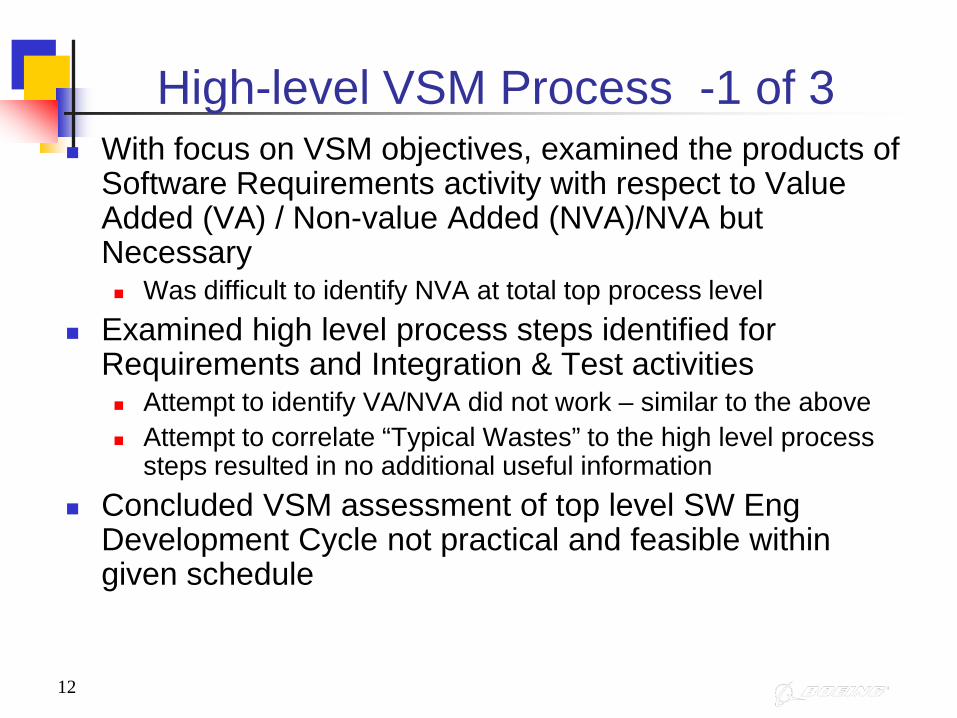
High-level VSM Process -1 of 3 With focus on VSM objectives, examined the products of
Software Requirements activity with respect to Value Added (VA) / Non-value Added (NVA)/NVA but Necessary Was difficult to identify NVA at total top process level
Examined high level process steps identified for Requirements and Integration & Test activities Attempt to identify VA/NVA did not work – similar to the above Attempt to correlate “Typical Wastes” to the high level process
steps resulted in no additional useful information Concluded VSM assessment of top level SW Eng
Development Cycle not practical and feasible within given schedule
13
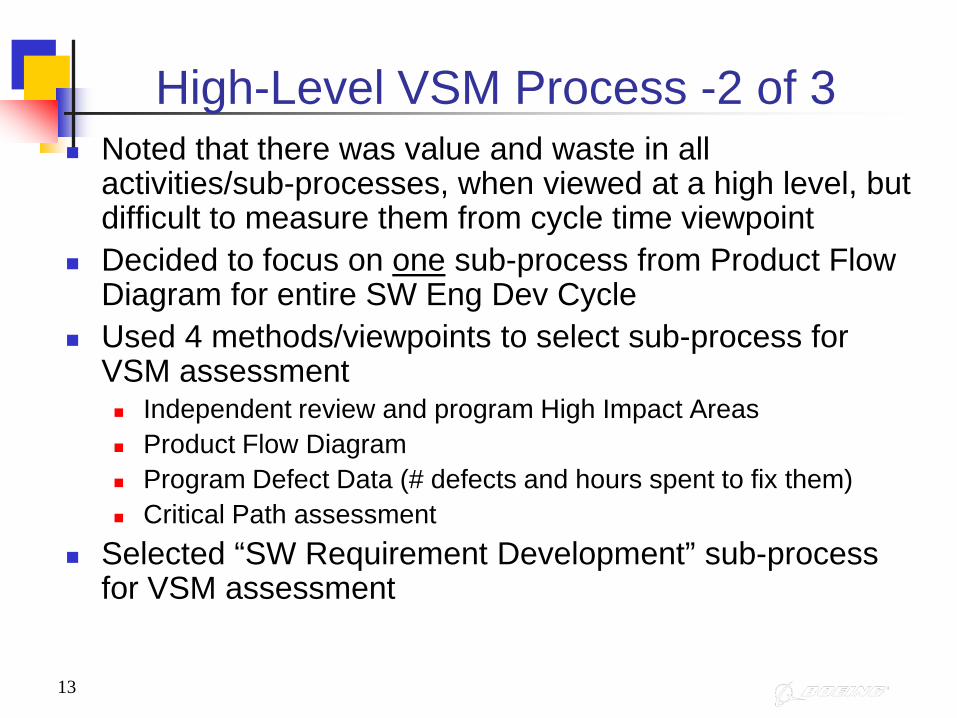
High-Level VSM Process -2 of 3 Noted that there was value and waste in all
activities/sub-processes, when viewed at a high level, but difficult to measure them from cycle time viewpoint
Decided to focus on one sub-process from Product Flow Diagram for entire SW Eng Dev Cycle
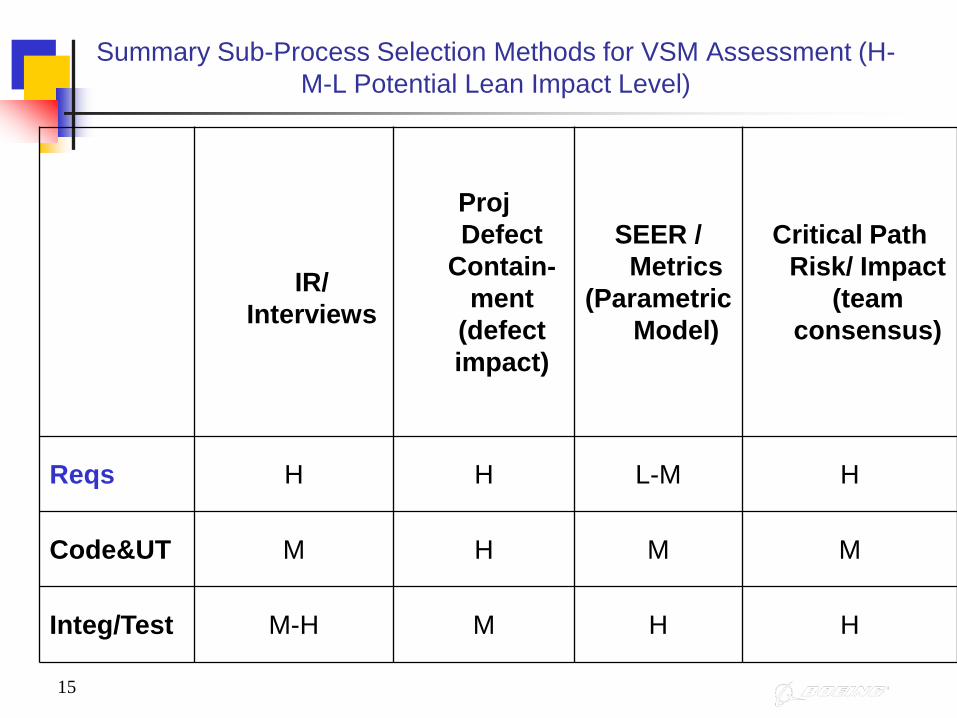
Used 4 methods/viewpoints to select sub-process for VSM assessment Independent review and program High Impact Areas Product Flow Diagram Program Defect Data (# defects and hours spent to fix them) Critical Path assessment
Selected “SW Requirement Development” sub-process for VSM assessment

14
Independent Review and Program High Productivity Impact Findings Per Life Cycle Category
Independent Review & Interview SummaryCategory IR/NAR ProjGeneral 10 15% 7 9%
Reqs 15 23% 11 14%Arch 7 10% 9 12%Design 2 4% 5 7%Code&UT 0 0% 6 8%Integ 5 8% 5 7%Prog_Mgmt 6 9% 3 4%Prototype 4 5% 6 8%SW_Processes 3 5% 6 8%Sub_Mgmt 1 2% 1 1%Tools&Env 1 2% 5 7%Training 3 5% 4 5%Metrics 3 5% 4 5%SE_I/F 6 9% 4 5%
65 76
15
Summary Sub-Process Selection Methods for VSM Assessment (H-M-L Potential Lean Impact Level)
IR/ Interviews
ProjDefect
Contain-ment
(defect impact)
SEER /Metrics
(Parametric Model)
Critical Path Risk/ Impact
(team consensus)
Reqs H H L-M H
Code&UT M H M M
Integ/Test M-H M H H
16
Estimated % of Development Cycle-Time/Effort for General SW Eng Process (notional data)
R AD DD C UT
5.9 9.3 11.3 20.5 20.5
7.3 8.8 14.6 13.6 13.6
10.5 8.8 12.0 11.6 13.6
9 10 13 13 14
IT FQT
5.1 5.4
17.8 2.3
17.1 2.4
18.5 2.5
QA – 4 Env & Tool Acq – 4
CM – 4 Planning – 8
SEER ( 1 CI )
SEER ( >1 CI )
Internal
Consolidated
• Lifecycle Phases
• Lifecycle % EffortSubtotal
20
R - 9%
AD – 10%
DD - 13%
C – 13%
UT – 14%
FQT 2.5%
IT – 18.5%
80
80
80
80
Methods Subtotal
17
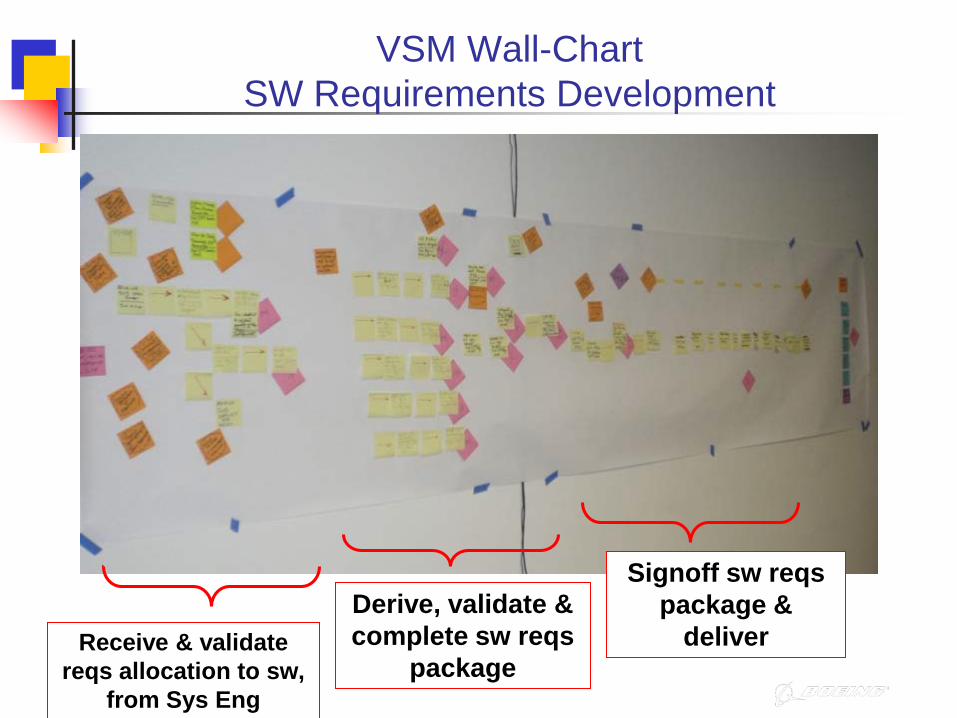
VSM Wall-Chart SW Requirements Development
Receive & validate reqs allocation to sw,
from Sys Eng
Derive, validate & complete sw reqs
package
Signoff sw reqs package &
deliver
18
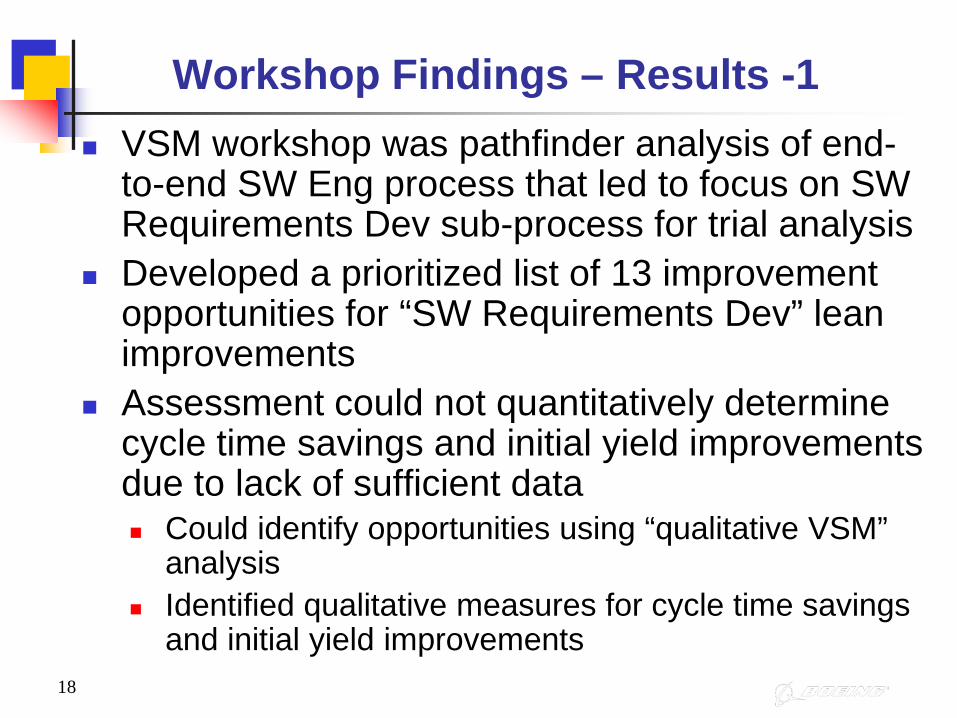
Workshop Findings – Results -1 VSM workshop was pathfinder analysis of end-
to-end SW Eng process that led to focus on SW Requirements Dev sub-process for trial analysis
Developed a prioritized list of 13 improvement opportunities for “SW Requirements Dev” lean improvements
Assessment could not quantitatively determine cycle time savings and initial yield improvements due to lack of sufficient data Could identify opportunities using “qualitative VSM”
analysis Identified qualitative measures for cycle time savings
and initial yield improvements
19
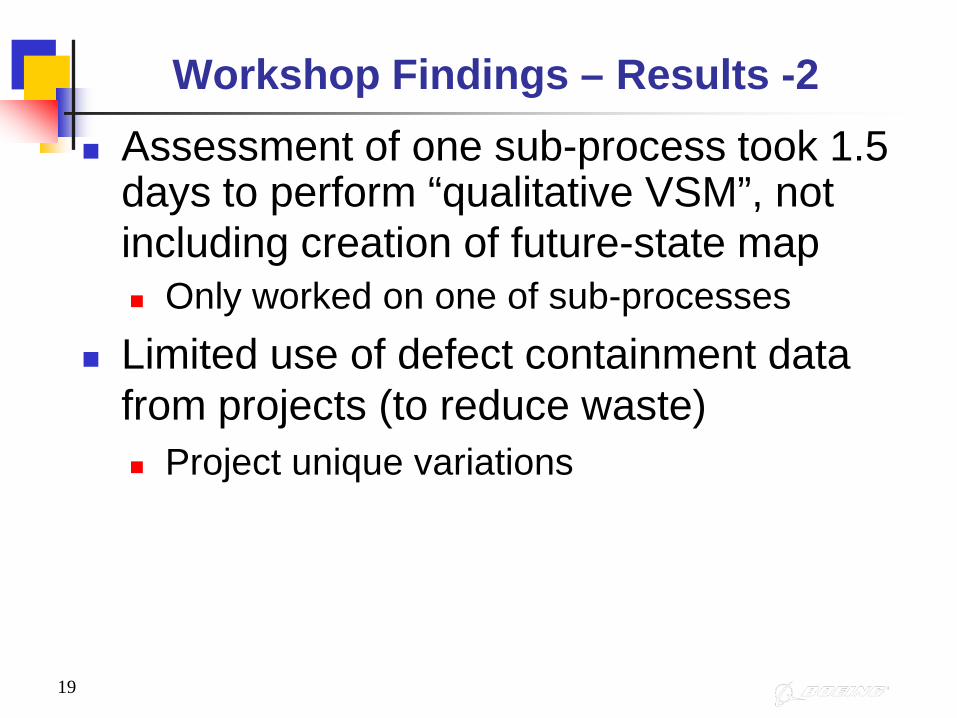
Workshop Findings – Results -2 Assessment of one sub-process took 1.5
days to perform “qualitative VSM”, not including creation of future-state map Only worked on one of sub-processes
Limited use of defect containment data from projects (to reduce waste) Project unique variations
20
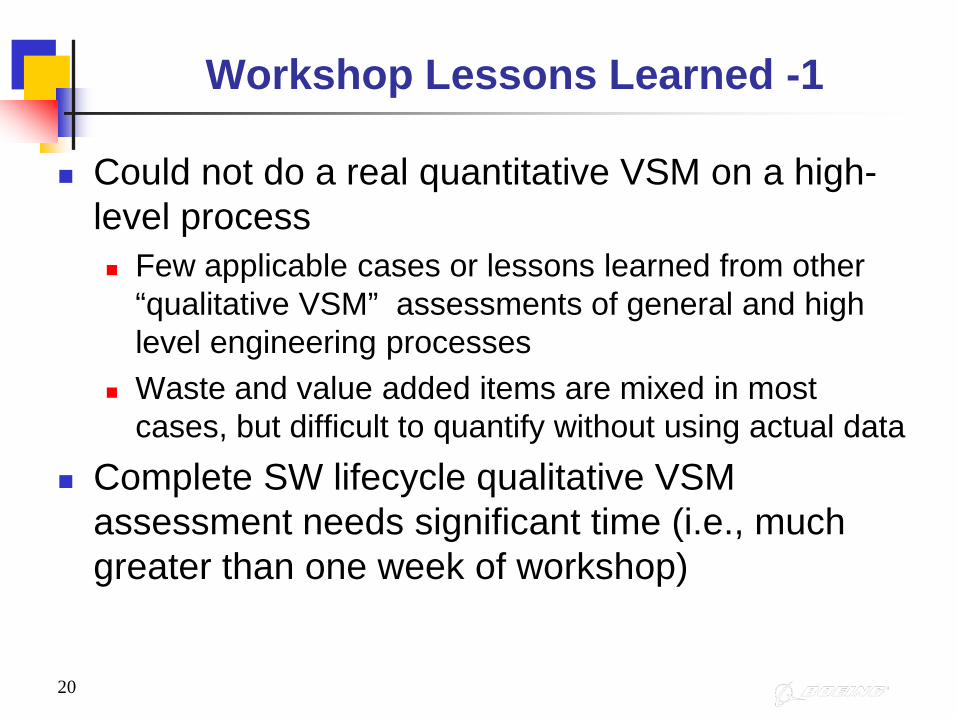
Workshop Lessons Learned -1
Could not do a real quantitative VSM on a high-level process Few applicable cases or lessons learned from other
“qualitative VSM” assessments of general and high level engineering processes
Waste and value added items are mixed in most cases, but difficult to quantify without using actual data
Complete SW lifecycle qualitative VSM assessment needs significant time (i.e., much greater than one week of workshop)
21
Workshop Lessons Learned -2
Continuous presence and involvement of core team during VSM workshop is key, i.e. no part-timers
Typical SW Eng process does not represent product flow and dynamics of using the process Simulated process tool/model (process conops) driven
by program selectable assumptions and constraints are needed
Defect containment metric is an excellent way to assess process (e.g., waste/value) if consistent and correct data is available
22
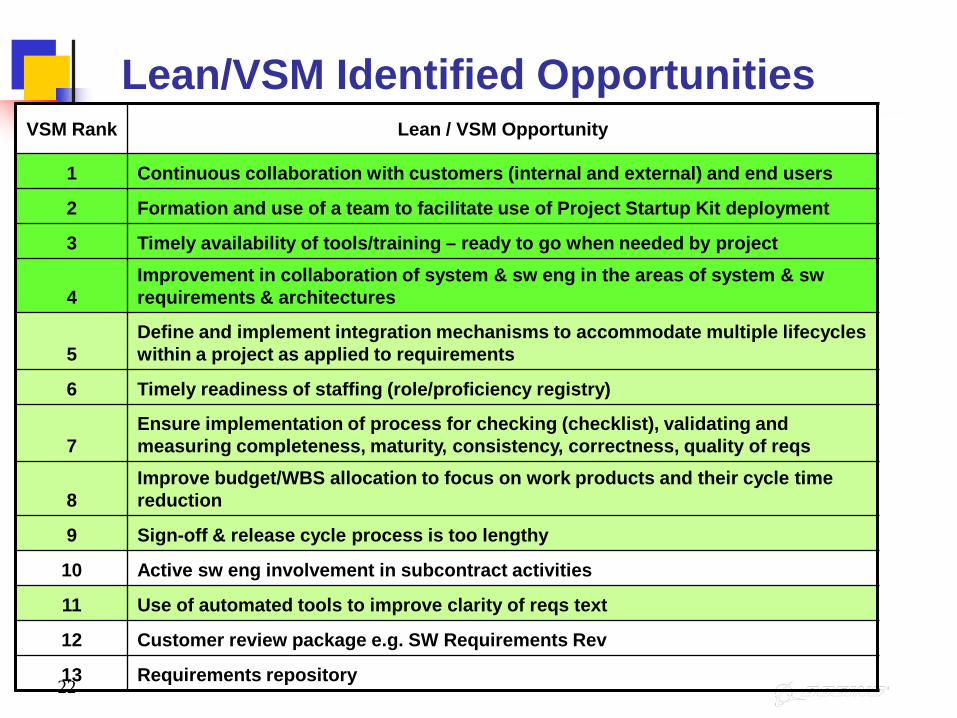
Lean/VSM Identified OpportunitiesVSM Rank Lean / VSM Opportunity
1 Continuous collaboration with customers (internal and external) and end users
2 Formation and use of a team to facilitate use of Project Startup Kit deployment
3 Timely availability of tools/training – ready to go when needed by project
4Improvement in collaboration of system & sw eng in the areas of system & sw requirements & architectures
5Define and implement integration mechanisms to accommodate multiple lifecycles within a project as applied to requirements
6 Timely readiness of staffing (role/proficiency registry)
7Ensure implementation of process for checking (checklist), validating and measuring completeness, maturity, consistency, correctness, quality of reqs
8Improve budget/WBS allocation to focus on work products and their cycle time reduction
9 Sign-off & release cycle process is too lengthy
10 Active sw eng involvement in subcontract activities
11 Use of automated tools to improve clarity of reqs text
12 Customer review package e.g. SW Requirements Rev
13 Requirements repository
23
Summary Quantitative VSM requires program specific data,
focused on repeated activities (e.g., SARs) Was difficult to apply (quantitative) VSM method to
general SW Eng process via identifying VA/NVA in and looking for “Typical Wastes”
Qualitative VSM method, as a good compromise, was applied to Software Requirements activity with respect to VA/NVA/NVA but Necessary
Approach identified lean/VSM driven opportunities and recommendations
Even with qualitative VSM, program specific defect containment data is key for lean applications (e.g., reduction of waste)
Backup Information
25
Abstract With the increasing role of software in the complex DoD systems, the
application of Lean principles and practices for rapid development of software systems has become a priority focus area within the DoD community. Value Stream Mapping (VSM) is a Lean method that has been successfully applied to a large number of manufacturing and production processes worldwide. The main emphasis of the VSM method is to reduce the process cycle time.
This presentation describes the VSM method and its implementation approach for software engineering (a similar approach can be used on other engineering disciplines). It describes how a quantitative model of the conventional software engineering was selected, and how a sub-set, Software Requirements Engineering, was selected for the VSM application. It then covers the systematic approach and logical path for tailoring the VSM process, including the role of the software engineers and the internal and external customers. Multiple viewpoint methods were used for conducting the VSM methods. The presentation describes the results of
the VSM task, lessons learned and recommendations.
26
Six Sigma Six sigma is a set of methodologies used by
businesses to achieve extremely low failure rates in any process. The term six sigma derives from the mathematical use of sigma in statistics as a standard deviation. Six sigma is therefore six standard deviations.
In theory, a six sigma would be approximately two failures per billion attempts. In practice, due to a drift of plus or minus 1.5, six sigma status means less than 3.4 failures per million. This is an extremely low rate of failure, but has been proven possible in industry after industry over the past twenty years.
27
Lean Six Sigma Lean Six Sigma, also known as Lean Sigma, is
a marriage of two otherwise distinct business management strategies, lean manufacturingand Motorola's Six Sigma system. While the lean manufacturing methodology concentrates on creating more value with less work, the Six Sigma system strives to identify and eliminate defects in product development. Thus, Lean Six Sigma provides a method to accelerate a company's decision-making processes, while both reducing production inefficiencies as well as increasing product quality.
28
Author’s Bio Dr. Shawn Rahmani is a Senior Technical Fellow at the
Boeing Defense, Space and Security Unit, Network and Tactical Systems Division, in Huntington Beach, California. He leads the Systems and Software Development and Integration Core Technology activities for Boeing, including technology roadmap and plan development, and their implementation. He is a member of the NDIA Software Industry Experts Panel. Shawn received the Exceptional Public Service Medal from the head of NASA for his technical contributions on the space programs. He has a Ph.D. in Electrical Engineering from the Ohio State University.