Embed Size (px)
Citation preview
Application of Lean to Healthcare Processes: A Complex System Perspective
Dr. Hugh McManus Associate Director,
Lean Advancement Initiative Educational Network
McManus – Lean Healthcare – March 2012 – © LAI EdNet 2
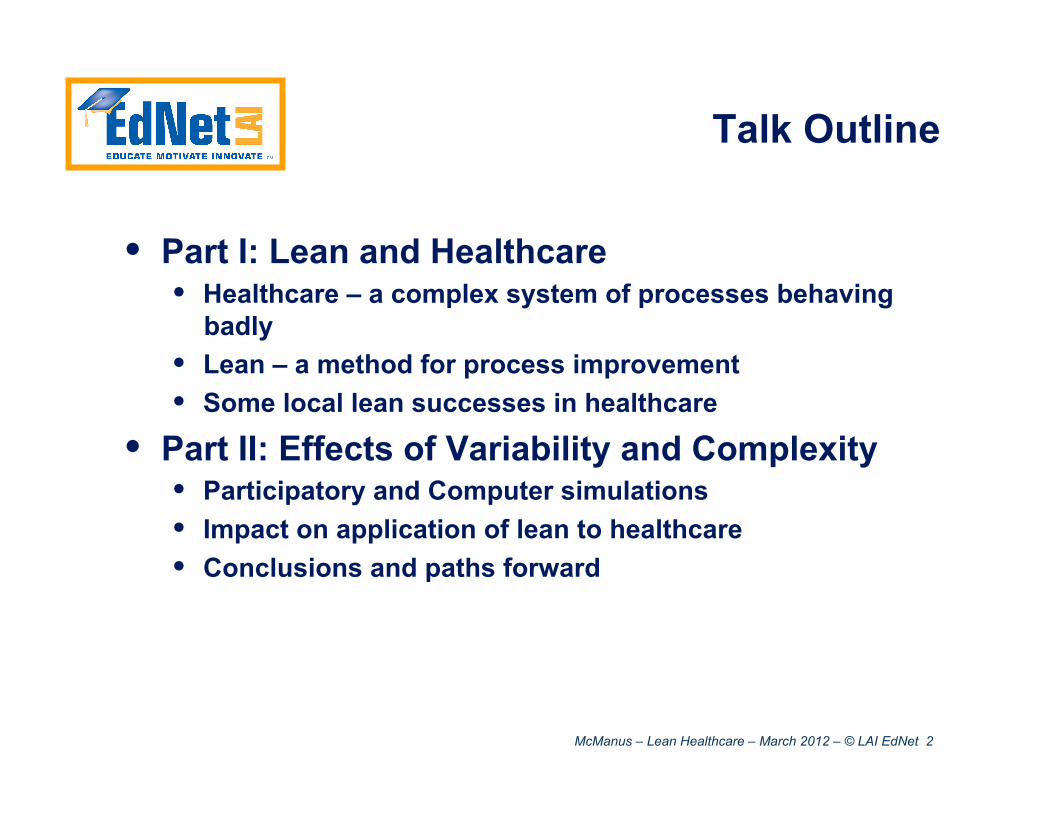
Talk Outline
• Part I: Lean and Healthcare • Healthcare – a complex system of processes behaving
badly • Lean – a method for process improvement • Some local lean successes in healthcare
• Part II: Effects of Variability and Complexity • Participatory and Computer simulations • Impact on application of lean to healthcare • Conclusions and paths forward
McManus – Lean Healthcare – March 2012 – © LAI EdNet 3
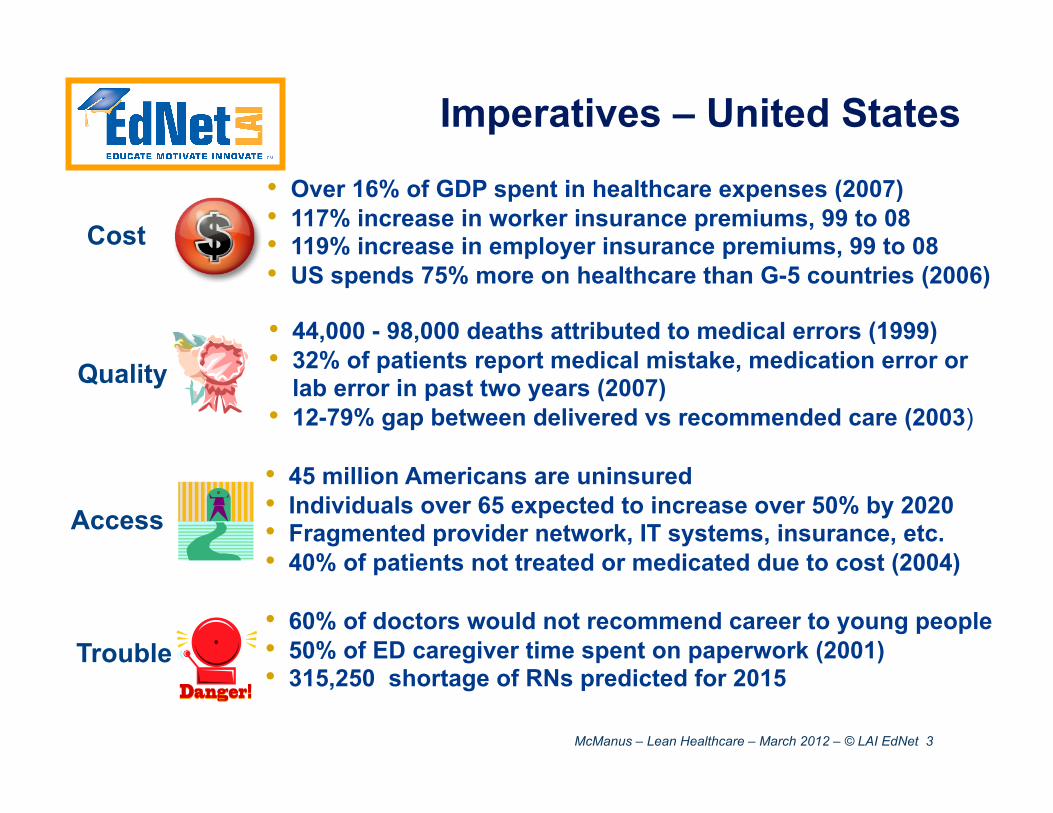
Imperatives – United States
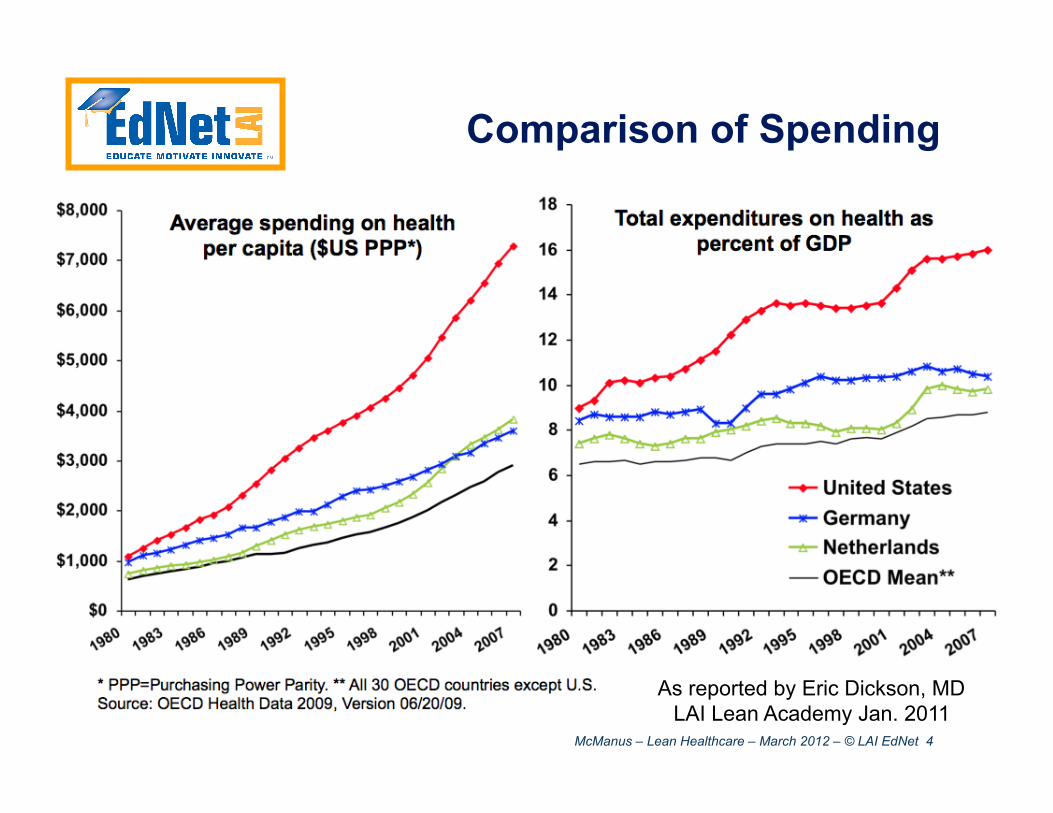
• Over 16% of GDP spent in healthcare expenses (2007) • 117% increase in worker insurance premiums, 99 to 08 • 119% increase in employer insurance premiums, 99 to 08 • US spends 75% more on healthcare than G-5 countries (2006)
Cost
• 44,000 - 98,000 deaths attributed to medical errors (1999) • 32% of patients report medical mistake, medication error or
lab error in past two years (2007) • 12-79% gap between delivered vs recommended care (2003)
Quality
• 60% of doctors would not recommend career to young people • 50% of ED caregiver time spent on paperwork (2001) • 315,250 shortage of RNs predicted for 2015
Trouble
• 45 million Americans are uninsured • Individuals over 65 expected to increase over 50% by 2020 • Fragmented provider network, IT systems, insurance, etc. • 40% of patients not treated or medicated due to cost (2004)
Access
McManus – Lean Healthcare – March 2012 – © LAI EdNet 4
Comparison of Spending
As reported by Eric Dickson, MD LAI Lean Academy Jan. 2011
McManus – Lean Healthcare – March 2012 – © LAI EdNet 5
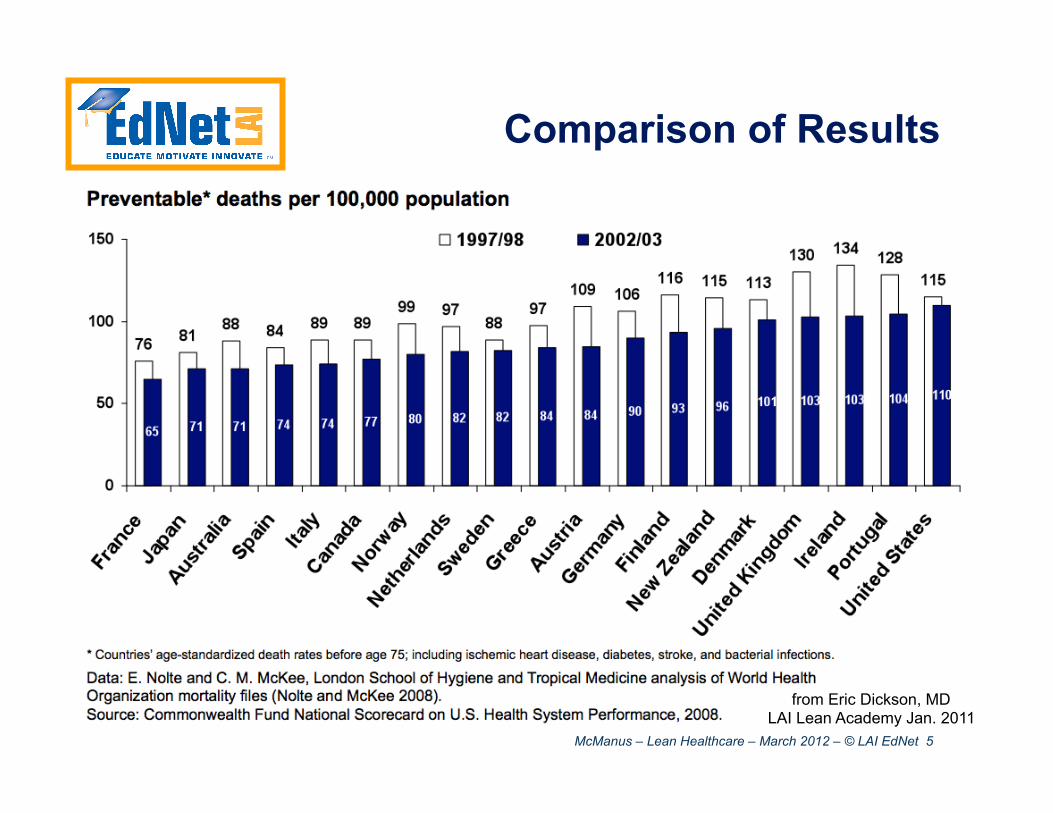
Comparison of Results
from Eric Dickson, MD LAI Lean Academy Jan. 2011
McManus – Lean Healthcare – March 2012 – © LAI EdNet 6
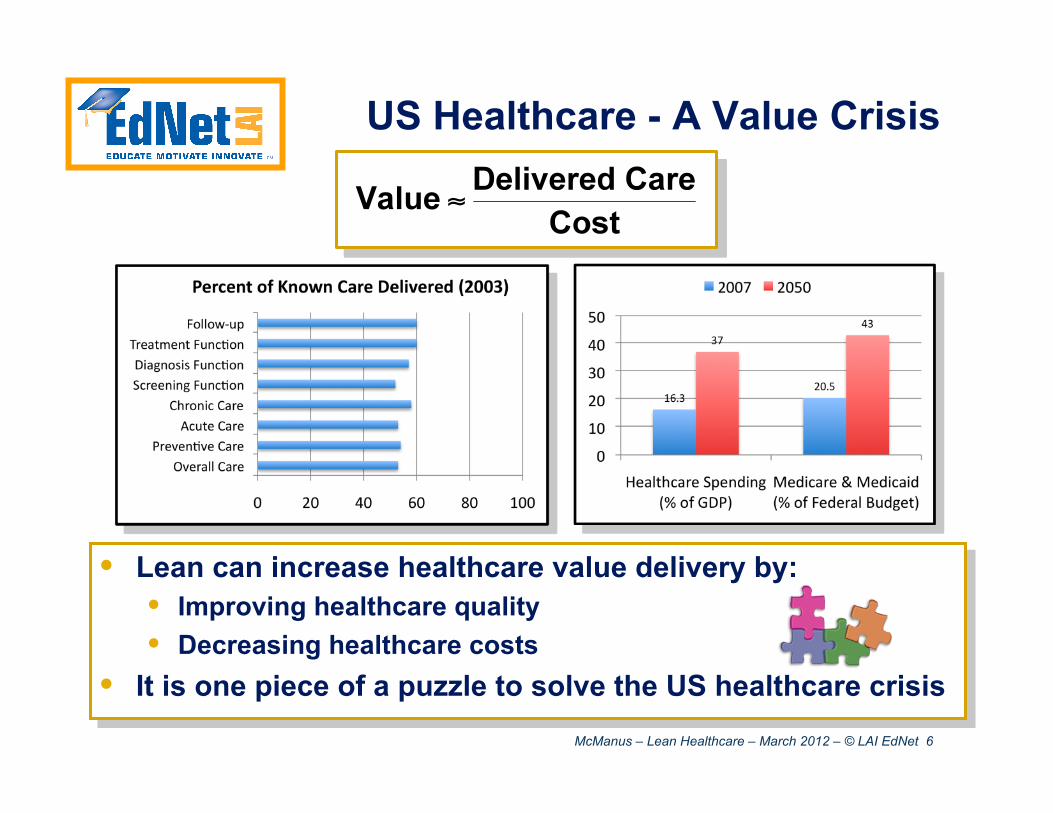
US Healthcare - A Value Crisis
• Lean can increase healthcare value delivery by: • Improving healthcare quality • Decreasing healthcare costs
• It is one piece of a puzzle to solve the US healthcare crisis
McManus – Lean Healthcare – March 2012 – © LAI EdNet 7
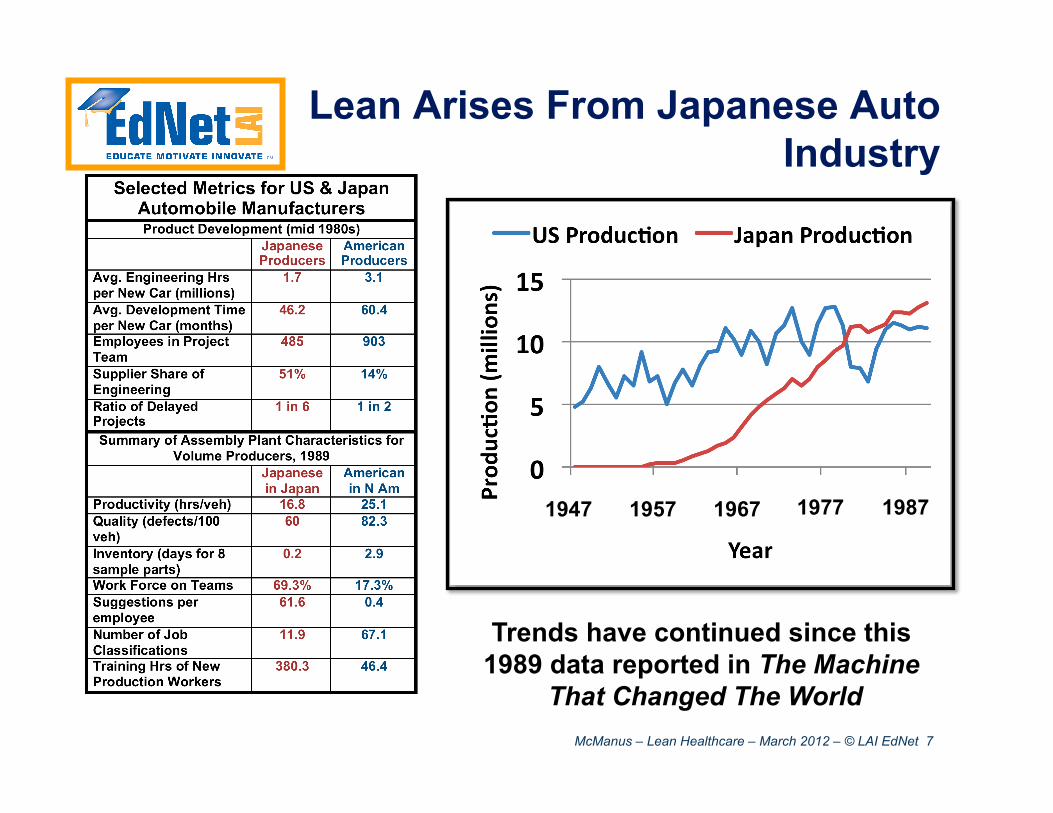
Lean Arises From Japanese Auto Industry
1947 1957 1967 1977 1987
Trends have continued since this 1989 data reported in The Machine
That Changed The World
McManus – Lean Healthcare – March 2012 – © LAI EdNet 8
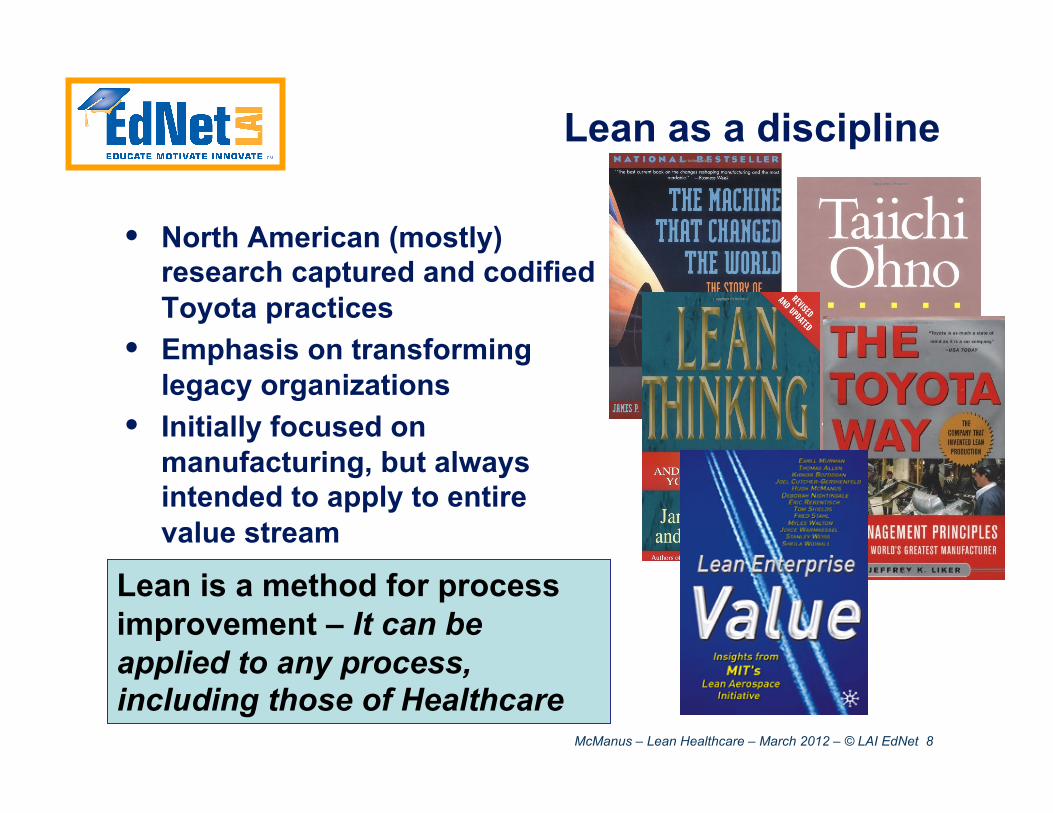
Lean as a discipline
• North American (mostly) research captured and codified Toyota practices
• Emphasis on transforming legacy organizations
• Initially focused on manufacturing, but always intended to apply to entire value stream
Lean is a method for process improvement – It can be applied to any process, including those of Healthcare
McManus – Lean Healthcare – March 2012 – © LAI EdNet 9
Lean Improves Processes by Eliminating Waste
• Wastes require excess work, excess capacity, excess time (and excess costs) to deliver product
• Standardize, stabilize, smooth workflow to make poorly-performing processes apparent • Only make what is needed—buffers hide problems • Just in time requests/deliveries/production, linked
by a visual process, reveal weak links • Never deliver or accept a defective product • Don’t overburden people/processes or otherwise
threaten their performance reliability
Principles are generic—they apply to any process
McManus – Lean Healthcare – March 2012 – © LAI EdNet 10
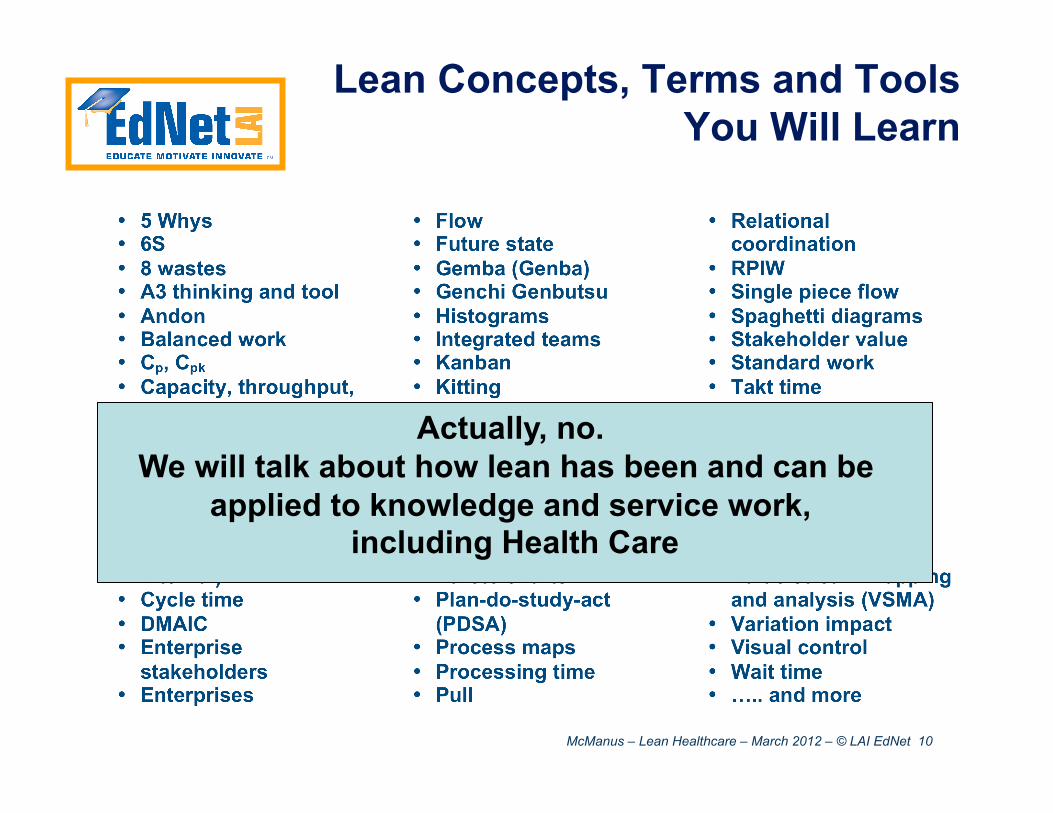
Lean Concepts, Terms and Tools You Will Learn
Actually, no. We will talk about how lean has been and can be
applied to knowledge and service work, including Health Care
McManus – Lean Healthcare – March 2012 – © LAI EdNet 11 Ref: Mark Graban, Lean Hospitals (CRC Press, 2009).
Lean Thinking Fundamentals
• Specify value – from the standpoint of the end customer (the patient)
• Identify the value stream – all value-added steps across departmental boundaries (the value stream), eliminating steps that do not create value
• Make value flow continuously – eliminate causes of delay, such as batches and quality problems
• Let customers pull value – avoid pushing work onto the next process or department; let work and supplies be pulled as needed
• Pursue perfection – through continuous process improvement
McManus – Lean Healthcare – March 2012 – © LAI EdNet 12
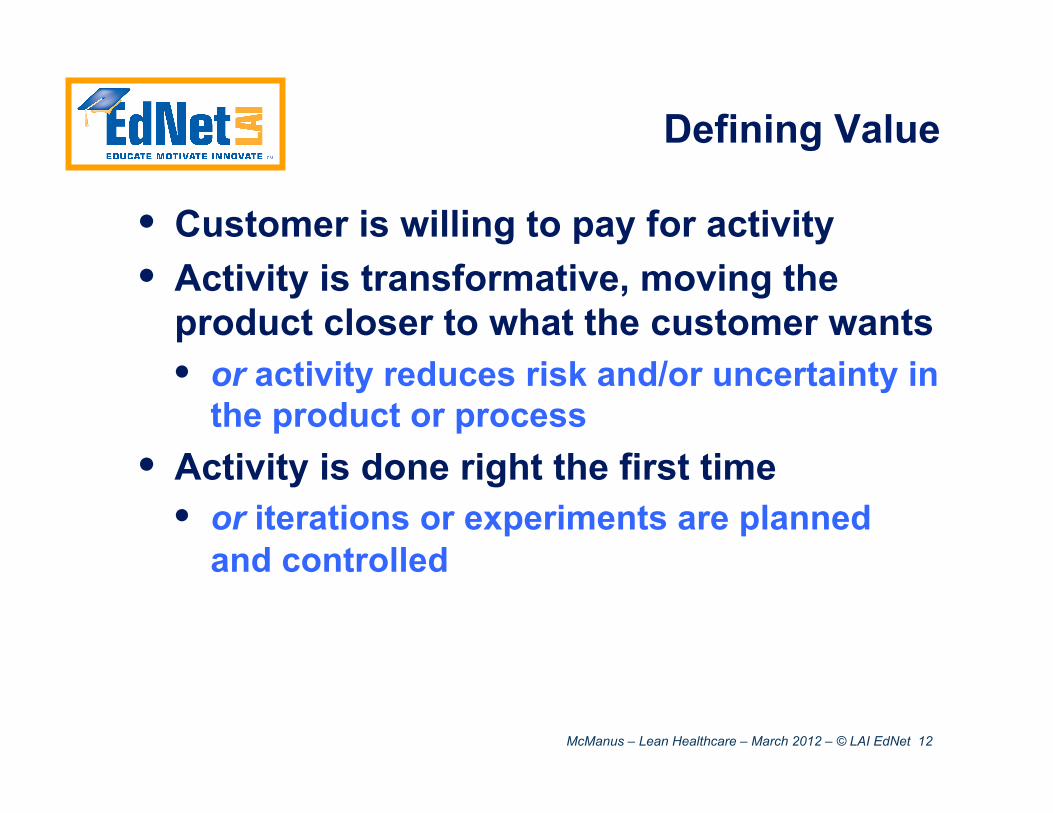
Defining Value
• Customer is willing to pay for activity • Activity is transformative, moving the
product closer to what the customer wants • or activity reduces risk and/or uncertainty in
the product or process • Activity is done right the first time
• or iterations or experiments are planned and controlled
McManus – Lean Healthcare – March 2012 – © LAI EdNet 13
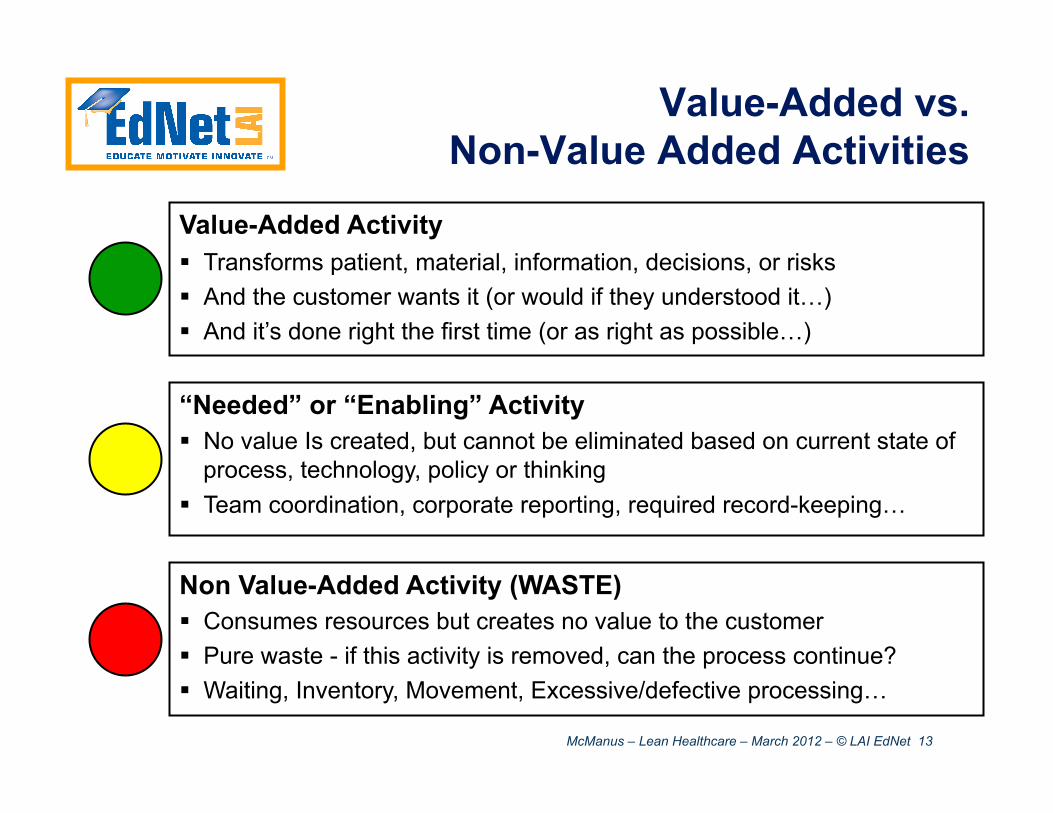
Value-Added Activity Transforms patient, material, information, decisions, or risks And the customer wants it (or would if they understood it…) And it’s done right the first time (or as right as possible…)
“Needed” or “Enabling” Activity No value Is created, but cannot be eliminated based on current state of
process, technology, policy or thinking Team coordination, corporate reporting, required record-keeping…
Non Value-Added Activity (WASTE) Consumes resources but creates no value to the customer Pure waste - if this activity is removed, can the process continue? Waiting, Inventory, Movement, Excessive/defective processing…
Value-Added vs. Non-Value Added Activities
McManus – Lean Healthcare – March 2012 – © LAI EdNet 14
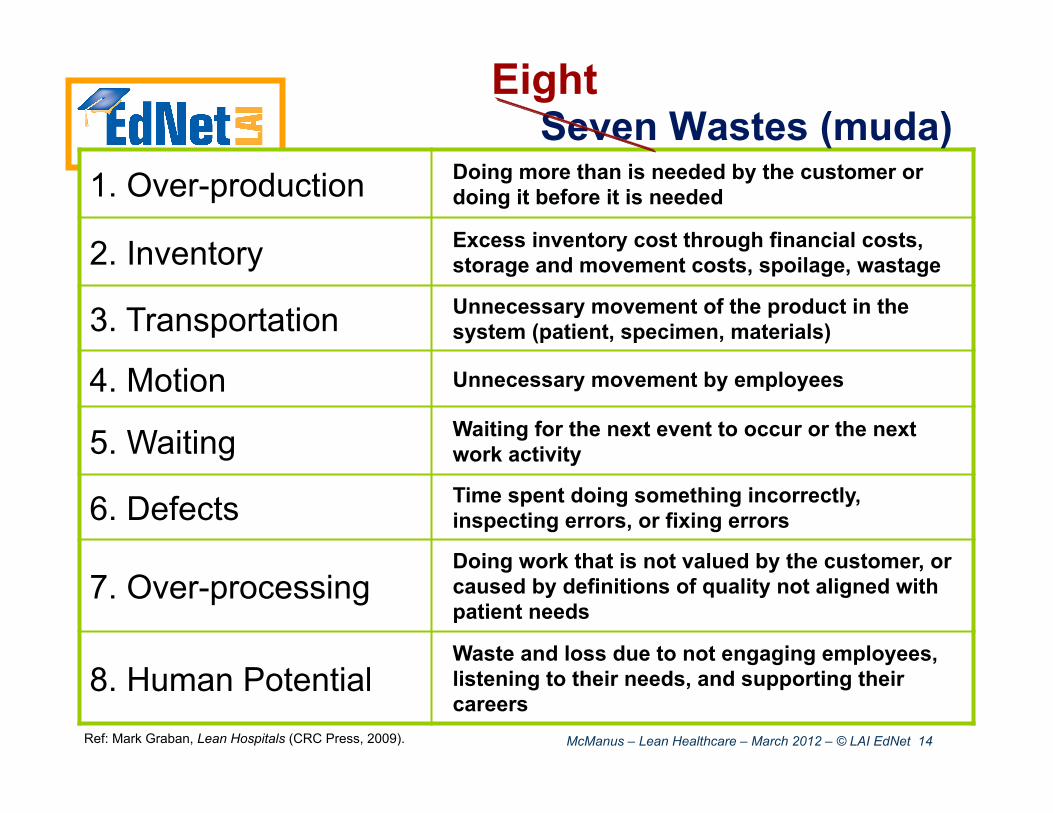
1. Over-production Doing more than is needed by the customer or doing it before it is needed
2. Inventory Excess inventory cost through financial costs, storage and movement costs, spoilage, wastage
3. Transportation Unnecessary movement of the product in the system (patient, specimen, materials)
4. Motion Unnecessary movement by employees
5. Waiting Waiting for the next event to occur or the next work activity
6. Defects Time spent doing something incorrectly, inspecting errors, or fixing errors
7. Over-processing Doing work that is not valued by the customer, or caused by definitions of quality not aligned with patient needs
8. Human Potential Waste and loss due to not engaging employees, listening to their needs, and supporting their careers
Seven Wastes (muda) Eight
Ref: Mark Graban, Lean Hospitals (CRC Press, 2009).
McManus – Lean Healthcare – March 2012 – © LAI EdNet 15
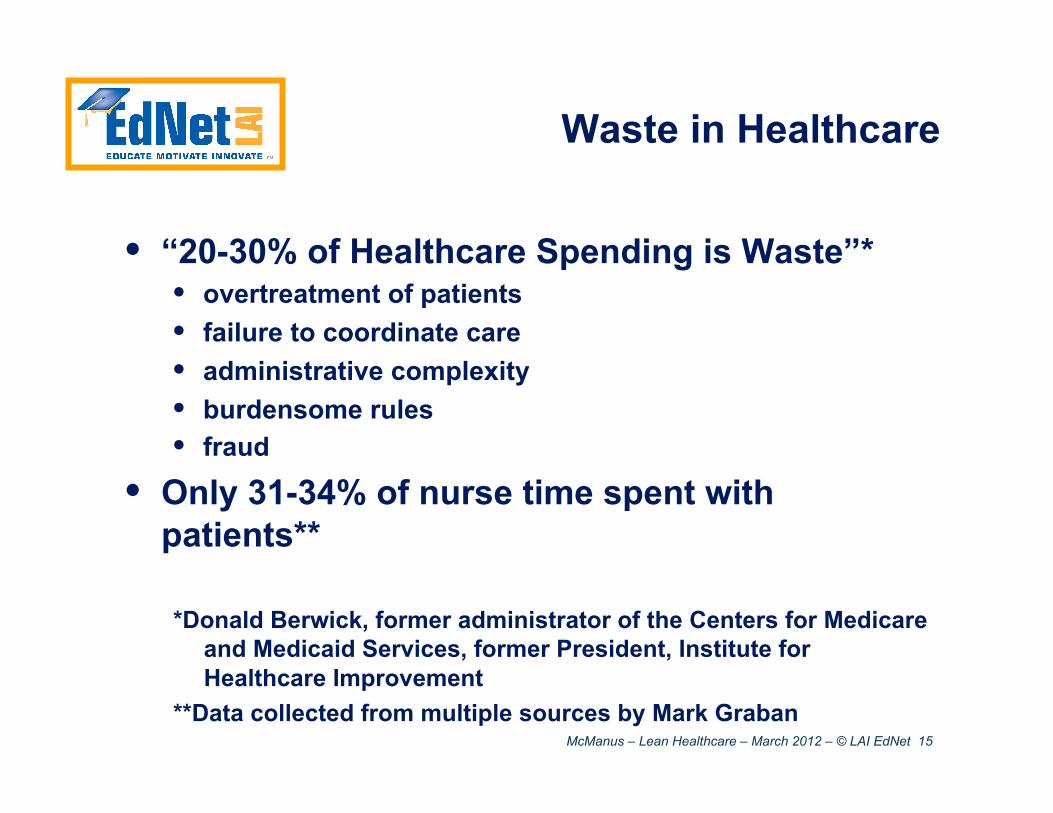
Waste in Healthcare
• “20-30% of Healthcare Spending is Waste”* • overtreatment of patients • failure to coordinate care • administrative complexity • burdensome rules • fraud
• Only 31-34% of nurse time spent with patients**
*Donald Berwick, former administrator of the Centers for Medicare and Medicaid Services, former President, Institute for Healthcare Improvement
**Data collected from multiple sources by Mark Graban
McManus – Lean Healthcare – March 2012 – © LAI EdNet 16
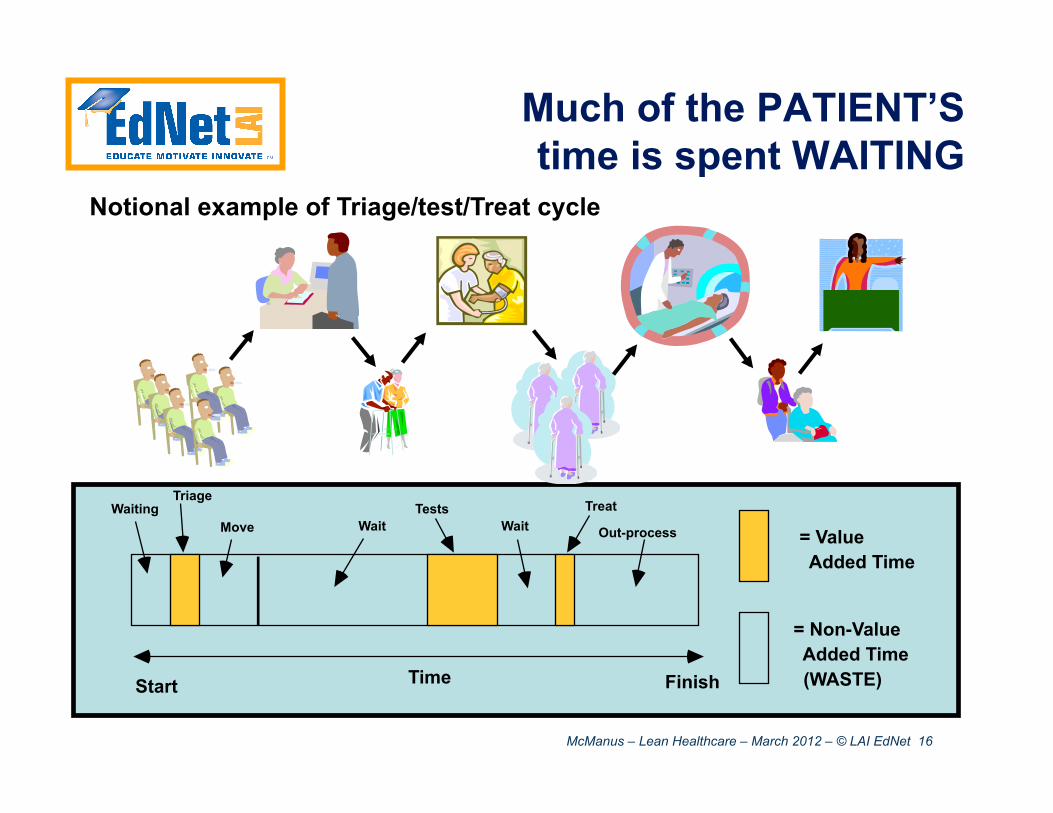
Much of the PATIENT’S time is spent WAITING
Time Start Finish
Waiting Wait Move Wait Out-process = Value
Added Time
= Non-Value Added Time (WASTE)
Tests Treat Triage
Notional example of Triage/test/Treat cycle
McManus – Lean Healthcare – March 2012 – © LAI EdNet 17
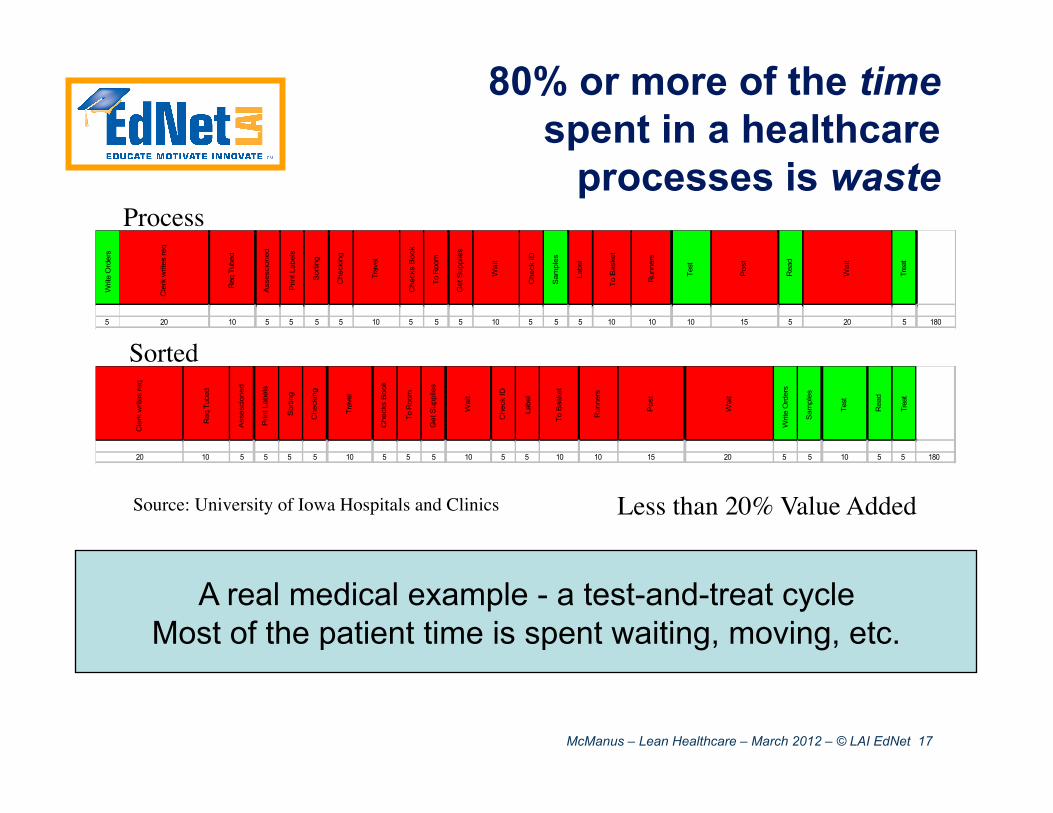
Less than 20% Value Added Source: University of Iowa Hospitals and Clinics
A real medical example - a test-and-treat cycle Most of the patient time is spent waiting, moving, etc.
Writ
e O
rder
s
Cle
rk w
rites
req
Req
Tub
ed
Ass
esci
oned
Prin
t Lab
els
Sor
ting
Che
ckin
g
Trav
el
Che
cks
Boo
k
To R
oom
Get
Sup
plie
s
Wai
t
Che
ck ID
Sam
ples
Labe
l
To B
aske
t
Run
ners
Test
Pos
t
Rea
d
Wai
t
Trea
t
5 20 10 5 5 5 5 10 5 5 5 10 5 5 5 10 10 10 15 5 20 5 180
Cle
rk w
rites
req
Req
Tub
ed
Ass
esci
oned
Prin
t Lab
els
Sor
ting
Che
ckin
g
Trav
el
Che
cks
Boo
k
To R
oom
Get
Sup
plie
s
Wai
t
Che
ck ID
Labe
l
To B
aske
t
Run
ners
Pos
t
Wai
t
Writ
e O
rder
s
Sam
ples
Test
Rea
d
Trea
t
20 10 5 5 5 5 10 5 5 5 10 5 5 10 10 15 20 5 5 10 5 5 180
Process
Sorted
80% or more of the time spent in a healthcare
processes is waste
McManus – Lean Healthcare – March 2012 – © LAI EdNet 18
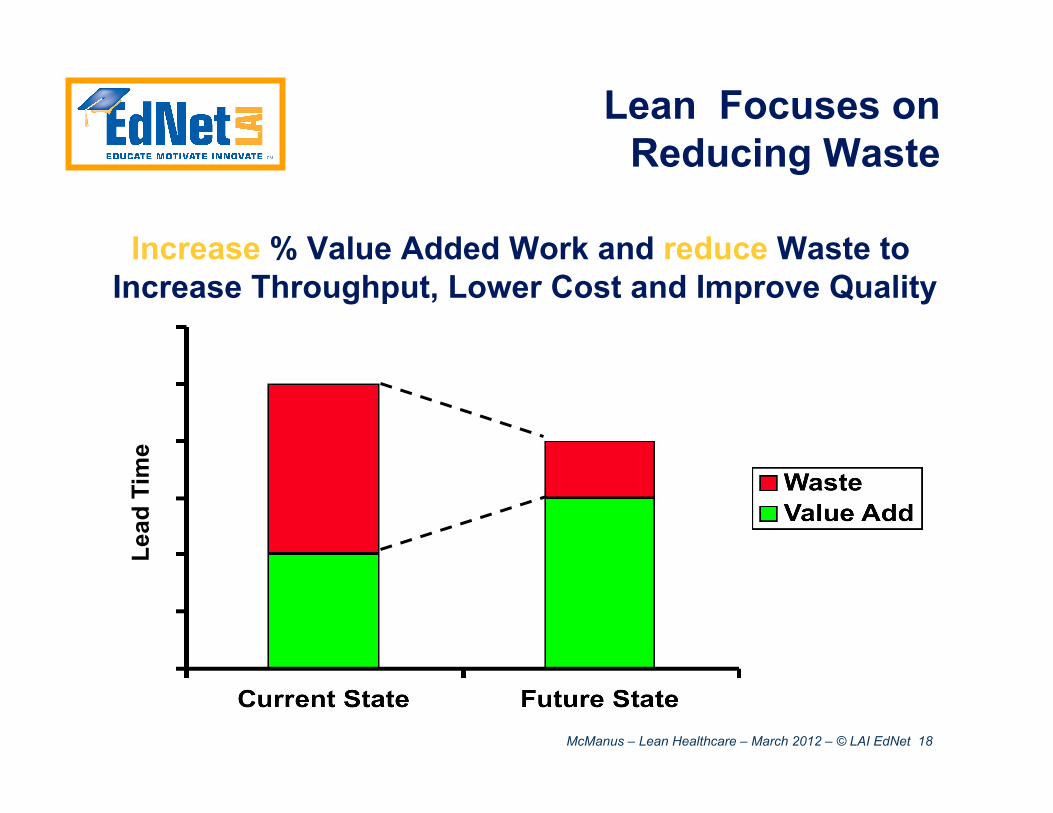
Lean Focuses on Reducing Waste
Increase % Value Added Work and reduce Waste to Increase Throughput, Lower Cost and Improve Quality
Lead
Tim
e
McManus – Lean Healthcare – March 2012 – © LAI EdNet 19
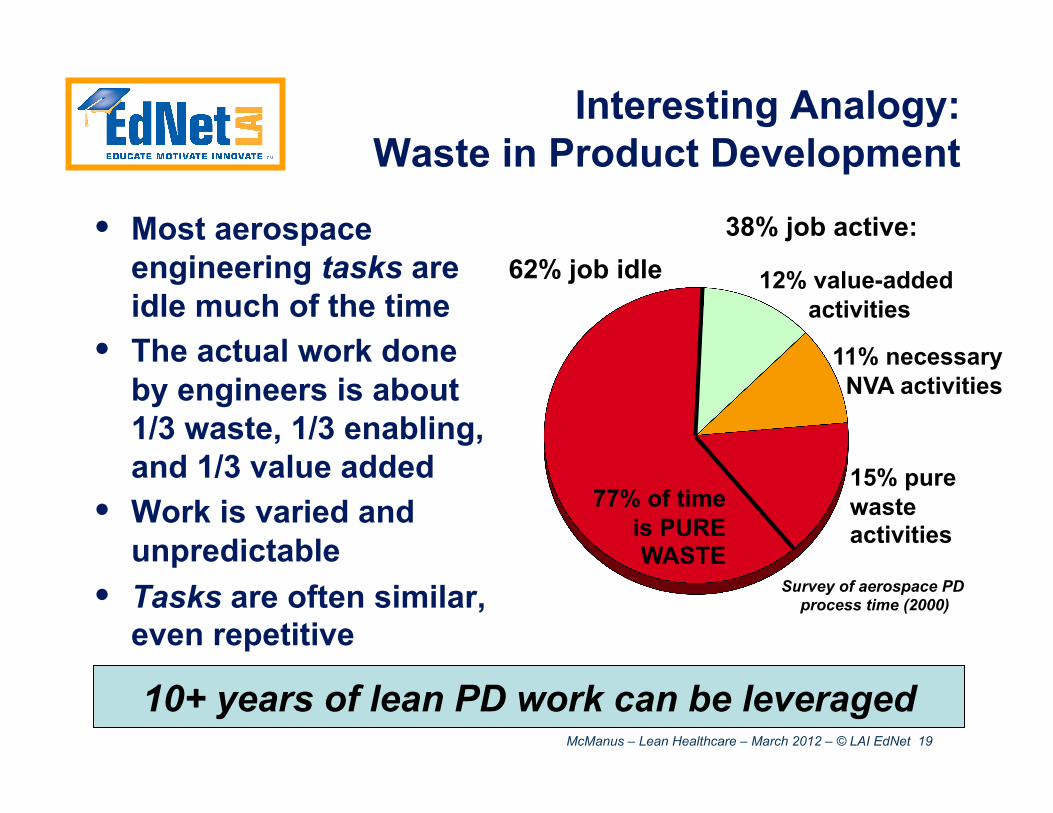
Interesting Analogy: Waste in Product Development
• Most aerospace engineering tasks are idle much of the time
• The actual work done by engineers is about 1/3 waste, 1/3 enabling, and 1/3 value added
• Work is varied and unpredictable
• Tasks are often similar, even repetitive
62% job idle
15% pure waste activities
11% necessary NVA activities
12% value-added activities
77% of time is PURE WASTE
38% job active:
10+ years of lean PD work can be leveraged
Survey of aerospace PD process time (2000)
McManus – Lean Healthcare – March 2012 – © LAI EdNet 20
• Healthcare has many processes and lots of waste
• Lean is an overall method (with many tools) for improving processes by removing waste
• There are many opportunities for lean application in Healthcare.
McManus – Lean Healthcare – March 2012 – © LAI EdNet 21
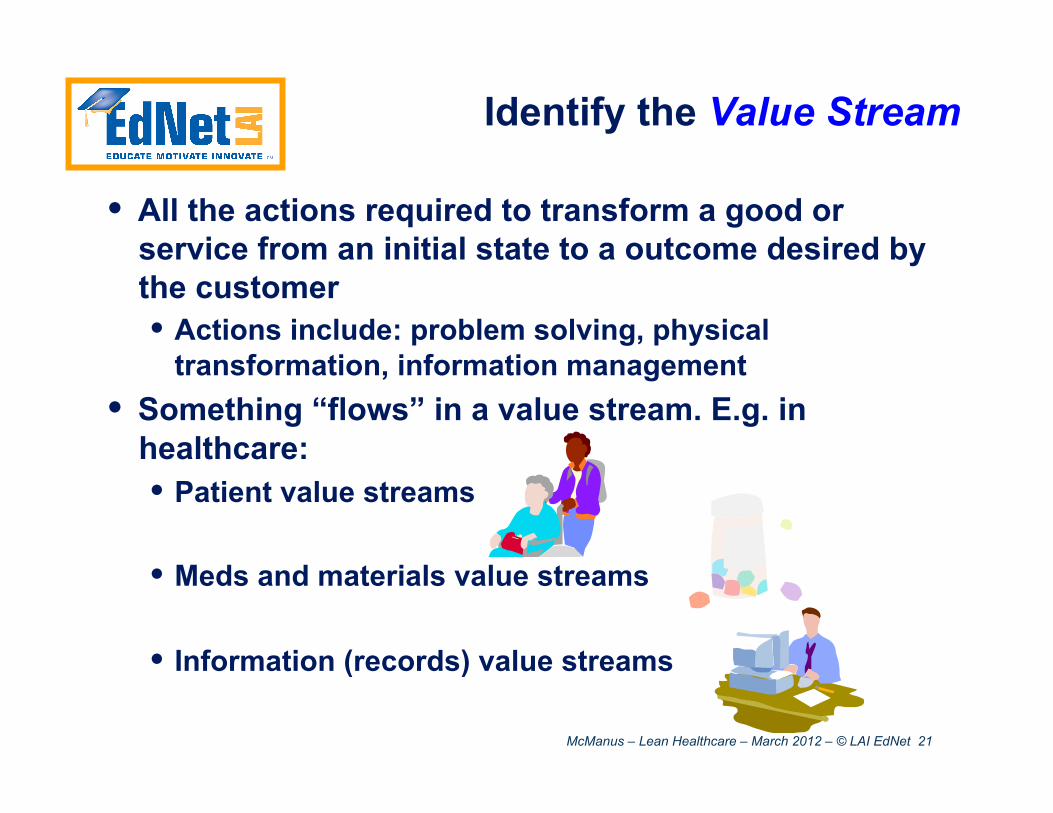
Identify the Value Stream
• All the actions required to transform a good or service from an initial state to a outcome desired by the customer • Actions include: problem solving, physical
transformation, information management • Something “flows” in a value stream. E.g. in
healthcare: • Patient value streams
• Meds and materials value streams
• Information (records) value streams
McManus – Lean Healthcare – March 2012 – © LAI EdNet 22
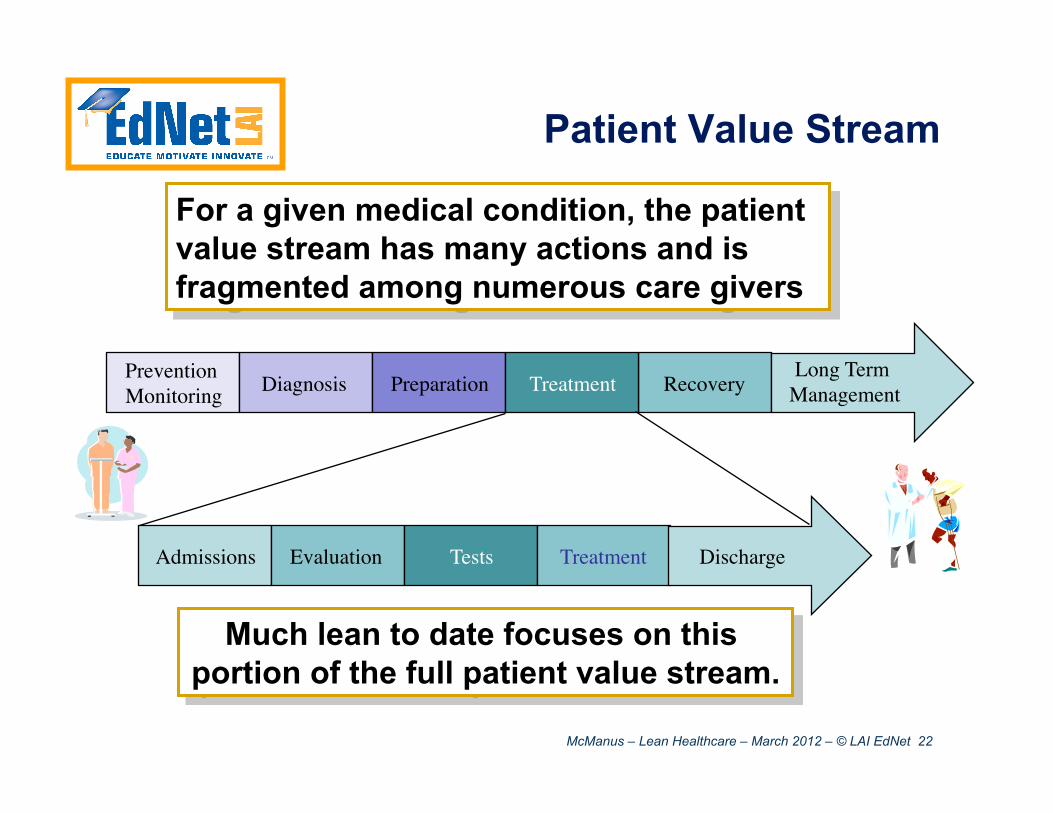
Patient Value Stream
For a given medical condition, the patient value stream has many actions and is fragmented among numerous care givers
Prevention Monitoring Diagnosis Preparation Recovery Treatment
Long Term Management
Much lean to date focuses on this portion of the full patient value stream.
Admissions Evaluation Tests Treatment Discharge
McManus – Lean Healthcare – March 2012 – © LAI EdNet 23
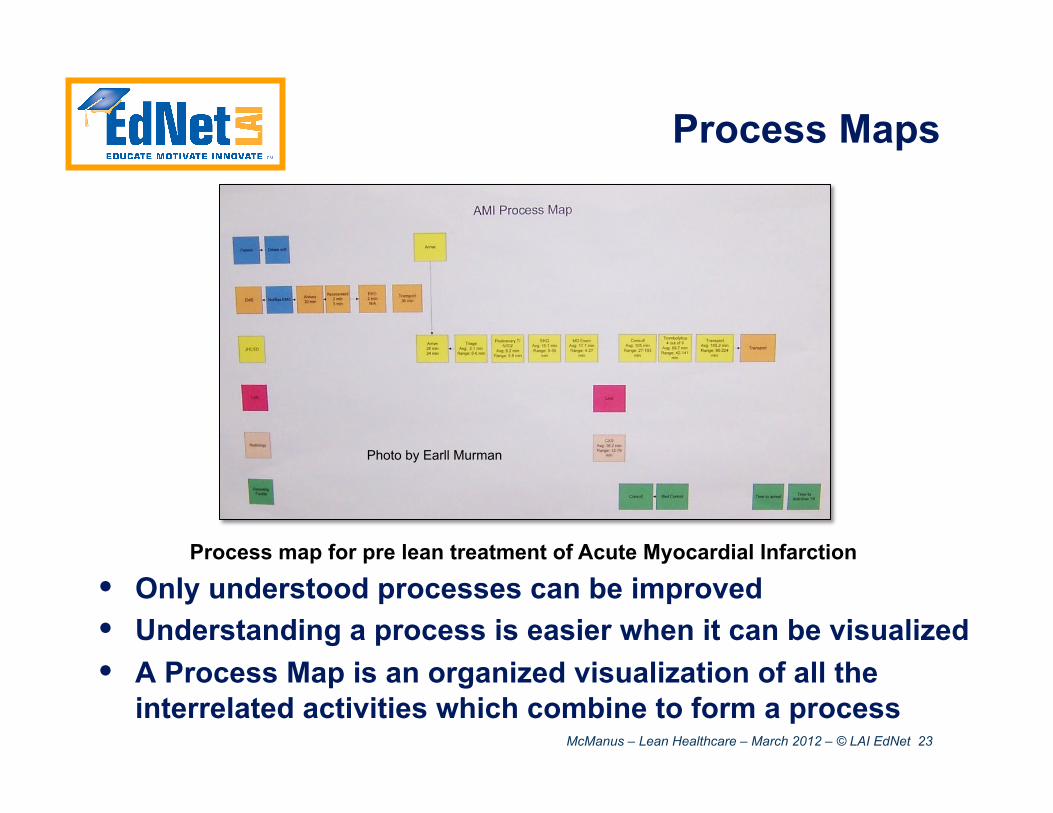
Process Maps
• Only understood processes can be improved • Understanding a process is easier when it can be visualized • A Process Map is an organized visualization of all the
interrelated activities which combine to form a process
Process map for pre lean treatment of Acute Myocardial Infarction
Photo by Earll Murman
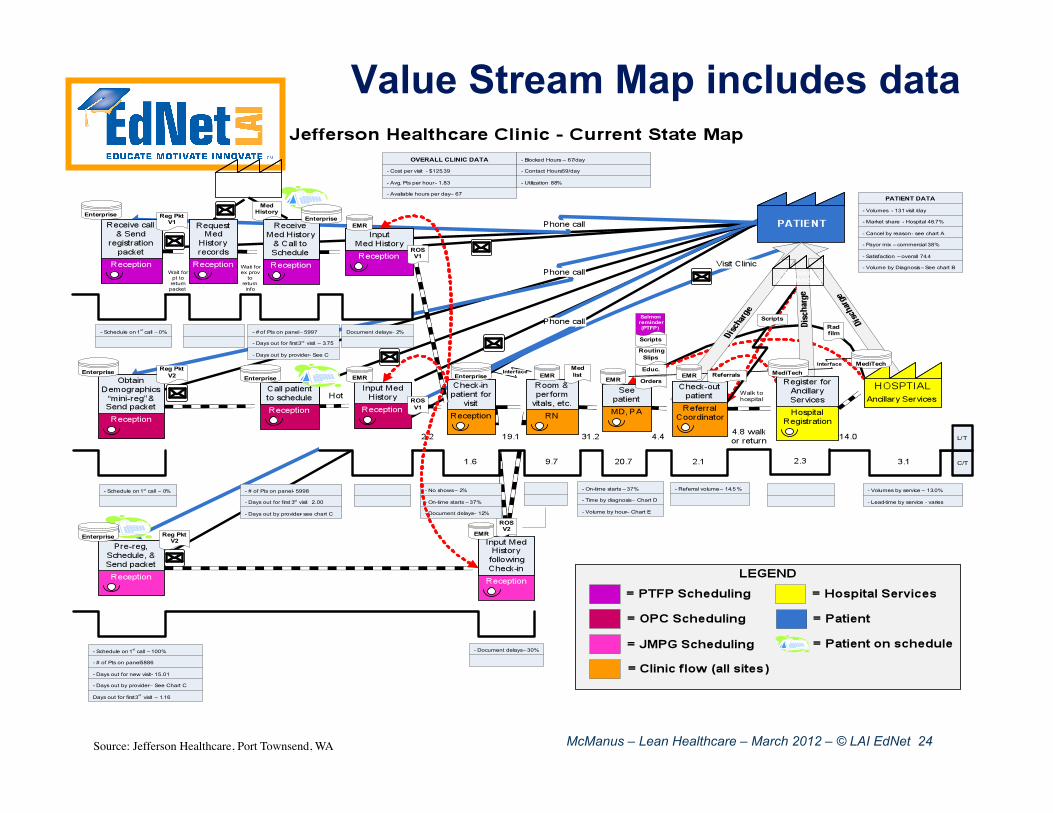
McManus – Lean Healthcare – March 2012 – © LAI EdNet 24 Source: Jefferson Healthcare, Port Townsend, WA
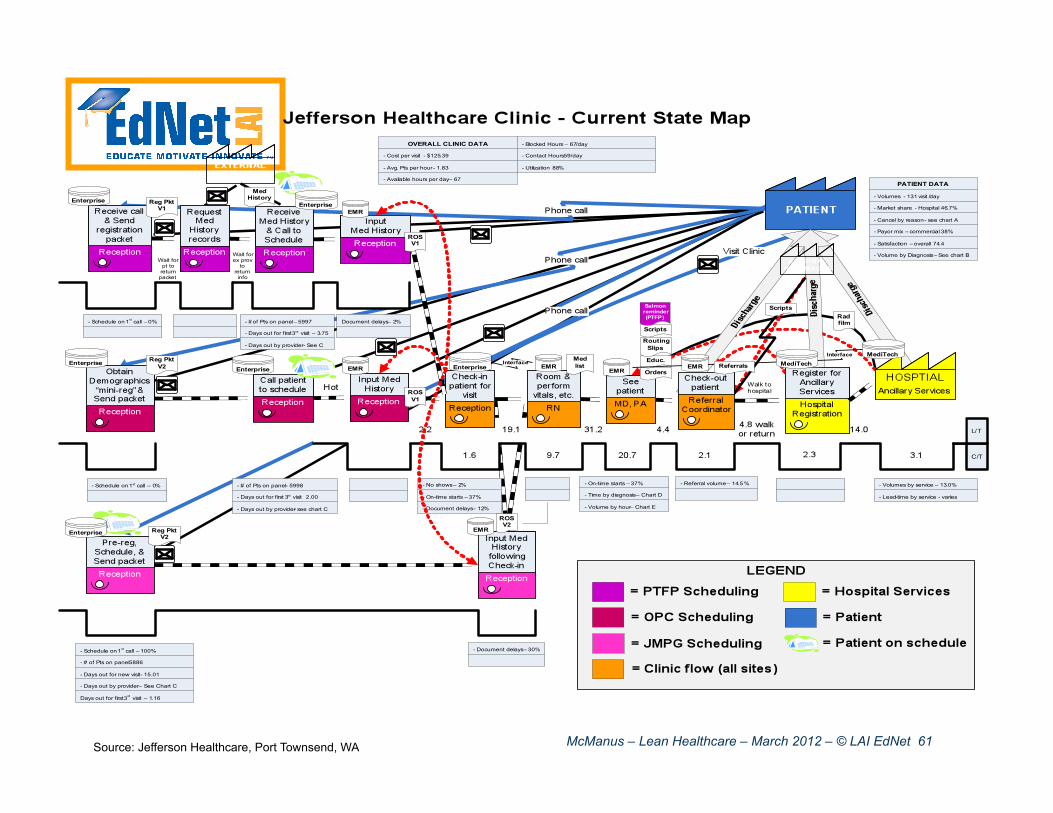
Value Stream Map includes data
McManus – Lean Healthcare – March 2012 – © LAI EdNet 25
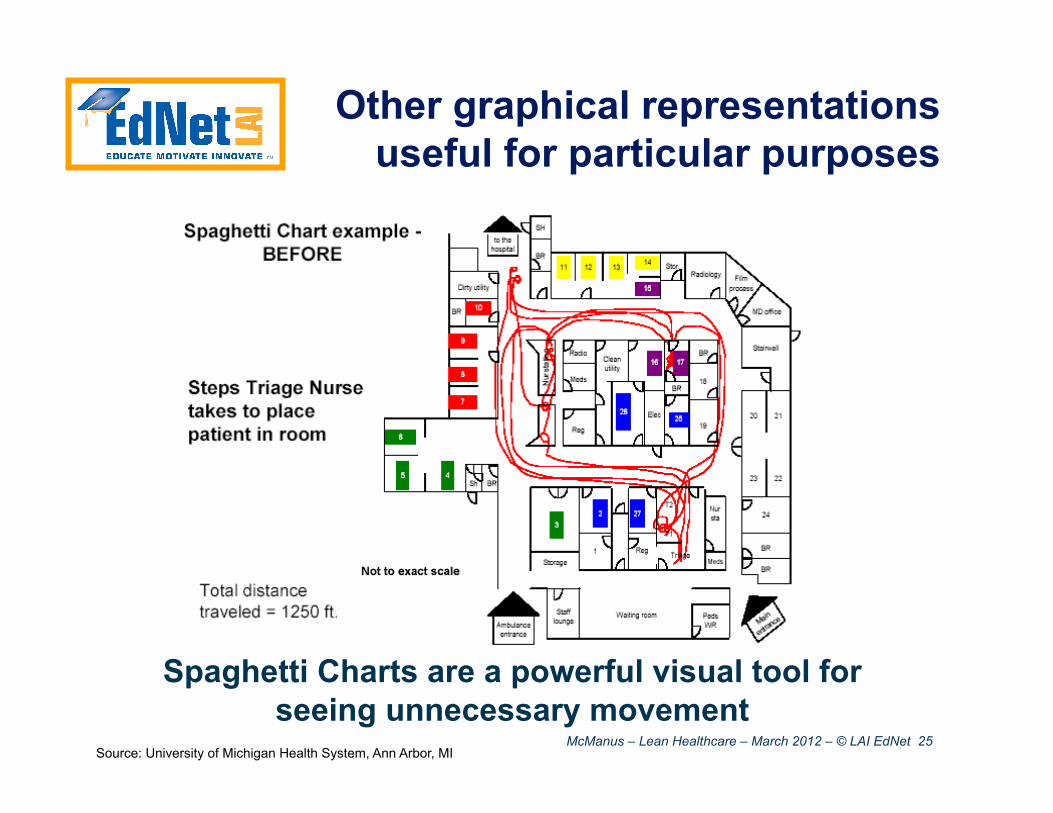
Other graphical representations useful for particular purposes
Spaghetti Charts are a powerful visual tool for seeing unnecessary movement
Source: University of Michigan Health System, Ann Arbor, MI
McManus – Lean Healthcare – March 2012 – © LAI EdNet 26
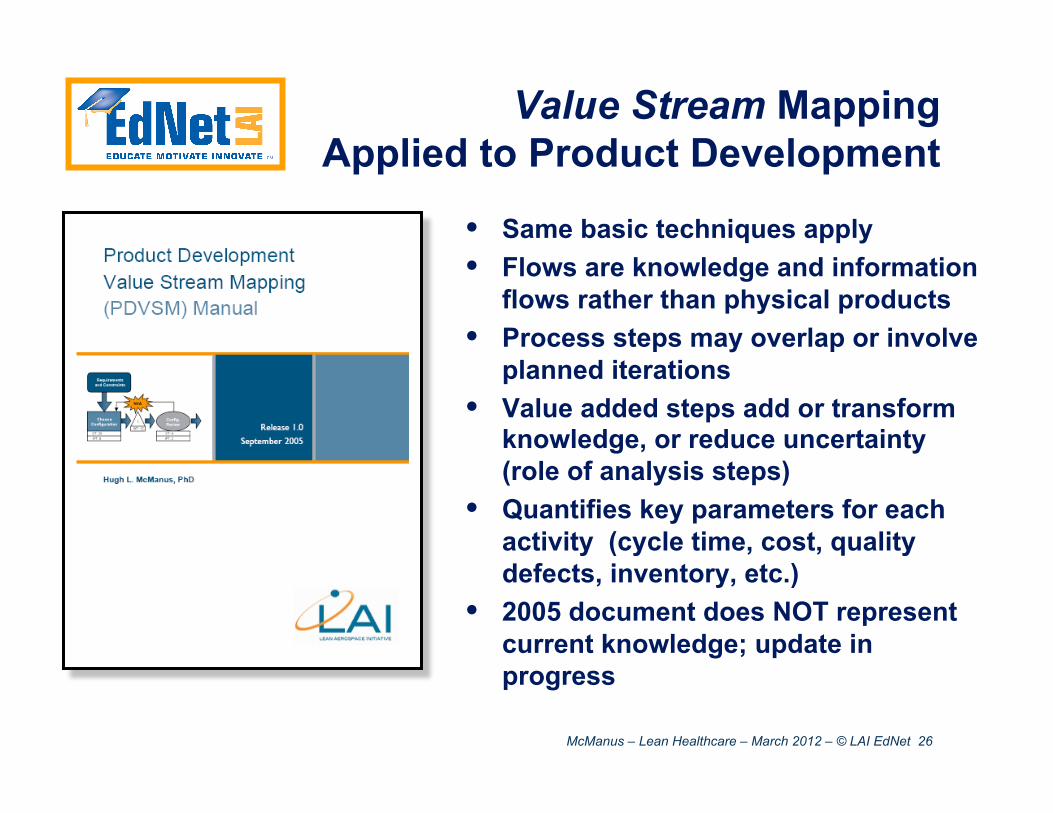
Value Stream Mapping Applied to Product Development
• Same basic techniques apply • Flows are knowledge and information
flows rather than physical products • Process steps may overlap or involve
planned iterations • Value added steps add or transform
knowledge, or reduce uncertainty (role of analysis steps)
• Quantifies key parameters for each activity (cycle time, cost, quality defects, inventory, etc.)
• 2005 document does NOT represent current knowledge; update in progress
McManus – Lean Healthcare – March 2012 – © LAI EdNet 27
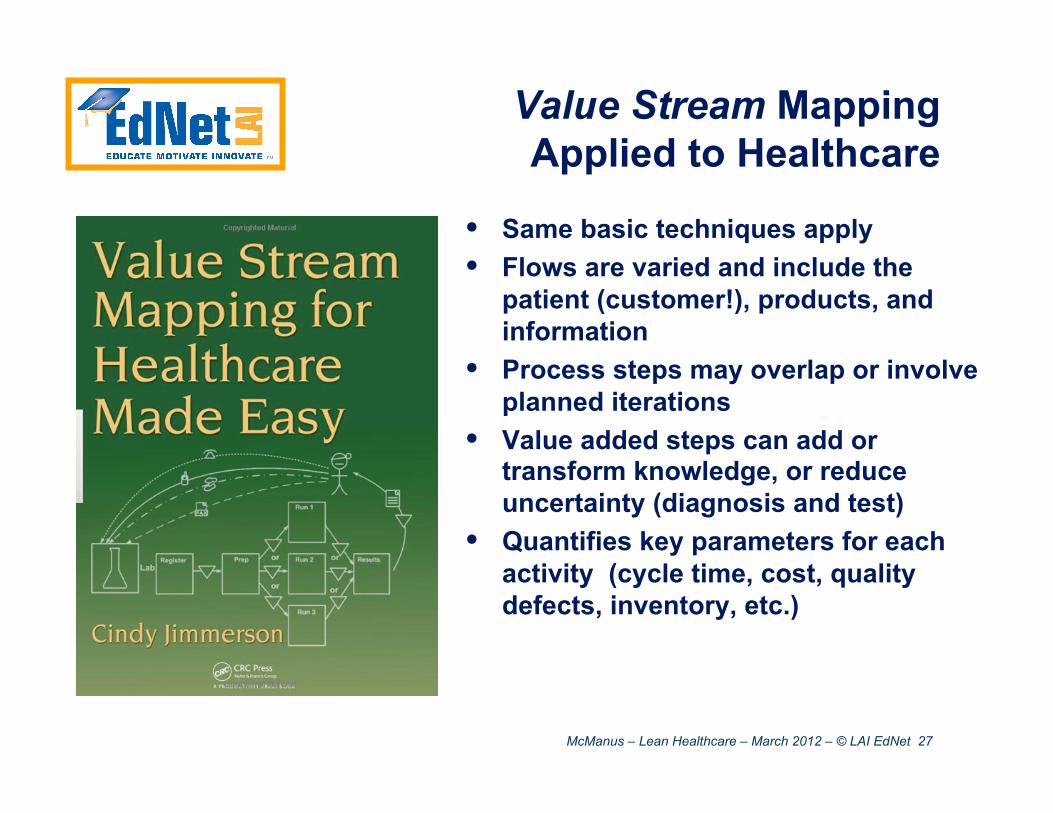
Value Stream Mapping Applied to Healthcare
• Same basic techniques apply • Flows are varied and include the
patient (customer!), products, and information
• Process steps may overlap or involve planned iterations
• Value added steps can add or transform knowledge, or reduce uncertainty (diagnosis and test)
• Quantifies key parameters for each activity (cycle time, cost, quality defects, inventory, etc.)
McManus – Lean Healthcare – March 2012 – © LAI EdNet 28
• There are many value streams in a Healthcare Enterprise
• There are lean tools for uncovering and visualizing them
McManus – Lean Healthcare – March 2012 – © LAI EdNet 29
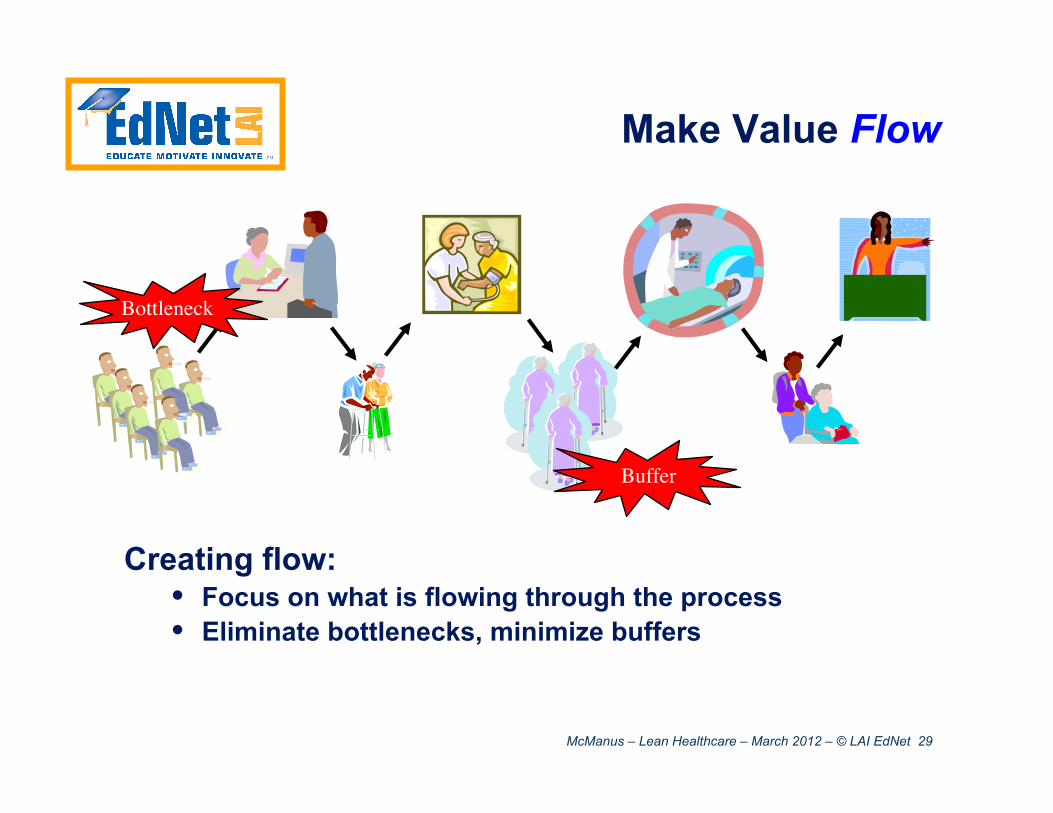
Make Value Flow
Creating flow: • Focus on what is flowing through the process • Eliminate bottlenecks, minimize buffers
Buffer
Bottleneck
McManus – Lean Healthcare – March 2012 – © LAI EdNet 30
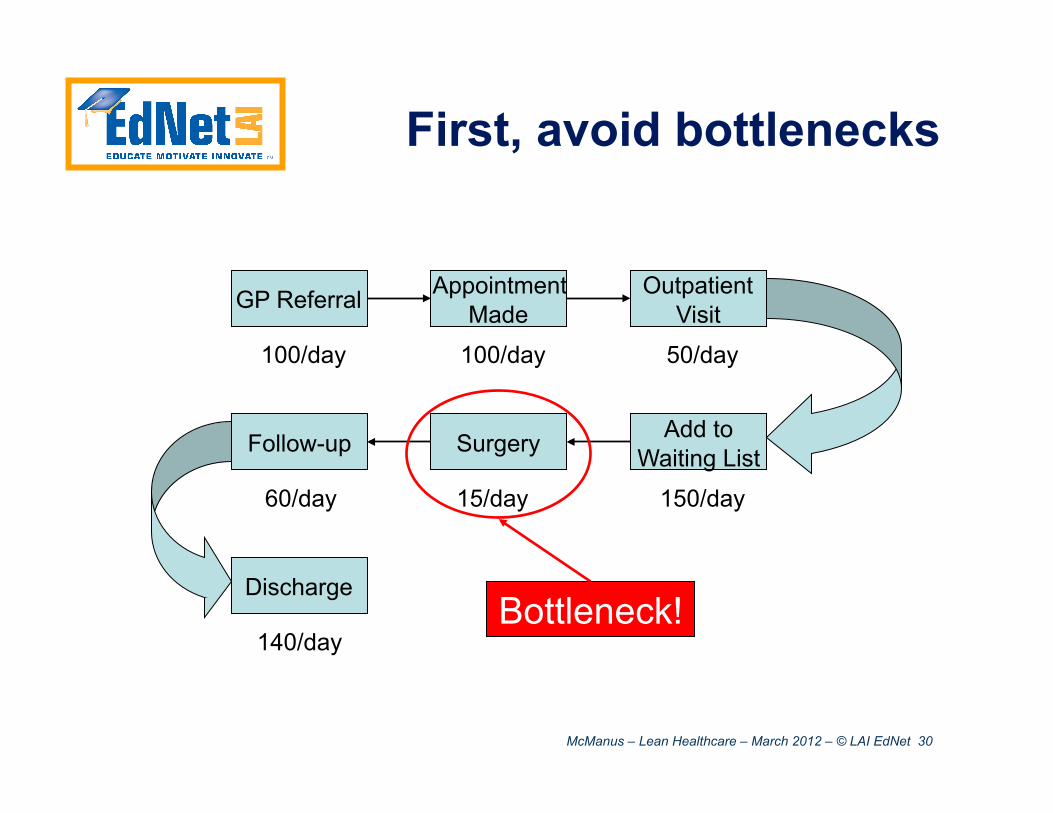
First, avoid bottlenecks
GP Referral Appointment Made
Outpatient Visit
Add to Waiting List Surgery Follow-up
Discharge
100/day 100/day 50/day
150/day 15/day 60/day
140/day Bottleneck!
McManus – Lean Healthcare – March 2012 – © LAI EdNet 31
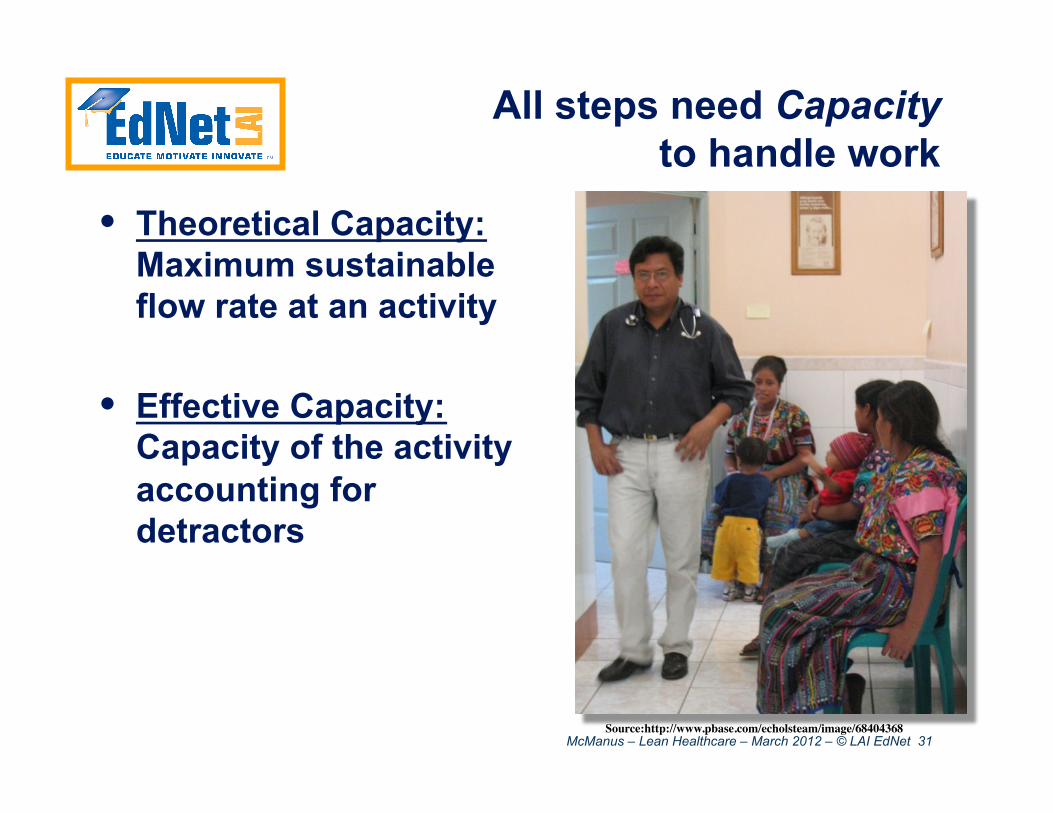
All steps need Capacity to handle work
• Theoretical Capacity: Maximum sustainable flow rate at an activity
• Effective Capacity: Capacity of the activity accounting for detractors
Source:http://www.pbase.com/echolsteam/image/68404368
McManus – Lean Healthcare – March 2012 – © LAI EdNet 32
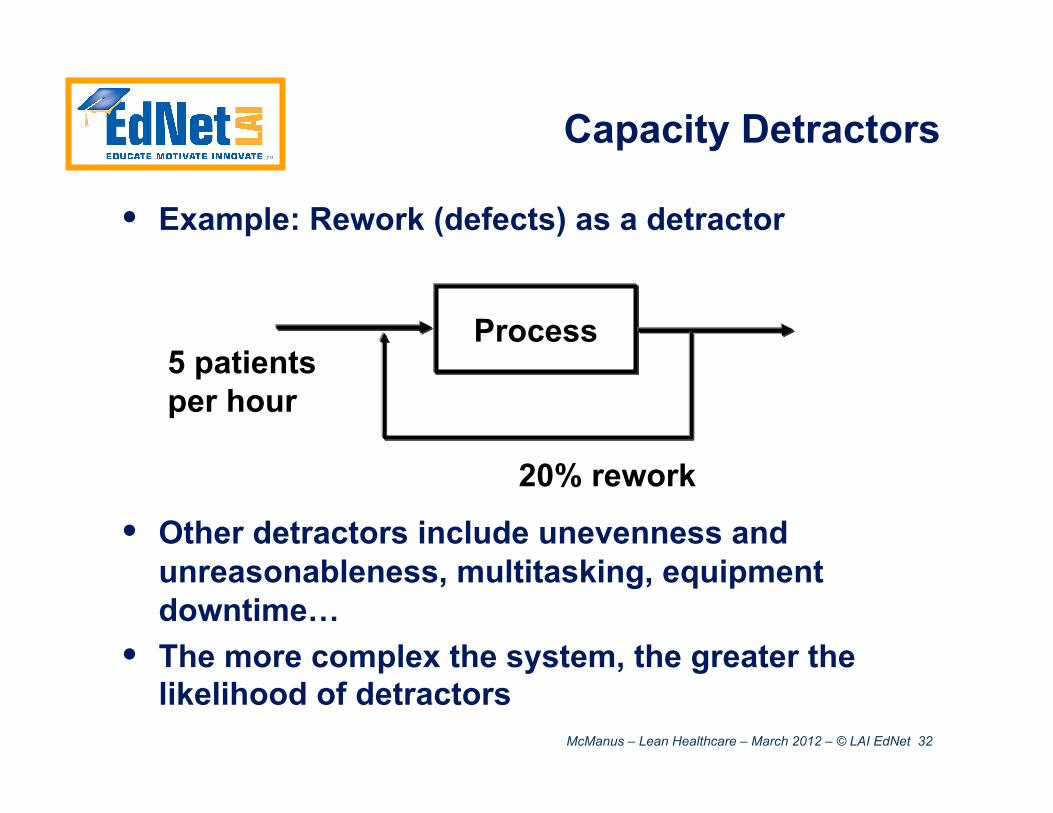
Capacity Detractors
• Example: Rework (defects) as a detractor
• Other detractors include unevenness and unreasonableness, multitasking, equipment downtime…
• The more complex the system, the greater the likelihood of detractors
Process
20% rework
5 patients per hour
McManus – Lean Healthcare – March 2012 – © LAI EdNet 33
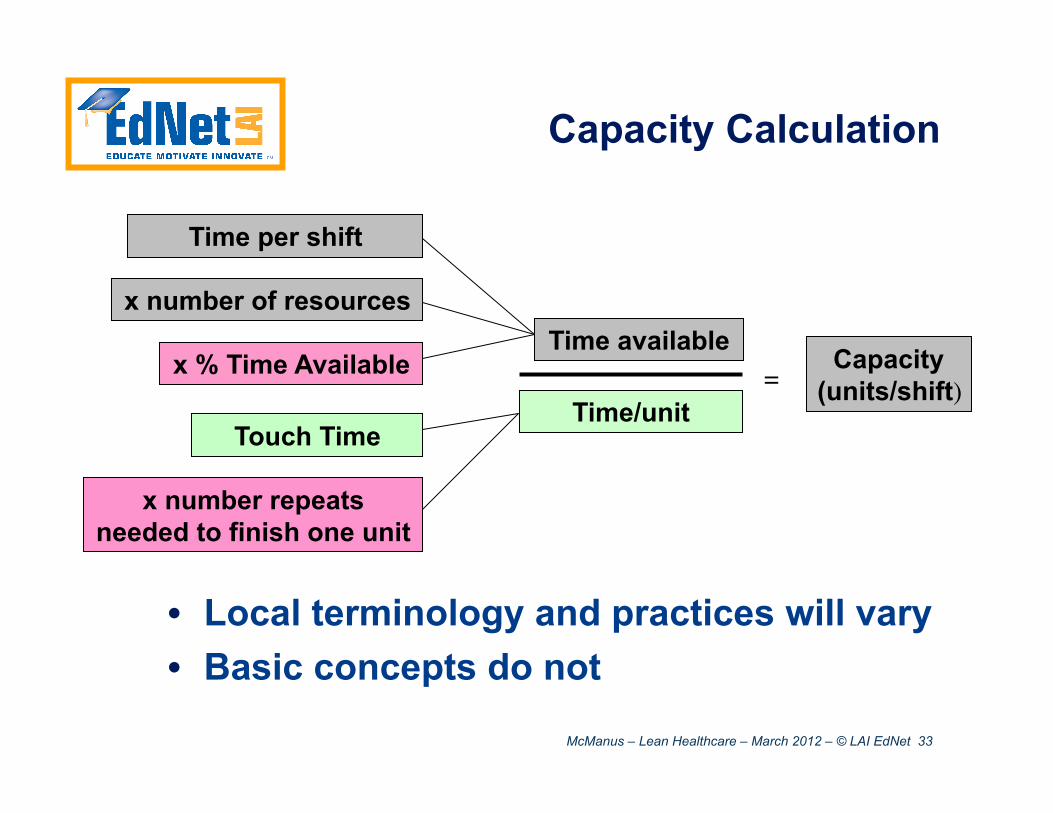
Capacity Calculation
x % Time Available
Time per shift
Time available
Time/unit
Capacity (units/shift)
x number of resources
Touch Time
x number repeats needed to finish one unit
• Local terminology and practices will vary • Basic concepts do not
=
McManus – Lean Healthcare – March 2012 – © LAI EdNet 34
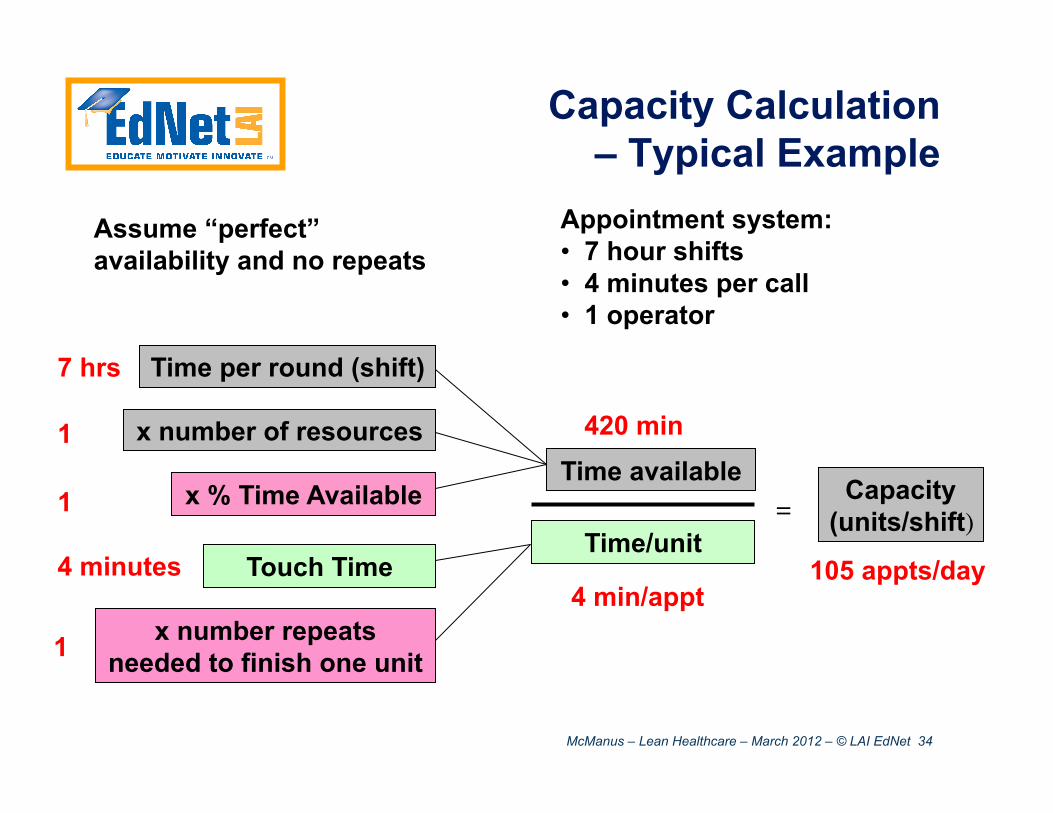
Capacity Calculation – Typical Example
x % Time Available
Time per round (shift)
Time available
Time/unit
Capacity (units/shift)
x number of resources
Touch Time
x number repeats needed to finish one unit
=
420 min
4 min/appt105 appts/day
1
Assume “perfect” availability and no repeats
1
Appointment system: • 7 hour shifts • 4 minutes per call • 1 operator
7 hrs
4 minutes
1
McManus – Lean Healthcare – March 2012 – © LAI EdNet 35
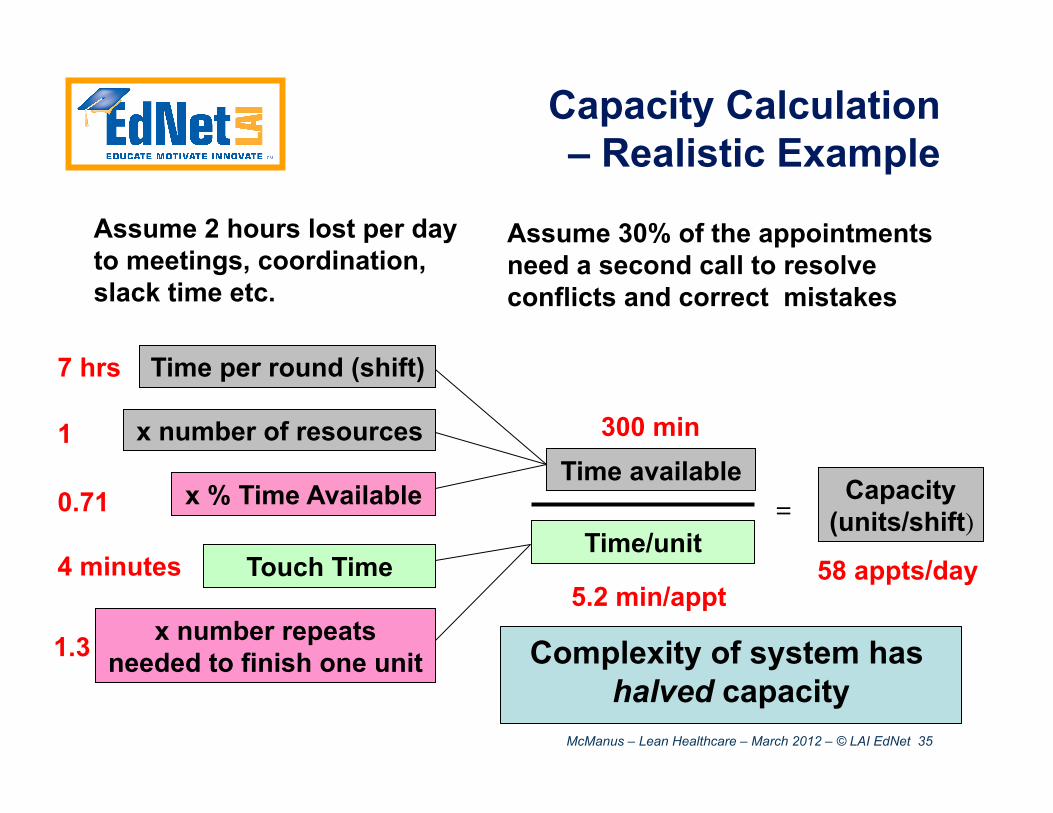
Capacity Calculation – Realistic Example
x % Time Available
Time per round (shift)
Time available
Time/unit
Capacity (units/shift)
x number of resources
Touch Time
x number repeats needed to finish one unit
=
7 hrs
1
4 minutes
300 min
5.2 min/appt58 appts/day
0.71
Assume 2 hours lost per day to meetings, coordination, slack time etc.
1.3
Assume 30% of the appointments need a second call to resolve conflicts and correct mistakes
Complexity of system has halved capacity
McManus – Lean Healthcare – March 2012 – © LAI EdNet 36
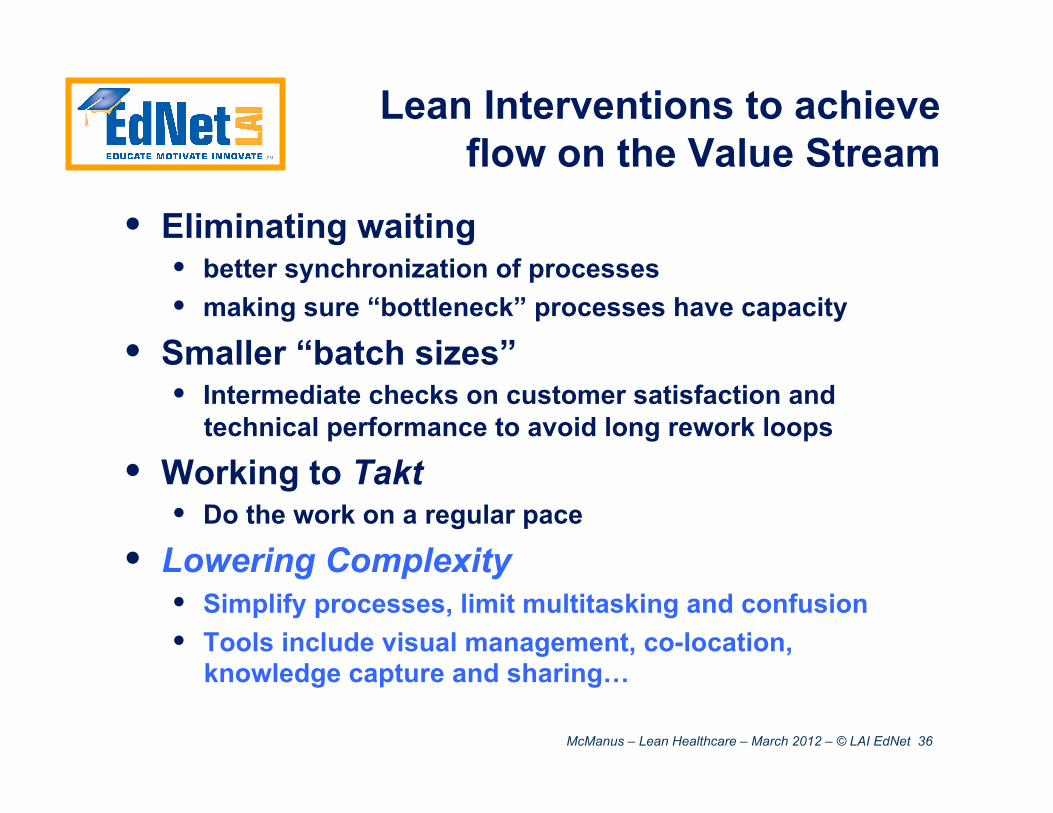
Lean Interventions to achieve flow on the Value Stream
• Eliminating waiting • better synchronization of processes • making sure “bottleneck” processes have capacity
• Smaller “batch sizes” • Intermediate checks on customer satisfaction and
technical performance to avoid long rework loops
• Working to Takt • Do the work on a regular pace
• Lowering Complexity • Simplify processes, limit multitasking and confusion • Tools include visual management, co-location,
knowledge capture and sharing…
McManus – Lean Healthcare – March 2012 – © LAI EdNet 37
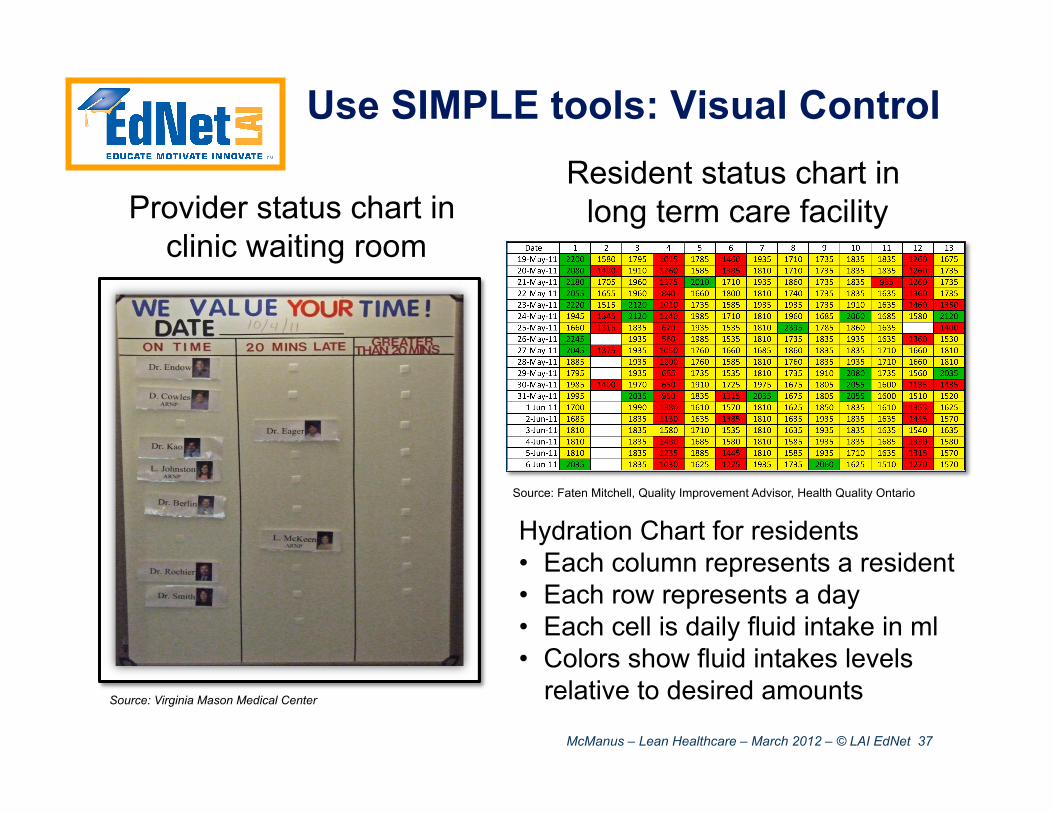
Provider status chart in clinic waiting room
Source: Virginia Mason Medical Center
Resident status chart in long term care facility
Hydration Chart for residents • Each column represents a resident • Each row represents a day • Each cell is daily fluid intake in ml • Colors show fluid intakes levels
relative to desired amounts
Source: Faten Mitchell, Quality Improvement Advisor, Health Quality Ontario
Use SIMPLE tools: Visual Control
McManus – Lean Healthcare – March 2012 – © LAI EdNet 38
• Flow can be created by removing bottlenecks from the value stream
• However, complexity of healthcare environment, and associated detractors, make this difficult
McManus – Lean Healthcare – March 2012 – © LAI EdNet 39
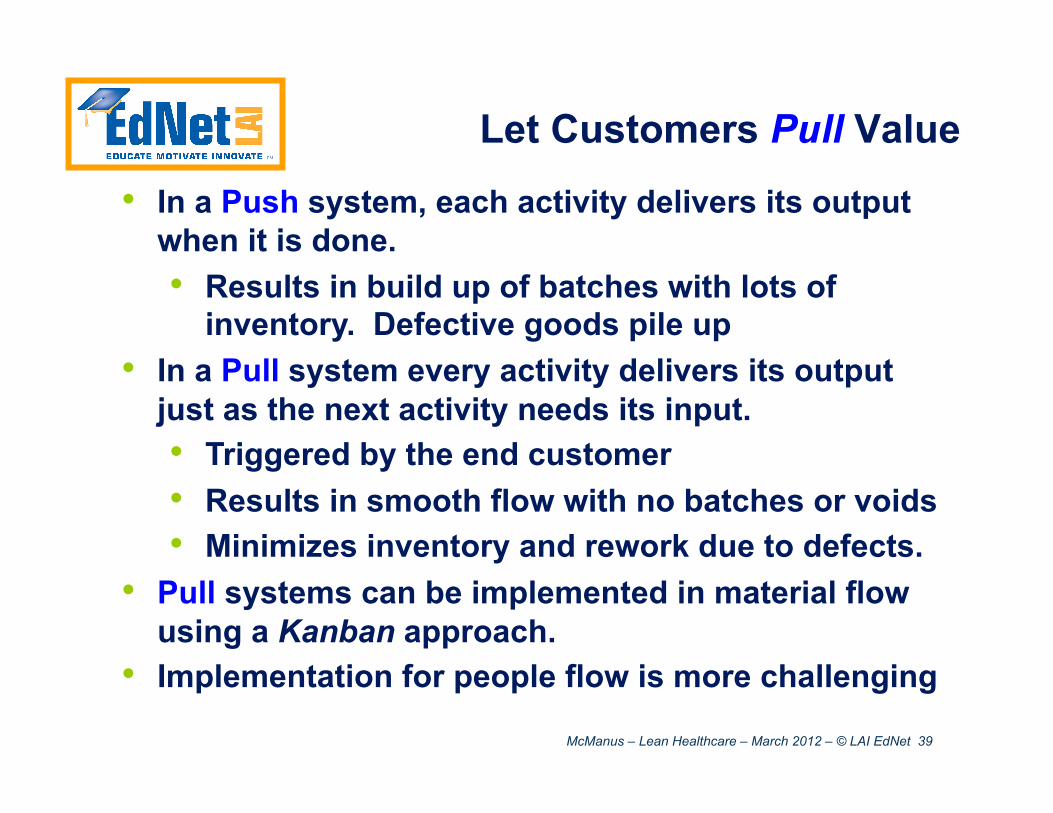
Let Customers Pull Value
• In a Push system, each activity delivers its output when it is done. • Results in build up of batches with lots of
inventory. Defective goods pile up • In a Pull system every activity delivers its output
just as the next activity needs its input. • Triggered by the end customer • Results in smooth flow with no batches or voids • Minimizes inventory and rework due to defects.
• Pull systems can be implemented in material flow using a Kanban approach.
• Implementation for people flow is more challenging
McManus – Lean Healthcare – March 2012 – © LAI EdNet 40
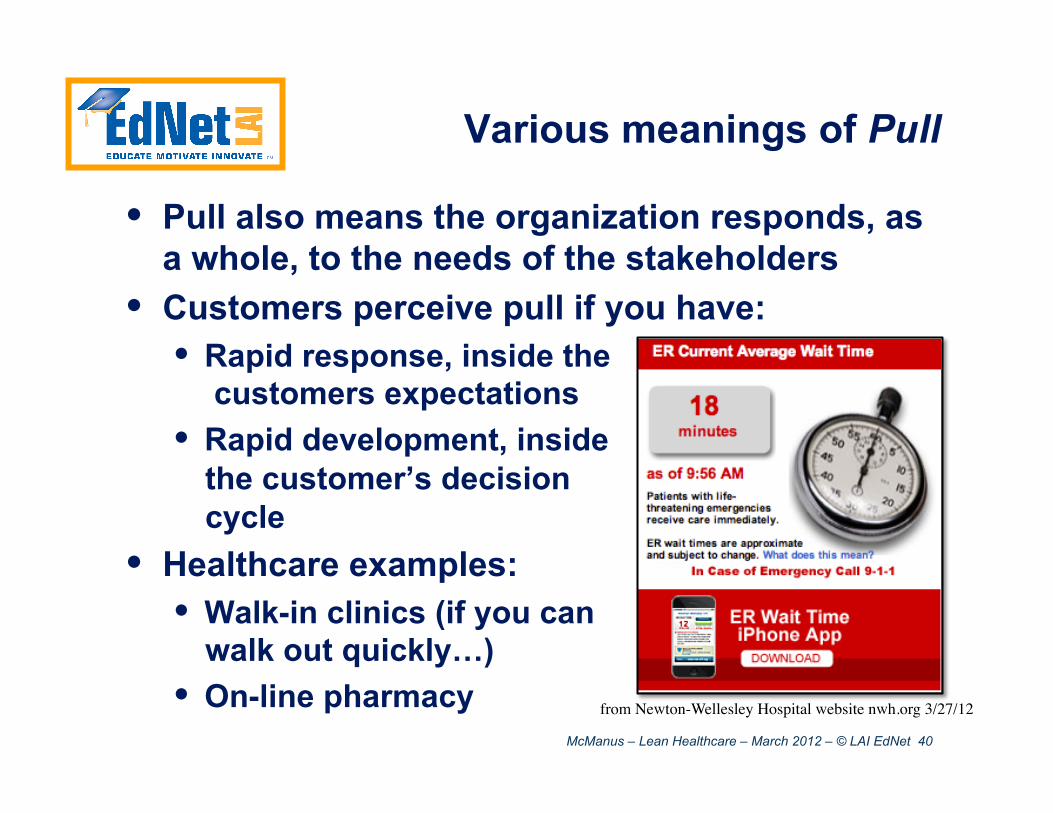
Various meanings of Pull
• Pull also means the organization responds, as a whole, to the needs of the stakeholders
• Customers perceive pull if you have: • Rapid response, inside the
customers expectations • Rapid development, inside
the customer’s decision cycle
• Healthcare examples: • Walk-in clinics (if you can
walk out quickly…) • On-line pharmacy from Newton-Wellesley Hospital website nwh.org 3/27/12
McManus – Lean Healthcare – March 2012 – © LAI EdNet 41
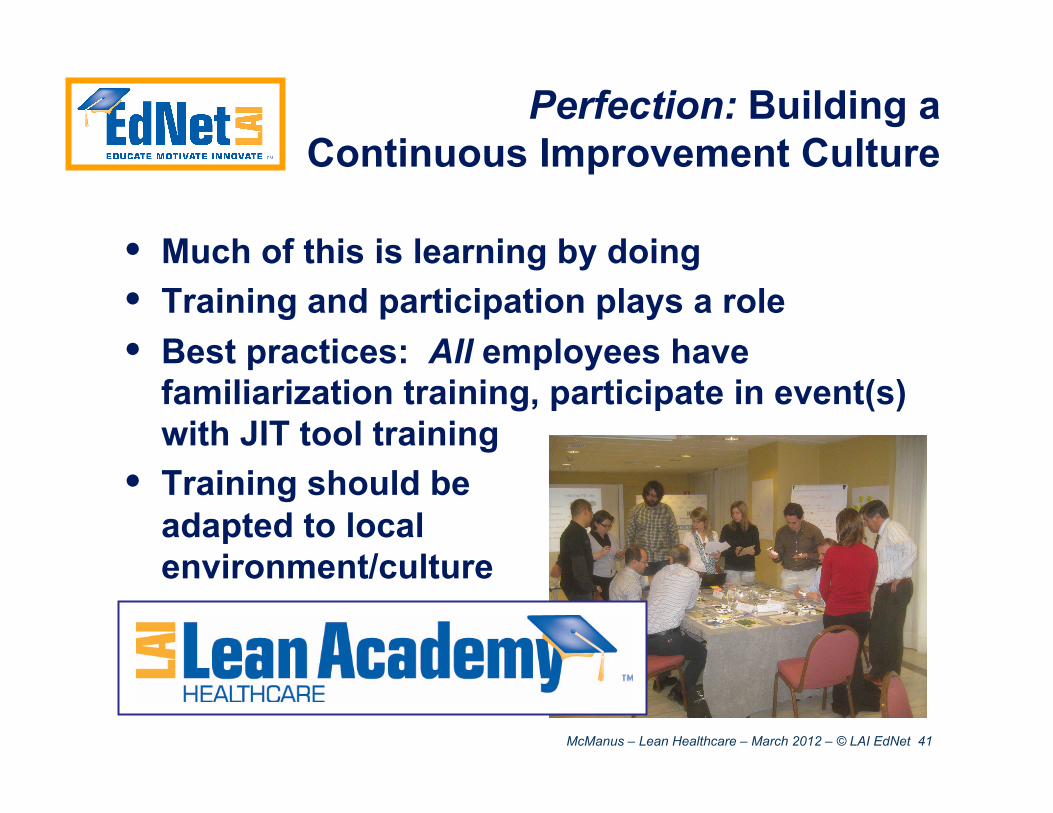
Perfection: Building a Continuous Improvement Culture
• Much of this is learning by doing • Training and participation plays a role • Best practices: All employees have
familiarization training, participate in event(s) with JIT tool training
• Training should be adapted to local environment/culture
McManus – Lean Healthcare – March 2012 – © LAI EdNet 42
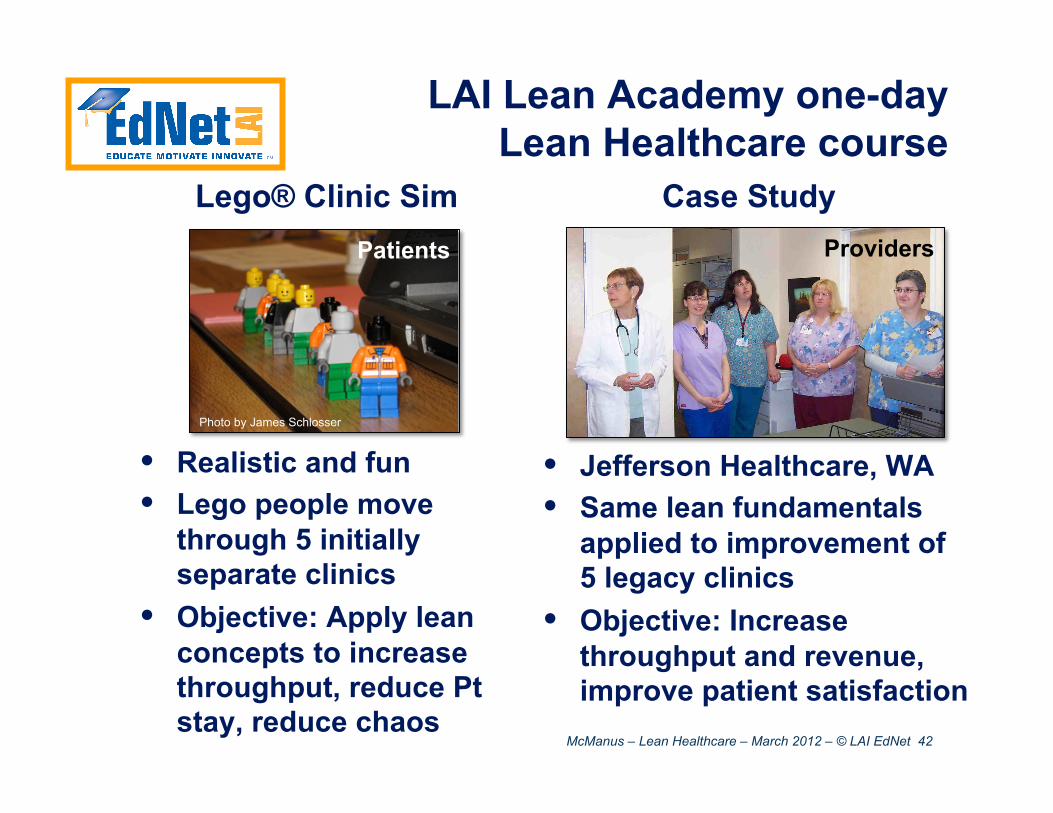
LAI Lean Academy one-day Lean Healthcare course
Lego® Clinic Sim
• Realistic and fun • Lego people move
through 5 initially separate clinics
• Objective: Apply lean concepts to increase throughput, reduce Pt stay, reduce chaos
Case Study
• Jefferson Healthcare, WA • Same lean fundamentals
applied to improvement of 5 legacy clinics
• Objective: Increase throughput and revenue, improve patient satisfaction
Photo by James Schlosser
Patients Providers
McManus – Lean Healthcare – March 2012 – © LAI EdNet 43
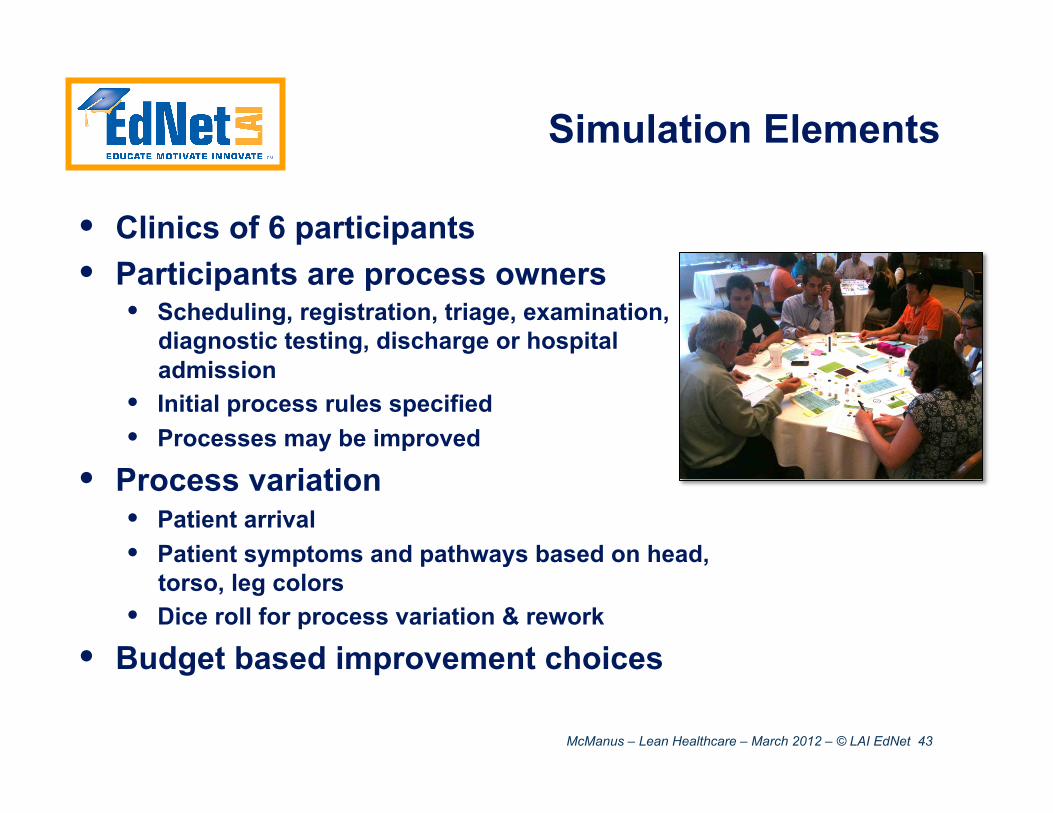
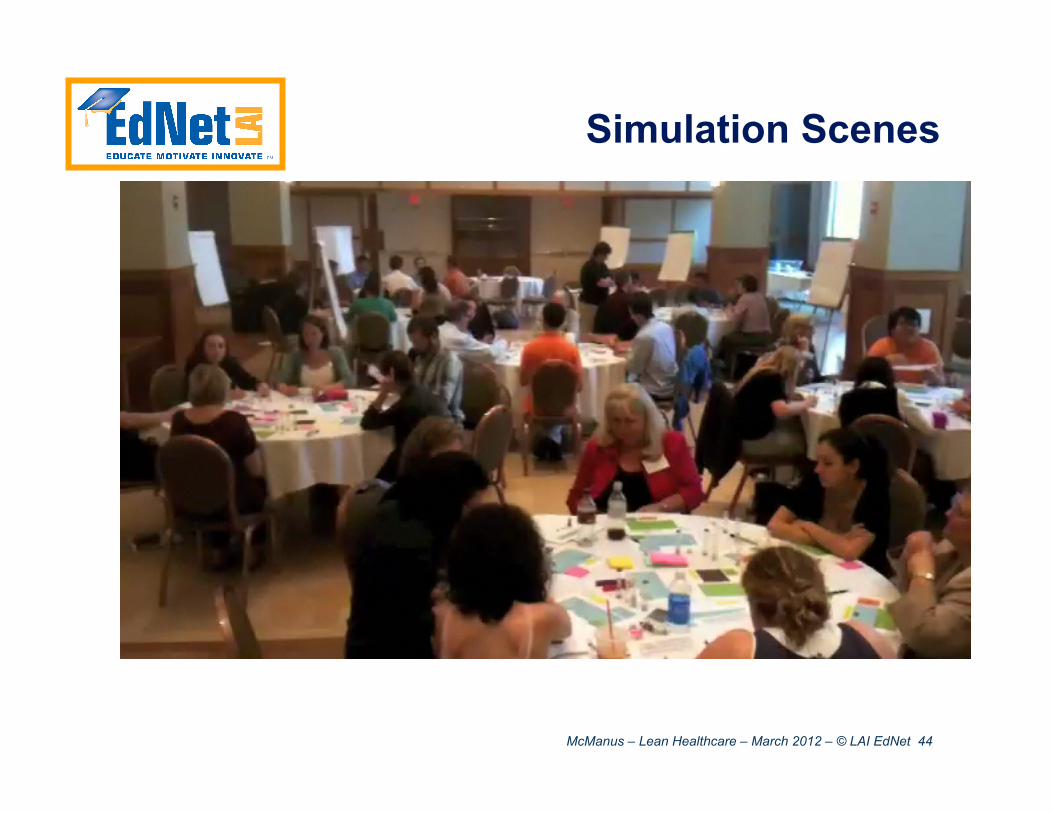
Simulation Elements
• Clinics of 6 participants • Participants are process owners
• Scheduling, registration, triage, examination, diagnostic testing, discharge or hospital admission
• Initial process rules specified • Processes may be improved
• Process variation • Patient arrival • Patient symptoms and pathways based on head,
torso, leg colors • Dice roll for process variation & rework
• Budget based improvement choices
McManus – Lean Healthcare – March 2012 – © LAI EdNet 44
Simulation Scenes
McManus – Lean Healthcare – March 2012 – © LAI EdNet 45
• Pull in the eyes of the customer can be achieved in healthcare processes
• The drive for perfection requires strong leadership, pervasive training, and persistence over time
• Next: The biggest barrier to classic lean in Healthcare
McManus – Lean Healthcare – March 2012 – © LAI EdNet 46
Application of Lean to Healthcare Processes: A Complex System Perspective
Part II – Variability and Complexity
McManus – Lean Healthcare – March 2012 – © LAI EdNet 47
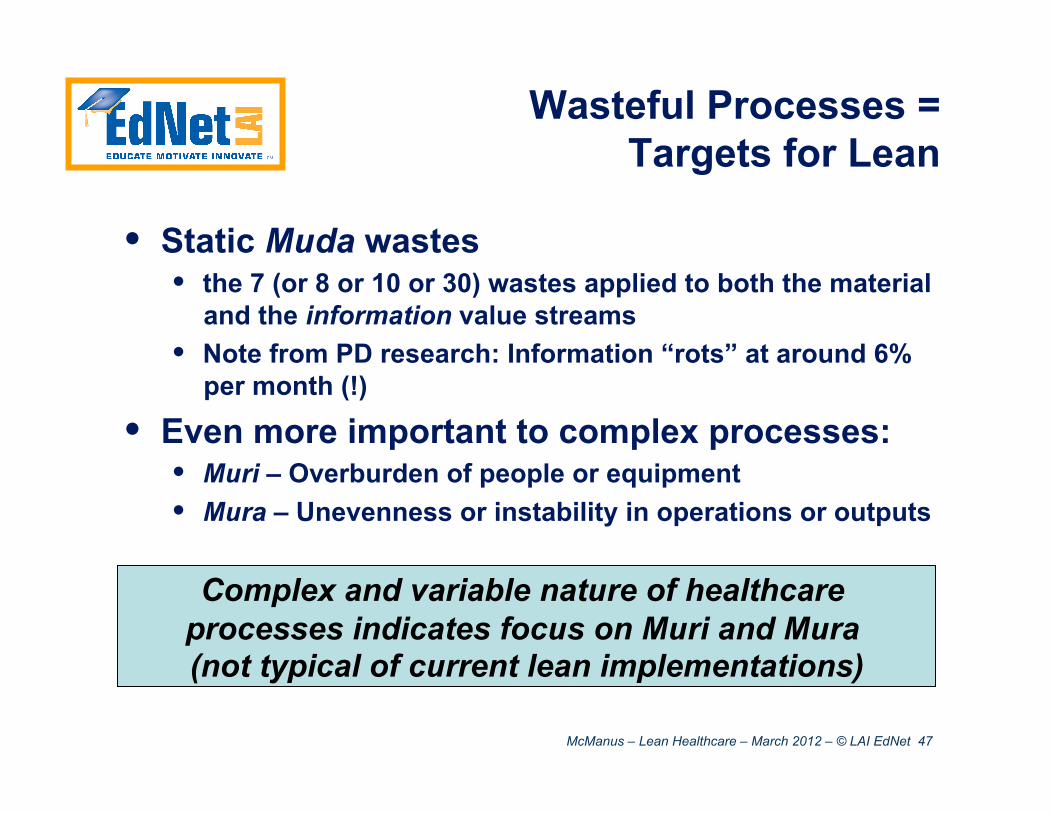
Wasteful Processes = Targets for Lean
• Static Muda wastes • the 7 (or 8 or 10 or 30) wastes applied to both the material
and the information value streams • Note from PD research: Information “rots” at around 6%
per month (!)
• Even more important to complex processes: • Muri – Overburden of people or equipment • Mura – Unevenness or instability in operations or outputs
Complex and variable nature of healthcare processes indicates focus on Muri and Mura (not typical of current lean implementations)
McManus – Lean Healthcare – March 2012 – © LAI EdNet 48
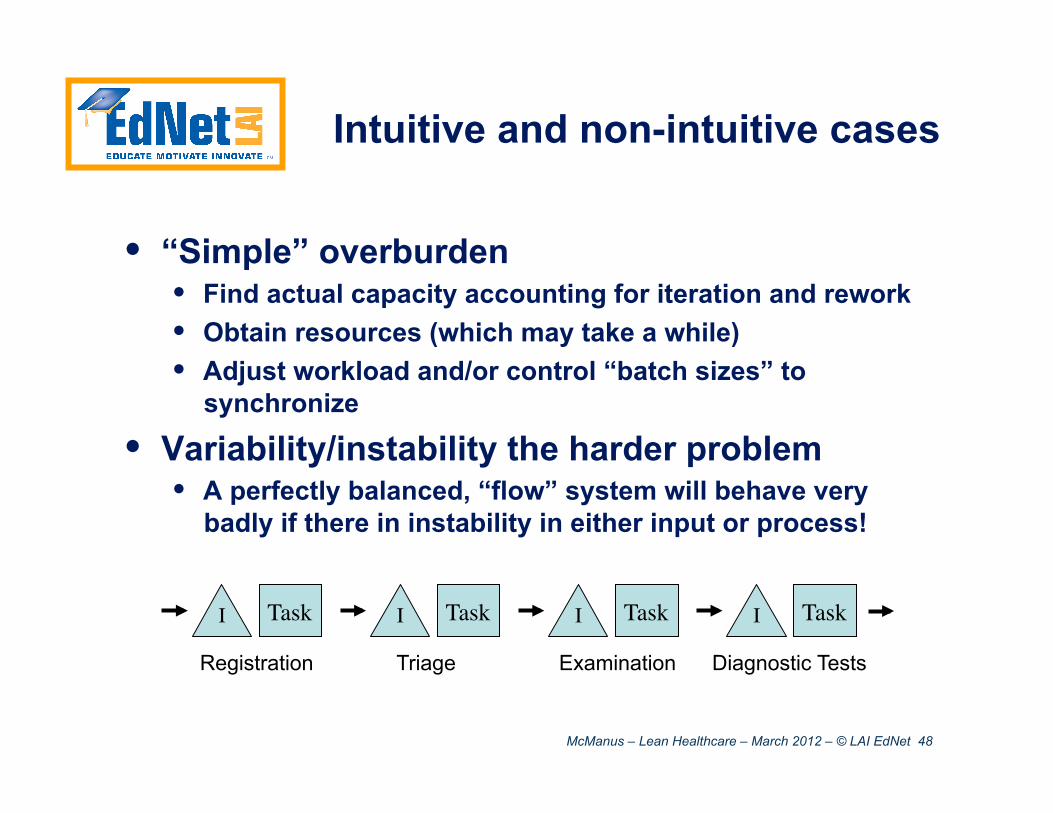
Intuitive and non-intuitive cases
• “Simple” overburden • Find actual capacity accounting for iteration and rework • Obtain resources (which may take a while) • Adjust workload and/or control “batch sizes” to
synchronize
• Variability/instability the harder problem • A perfectly balanced, “flow” system will behave very
badly if there in instability in either input or process!
Registration Triage Examination Diagnostic Tests
Task I Task I Task I Task I
McManus – Lean Healthcare – March 2012 – © LAI EdNet 49
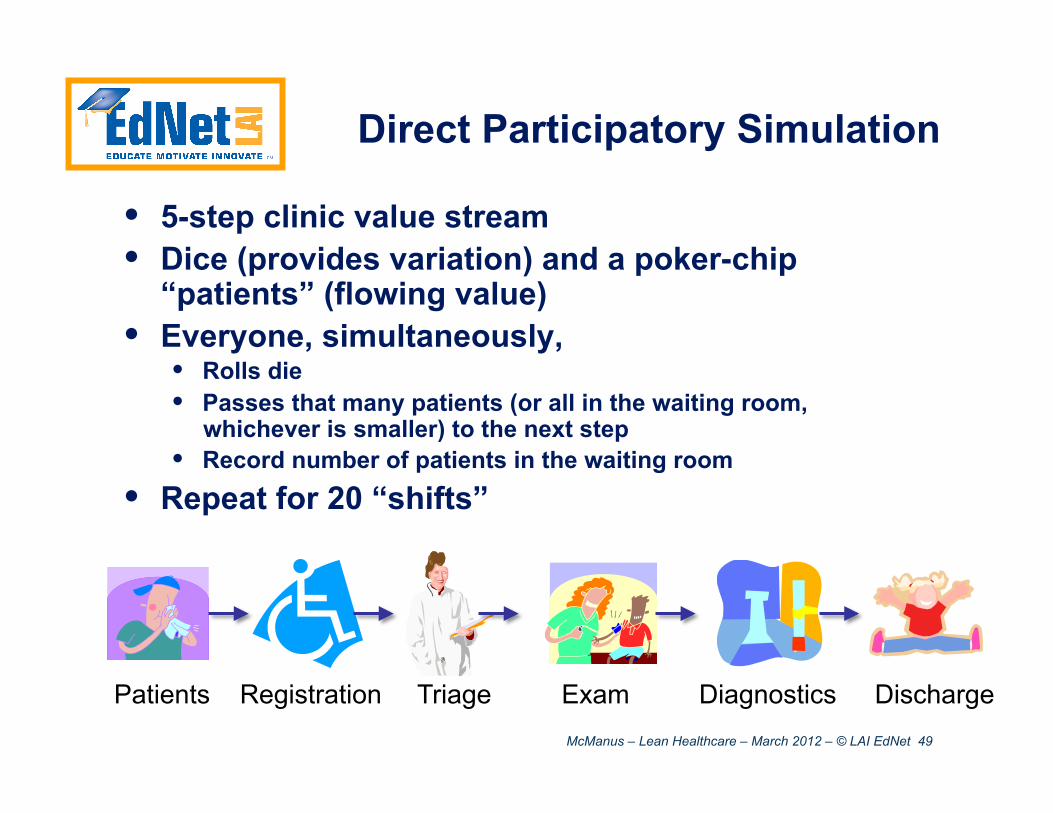
Direct Participatory Simulation
• 5-step clinic value stream • Dice (provides variation) and a poker-chip
“patients” (flowing value) • Everyone, simultaneously,
• Rolls die • Passes that many patients (or all in the waiting room,
whichever is smaller) to the next step • Record number of patients in the waiting room
• Repeat for 20 “shifts”
Patients Registration Triage Exam Diagnostics Discharge
McManus – Lean Healthcare – March 2012 – © LAI EdNet 50
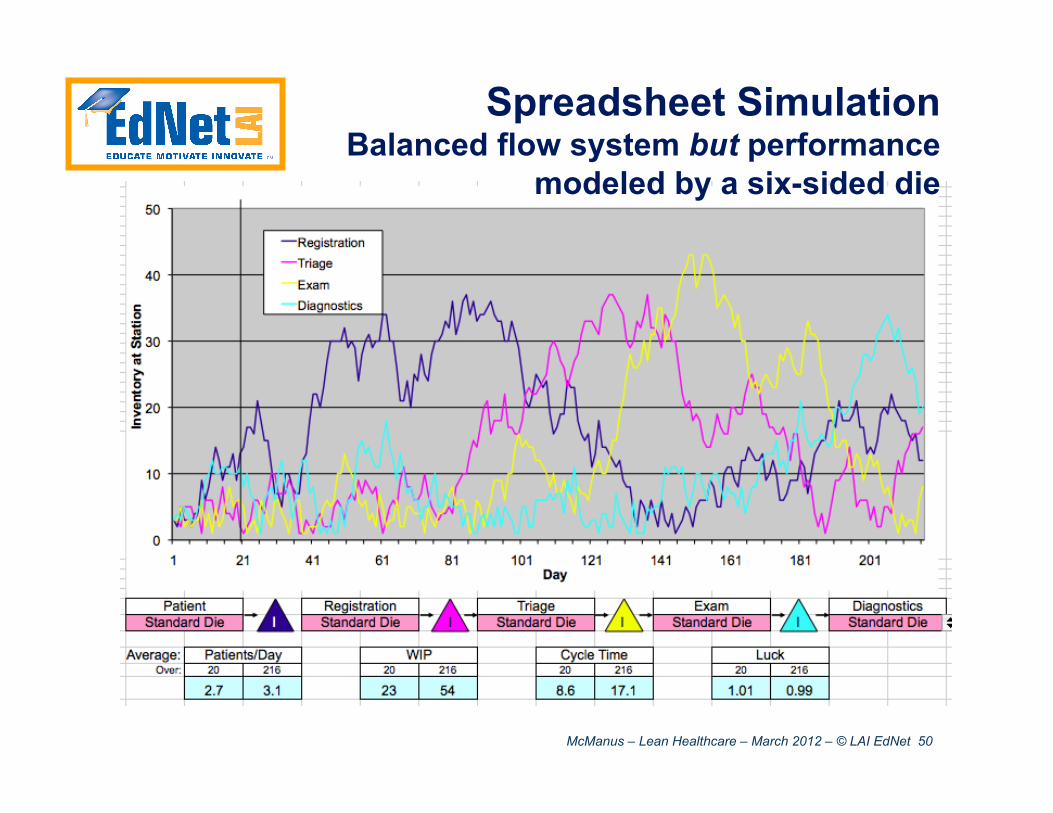
Spreadsheet Simulation Balanced flow system but performance
modeled by a six-sided die
McManus – Lean Healthcare – March 2012 – © LAI EdNet 51
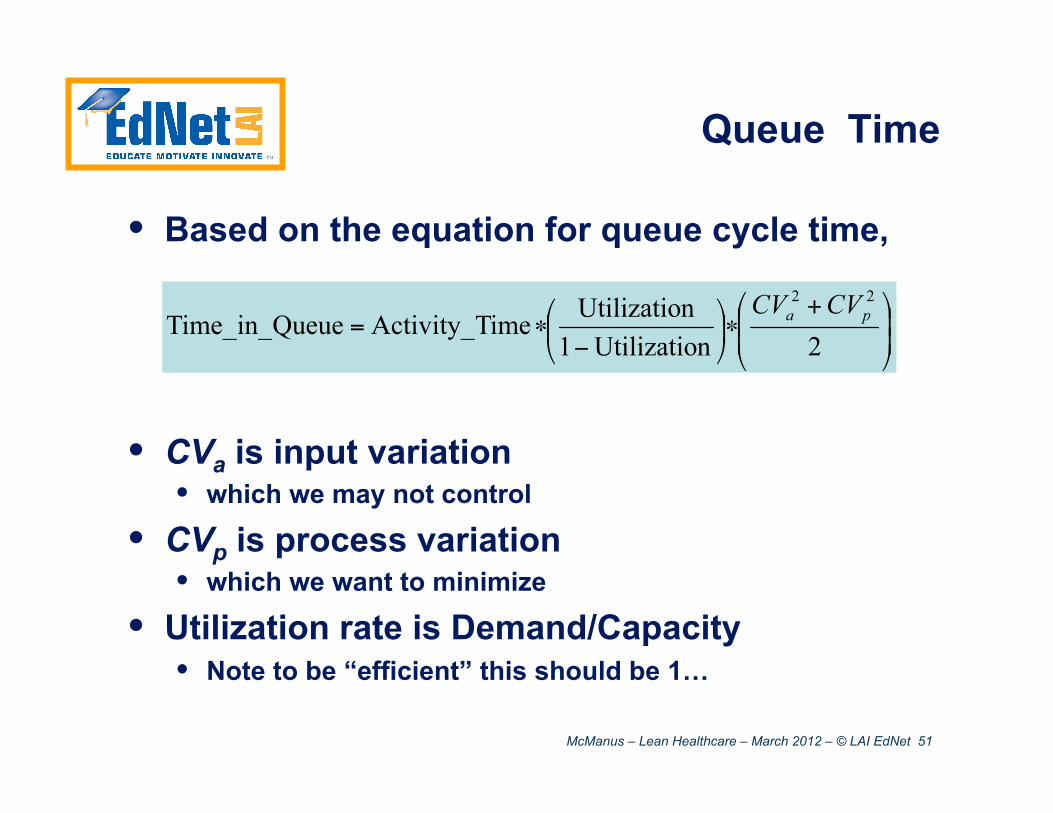
Queue Time
• Based on the equation for queue cycle time,
• CVa is input variation • which we may not control
• CVp is process variation • which we want to minimize
• Utilization rate is Demand/Capacity • Note to be “efficient” this should be 1…
McManus – Lean Healthcare – March 2012 – © LAI EdNet 52
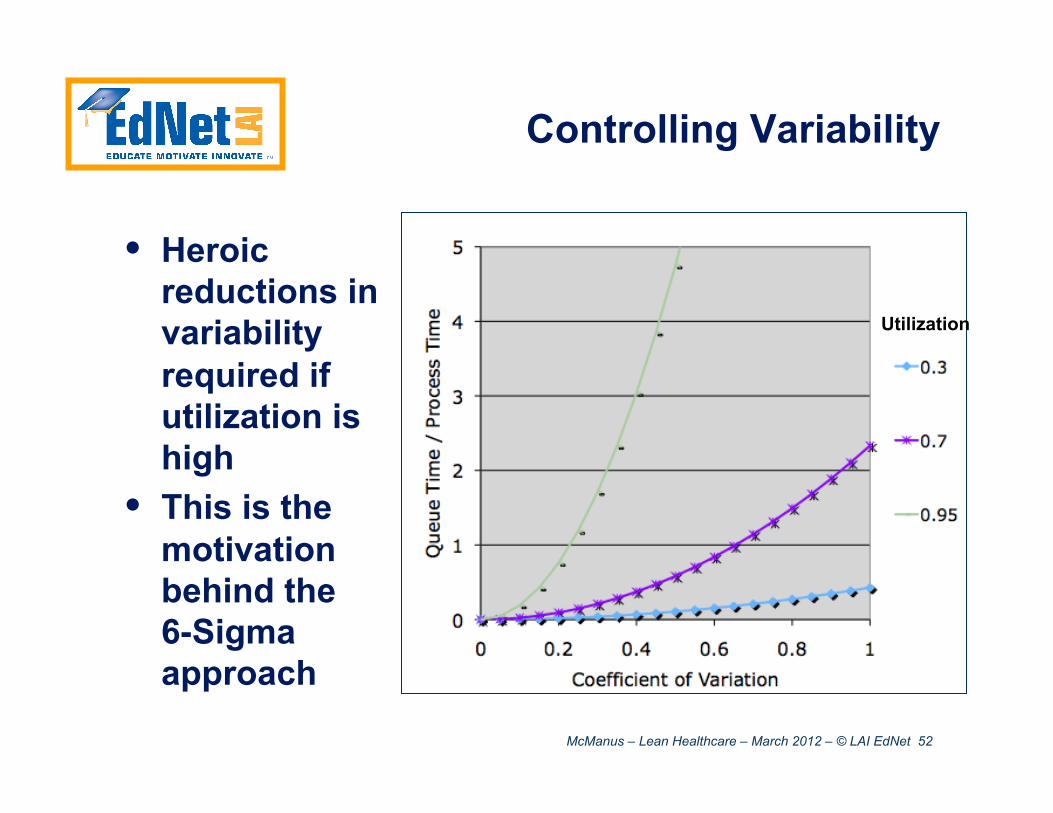
Controlling Variability
• Heroic reductions in variability required if utilization is high
• This is the motivation behind the 6-Sigma approach
Utilization
McManus – Lean Healthcare – March 2012 – © LAI EdNet 53
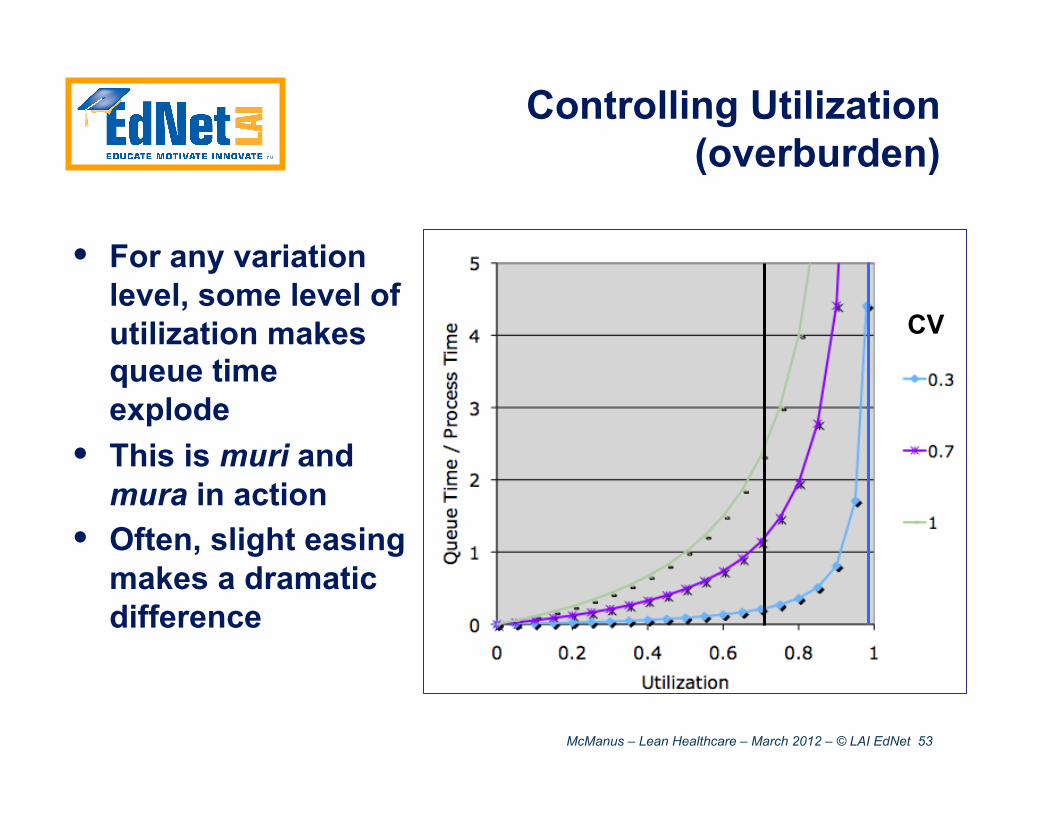
Controlling Utilization (overburden)
• For any variation level, some level of utilization makes queue time explode
• This is muri and mura in action
• Often, slight easing makes a dramatic difference
CV
McManus – Lean Healthcare – March 2012 – © LAI EdNet 54
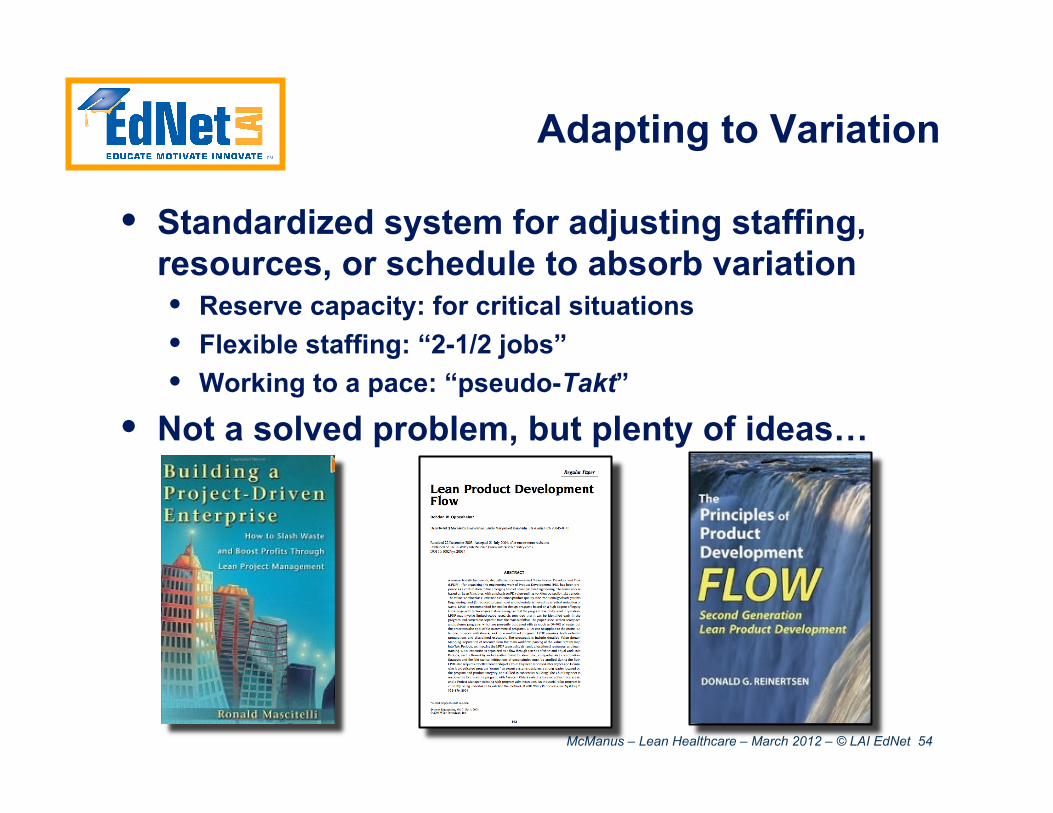
Adapting to Variation
• Standardized system for adjusting staffing, resources, or schedule to absorb variation • Reserve capacity: for critical situations • Flexible staffing: “2-1/2 jobs” • Working to a pace: “pseudo-Takt”
• Not a solved problem, but plenty of ideas…
McManus – Lean Healthcare – March 2012 – © LAI EdNet 55
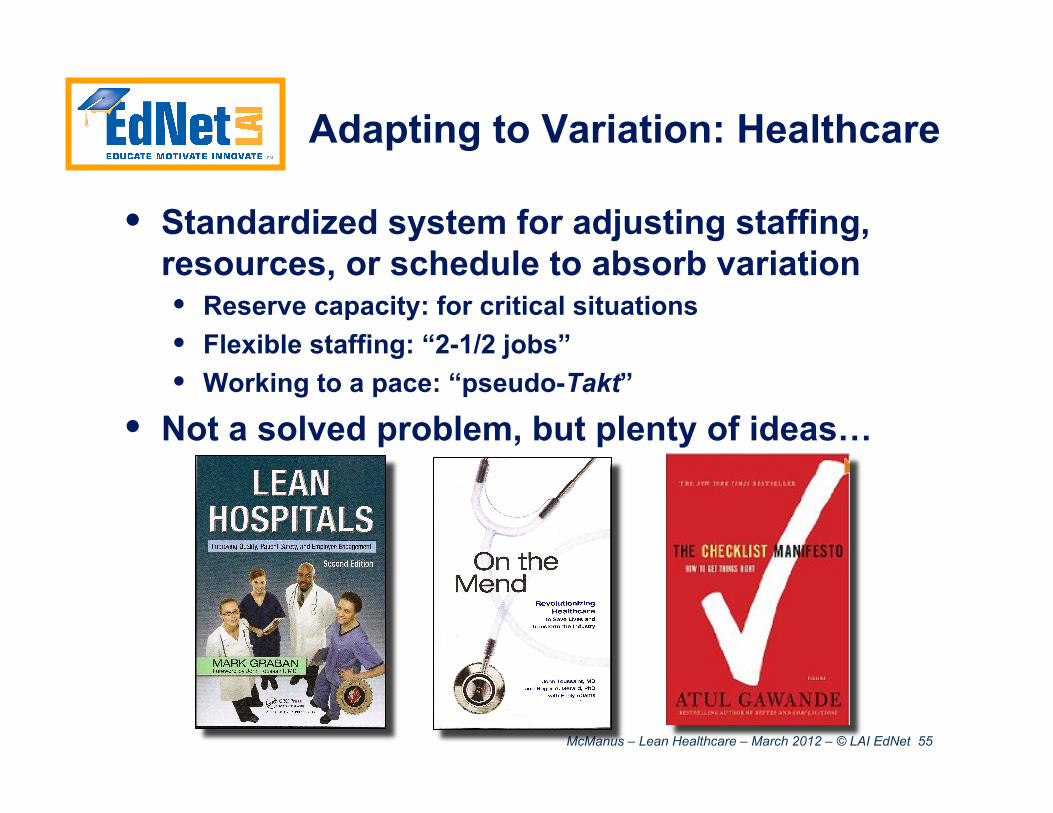
Adapting to Variation: Healthcare
• Standardized system for adjusting staffing, resources, or schedule to absorb variation • Reserve capacity: for critical situations • Flexible staffing: “2-1/2 jobs” • Working to a pace: “pseudo-Takt”
• Not a solved problem, but plenty of ideas…
McManus – Lean Healthcare – March 2012 – © LAI EdNet 56
Reducing Complexity
• Standardizing and simplifying systems to self-regulate without additional management • Daily management systems (self-organizing teams) • Organizing, Kitting and Kanban of supplies • Standardizing of common procedures (checklists)
• Moderate local payoff (less work) • Potentially huge systems payoff through
reduced variation and overburden • Do not “monetize” local savings – use them to
make the system perform better
McManus – Lean Healthcare – March 2012 – © LAI EdNet 57
• Variation will disrupt even a “perfect” system • Badly • Variation (Mura) and Overburden (Muri) are
linked in a nasty way • Both must be reduced, if anything more
aggressively than static wastes • Input variations (patients) may not be
controllable; internal variations and complexity are
McManus – Lean Healthcare – March 2012 – © LAI EdNet 58
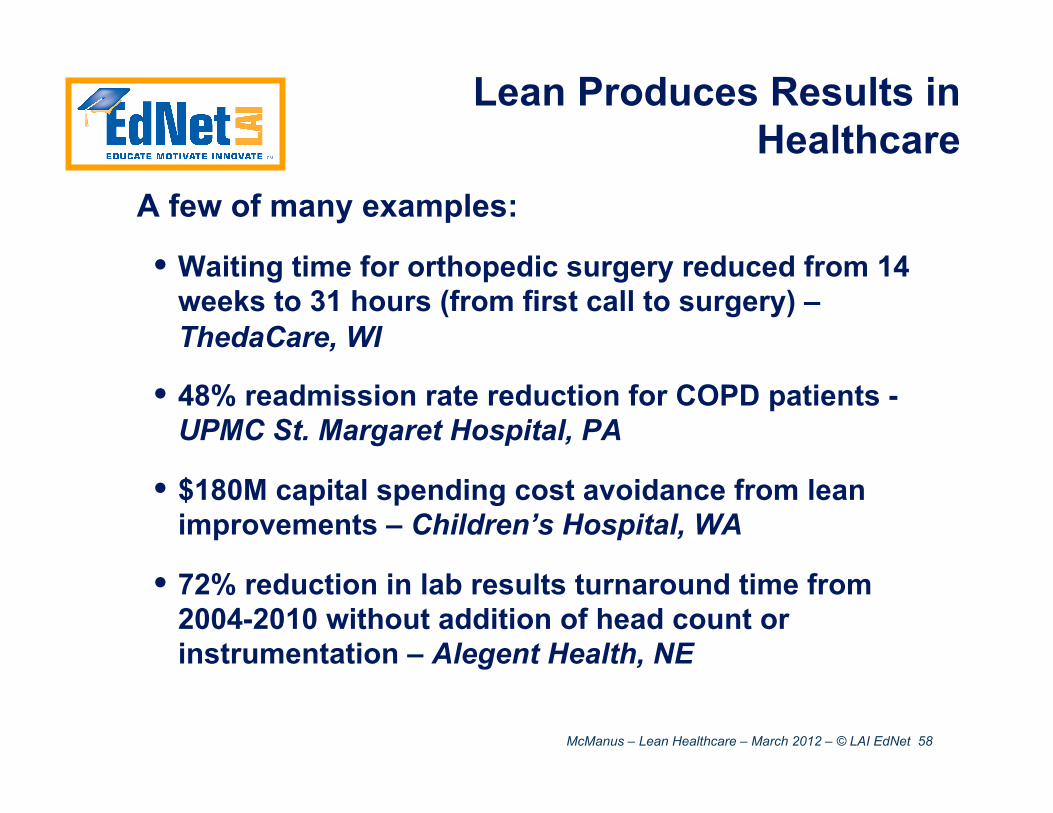
Lean Produces Results in Healthcare
A few of many examples:
• Waiting time for orthopedic surgery reduced from 14 weeks to 31 hours (from first call to surgery) – ThedaCare, WI
• 48% readmission rate reduction for COPD patients - UPMC St. Margaret Hospital, PA
• $180M capital spending cost avoidance from lean improvements – Children’s Hospital, WA
• 72% reduction in lab results turnaround time from 2004-2010 without addition of head count or instrumentation – Alegent Health, NE
McManus – Lean Healthcare – March 2012 – © LAI EdNet 59
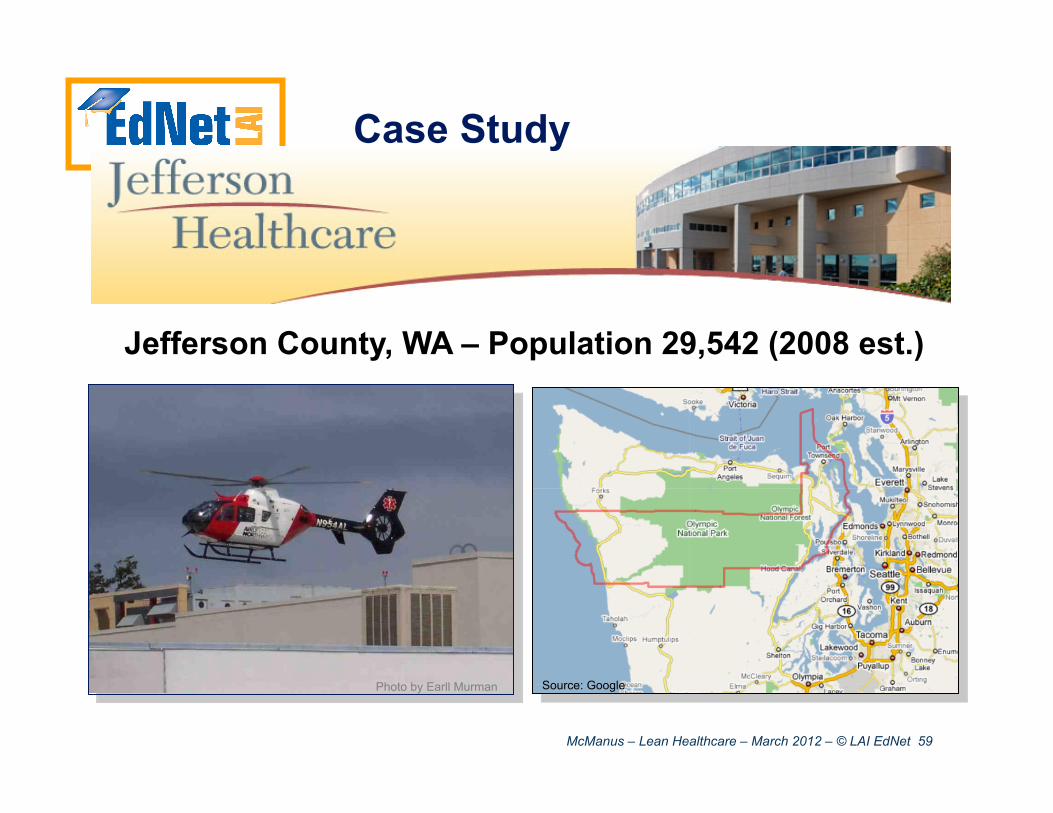
Jefferson County, WA – Population 29,542 (2008 est.)
Source: Google Photo by Earll Murman
Case Study
McManus – Lean Healthcare – March 2012 – © LAI EdNet 60
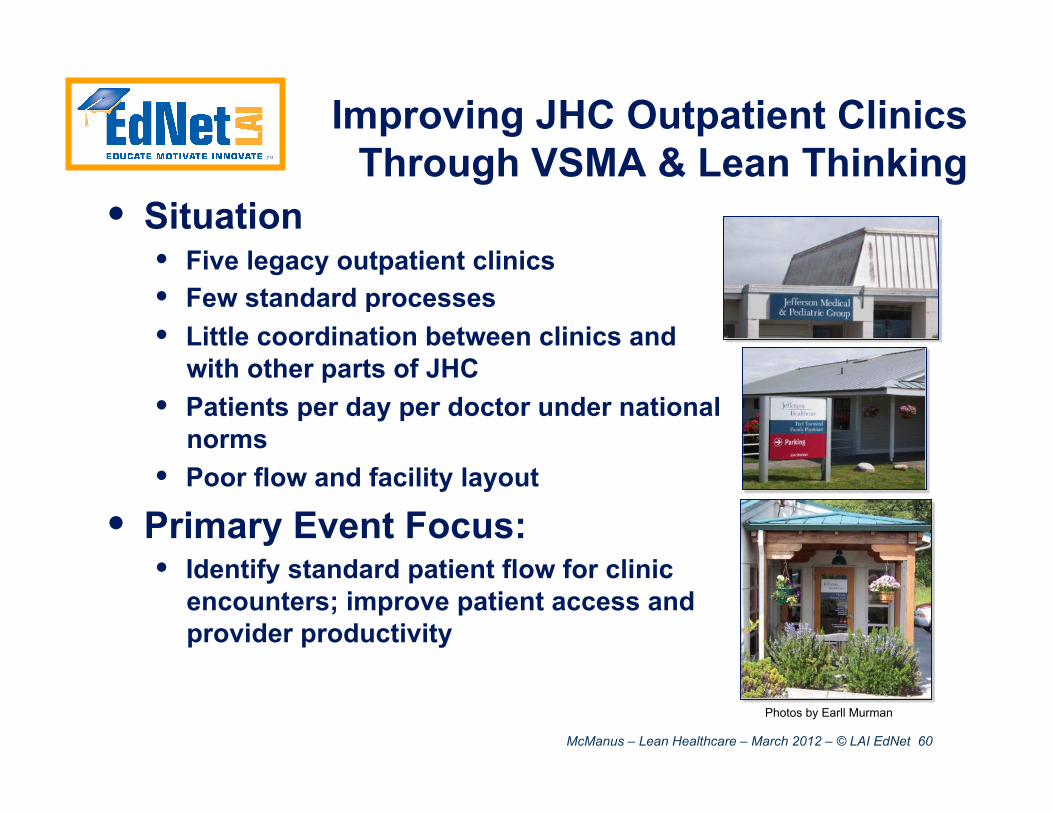
Improving JHC Outpatient Clinics Through VSMA & Lean Thinking
• Situation • Five legacy outpatient clinics • Few standard processes • Little coordination between clinics and
with other parts of JHC • Patients per day per doctor under national
norms • Poor flow and facility layout
• Primary Event Focus: • Identify standard patient flow for clinic
encounters; improve patient access and provider productivity
Photos by Earll Murman
McManus – Lean Healthcare – March 2012 – © LAI EdNet 61 Source: Jefferson Healthcare, Port Townsend, WA
McManus – Lean Healthcare – March 2012 – © LAI EdNet 62 Source: Jefferson Healthcare, Port Townsend, WA
McManus – Lean Healthcare – March 2012 – © LAI EdNet 63 Source: Jefferson Healthcare, Port Townsend, WA
McManus – Lean Healthcare – March 2012 – © LAI EdNet 64
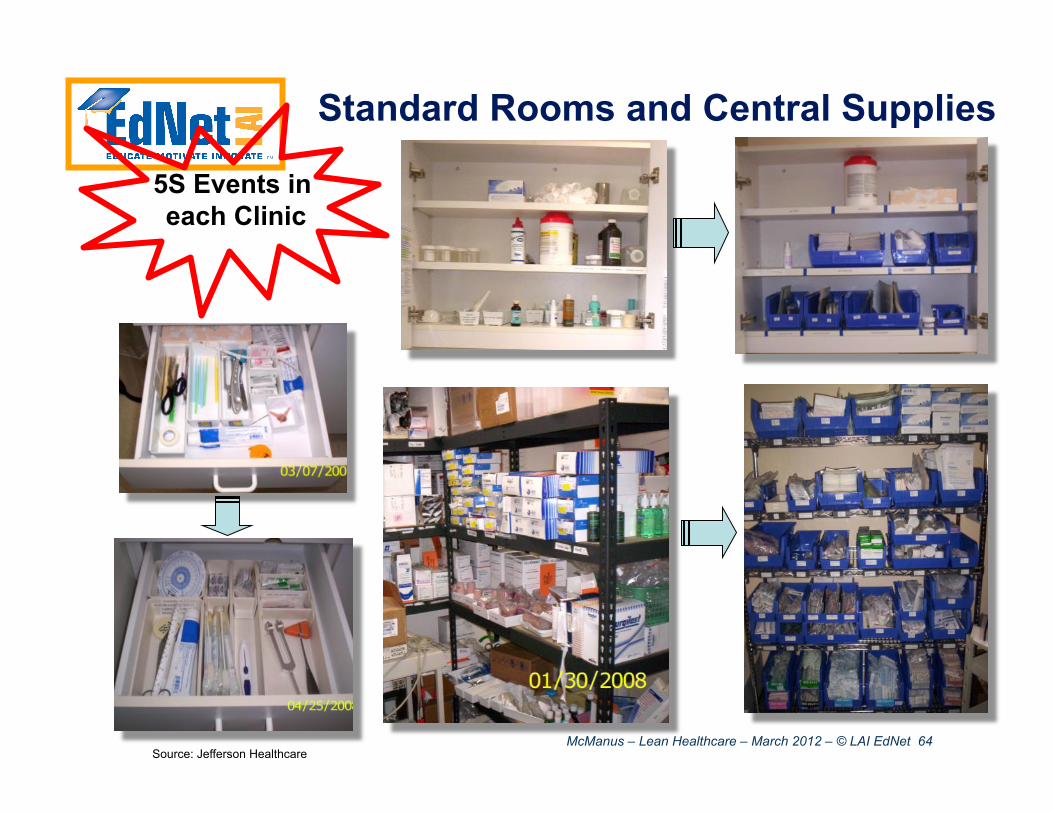
Standard Rooms and Central Supplies
5S Events in each Clinic
Source: Jefferson Healthcare
McManus – Lean Healthcare – March 2012 – © LAI EdNet 65
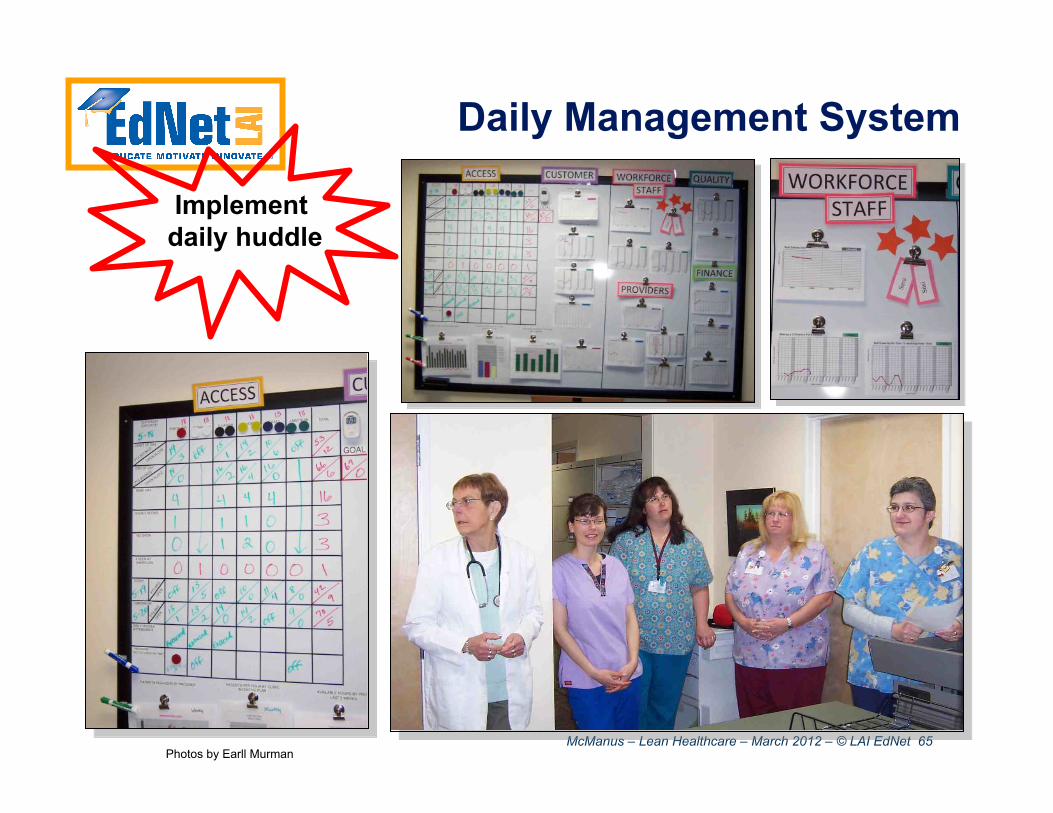
Daily Management System
Implement daily huddle
Photos by Earll Murman
McManus – Lean Healthcare – March 2012 – © LAI EdNet 66
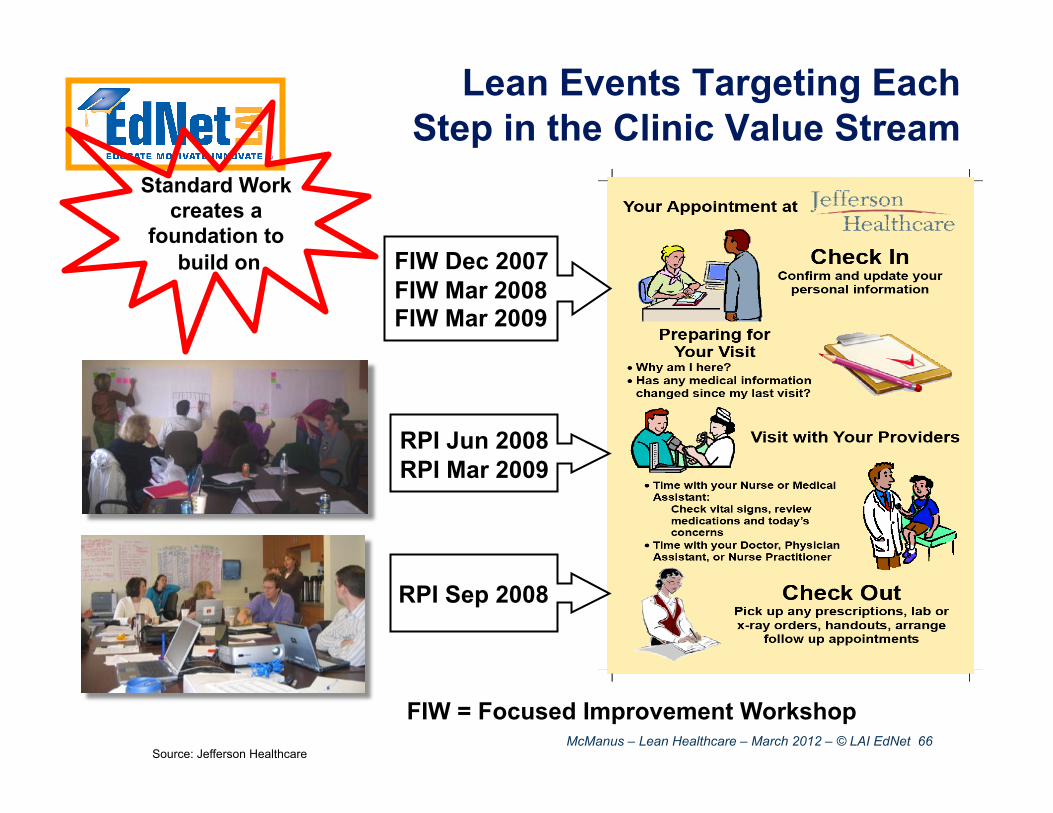
FIW Dec 2007 FIW Mar 2008 FIW Mar 2009
Lean Events Targeting Each Step in the Clinic Value Stream
Standard Work creates a
foundation to build on
RPI Jun 2008 RPI Mar 2009
RPI Sep 2008
Source: Jefferson Healthcare
FIW = Focused Improvement Workshop
McManus – Lean Healthcare – March 2012 – © LAI EdNet 67
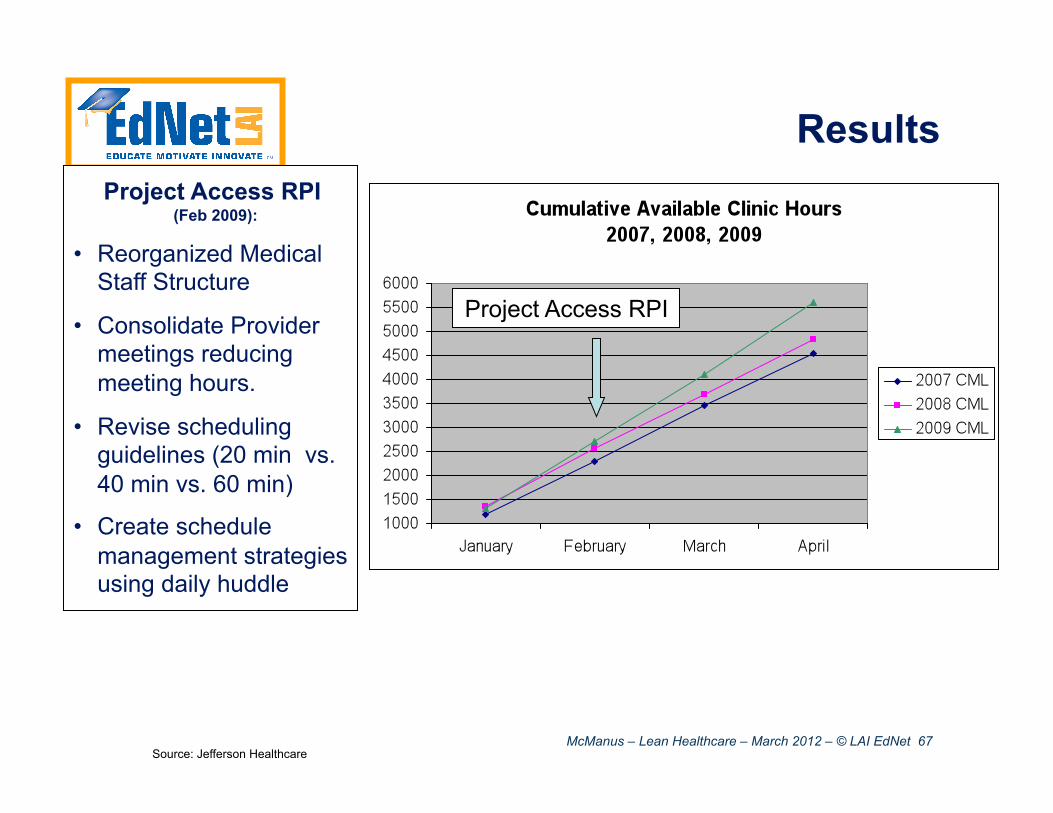
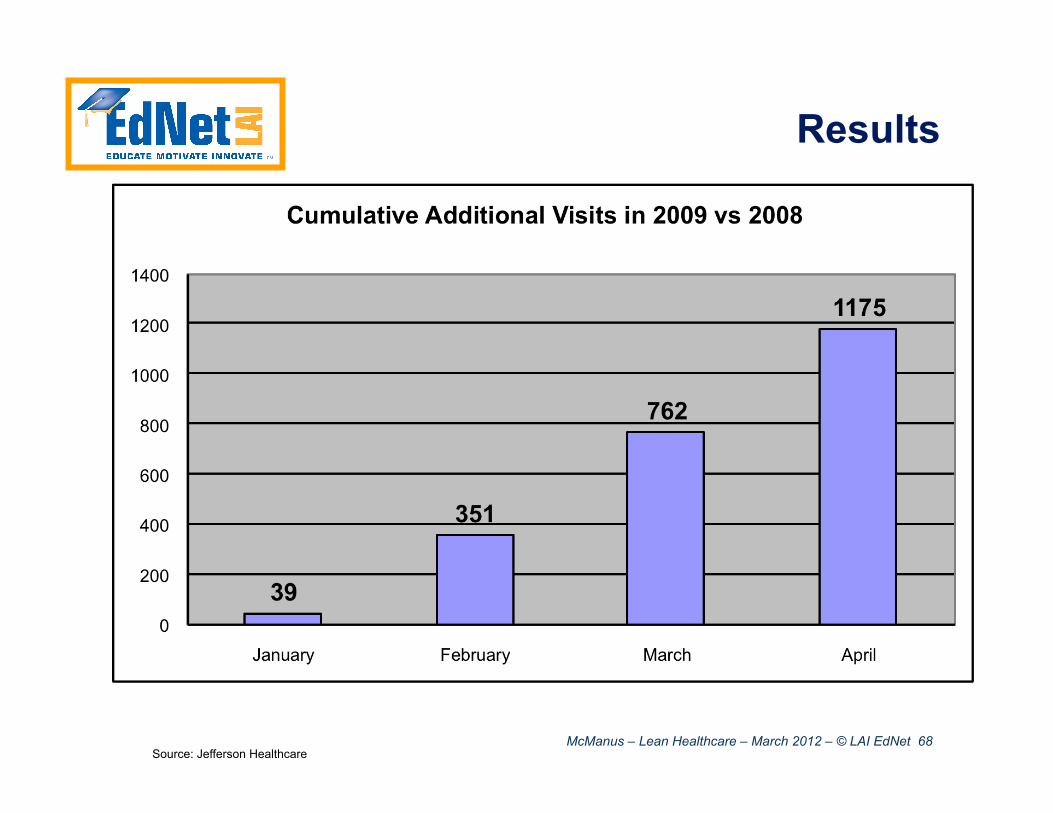
Results Project Access RPI
(Feb 2009):
• Reorganized Medical Staff Structure
• Consolidate Provider meetings reducing meeting hours.
• Revise scheduling guidelines (20 min vs. 40 min vs. 60 min)
• Create schedule management strategies using daily huddle
Project Access RPI
Source: Jefferson Healthcare
McManus – Lean Healthcare – March 2012 – © LAI EdNet 68
Results
Source: Jefferson Healthcare
McManus – Lean Healthcare – March 2012 – © LAI EdNet 69
• Lean has been successfully applied to Healthcare processes
• Little projects can provide dramatic (local) improvements
• Consistent reduction of complexity and variation across the value stream provides significant overall performance gains
McManus – Lean Healthcare – March 2012 – © LAI EdNet 70
What affects the bottom line? Jury is out, but a PD analog exists…
• LAI / McKinsey study* • 300 subjects, 28 companies • what PD practices correlated with project success?
• High performing companies consistently did better on a variety of metrics
• High performing companies tended to employ a lot of advanced PD practices
• No “silver bullet” practice, but a few correlated particularly strongly with success
*Mike Gordon, Chris Musso, Eric Rebentisch, and Nisheeth Gupta, The Path to Developing Successful New Products, WSJ, November 30, 2009
McManus – Lean Healthcare – March 2012 – © LAI EdNet 71
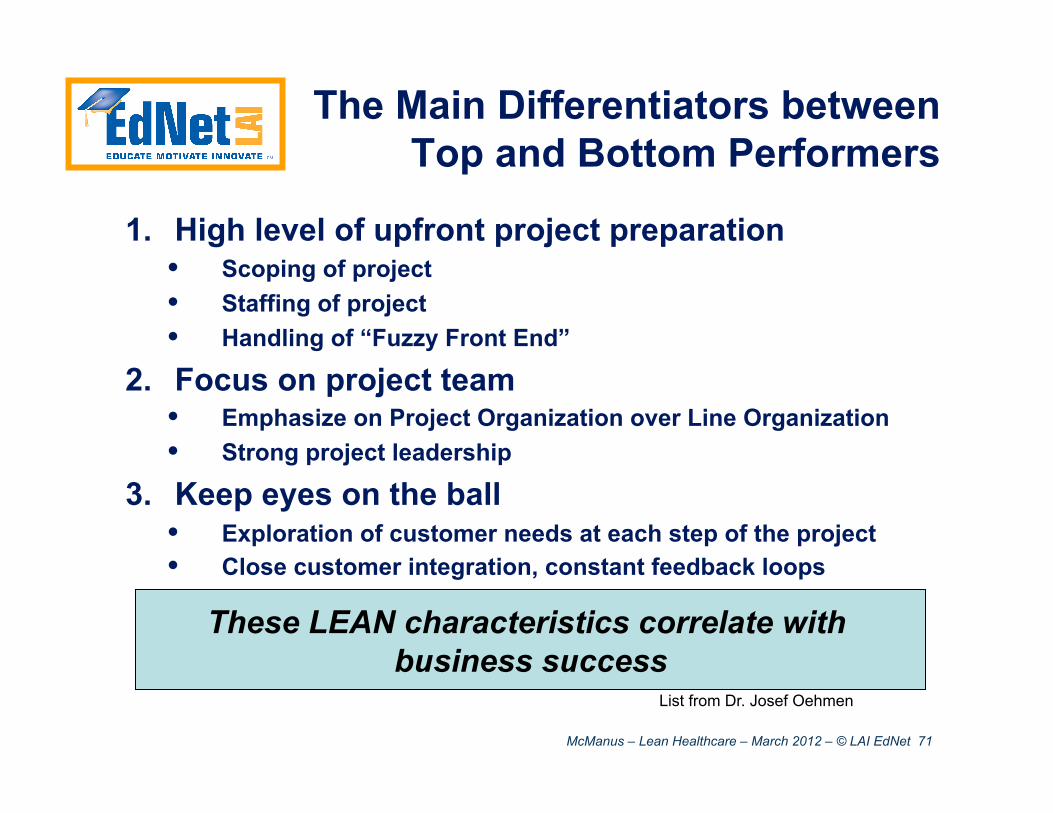
The Main Differentiators between Top and Bottom Performers
1. High level of upfront project preparation • Scoping of project • Staffing of project • Handling of “Fuzzy Front End”
2. Focus on project team • Emphasize on Project Organization over Line Organization • Strong project leadership
3. Keep eyes on the ball • Exploration of customer needs at each step of the project • Close customer integration, constant feedback loops
List from Dr. Josef Oehmen
These LEAN characteristics correlate with business success
McManus – Lean Healthcare – March 2012 – © LAI EdNet 72
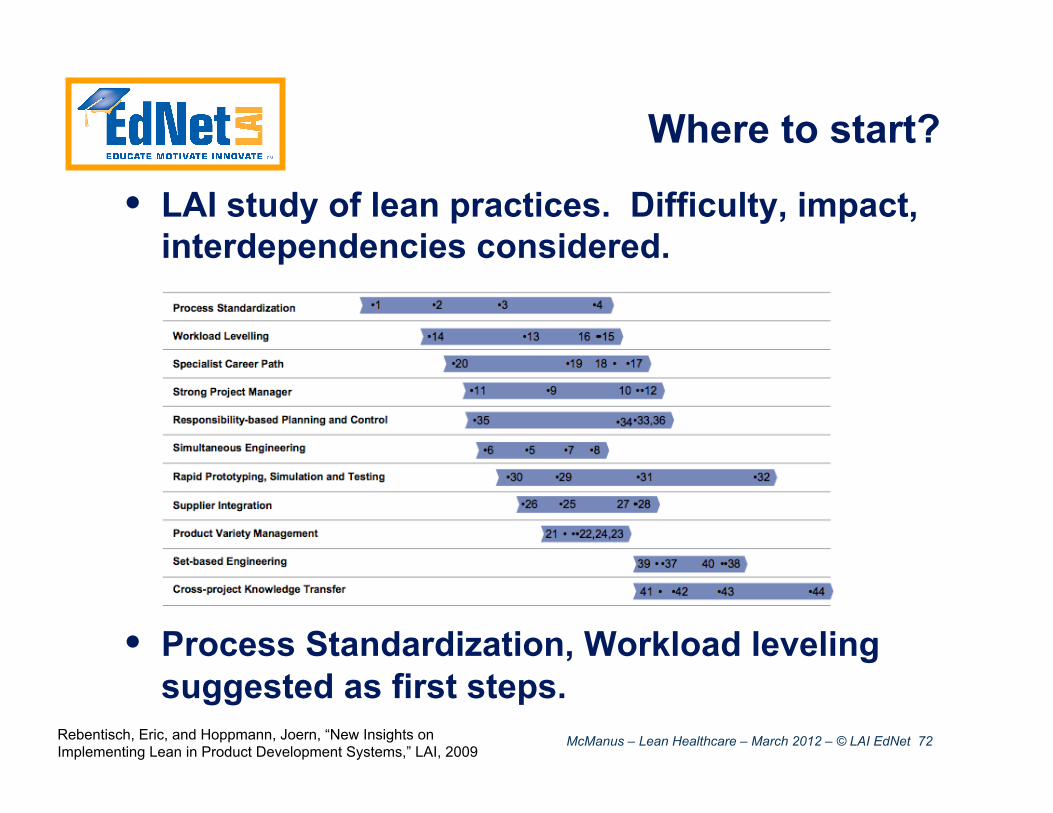
Where to start?
• LAI study of lean practices. Difficulty, impact, interdependencies considered.
• Process Standardization, Workload leveling suggested as first steps.
Rebentisch, Eric, and Hoppmann, Joern, “New Insights on Implementing Lean in Product Development Systems,” LAI, 2009
McManus – Lean Healthcare – March 2012 – © LAI EdNet 73
Wrapup
• Lean does apply to Healthcare • There is plenty of waste to be found • The Value, Value Stream, Flow, Pull, Perfection model works
(roughly in order) • Tools must be selected and customized base on your needs
• Variation and Complexity challenge traditional application of lean (but not the concepts) • Reduce Muri (overburden) and Mura (variation) as well as static
wastes • Don’t monetize modest savings – apply them across the value
stream to improve system performance
Lean does not tell you how to treat patients – it frees you to do it more and better
McManus – Lean Healthcare – March 2012 – © LAI EdNet 74
Acknowledgements
• The LAI EdNet Lean Healthcare Team: • Prof. Earll Murman, Prof. Annalisa Weigel, and Jackie Candido • Prof. Sharon Johnson (WPI) • Prof. Deanna Willis, MD (U Indiana), • Whitney Walters (UM Health System) • Prof. Barrett Thomson (U Iowa) • Prof. Steve Shade (Perdue)
• Mark Graban, MD (author, Lean Hospitals) • Eric Dickson, MD (President, UMass Memorial Medical) • The MIT Lean Advancement Initiative and its
Educational Network, partial sponsors of this work
QUESTIONS?
McManus – Lean Healthcare – March 2012 – © LAI EdNet 75
References • Womack, Jones, and Roos, The Machine that Changed the World, The Free Press, 1990 • Womack, J. and Jones, D., Lean Thinking, Simon & Shuster, New York, 1996 • Murman, E. et al., Lean Enterprise Value: Insights from MIT’s Lean Aerospace Initiative, Palgrave, 2002 • McManus, H., “Product Development Value Stream Mapping Manual V1.0,” Lean Advancement Initiative,
2005 http://lean.mit.edu/products/product-development-value-stream-mapping-pdvsm-manual.html • Jimmerson, C., Value Stream Mapping for Healthcare Made Easy, Productivity Press, New York, NY, 2010 • Mascitelli, Ronald, Building a Project-Driven Enterprise, Technology Perspectives, 2002 • Oppenheim, Bohdan W., “Lean Product Development Flow,” Systems Engineering, Vol. 7 No. 4, Oct. 2004 • Reinertsen, Donald G., The Principles of Product Development Flow: Second Generation Lean Product
Development, Celeritas Publishing, 2009 • Graban, Mark, Lean Hospitals: Improving Quality, Patient Safety, and Employee Satisfaction, Productivity
Press, 2009 • John Toussaint, On the Mend: Revolutionizing Healthcare to Save Lives and Transform the Industry, Lean
Enterprise Institute, 2010 • Gawande, A., The Checklist Manifesto: How to Get Things Right, Metropolitan Books, 2010 • Mike Gordon, Chris Musso, Eric Rebentisch, and Nisheeth Gupta, The Path to Developing Successful New
Products, WSJ, November 30, 2009 http://online.wsj.com/article/SB10001424052970203440104574400593760720388.html
• Rebentisch, Eric, and Hoppmann, Joern, “New Insights on Implementing Lean in Product Development Systems,” LAI, 2009 http://lean.mit.edu/docman/download-document/2765-new-insights-on-implementing-lean-in-product-development-systems.html