Embed Size (px)
Citation preview

APPLICATION OF MCKINSEY 7s MODEL APPROACH IN EFFECTIVE
MONITORING OF REVENUE COLLECTION IN TRA: CASE STUDY OF
KINONDONI MUNICIPALITY
REMIGIUS LIBENTH
A DISSERTATION SUBMITED IN PARTIAL FULFILMENT OF THE
REQUIREMENT FOR THE MASTERS OF ARTS IN MONITORING AND
EVALUATION OF THE OPEN UNIVERSITY OF TANZANIA
2017
ii
CERTIFICATION
The undersigned certifies that has read and hereby recommends for the acceptance of
this dissertation titled; “Application of Mckinsey 7s Models Approach in Effective
Monitoring of Revenue Collection in TRA: Case of Kinondoni municipality” in a
partial fulfillment of requirements for the degree of masters of Arts in Monitoring
and evaluation of the Open University of Tanzania.
…………………………………
Dr. Raphael Gwahula
(Supervisor)
……………………………..
Date
iii
COPYRIGHT
No part of this dissertation may be reproduced, stored in any retrieval system, or
transmitted in any form by means, electronic, mechanical, photocopying, recording
or otherwise without prior written permission of the author or the open university of
Tanzania in that behalf.

iv
DECLARATION
I, Remigius Libenth, do hereby declare that this dissertation is my own original and
that is has not been presented to any other university for similar or any other degree
award.
……………………………………
Signature
……………………………….
Date

v
DEDICATION
I dedicate this work to my mother in law Martha Chailla Kamuhabwa for her untiring
effort in this dissertation work. That effort went into it to the most understanding and
caring people I know.
When times are good they make me laugh uncontrollably. When times are tough the
smile doesn’t leave my face because of the unconditional love and joy they bring to
my heart.

vi
ACKNOWLEDGEMENTS
At last, the battle is over by the grace of almighty God, the creator of heavens and
earth. To him be glory honor and adoration for mentoring this Dissertation, I am
deeply grateful to my supervisor Dr. Raphael Gwahula for his guidance, inspiration
and encouragement throughout this dissertation. His encyclopedia, knowledge and
attitude towards research, patience in mentoring me have a great contribution to the
completion of this dissertation. I will be always indebted him for his encouragement
and his adverse.
I am deeply grateful to Mr. Zakayo Zachalia for his assistance in one way around and
class mate for their concern and assistance and support, I am indebted to Mr. Dunia
Yusuph for his constructive advice and Internet support. My appreciation goes to my
mother in law Martha Chailla Kamuhabwa for her strongly support of attention,
concern, prayers, place and puny.
Finally, and vital I would like to thank my parents, Mr. L. A. Muzoni, Josephine
Nyamwiza and Mr. & Mrs. Prof. A. R. Kamuhabwa’s who have always been the
foundation of my life. The contribution of my family has been immeasurable. All of
them make my effort worthwhile. May the almighty God richly bless you all.
vii
ABSTRACT
This study provides a theoretical analysis to determine application of Mckinsey 7s
model Approach in effective monitoring of revenue collection in TRA: Case of
Kinondoni municipality. The study was justified based on the fact that effective
monitoring on revenue collection in TRA; through application of 7’s models
approach. Survey population of 78. A sample of 65 was drawn. CI, 95%, ME, 5%.
Primary and secondary data has been used. To study relations between variables
independent and dependent multiple linear regression model were used. Descriptive
statistics were analyzed by SPSS. Theories that were used Mckinsey 7s models
Approach and System theory. Questionnaires administered to sixty five (65) to TRA
employee responded (62). Findings on the Factors that influence effective monitoring
on revenue collection in TRA starting with 7s only three variables which are
statistically significant over the other four variables at the 95% level. Challenges
facing effective monitoring on revenue collection in TRA through application of
Mckinsey7s models Approach, 53.22% of the respondents agreed, 11.29% strongly
agreed, 16.12% undecided, 12.90% and 6.45% were disagreed and strongly
disagreed. Conclusion, the fundamental issues to be addressed in the context of
effective monitoring on revenue collection are to reach the design of current revenue
organization and to strengthen TRA management. 7s models is valuable tool to
initiate changes processes and to give the direction. Recommendation, There is the
need of putting more emphasize on effective monitoring on revenue collection
through all cycle of the organization has been screened on 7s Mckinsey models
approach such as Strategy, structure, system, skills, style and shared values.

viii
TABLE OF CONTENTS
CERTIFICATION ................................................................................................. ii
COPYRIGHT........................................................................................................ iii
DECLARATION .................................................................................................. iv
DEDICATION ....................................................................................................... v
ACKNOWLEDGEMENTS .................................................................................. vi
ABSTRACT ......................................................................................................... vii
TABLE OF CONTENTS .................................................................................... viii
LIST OF TABLES ................................................................................................ xi
LIST OF FIGURES ............................................................................................. xii
LIST OF ABBREVIATIONS ............................................................................. xiii
CHAPTER ONE .................................................................................................... 1
1.0 INTRODUCTION ............................................................................................ 1
1.1 Background to the Study .................................................................................... 1
1.3 Statement of the Problem ................................................................................... 7
1.4 Objectives of the Study ...................................................................................... 8
1.5 Specific Objectives ............................................................................................ 8
1.6 Research Questions ............................................................................................ 9
1.7 Research Hypothesis .......................................................................................... 9
1.8 Significance of the Study ................................................................................... 9
1.9 Scope of the Study ........................................................................................... 10
CHAPTER TWO ................................................................................................. 11
2.0 LITERATURE REVIEW .............................................................................. 11
2.1 Chapter Overview ............................................................................................ 11
ix
2.2 Definition of Key Terms .................................................................................. 11
2.3 Effective Monitoring Revenue Collection System ............................................ 12
2.4 Revenue Power of an Individual ....................................................................... 13
2.5 The Ability of Government in Revenue Collection ........................................... 13
2.6 Theory or the McKinsey 7s Model Approach ................................................... 14
2.7 Systems Theory................................................................................................ 17
2.8 Top-Down and Bottom-Up Theories of Perception ........................................... 17
2.8 Empirical Studies ............................................................................................. 18
2.10 Gap in Knowledge ......................................................................................... 22
2.11 Conceptual Framework/Conceptual Model for the Study Topic ...................... 22
CHAPTER THREE ............................................................................................. 24
3.0 METHODOLOGY AND APPROACH TO THE STUDY ........................... 24
3.1 Chapter Overview ............................................................................................ 24
3.2 Research Design............................................................................................... 24
3.3 Sources of Data ................................................................................................ 24
3.4 Target Population ............................................................................................. 25
3.4.1 Area and Population ..................................................................................... 25
3.5 Sampling Method ............................................................................................. 26
3.6 Model Specification ......................................................................................... 26
3.6.1. Justification for Variables Selection ............................................................. 29
3.6.2. Hypothesis ................................................................................................... 30
3.7 Data Collection Tool ........................................................................................ 30
3.8 Data Analysis ................................................................................................... 30
CHAPTER FOUR................................................................................................ 31

x
4.0 FINDINGS AND DISCUSSION .................................................................... 31
4.1 Chapter Overview ............................................................................................ 31
4.2 Demographic Information ................................................................................ 32
4.2.1 Gender of Responds ...................................................................................... 32
4.1.2 Education Level of Employees ...................................................................... 32
4.3 Experience of Employees ................................................................................. 33
4.4 Regional Revenue Comparison ........................................................................ 47
4.5 Testing the Assumption of Multiple Linear Regression Model ......................... 48
4.7 Checking Linearity between Dependent and Independent variables .................. 49
4.8 Test of Homoscedasticity Assumptions ............................................................ 52
4.9 Regression Analysis ......................................................................................... 52
CHAPTER FIVE ................................................................................................. 54
5.0 CONCLUSION .............................................................................................. 54
5.1 Summary.......................................................................................................... 54
5.2 Policy Implications .......................................................................................... 56
5.3 Recommendations ............................................................................................ 57
5.4 Suggestion for Further Research Study ............................................................. 61
REFERENCES .................................................................................................... 62
APPENDICES ...................................................................................................... 67
xi
LIST OF TABLES
Table 4.1: Tolerance and the Variance Inflating Factors ......................................... 49
Table 4.2: Test of Autocorrelation Assumption ..................................................... 50
Table 4.3: Test of Normality .................................................................................. 51
Table 4.4: ANOVA ................................................................................................ 52
Table 4.5: OLS Regression Results ........................................................................ 53
xii
LIST OF FIGURES
Figure 4.1: Respondents Gender Distribution ......................................................... 32
Figure 4.2: Level of Education ............................................................................... 33
Figure 4.3: Experience of Employees ..................................................................... 34
Figure 4.4: Importance of Effective Monitoring ..................................................... 34
Figure 4.5: Strategy ................................................................................................ 35
Figure 4.6: For Structure ........................................................................................ 36
Figure 4.7: For System ........................................................................................... 37
Figure 4.8: For Style .............................................................................................. 38
Figure 4.9: For Skills ............................................................................................. 38
Figure 4.10: For Staff ............................................................................................. 39
Figure 4.11: Shared Value ...................................................................................... 40
Fugire 4.12: Factors Needed to Ensure Effectiveness Monitoring ........................... 41
Figure 4.13: Challenges facing Effective Monitoring on Revenue ......................... 42
Figure 4.14: How Super Ordinate Goals shared Values Works? ............................. 43
Figure 4.15: Factors behind Success of Effectiveness Monitoring .......................... 44
Figure 1.16: Method Used to Collect Revenue in Kinondoni .................................. 45
Figure 4.17: Revenue Collected by TRA is Effectively Monitored ......................... 46
Figure 4.18: Improve effective Monitoring Mechanism in Management ................. 47
Figure 4.19: Regional Revenue Comparison .......................................................... 48

xiii
LIST OF ABBREVIATIONS
DTSC Dar es Salaam Tax Services Centre
EFDs Electronic Fiscal Devices
GDP Growth Domestic Product
GDP Gross Domestic Product
IT Information Technology
KPIs Key performance Indicators
RC Revenue collection
SKL Skills
SPSS Statistical Package for Social Sciences
ST Strategy
STF Staff
STL Style
STR Structure
SV Shared value
SYST System
TRA Tanzania Revenue Authority
TRAMED Tanzania Revenue Authority Monitoring Evaluation Database
VAT Value Added Tax
1
CHAPTER ONE
1.0 INTRODUCTION
1.1 Background to the Study
Revenue collection is the major source of government in revenues such as Tanzania.
Revenue collection is very necessary payment for which no service or value to be
rendered in compensation term. Revenue collection, Majority of revenue collection
in Tanzania is in form of tax revenues and TRA is a collector an executive agency
working under Finance ministry that was established in 1996.TRA is responsible to
collect major taxes including tax income, Value added tax, Import duty and excise
duty. It is the revenue charge imposed on individual or legal entity by the given
government. Revenue is the price we pay for dwelling in a civilized community/
society. Justice Wendell Holmes (1905).
Revenues are based on an arbitrary system of laws passed by Parliament and
interpreted by the judiciary and giving effect to what one must assume to be the
democratic will of the citizens (Akoto, 2001). Tanzania has had a taxation system
according to modern principles since the turn of the century. It was introduced by the
colonial European powers which took charge of the administration of the territory.
The first colonial administrators to introduce taxation were the Germans. They
introduced simple forms of direct taxes such as the hut and poll taxes. These were
introduced primarily to force the African population to participate in Tax Law in
Tanzania (Tanganyika) money economy and only incidentally to raise revenue. The
budgetary expenses of the colonial administration were mostly financed by grants
2
from the imperial government. However, the German period in Tanzania
(Tanganyika) did not have a lasting impact on the country’s legal institutions
including taxation. This is because they failed to establish effective control of the
territory. Between 1884 and 1891 the only German presence in colonial government
was established. But even then no effective control was achieved. Luoga (supra)
attempts an analysis of the Income Tax Act, 1973 in the light of its fairness to
taxpayers as well as its effectiveness monitoring as a socio-economic tool.
The Tanzania Revenue Authority (TRA) was established by Act of Parliament No.
11 of 1995, and started its operations on 1st July 1996. In carrying out its statutory
functions, TRA is regulated by law, and is responsible for administering impartially
various taxes of the Central Government. This edition of the Tanzania Revenue
Authority Act, Cap. 399 incorporate all amendments up to 30th November, 2006
and are printed under the authority of Section 4 of the Laws Revision Act, Cap.4. (J.
P. Mwanyika, Attorney General, 2006) Tax law enforcement strategies, Revenue
collection and administration improvements and effective tax system. www.tra.go.tz
Tanzania Revenue Authority has got four core departments namely Customs
and Excise, Domestic Revenue, Large Taxpayers and Tax Investigations.
Among them it is the Customs and Excise Department which deals with
Customs Administration.
The revenue comes from taxes that can be generated through households, land, and
other firms that consume the legal taxed those are things that are associated with tax
African governments and international development agencies increasingly
acknowledge that more effective monitoring tax systems are central for a sustainable

3
development because they can mobilize the domestic tax base as a key mechanism
for developing countries to escape aid or single resource dependency, reinforce
government legitimacy through promoting accountability of the government to
taxpaying citizens and good public financial management and achieve a fairer
sharing of the costs and benefits of globalization (Pretoria Communiqué 2008).
There is also a growing realization in Africa that taxation and state-building are
linked (Ayee et al 2010). The way revenue is raised significantly influences both
economic growth and democratic consolidation (Braütigam et al 2008; Moore 1998,
2004; OECD-DAC 2006). In this perspective, the effectiveness monitoring tax
system may contribute to improved governance through main channels (Moore 2008;
Fjeldstad and Moore 2008). Bargaining over taxes is central to building relations of
accountability between the state and citizens based on mutual rights and obligations,
rather than on patronage and coercions.
Taxpayers’ mobilization around common interests has potentially positive outcomes
for governance. This idea of bargaining and negotiation over taxes is central to the
concept of a social fiscal contract: a pattern monitoring of regular and routine
accountability based on the principle of reciprocity and mutual obligations. This is
essentially about stimulating good governance at the interface between state and
society, in response to the demands of citizens. A.J.Mtasiwa, (2013). Revenue
collected is useful in in providing all citizen needs and demand in a given
government. Government is so serious with revenue collections. A ‘virtuous circle’
may be generated whereby the generation of government revenues leads to improved
service provision, which in turn increases citizens’ willingness to pay their taxes. It is
4
also about politics and power -the way that authority is exercised in a country
through its formal and informal institutions. Common interest processes which
ensure that governments have stronger incentives to promote economic growth since
they are dependent on taxes and therefore on the prosperity of taxpayers.
State capacity processes which require states to develop a bureaucratic apparatus for
revenue collection because of their dependence on taxes, particularly, direct ones.
This is likely also to lead to broader improvements in public administration. The
organization which collct the highest amount of revenues from the existing sources
in fastest time and in balanced costs is always regarded as an efficient an
organization. And this can be done when the organization revenue collection system
is in side of monitoring protocol since the scientific attitudes towards whatever seen
under the category of revenue collection. Samici, (1999)
How effective monitoring is in revenue collection, is a matter of concern of regional
managers and public relation regional Officer to go on electronic and print media to
explain factual issues regarding revenue collection to the public. This is an attempt to
educate the public to discourage egoistic comments, provide a holistic approach to
tax, reduce administrative and revenue compliances, costs and provide soundly better
services to tax payers. It is also to promote effectiveness collections of revenue and
equitable distribution of revenue burden and ensure transparency, integrity and also
cooperate with law enforcement agencies. The critical success factor of the revenue
collections division is the major revenue collection centres (Vochl, 1992). Institution,
Individuals needs to be treated in respect care and gignity. And also revenue

5
collection division should be considered for satisfaction of core business of revenue
collection. It is a set of momentary emotional responses affected by the gap between
expected and perceived outcome by the concerned parties (Parasuraman & Zeithaml,
1985). Therefore effectiveness monitoring should follow established protocols, be
statistically valid, generate quantifiable data, and produce results that, when tested,
are repeatable.
TRA aims to “Increase domestic revenue through enhancement of voluntary Tax
compliance” by the 2013/14-2017/18 period of the implementation of the fourth
Corporate Plan, to increase from the current 61% to 70% by June 2018. In view of
the foregoing, tax revenue collection projections using the rebased GDP data for the
revised CP4 are set to increase from Tsh. 9.4 trillion in 2013/14 to Tsh. 16.4 trillion
in 2017/18 equivalent to an increase of 74.7% during the five year period. Revenue
yield on the other hand will increase from 12.5% in 2013/14 to 13.9% in 2017/18. As
stipulated in the TRAs Vision which considers a modernized administration system
as one that has a strong enforcement capacity delivered by highly qualified,
motivated and committed staff. (TRA) Corporate plan (2013/14-2017/18) pg.15.
TRA mission are “We make it easy to pay tax and make lives better” TRA believes
that it is possible to mobilize revenue in a simplified and transparent manner and
taxpayers shall have easy access to services that are offered promptly. In return
compliance increases shall be realized with more revenue for the Government to
provide adequate and quality social services. (TRA) Corporate plan (2013/14-
2017/18) pg.15
6
Effectiveness Monitoring: Monitoring of inputs and activities generally takes place
at a more disaggregated level indicators to be monitored include Strategic
Performance, Key Performance Indicators and Perception Indicators. These
indicators will be monitored to enable TRA have a view of the state of affairs on plan
execution and comprehend the degree of achievement of TRA objectives at a
particular point in time. Key Performance Indicators (KPIs) the nature and scope of
operations and effectiveness of TRA. The information for the KPIs is gathered from
operational data using the existing transactional and analytical systems for Tax
Administration, Customs and other support functions.
Provision of High Quality and Responsive Customer Services: This goal will be
achieved to a great extent through implementation of service delivery initiatives
which include: Implementation of Quality Management System and ultimate,
Establishment of Dar-es-Salaam Tax Service Centers (DTSC) and Taxpayer Call
Centre, Enhancement of trade facilitation through implementation of the Time.
Promote Voluntary Tax Compliance: To ensure that, it is a fair and competent tax
administration, TRA developed effective enforcement coupled with taxpayer service
and education programs that promote voluntary tax compliance which include:
Introduction of Electronic Fiscal Devices (EFDs) and enhancement of the Block
Management System which has increased taxpayer registration.
Enhancement of Staff Performance Management Systems: This goal focuses on
ensuring that TRA retains qualified, skilled and motivated staff with high integrity to
be able to conduct business in a modern environment. The main achievements in this
7
goal include: Implementation of Staff Performance Appraisal System that
incorporates Balanced Score Card perspectives and introduction of an integrated
system to Facilitate Up-to-Date Human resource data (ARUTI), Implementation of
TRA Monitoring and Evaluation Database (TRAMED), strengthening of the Institute
of Tax Administration and Strengthening of the Internal Affairs Unit to address
ethical issues.
1.3 Statement of the Problem
TRA in Kinondoni municipality has been facing various challenging issues which
make it not to attain the targeted plan for example in 2016/2017 the target was
19,012,844,999 with the actual revenue being Tsh 16,101,569,981 (equivalent to
91.6%) or a difference of Tsh. 2,430,039,100 deficit. The general objective was to
determine effective monitoring on revenue collection in TRA; through Application
of 7s models Approach: Case of Kinondoni municipality.
To maximize the intended revenue collection for the government it is vital to the
revenue collector agencies to be effective in monitoring on how and who so that to
satisfy the public and target to be meant. It is the government policy to increase
revenue collections at a faster rate than GDP growth. In order to finance increase
expenditure and reduce dependence on donors funding in the budget. The
government is also committed to tax policy that does not hinder growth in business
and investment that is equitable and far, that has minimum compliance and
administrative costs and that is simple as possible. In that case that we need more
revenue collection so that we should not depend on donors Strictly we need to put
more emphases on effective monitoring based on strategy, structure, system, staff,

8
style and skills that will influence revenue collection as targeted. The level of
revenue collection should be determined by the level of economic activity of a given
area (James & Alley, 2001). The growth of revenue collection in this area should
correspond with the growth in development activities in revenue collection. The
actual revenue collection has different angle greatly as compared to the potential
revenue (Kinondoni regional tax Office, 2014/15). This trend has created a gap in
revenue collection performance in Kinondoni municipality. In the light of
developments, this study seeks to examine effectiveness monitoring on revenue
collection in TRA: case of Kinondoni municipality. Campo (2007) acknowledged
that it takes time to build an effective monitoring system, noting that strengthening of
institutions and learning from mistakes plays a vital role. Effective monitoring has
something vital to do with revenue collection and performance management tool.
1.4 Objectives of the Study
The main objective of the study is to determine Application of Mckinsey 7s Models
Approach in Effective Monitoring of Revenue Collection in TRA: Case of
Kinondoni Municipality.
1.5 Specific Objectives
Specifically, the study will attempt to:
i. Determine the factors that influence effective monitoring on revenue
collection.
ii. Determine the measures needed to ensure effective monitoring on revenue
collection.
iii. Examine the challenges facing effective monitoring on revenue collection.

9
1.6 Research Questions
The study was seeking to address the following research questions;
i. What are factors that influence effective monitoring on revenue collection.
ii. What factors needed to ensure effective monitoring on revenue collection.
iii. What are challenges facing effective monitoring on revenue collection.
1.7 Research Hypothesis
Ho: There is no significant relationship between the effectiveness monitoring and
revenue collection in TRA; through application of 7s models approach.
H1: There is significant relationship between the effectiveness monitoring and
revenue collection in TRA; through application of 7s models approach.
1.8 Significance of the Study
Many studies have been conducted on effectiveness revenue collection but very few
have focused on effectiveness monitoring on revenue collection aspect in Kinondoni
through application of 7s models approach. The findings of this study aimed at to
develop a new knowledge which that will add new concept to the existing literature
on revenue collection in Kinondoni municipality. Also research findings will assist
the decision makers to understand the strength and weakness which are related to
challenges of revenue collection. It is also planned that this study was potentially
open up new directions that will assist in future research. The study was presented an
opportunity to analyses and see revenue collection with special focus on procedures,
systems, staff, style, structure, skills/competence, training, measures and remedies
used by other researchers in performance levels basically on planners and researcher
during taxation planning for increasing government revenue collection.

10
1.9 Scope of the Study
The study was carried out at TRA Kinondoni municipality in Dar es Salaam. The
targeted population was a sample of TRA employee.

11
CHAPTER TWO
2.0 LITERATURE REVIEW
2.1 Chapter Overview
This chapter presents a review of existing literature related to the research problem.
For the purpose of the review, the chapter is divided into the following ways:
Definition of key terms, Effective monitoring revenue collection system, Revenue
power of individuals and the community to pay taxes in effectively manner, The
ability of government in effectively revenue collection, Mckinsey 7s Model
Approach theory, System theory, Top down and bottom up theories of perception,
Empirical studies, Gap in knowledge and Conceptual framework.
2.2 Definition of Key Terms
Effectiveness in this study is defined as “a criterion according to which an alternative
is recommended if it results in the achievement of a valued outcome (Fox & Meyer,
2005:41). In particular it refers to a condition in which a focal organization, using a
finite amount of resources, is able to achieve stated objectives as measured by a
given set of criteria, and the extent to which a program is achieving or failing to
achieve stated objectives (; Gerber, Nel & Van Dyk, 1998:19-20; Fox & Meyer,
2005:41; Gray & Manson, 2005:565; Torrington, Hall & Tailor, 2005:753-767).
“Effectiveness” is a factor that concerns “the level of achievement of the objectives,
“whereby services are provided based on an accurate assessment of citizens’ needs
and the local context (Jibao, 2009). Monitoring: Monitoring is the regular
observation and recording of activities taking place in a project or programme. It is a

12
process of routinely gathering information on all aspects of the project. To monitor is
to check on how project activities are progressing. It is observation; ─ systematic and
purposeful observation. Monitoring also involves giving feedback about the progress
of the project to the implementers and beneficiaries of the project. Reporting enables
the gathered information to be used in making decisions for improving project
performance. Loudes Sada (1967, 1987, 2007). Effectiveness Monitoring:
Effectiveness monitoring is an avenue to determine what restoration actions are
working and where refinements to restoration actions may be needed. Effectiveness
monitoring can play a key role in demonstrating the accountability, success, and
value of restoration in revenue collection. Effectiveness monitoring is designed to
determine if TRA is effective at meeting its target and economic objectives.
Effectiveness monitoring should follow established protocols, be statistically valid,
generate quantifiable data, and produce results that, when tested, are repeatable.
Government Finance Officers Association of the United States and Canada (2017).
Tax Revenue: Tax revenue is defined as the revenues collected from different
sources such as income and profits, social security contribution, tax levied on goods
and services, payroll taxes on ownership and transfer of property and other taxes.
OECD, (2017)
2.3 Effective Monitoring Revenue Collection System
Being effective is about doing right things and relating them into input and what
many organizations do. To be efficient one must therefore attend the input
requirements of the revenue collection so that can be clarified in terms of objective,
planning, direction and control. Mullins, (2008).

13
Personality which is extraversion or introversion, agreeableness, conscientiousness,
emotional stability or instability, openness or close-mindedness is powerful to
determine organizations effectiveness. Friedman &Rosenman, (1988, 2003)
Effectiveness is more important than efficiency because one must be doing the right
kind of work, only then does it matter whether the work is done efficiently.
Effectiveness is measured by Actual Output divided by Expected output multiplied
by one hundred. Stewart (1985)
2.4 Revenue Power of an Individual
The effective factors in the power of individual are determined by two sets of factors
which are structure and volitional. The main structural factors are effective on the
ability of individuals in payment this include the level of per capital income of
income of economic texture of the society and the significance of the various kind of
development activities as well as the macroeconomic policies adopted by the
government. The effective volitional factors which influence the ability of
individuals and the society in revenue matters those include the level of development
of a culture of a given government; the position that public opinion holds about the
revenue system, the altitude of the citizens towards the government that may be
influenced by the quality of public services and the way of allocation of the tax
revenue and expending it on providing the requirements of the people would
effectively influences the payment of revenues. Yayra, (2011)
2.5 The Ability of Government in Revenue Collection
Includes enactment of appropriate revenue laws, accessibility of revenue bases, tax
rates, number of revenue sources and the executive expenditure of domestic revenue

14
collection. The ability of government in revenue collection depends not only on
structural factors but also on official factors. The low level of revenue collection
depends on the fact that the tax laws are not carried out properly and perfectly.(
Nikehehreh, 2005, Yayra, 2011) In this study preferably will use the following
theory or the Mckinsey 7s model approach wich will be based on the following
relationship collective work: Structure, Strategy, System, Skills, Style, Staff and
Shared value in revenue collection.
The Linear Regression Model: The multiple linear regression models will be used
to study the relationship between a dependent variable and one or more independent
variables. (Application of Mckinsey 7s model approach in effective monitoring of
revenue collection in TRA) Wooldridge .J.M (2003)
2.6 Theory or the McKinsey 7s Model Approach
A number of theories are applied here to review the study of revenue collection in
terms of effective monitoring. The Mckinsey 7s model approach; System theory and
Top to down theory are among of theories applied to determine effective revenue
collection. In the context of this study Mckinsey 7s model is applicable. The
Mckinsey 7s framework is a management model developed by Robert H. Waterman.
Jr. and Tom Peters in the 1980s on organization effectiveness. The 7s are strategy,
structure, system, skills, style, staff and shared values. This model is based on the
theory that for organization to perform well. These seven factors needs to be aligned
and mutually reinforcing so that model are in a position to help and identify what is
needed to be realigned to improve performance in the revenue collection process.
15
The way the model is presented in figure one below depicts the interdependency of
the elements and indicates how a change in one affects all the others.
Figure 2.1: McKinsey 7s Model
Source: Peters (1980), Stace and Dunphy (2001) and Chapman (2002).
The 7s are justified as follows:
Strategy: the plan devised to maintain and buildup competitive advantage and other
achievement to the maximum target. Strategy also means that action that an
institution plans in a response to or anticipation of changes in its external
environment –its customer. Strategy is obviously a central concern in much
development situations. (Alfred D. Chandler, Jr, 1980, Yayra 2011). Revenue
collection, the application of tax laws through the use of collection manual is
considered to be the best strategy. However, whether this strategy is effectively
applied is a matter of concern.
16
Structure: this indicates the way the organization is structured and who reports to
whom. The basic theory underlying structure is simple. Structure divides tasks and
then provides coordination.
Systems: the daily activities and procedures that staff members engage in to get the
domestic revenue collection done. The administrative systems where vital areas that
can bring in domestic revenue collection. McKinsey, Yayra (2011)
Shared Values: called ‘super ordinate goals’ when the model is developed, these are
the core values of the organization that are evidenced in the corporate culture and the
general work ethic. The core values of the authority are integrity, fairness, teamwork,
innovation and professionalism. Whether these values are working in the office
under investigation is a great concern.
Style: the style of leadership adopted. The leadership style adopted in any
organization has direct impact on performance. Friedman & Rosenman, (2009).
Staff: the general capability and employee, The capabilities depends on several
factors like qualifications, experiences and motivation among others. Absence of any
of these may lead to ineffective.
Skills: the actual skills and competencies of the employees working for an
organization are also vital for effective performance.
The McKinsey 7Ss model is one that can be applied to almost any organizational or
team effectiveness. If something within an organization or team isn't working,
chances are there is inconsistency between some of the elements identified by this
classic model.
17
2.7 Systems Theory
Source: secondary (htt/p www.systemrun.net), (2017).
Systems theory provides that authority such as TRA is like other open systems which
of necessity engage in various modes of exchange with the environment (Katz and
Kahn, 1966). Systems theory emphasizes the considerations of the relationships
between organizations and its environment as well as what goes on within
organizations. The systems theory is mainly concerned with the problems of
relationships of structures and the constant attributes of objects (Katz & Kahn, 1966).
The fundamental idea in the central systems theory is the concept emergence and
interactions. (Sadowski, P.1999, Oso and Owen, 2009).
2.8 Top-Down and Bottom-Up Theories of Perception
Psychologists often distinguish between top-down and bottom-up approaches to
information-processing. In top-down approaches, knowledge or expectations are
used to guide processing. Bottom-up approaches, however, are more like the
structuralism approach, piecing together data until a bigger picture is arrived at. One
of the strongest advocates of a bottom-up approach was J.J. Gibson (1904-1980),
18
who articulated a theory of direct perception. This stated that the real world provided
sufficient contextual information for our visual systems to directly perceive what was
there, unmediated by the influence of higher cognitive processes. Gibson developed
the notion of affordances, referring to those aspects of objects or environments that
allow an individual to perform an action. Gibson's emphasis on the match between
individual and environment led him to refer to his approach as ecological. Most
psychologists now would argue that both bottoms-up and top-down processes are
involved in perception.
2.8 Empirical Studies
This section is providing a literature review on the empirical studies relevant to this
study. The aim is to capture what other researchers have done so as to establish the
gap or to use their findings as inputs to the current study. To achieve these aims, the
literature review governed by the research objectives and research questions of this
study. The empirical study is focusing into determining the effective monitoring on
revenue collection in TRA; through Application of 7s models Approach: Case of
Kinondoni municipality.
Academic studies was taken with the intention of generating new knowledge, and the
knowledge may take many forms which include new problem solving method to
improve practice, the discovery and exploration of new organizational and
other phenomena about which there is limited or no knowledge at all (Swanson,
2000:274, Calvert & Martin, 2001:11-12, Dooley, 2002:338, Lynham, 2002:222;
Gray, Iles & Watson, 2010:4). Welman and Kruger (1999:11& 17) explain
theory as imbedded in the historical development of revenue collection and
19
principles as a set of interconnected related constructs or concept. The definition
and proposition that represent a methodical view of phenomena by stipulating
relationships that exists among variables with the purpose of explaining and
predicting phenomena that is prevalent, and they explain the new ways of
understanding the aspects that surround them (Swanson, 2000:274, Calvert & Martin,
2001:11-12, Hofstee, 2006:130, Zott, Amit, Massa, 2010:26). Within the historical
development and principles of revenue collection, there is an underling theory
that gives an explanation. Such explanation can either be general or specific, and
covers the events or occurrences that are prevailing at a particular point in time
(Swanson, 2000:274, Gray, Iles & Watson, 2010:4).
The 7s models approach illustrates the multiplicity interconnectedness of the factors
that define an organizations ability to change. The theory helps to change managers
thinking about how organization could be improved. It says that it is not just a matter
of devising a new strategy and following it through. Nor is it is a setting up new
systems and letting them generate improvement. To be effective organization must
have a high degree of fit or internal alignment among all 7s. All S’s must be
consistent with and reinforce the others S’s. All S’s are interrelated so as changes in
one has a ripple effect on all the others. It is impossible to make progress on one
without making progress on all. (Dagmar Recklies, 2001. Jack Welch, 2016) New
York. While some models of organizational effectiveness going in and out of
fashion, one that has persisted is the Mckinsey 7s framework. Developed in the early
1980s by Tom Peters and Robert Waterman, two consultants working at the
Mckinsey consulting firm the basic premises of model is that there are seven internal
20
aspect of an organization that needed to be aligned. It is to be successful. “Waterman
Jr, Robert H. Peter, Thomas J, and Julien R.P, 1980s” Developing countries differ
from industrial countries in revenue collection in financial indices. Developing
countries records lower indices terms of revenue on income and profits, social
security contributions, domestic taxes on goods and services and tax on international
trade.
(Prest, 2007 ) the level of revenue collection differs from one country to another the
level can be leivied at high level of sophistication in industrial countries may not be
an option in developing countries with low standards of administration for example
of unstable revenue can be found in most developing countries including Caribbean
and Bangladesh where that revenue can be most widened. It must be noted that no
income revenue system can be expected to work effectively un less there is a
situation of mutual respect between payer and collector as been emphases in the
context of Latin America.
Hart, (1970) Here, the vast majority of the research looks at effectiveness, usually
defined as the quantity or quality of services provided at the local level. Among the
quantitative studies, Kauneckis and Andersson (2009), for example, use a large
sample of municipalities from Brazil, Chile, Mexico and Peru to examine the
effective monitoring on resource management services. They find large variation in
the quality of service delivery among municipalities attributing it to variability in
institutional design as well as national and local incentive structures across countries
and local governments.
21
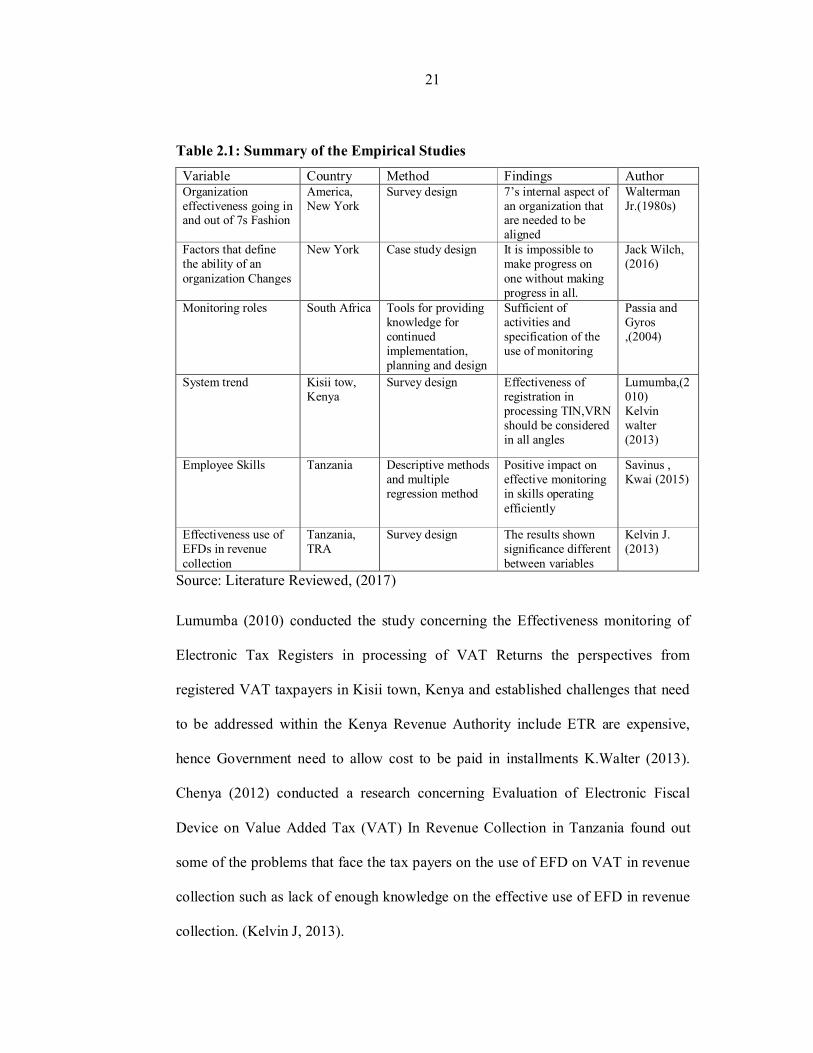
Table 2.1: Summary of the Empirical Studies
Variable Country Method Findings Author Organization effectiveness going in and out of 7s Fashion
America, New York
Survey design 7’s internal aspect of an organization that are needed to be aligned
Walterman Jr.(1980s)
Factors that define the ability of an organization Changes
New York Case study design It is impossible to make progress on one without making progress in all.
Jack Wilch, (2016)
Monitoring roles South Africa Tools for providing knowledge for continued implementation, planning and design
Sufficient of activities and specification of the use of monitoring
Passia and Gyros ,(2004)
System trend Kisii tow, Kenya
Survey design Effectiveness of registration in processing TIN,VRN should be considered in all angles
Lumumba,(2010) Kelvin walter (2013)
Employee Skills Tanzania Descriptive methods and multiple regression method
Positive impact on effective monitoring in skills operating efficiently
Savinus , Kwai (2015)
Effectiveness use of EFDs in revenue collection
Tanzania, TRA
Survey design The results shown significance different between variables
Kelvin J. (2013)
Source: Literature Reviewed, (2017)
Lumumba (2010) conducted the study concerning the Effectiveness monitoring of
Electronic Tax Registers in processing of VAT Returns the perspectives from
registered VAT taxpayers in Kisii town, Kenya and established challenges that need
to be addressed within the Kenya Revenue Authority include ETR are expensive,
hence Government need to allow cost to be paid in installments K.Walter (2013).
Chenya (2012) conducted a research concerning Evaluation of Electronic Fiscal
Device on Value Added Tax (VAT) In Revenue Collection in Tanzania found out
some of the problems that face the tax payers on the use of EFD on VAT in revenue
collection such as lack of enough knowledge on the effective use of EFD in revenue
collection. (Kelvin J, 2013).
22
2.10 Gap in Knowledge
From the reviewed literature theoretical, program and empirical sources, shows that
most of the studies have been conducted on the revenue collection in TRA based on
effectiveness. Further, the majority of the studies reviewed on revenue collection
focused on more effectiveness and not on to determine the factors that influence
effectiveness monitoring on revenue collection, determine the measures needed to
ensure effectiveness monitoring on revenue collection and determine challenges
facing effectiveness monitoring on revenue collection.
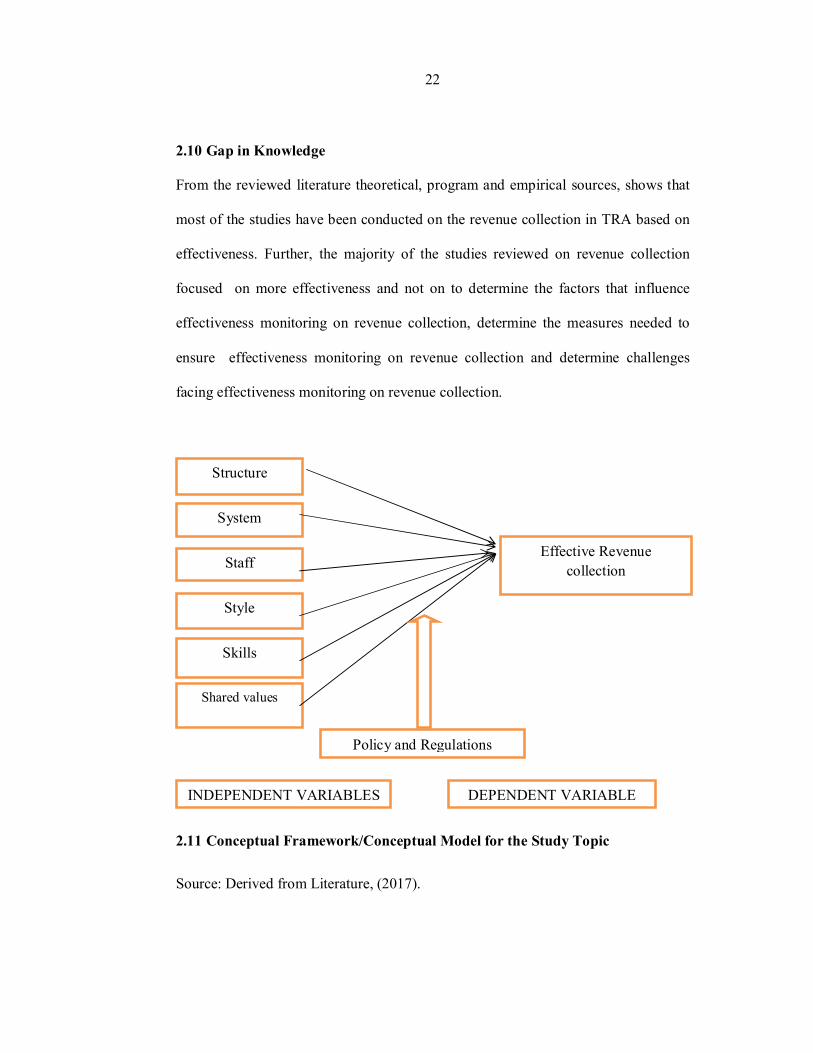
2.11 Conceptual Framework/Conceptual Model for the Study Topic
Source: Derived from Literature, (2017).
Structure
System
Staff
Style
Skills
Shared values
Effective Revenue collection
Policy and Regulations
INDEPENDENT VARIABLES DEPENDENT VARIABLE
23
The Conceptual Framework gives a depiction on how the variable related to one
another. The variable defined here are the independent, dependent and moderating
variable. An independent variable influences and determines the effect of another
variable .Mugenda 1999, Savinus H. 2003, Muiga 2015.
Independent variables: Independent variable is the variable that can be controlled and
manipulate while Dependent variables: A dependent variable is a variable to be
measured in the experiment or what is affected during the experiment. The change in
dependent variable is due to change in independent variable(s).It tries to show the
element that can contribute to effectiveness monitoring on revenue collection as
skills and culture, enough staffs, behavior of such staffs as well modern way to
conduct system and put it into practice, TRA management need more room of
concern in order to meet the target.

24
CHAPTER THREE
3.0 METHODOLOGY AND APPROACH TO THE STUDY
3.1 Chapter Overview
All scientific studies conducted are based on some underlying philosophical
assumptions in terms of what constitute a valid research. Research in common
phraseology refers to a search for knowledge. It is a scientific and methodological
search for appropriate information on a specific topic. This also have an impact on
which research methods are appropriate for the study and the resultant development
of knowledge in that given study. This chapter was dissected the research
methodologies, and the design strategies that are underpinning this research. The
study also presents the research methodologies and design that were used in the study
instruments, Population, sample size and sampling procedure, data collection and
data analysis.
3.2 Research Design
The study was conducted in Kinondoni municipality targeting Tanzania Revues
Authority offices in the district. Survey approach was employed to undertake the
study and thus the data were collected through survey questions conducted to TRA
employees. The study used a quantitative research design to tackle the specified
objectives as well as review of literature to support the quantitative findings.
3.3 Sources of Data
Data for the study was collected from both primary and secondary sources. The
administration of questionnaires forms the basis for primary data. Data collected
25
from this source were centered on the background characteristics of respondents.
Secondary data were gathered through different secondary sources such as reports
and data from TRA offices and website, different published and unpublished reports
and articles on related topic. Secondary data were used to support and consolidate
knowledge on the studied topic.
3.4 Target Population
3.4.1 Area and Population
TRA especially at Kinondoni municipality is the area which was taken as the area of
study. The area was considered due to some factors as been shown in multiple linear
regression models. The Municipality has a total area of 321 square kilometers.
According to the 2012 population Census, the Municipality had a population of
929,681 where male was 451,653 and female was 478,028 and projection of total
population of 1,134,211 in 2016 where by male are 551,019 and female 583,192 with
a growth rate of 5.0% per annum. The municipal is estimated to have 283,552
households with an average of 4 persons per household. Population density The
municipal had population density of 2,896 people per square kilometer in 2012 and
projected population density estimated to be 3,533 people per square kilometer in
2016. ( 2012 Census).
The targeted population of a study constitutes the group of persons, objects or
institutions that defines the objects of the investigation (Patton, 2002) and (Kombo
and Tromp, 2006). Staff and the registered taxpaying public in Kinondoni
municipality Tax offices constitute the population for the study. Kinondoni

26
municipality tax office covers administrative area namely Kawe, Kijitonyama,
Msasani and Bunju respectively. The municipal Office of the Revenue collection is
located in Kinondoni regional, with three sub- offices in Mwenge, Kijitonyama and
Tegeta respectively. And those areas are chosen purposively.
3.5 Sampling Method
The study employed a simple random sampling to determine the sample size
involved in the study. Simple random sampling was employed to avoid the problem
of selections bias and to get a true representative sample of the population. The
sample size was determined from the sample frame of TRA staffs which compose of
78 staffs. The precise sample size was derived from the statistical formula illustrated
below.
n Where;
n = Sample Size
N = 78
e is a standard error taken at 95% level of confidence interval (e = 5% = 0.05)
Therefore;
n = 78 / [(1 + 78(0.05)] = 65
3.6 Model Specification
According to Johnson and Christensen (2005), research approach is a perspective
that is based on the set of shared assumptions, values, concepts and practices. The
researcher was used mixed method (a combination of both qualitative and

27
quantitative research design). The purpose of using both methods is to be able to
examine further into the dataset to understand its meaning and to use one method to
verify findings from other method (Creswell & Plano Clark, 2007; Morse, 1991;
Onwuegbuzie & Leech, 2005).
Multiple regression analysis was used to analyses the relationship between various
independent and dependent variables. Multiple regression analysis is more amenable
to ceteris paribus analysis because it allows us to explicitly control for many other
factors which simultaneously affect the dependent variable. This is important both
for testing economic theories and for evaluating policy effects when we must rely on
non-experimental data. Because multiple regression models can accommodate many
explanatory variables that may be correlated, we can hope to infer causality in cases
where simple regression analysis would be misleading. Wooldridge J.M.(2003) The
multiple regression models are still the most widely used vehicle for empirical
analysis in economics and other social sciences. Likewise, the method of ordinary
least squares is popularly used for estimating the parameters of the multiple
regression models. (Wooldridge J.M.2003).
In multiple regression analysis, the regression coefficients (viz., b1 b2) become less
reliable as the degree of correlation between the independent variables (viz., X1, X2)
increases. If there is a high degree of correlation between independent variables, we
have a problem of what is commonly described as the problem of multicollinearity.
In such a situation we should use only one set of the independent variable to make
our estimate. (Kothari, 2004). Multi-collinearity occurs when the independent
variables are not independent from each other (Gujarat, 2010). A second important

28
independence assumption is that the error of the mean has to be independent from the
independent variables. Presence of multi-collinearity makes it impossible to estimate
the parameters of the model (Gujarat, 2010). Multi-collinearity was checked using
Tolerance – the tolerance measures the influence of one independent variable on all
other independent variables; the tolerance is calculated with an initial linear
regression analysis. Tolerance is defined as T = 1 – R² for these first step regression
analysis. With T<0.1 there might be multi-collinearity in the data and with T < 0.01
there certainly is. The second test performed was Variance Inflation Factor (VIF)
defined as VIF = 1/T. Similarly with VIF>10 there is an indication for multi-
collinearity to be present; with VIF>100 there is certainly multi-collinearity in the
sample.
Autocorrelation in Test. Autocorrelation occurs when the residuals are not
independent from each other (Gujarat, 2010). In other words when the value of
y(x+1) is not independent from the value of y(x). This for instance typically occurs
in stock prices, where the price is not independent from the previous price. Durbin-
Watson's ‘d’ test was used to check for autocorrelation While ‘d’ can assume values
between 0 and 4, values around 2 indicate no autocorrelation. As a rule of thumb
values of 1.5 < d < 2.5 show that there is no auto-correlation in the data, however the
Durbin-Watson test only analyses linear autocorrelation and only between direct
neighbors, which are first order effects (Gujarat, 2010).
Linearity between Dependent and Independent Variable (s): Linear regression
needs the relationship between the independent and dependent variables to be linear
Gujarat and Porter, 2010). If the two variables are nonlinear, the results of the
29
regression analysis will under-estimate the true relationship (Gujarat, 2010).
Homoscedasticity Assumption: The model assumes that the error terms along the
regression are equal. Slight heteroscedasticity has little effect on significance tests;
however, when heteroscedasticity is marked it can lead to serious distortion of
findings and seriously weaken the analysis thus increasing the possibility of a Type I
error (Gujarat, 2010). According to Gujarat (2010) can be Homoscedasticity
diagnosed by using White Test.
To explain the empirical relationship between variables that determine the revenue
collection in TRA, the following model was used;
RC = β0 + β1 ST + β2 STR + β3 SYST + β4 STF + β5 STL + β6 SKL + β7 SV + µt
RC= Revenue collection, ST=strategy, STR= structure, SYST=system, STF=staff,
STL=style, SKL=skills SV=Shared values. Revenue collections as dependent
variables its effectiveness monitoring is explained by 7S independent variables
(Strategy, Structure, System, Staff, Style, Skills, Shared values).
3.6.1. Justification for Variables Selection
ST = Strategy was selected because it shows what strategic road map as the
institution has to ensure effective monitoring in revenue collection. STR = Structure
was selected as it show the diversity and distributions of different roles in ensuring
effective monitoring in revenue collection. SYST = System is important for show
how revenues are collected and submitted. STF = Staffs show the significant number
of institutional personnel involved in revenue collection. STL = Style shows method
and approaches used in revenue collection SKL = Skill identifies personnel capacity
in revenue collection, SV = Shared Value

30
3.6.2. Hypothesis
The null hypothesis for the study was positive betas as the independent variables
were hypothesized to influence positively the effectiveness monitoring of revenue
collection, through application of 7s models approach.
Null Hypothesis; βi ˃ 0, where i = 1, 2… 7
3.7 Data Collection Tool
The study used structured questionnaire with close ended questions, which was
administered to sampled TRA staff. The tool was tested for reliability where the
Cronbach’s Alpha was used to test for reliability. The value of alpha was used to
accept the null hypothesis of reliability. To ensure the quality of the tool and data
collected, the tool was piloted from TRA Ilala branch and errors that emerged were
corrected.
3.8 Data Analysis
Data analyses were assisted by the aid of Statistical Package for Social Sciences
(SPSS) and excel depending on data demand and presentation. Descriptive analysis
was used to analyze data to produce frequencies and percentage of different subjects
involved in the study. Regression analysis was used to determine the effectiveness
monitoring of revenue collection as well as to determine the relationship between
variables explaining revenue collection. Data was presented through different ways,
Pie and chart tools (column) to facilitate easy understanding of findings.
31
CHAPTER FOUR
4.0 FINDINGS AND DISCUSSION
4.1 Chapter Overview
The main focus of this chapter is on the analysis of the data collected from the field
of the study depending on the responses given by the respondents. Research findings
were obtained by using questionnaires. The presentation of data has been illustrated
in terms of chart tools (column). The presentation of the Research findings was
carried out according to each research question by pinpointing different issues which
support or challenge each research question.
The study constituted 62 respondents who responded on questionnaires. To do this,
the responses were grouped into discrete variables like Gender, Level of education
and others which are vital. The data was analyzed using statistical tools like
Diagram, Frequency, percentages, among others with the Microsoft office and
Statistic’s package for social sciences (SPSS) vision 16.0 software. Results were
presented and analyzed as tested according to the specific objectives which were as
follows: - “TO”
i. Determine the factors that influence effective monitoring on revenue collection.
ii. Determine the measures needed to ensure effective monitoring on revenue
collection.
iii. Examine the challenges facing effective monitoring on revenue collection.
32
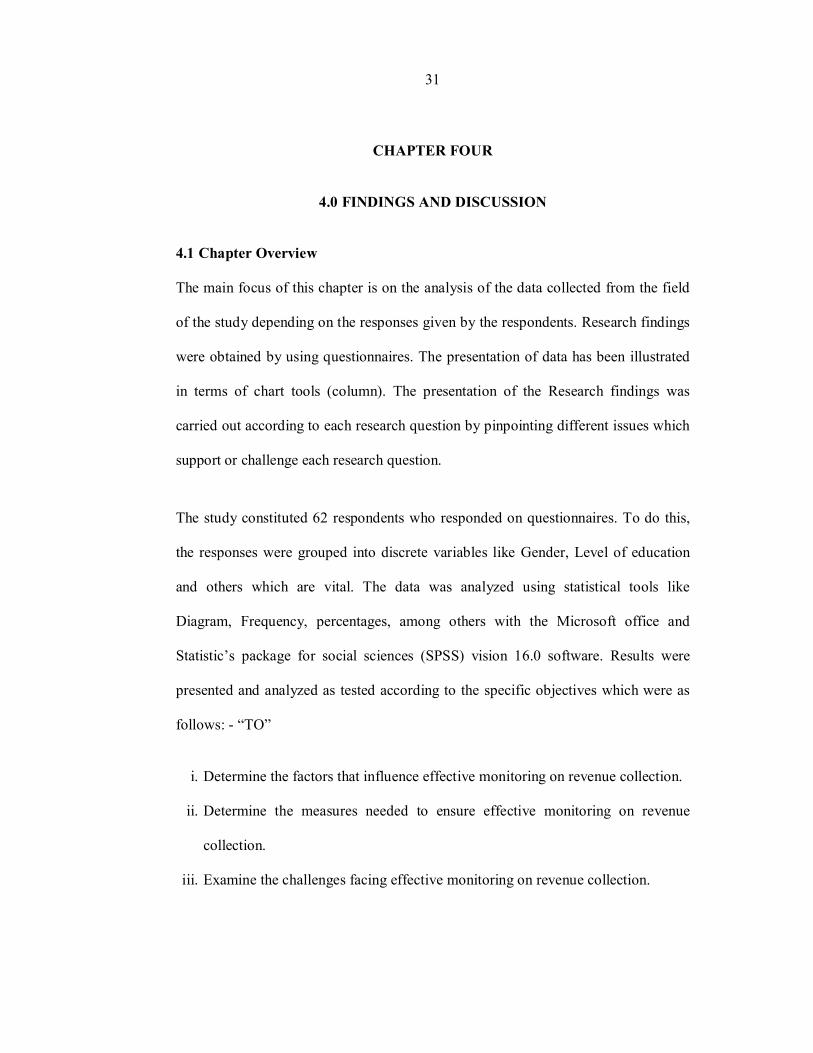
4.2 Demographic Information
4.2.1 Gender of Responds
The results in the figure 4.1 presents the proportional of gender of respondents
involved in the study. The study involved 59.67 % of male and 40.32% female. The
study was aware with gender equality in the participation of survey; however the
turn-up of female respondents were low. Findings however reveal that TRA has more
male employees than female.
Figure 4.1: Respondents Gender Distribution
Source: Field data, (2017)
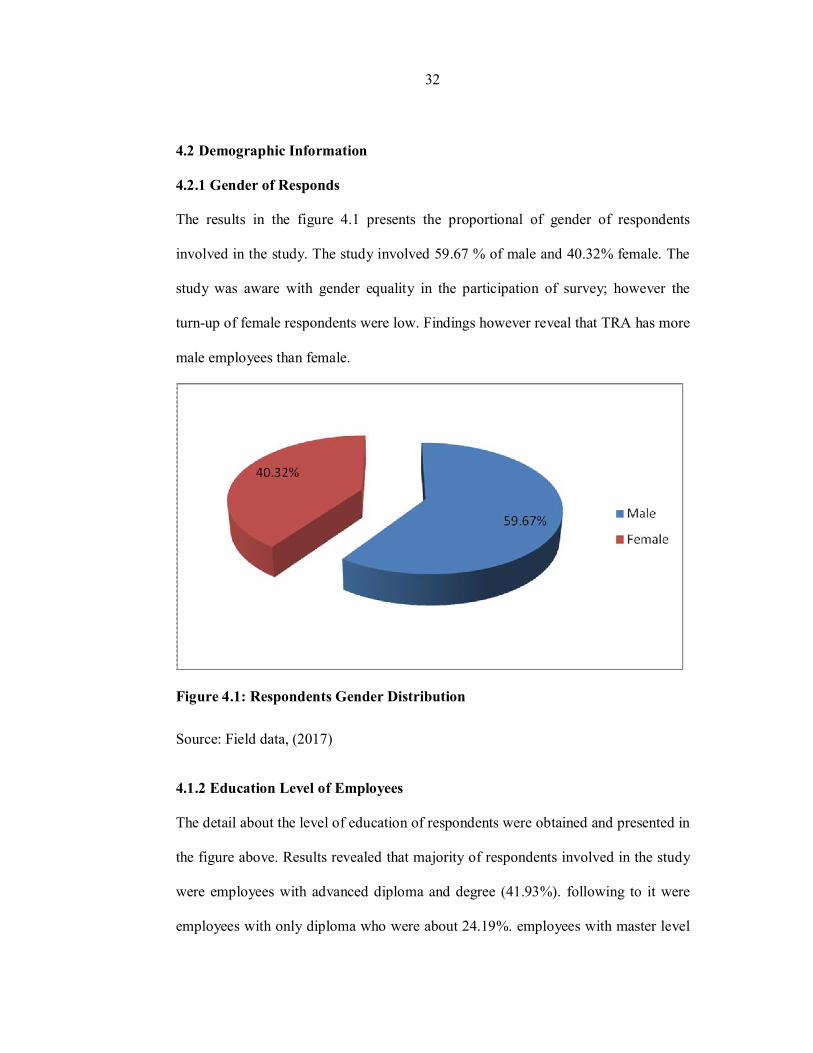
4.1.2 Education Level of Employees
The detail about the level of education of respondents were obtained and presented in
the figure above. Results revealed that majority of respondents involved in the study
were employees with advanced diploma and degree (41.93%). following to it were
employees with only diploma who were about 24.19%. employees with master level

33
of education were 14.51% whereas, those with secondary education were 12.90%.
Few with PhD level of education (6.45%) were involved in the study. Results
translate that many of TRA employees have advanced diploma and degree education
which translate and determine the effectiveness in term of staffs and skills.
Figure 4.2: Level of Education Source: Field Data, (2017).
4.3 Experience of Employees
Experience of employees was important to the study for capturing knowledge of
employees on the subject matter. Experience reveals the understandability and.
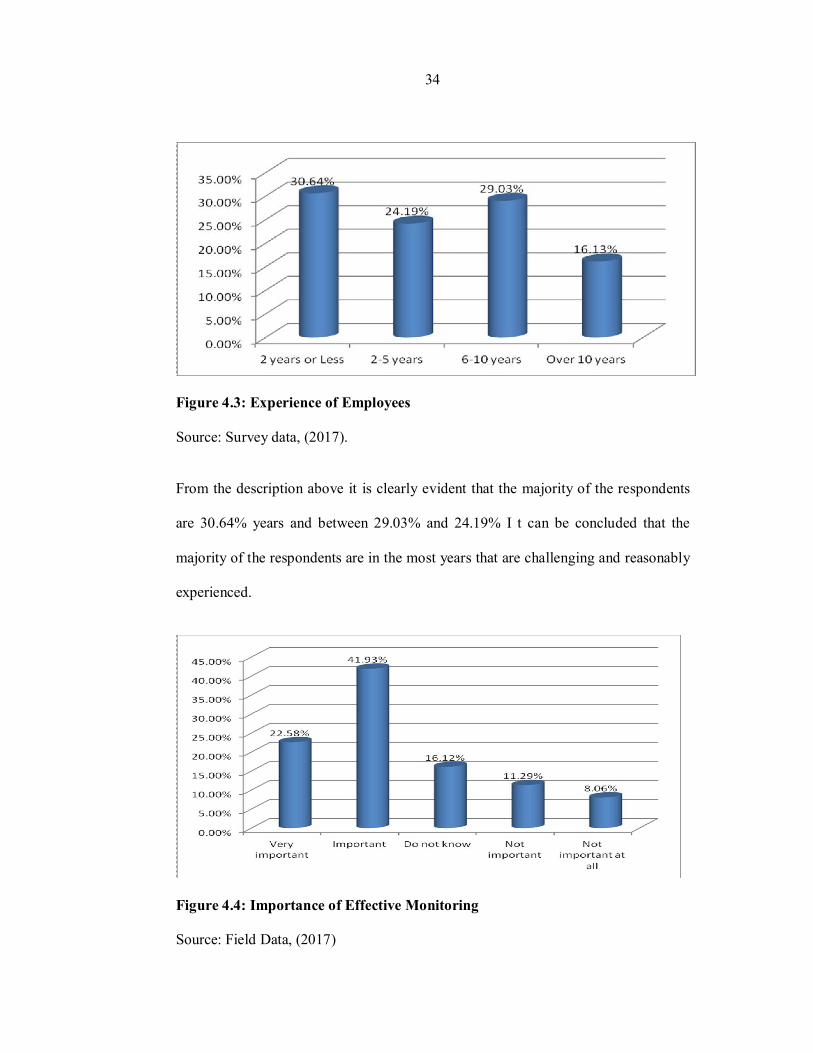
34
Figure 4.3: Experience of Employees Source: Survey data, (2017). From the description above it is clearly evident that the majority of the respondents
are 30.64% years and between 29.03% and 24.19% I t can be concluded that the
majority of the respondents are in the most years that are challenging and reasonably
experienced.
Figure 4.4: Importance of Effective Monitoring Source: Field Data, (2017)
35
Based on findings the majority of respondents 41.93% agreed based on effectiveness
monitoring on revenue collection important. Followed by the respondent based on
very important who are 22.58% and those who are in between 16.12% and 11.29% I
t can be concluded that the majority of the respondents are in the most levels of
important that are reasonably experienced.
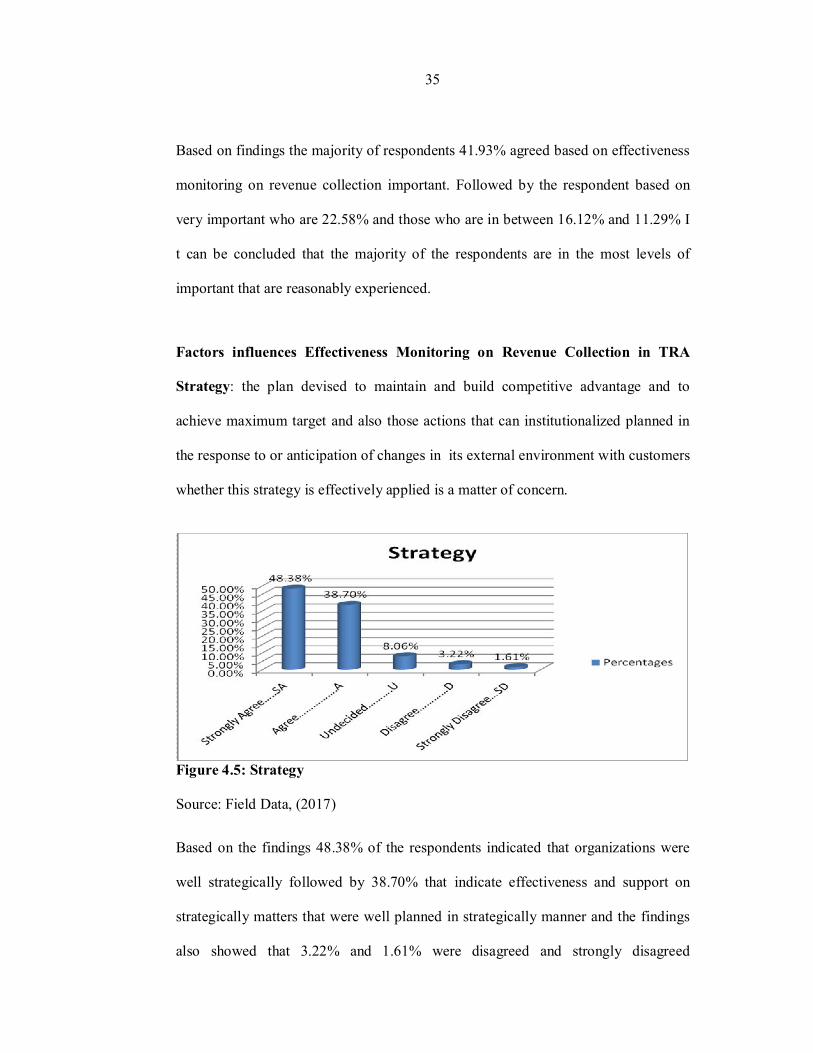
Factors influences Effectiveness Monitoring on Revenue Collection in TRA
Strategy: the plan devised to maintain and build competitive advantage and to
achieve maximum target and also those actions that can institutionalized planned in
the response to or anticipation of changes in its external environment with customers
whether this strategy is effectively applied is a matter of concern.
Figure 4.5: Strategy
Source: Field Data, (2017)
Based on the findings 48.38% of the respondents indicated that organizations were
well strategically followed by 38.70% that indicate effectiveness and support on
strategically matters that were well planned in strategically manner and the findings
also showed that 3.22% and 1.61% were disagreed and strongly disagreed

36
respectively and some numbers proportionally of the respondents did not react in any
way. Therefore the majorities of respondents Strong agreed with how strategy is
working and how is sweating on revenue collection.
Structure: this indicates the way the organization is structured and who reports to
whom. Structure divides tasks and then provides coordination.
Figure 4.6: For Structure Source: Field Data, (2017)
Based on the findings 56.45% of the respondents indicated that the structure were a
vital instrument in effectiveness monitoring on revenue collection. Followed by
29.03% that indicate on strongly agree basses. The findings also showed that
between 6.45% and 4.83% were Disagree and Strongly Disagree. In a small and
balanced proposition of the respondents responded on the basses of undecided about
the structure. Majority responded on high rate that structure is working in good way
and better.
Systems: the daily activities and procedures that staff members engage in to get the
revenue collection done. The systems were vital areas that can bring in effectiveness
monitoring on revenue collection.

37
Figure 4.7: For System Source: Field Data, (2017). From the findings data indicated that 54.83% of the respondent agreed with the
system used by TRA effective monitoring on revenue collection since we are based
on findings data followed by 22.58% that indicate strongly agree on system matters.
The findings also showed that 8.06% and 3.22% were Disagree and strongly Dis
agree also other respondents did not react on it since they failed to sort out on what to
answer hence responded by Undecided. Majority of respondent agreed and followed
by strongly agree meaning that the system is very active.
Style: the style of leadership adopted. The leadership style adopted in any
organization has direct impact on performance. Based on the findings 51.61% of the
respondents indicated that the style used is very important and agreed strongly and
followed by 37.09% that indicated on agree with respondents based on style used
bases. Also showed that 6.45% and 3.22% those percentages shown the respondents
were disagreed and strongly disagreed respectively. In other hand some respondents
responded 1.61% on undecided about the style factor. Majority of respondent
strongly agreed and Agreed in the sense that style is important factor and is strong
tool in effective monitoring revenue collection.
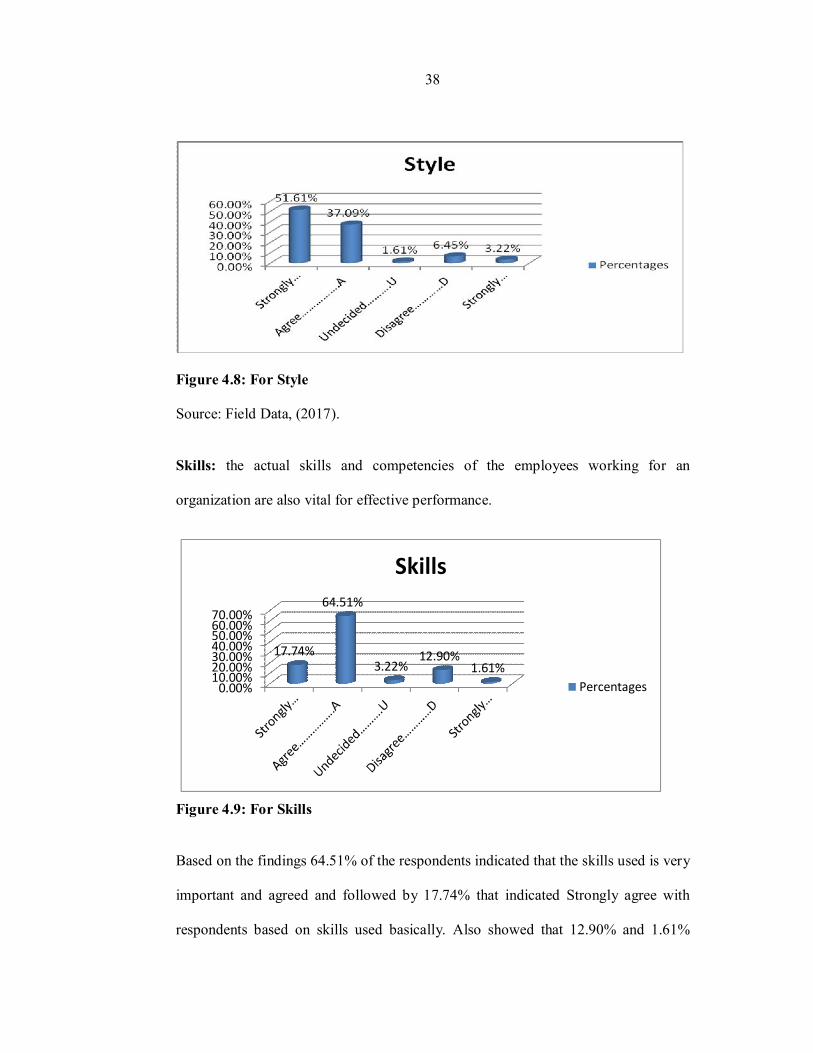
38
Figure 4.8: For Style Source: Field Data, (2017). Skills: the actual skills and competencies of the employees working for an
organization are also vital for effective performance.
0.00%10.00%20.00%30.00%40.00%50.00%60.00%70.00%
17.74%
64.51%
3.22%12.90%
1.61%
Skills
Percentages
Figure 4.9: For Skills
Based on the findings 64.51% of the respondents indicated that the skills used is very
important and agreed and followed by 17.74% that indicated Strongly agree with
respondents based on skills used basically. Also showed that 12.90% and 1.61%

39
those percentages shown the respondents were disagreed and strongly disagreed
respectively. In other hand some respondents responded 3.22% on undecided about
the skills factor. Majority of respondent agreed and strongly agreed in the sense that
skill is important factor and is strong tool in effective monitoring revenue collection.
Staff: general capabilities and employee. The capabilities of staffs depends on
several factors like qualification, experience and motivation among others. Absence
of any of these may lead to ineffective.
Figure 4.10: For Staff
Source: Field data,(2017)
Based on the findings 69.35% of the respondents indicated strongly agreed that the
staff is very important and followed by 30.64% that indicated agree with respondents
based on staff used basically. Also showed that 0.00% and 0.00% those percentages
shown the respondents were disagreed and strongly disagreed respectively. In other
hand some respondents responded 0.00% on undecided about the staff factor.

40
Majority of respondent agreed and strongly agreed in the sense that staff is important
factor and is strong tool in effective monitoring on revenue collection.
Shared Values: called ‘super ordinate goals’ when the model is developed, these are
the core values of the organization that are evidenced in the corporate culture and the
general work ethic. The core values of the authority are integrity, fairness, teamwork,
innovation and professionalism. Whether these values are working in the office
under investigation is a great concern.
Figure 4.11: Shared Value Source: Field Data, (2017)
Based on the findings 72.58% of the respondents indicated that the shared value used
is very important and strong tool on effective monitoring and has been strongly
agreed and followed by 24.19% that indicated agree with respondents based on

41
shared value used basically. Also showed that 3.22% and 0.00% those percentages
shown the respondents were disagreed and strongly disagreed respectively. In other
hand some respondents responded 0.00% on undecided about the shared value factor.
Majority of respondent agreed and strongly agreed in the sense that shared value is
important factor and is strong tool in effective monitoring revenue collection.
Factors Needed to Ensure Effectiveness Monitoring on Revenue Collection The
following statements describe the factors for effectiveness monitoring on revenue
collection in TRA: case of Kinondoni municipality.
Figure 4.12: Factors Needed to Ensure Effectiveness Monitoring on Revenue
Collection
Source: Field Data, (2017)
From the findings, majority 56.45% of the respondents of the factors needed to
ensure effectiveness monitoring on revenue collection in TRA are strongly agree.
Followed by 35.48% as were indicated by respondents. A significant of respondents
4.83% and 1.61% showed the response on disagree and strongly disagree. In other
42
side there some of respondents were not able to be ready to show their side means
undecided towards to factor needed to ensure effectiveness monitoring on revenue
collection.
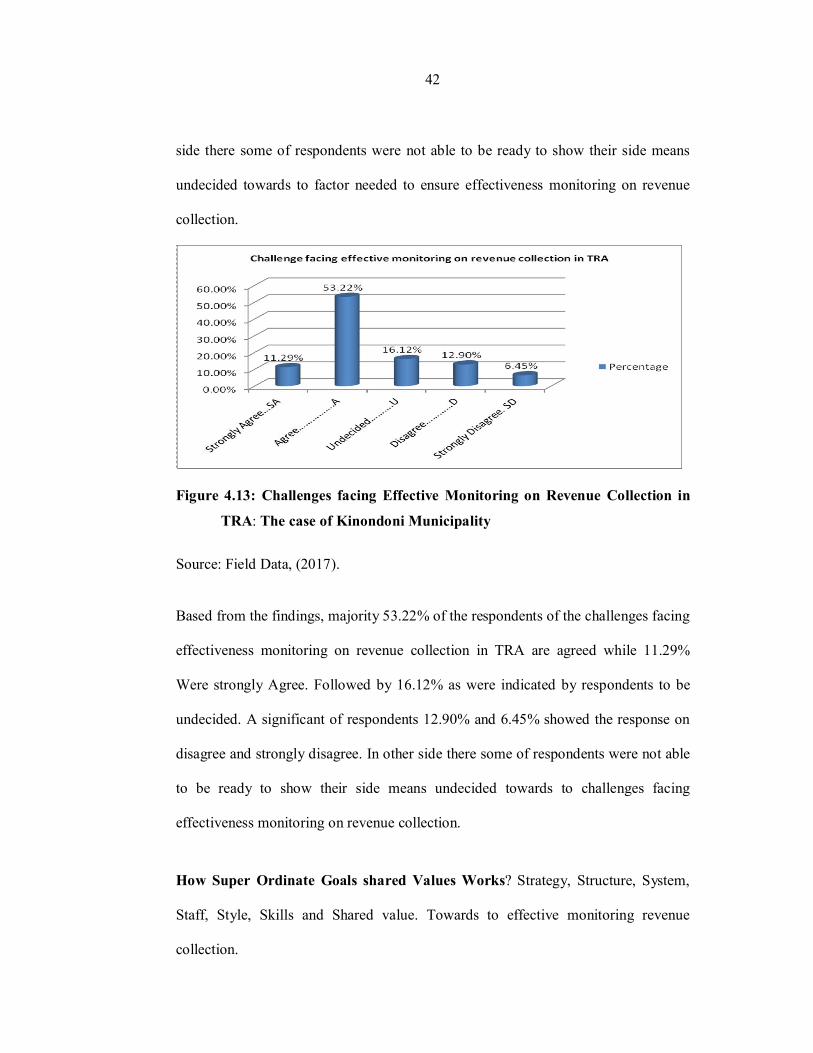
Figure 4.13: Challenges facing Effective Monitoring on Revenue Collection in
TRA: The case of Kinondoni Municipality
Source: Field Data, (2017).
Based from the findings, majority 53.22% of the respondents of the challenges facing
effectiveness monitoring on revenue collection in TRA are agreed while 11.29%
Were strongly Agree. Followed by 16.12% as were indicated by respondents to be
undecided. A significant of respondents 12.90% and 6.45% showed the response on
disagree and strongly disagree. In other side there some of respondents were not able
to be ready to show their side means undecided towards to challenges facing
effectiveness monitoring on revenue collection.
How Super Ordinate Goals shared Values Works? Strategy, Structure, System,
Staff, Style, Skills and Shared value. Towards to effective monitoring revenue
collection.

43
Figure 4.14: How Super Ordinate Goals shared Values Works?
Source: Field Data, (2017)
Based from the findings, majority 56.45% of the respondents on how do super
ordinate goals shared values works effectiveness monitoring on revenue collection in
TRA are agreed while 24.19% Were strongly Agreed. Followed by 9.67% as were
indicated by respondents to be undecided. A significant of respondents 4.83% and
4.83% showed the response on disagree and strongly disagree. In other side there
some of respondents were not able to be ready to show their side means undecided
towards to how do super ordinate goals shared values works effectiveness monitoring
on revenue collection.
44
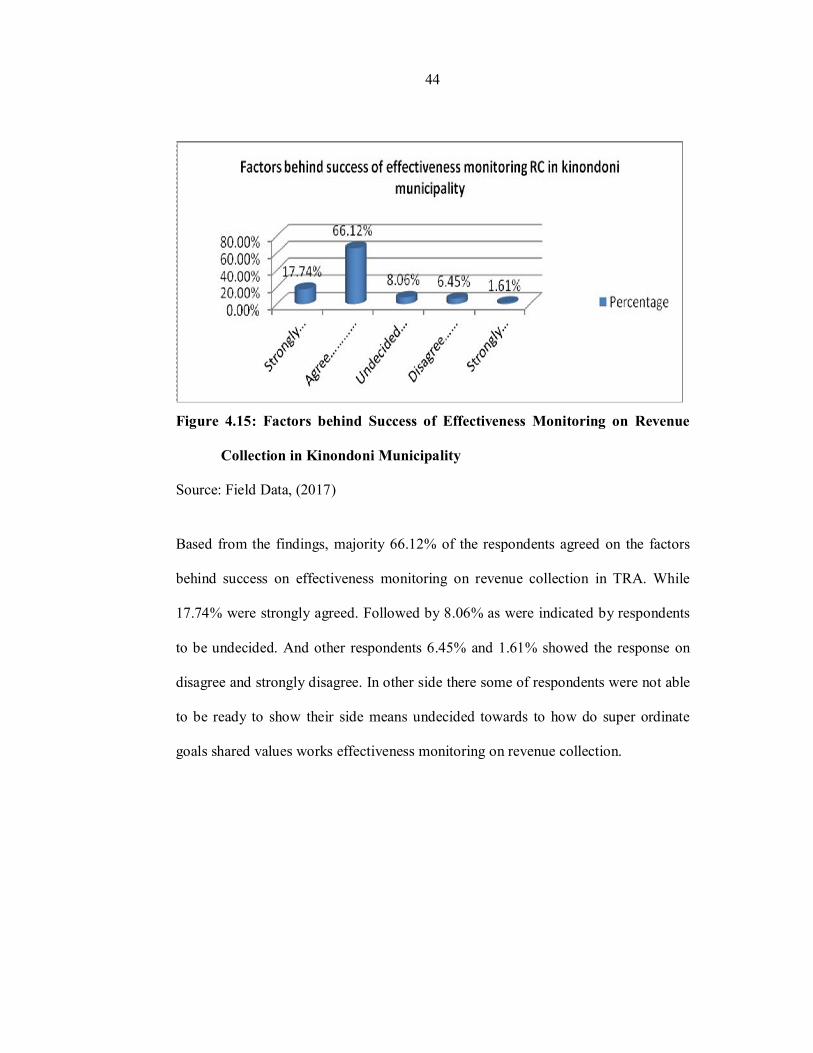
Figure 4.15: Factors behind Success of Effectiveness Monitoring on Revenue
Collection in Kinondoni Municipality
Source: Field Data, (2017)
Based from the findings, majority 66.12% of the respondents agreed on the factors
behind success on effectiveness monitoring on revenue collection in TRA. While
17.74% were strongly agreed. Followed by 8.06% as were indicated by respondents
to be undecided. And other respondents 6.45% and 1.61% showed the response on
disagree and strongly disagree. In other side there some of respondents were not able
to be ready to show their side means undecided towards to how do super ordinate
goals shared values works effectiveness monitoring on revenue collection.

45
Figure 1.16: Method Used to Collect Revenue in Kinondoni Municipality is it
Appropriate
Based from the findings, majority 43.54% of the respondents agreed on the method
used to collect revenue in kinondoni municipality in TRA. While 30.64% were
strongly agreed. Followed by 6.45% as were indicated by respondents to be
undecided. And other respondents 11.29% and 8.06% showed the response on
disagree and strongly disagree. In other side there some of respondents were not able
to be ready to show their side means undecided towards to the methods used to
collect revenue in TRA.

46
Figure 4.17: Revenue Collected by TRA is Effectively Monitored and Put Into
Use?
Source: Field Data, (2017). From the findings, majority 50.00% of the respondents agreed on revenue collected
by TRA is effectively monitored and put into use. While 9.67% were strongly
agreed. Followed by 9.67% as were indicated by respondents to be undecided. And
other respondents 16.12% and 14.51% showed the response on disagree and strongly
disagree. In other side there some of respondents were not able to be ready to show
their side means undecided towards to revenue collected by TRA is effectively
monitored and put into use.
Improve effective Monitoring Mechanism in Management of Revenue
collection, how effective monitoring mechanisms can influence the performance of
revenue collection in TRA as follows

47
Figure 4.18: Improve Effective Monitoring Mechanism in Management of
Revenue Collection
Source: Field Data, (2017)
From the respondent’s major number 46.77% which is professionalism should be the
first element to consider followed by 19.35% which is Transparency, 16.12% which
is Responsiveness, 12.90% Accountability and lastly competitiveness 4.83%.
Meaning that number 1 should be Professionalism, 2.Transparency,
3.Responsiveness, 4. Accountability, 5. Competitiveness. Here is how effective
become higher and visible
4.4 Regional Revenue Comparison
The analysis also included comparison of revenue collection between the three TRA
regions in Dar es Salaam. The aim being to compare the volume of collection which
connotes effectiveness monitoring of revenues collections in TRA Kinondoni region.
The figure below illustrates the trend of revenues collection covering the first three
quarters of the 2016/17 financial year.

48
Figure 4.19: Regional Revenue Comparison
Source: TRA Quarterly Tax Revenues Collection, (2016/17)
Results in the figure above show an increasing trend of revenues collection for both
TRA regional centers of Ilala, Kinondoni and Temeke. Ilala region leads in revenues
collections in all three quarters followed by Kinondoni region. Despite the fall in
revenue collections in October and November of the second quarter in Kinondoni
district but the total revenue collection in the said quarter increases compared to the
previous quarter.
4.5 Testing the Assumption of Multiple Linear Regression Model Multi-
Collinearity Test on Independent Variables
Before running regression, the test of multi-collinearity between independent
variables was done; Presence of multi-collinearity inflates the variance of the
parameter estimates, making them individually statistically insignificant even though
the overall model may be significant. Additionally multi-collinearity causes
problems in estimation of the coefficients of independents variables and the
interpretation. The tolerance and variance inflating factors (VIF) were used to detect

49
multi collinearity between exploratory variables. Results of multi-collinearity test
between tests on independent variables.
Table 4.1: Tolerance and the Variance Inflating Factors (VIF)
Collinearity Statistics
1 Model
Tolerance VIF
Staff .117 2.785 Skills .145 -2.747
System .124 2.006 Shared value .136 2.887
Structure .083 .758 Style .093 .267
Strategy .118 2.785 Source: Field Data, (2017).
Table 4.1 indicates that the tolerance is greater than 0.1 (10%) and the variance
inflating factors (VIF) does not exceed 5 to 10, In this results the study was
conducted that there is no problem of multi-collinearity among exploratory variables.
In that case regression coeffients are clearly estimated and reliable.
4.7 Checking Linearity between Dependent and Independent variables
The analysis to test the linear relationship between variables. To achieve this
objective the researcher used Correlation matrix to establish whether the included
variables were linear or not. Relationship is linear if the difference between
correlation coefficient and nonlinear correlations is small. The probability associated
with correlation coefficient between factors that influence effectiveness monitoring
on revenue collection is 0.000 while the average correlation coefficient for all factors

50
were 0.401 larger than the probability. This implies that relationship between
dependent variables and independent variables is linear. The correlation coefficient
between effective monitoring and revenue collection is 0.136 while the probability
value is 0.000 indicating a positive linear relationship among the variables. The
correlations coefficient between staffs, shared values, system, and structure and
strategy take long time is 0.117 while probability is 0.000 which indicate that there is
a positive linear relationship among the tested variables. The correlation of
coefficient between shared value,system and revenue collection is 0.124 while the
probability is 0.000 indicating that the two variables have positive linear relationship.
Table 4.2: Test of Autocorrelation Assumption ( Durbin Waston Test)
Model R R.Square Adjusted R Std Error of Durbin-Waston square estmet 1 .926 .913 .910 .4099 2.785
Source: Field Data, (2017)
The test was done by using Durbin Waston test. Multiple linear regression assume
that the errors are independent
a. Predictors: (constant) effective monitoring factors some done little activity of
staffs, skills and shared value.
b. Dependents variable: Revenue collection
Illustrates the results of the test of independent of observation the test was done by
using Durbin Watson test, multiple linear regression assume that the errors are
independent and there no serial correlations. Errors are residuals of differences
between the actual score for all cases and score estimate using the regression
equation. No serial correlation implies that the size of residual for one . Case has no
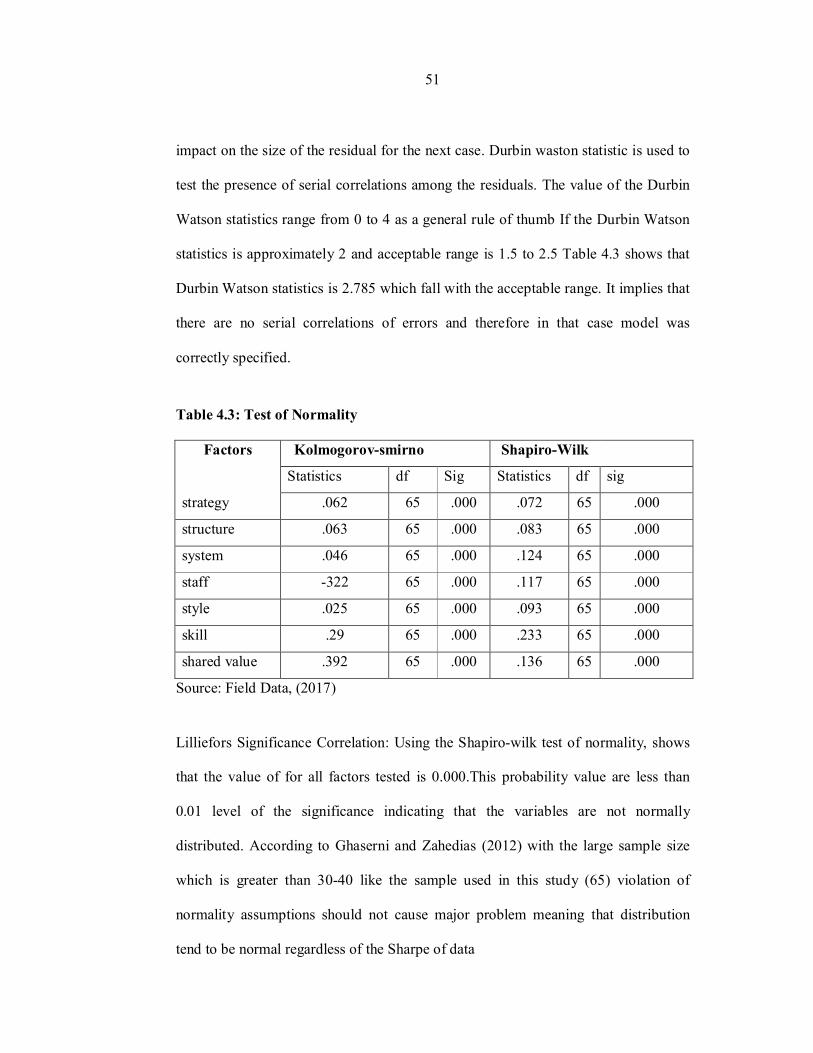
51
impact on the size of the residual for the next case. Durbin waston statistic is used to
test the presence of serial correlations among the residuals. The value of the Durbin
Watson statistics range from 0 to 4 as a general rule of thumb If the Durbin Watson
statistics is approximately 2 and acceptable range is 1.5 to 2.5 Table 4.3 shows that
Durbin Watson statistics is 2.785 which fall with the acceptable range. It implies that
there are no serial correlations of errors and therefore in that case model was
correctly specified.
Table 4.3: Test of Normality
Factors Kolmogorov-smirno Shapiro-Wilk
Statistics df Sig Statistics df sig
strategy .062 65 .000 .072 65 .000
structure .063 65 .000 .083 65 .000
system .046 65 .000 .124 65 .000
staff -322 65 .000 .117 65 .000
style .025 65 .000 .093 65 .000
skill .29 65 .000 .233 65 .000
shared value .392 65 .000 .136 65 .000
Source: Field Data, (2017)
Lilliefors Significance Correlation: Using the Shapiro-wilk test of normality, shows
that the value of for all factors tested is 0.000.This probability value are less than
0.01 level of the significance indicating that the variables are not normally
distributed. According to Ghaserni and Zahedias (2012) with the large sample size
which is greater than 30-40 like the sample used in this study (65) violation of
normality assumptions should not cause major problem meaning that distribution
tend to be normal regardless of the Sharpe of data

52
4.8 Test of Homoscedasticity Assumptions
Heteroscedasticity means presence of error of variance in the linear regression model
which is a variation against homoscedacity variation assumptions. Gujarat and Porter
(2010) state that heteroscedasticity can be diagnosed by using white test. According
to them. White test can be done by comparing the value of calculated and observed
Chi-square value by using the formula:
X2=N x R2 Whereby x2 = is the calculated Chi-square, N= Is the number of
observation and R2= R-Square or coefficient of determination. The rule of thumb is
when Chi-square calculated is less than chi-square observed there is no
heteroscadasticity problem in the model ( Gujarat and Porter 2010) R2=0.233 and
N=65, therefore calculated X2= 0.233x65= 15.145 while the chi square observed at
0.05 level of significance and N=65 is 71.205. The result indicate that calculated chi-
square is less than observed Chi square which imply that the model does not exhibit
heteroscedasticity problem.
Table 4.4: ANOVA
Model Sum of Square df
Mean square f sig
1 Regressio
n 1251.874 5 210.375 99.51
3 .000 Residual 12.43 85 0.84 Total 164.304 90
a Predictors (constant) Strategy, Structure ,System, Staff, Skills, style and shared values b Dependent variables: Revenue collection 4.9 Regression Analysis
Ordinary Least Square regression analysis over all seven independent variables was
run against the revenue collection as a dependent variable to determine the causal
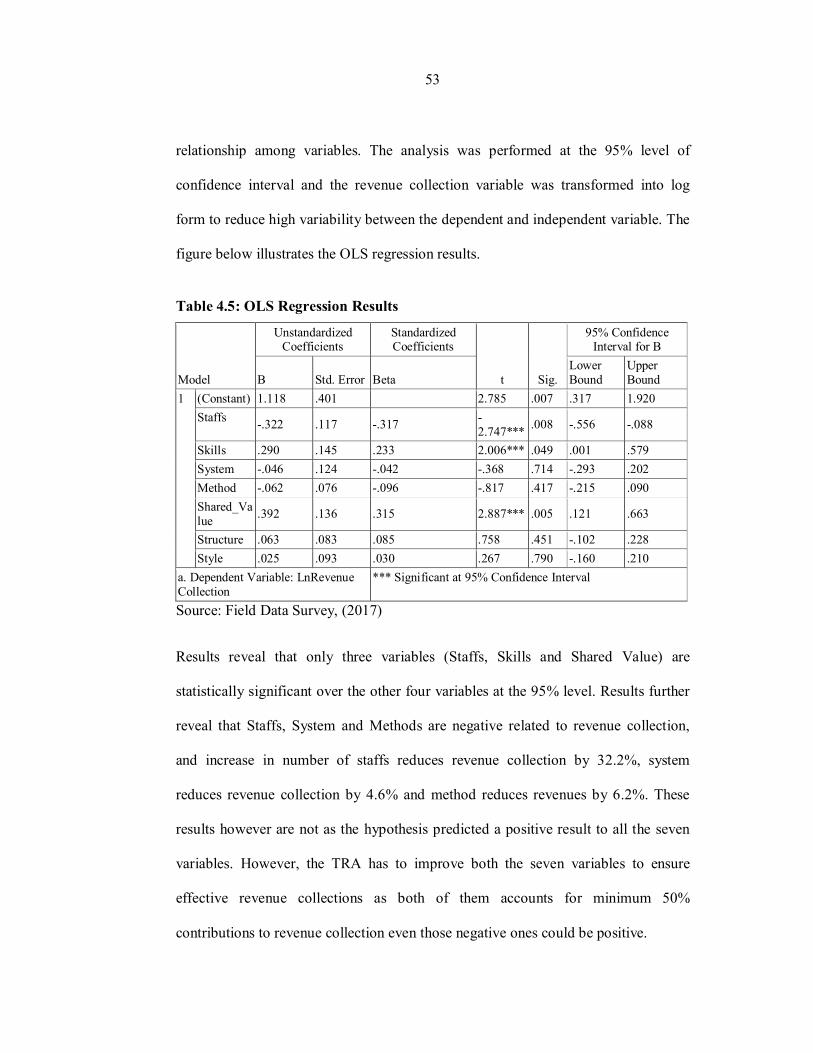
53
relationship among variables. The analysis was performed at the 95% level of
confidence interval and the revenue collection variable was transformed into log
form to reduce high variability between the dependent and independent variable. The
figure below illustrates the OLS regression results.
Table 4.5: OLS Regression Results
Model
Unstandardized Coefficients
Standardized Coefficients
t Sig.
95% Confidence Interval for B
B Std. Error Beta Lower Bound
Upper Bound
1 (Constant) 1.118 .401 2.785 .007 .317 1.920 Staffs -.322 .117 -.317 -
2.747*** .008 -.556 -.088
Skills .290 .145 .233 2.006*** .049 .001 .579 System -.046 .124 -.042 -.368 .714 -.293 .202 Method -.062 .076 -.096 -.817 .417 -.215 .090 Shared_Value .392 .136 .315 2.887*** .005 .121 .663
Structure .063 .083 .085 .758 .451 -.102 .228 Style .025 .093 .030 .267 .790 -.160 .210
a. Dependent Variable: LnRevenue Collection
*** Significant at 95% Confidence Interval
Source: Field Data Survey, (2017)
Results reveal that only three variables (Staffs, Skills and Shared Value) are
statistically significant over the other four variables at the 95% level. Results further
reveal that Staffs, System and Methods are negative related to revenue collection,
and increase in number of staffs reduces revenue collection by 32.2%, system
reduces revenue collection by 4.6% and method reduces revenues by 6.2%. These
results however are not as the hypothesis predicted a positive result to all the seven
variables. However, the TRA has to improve both the seven variables to ensure
effective revenue collections as both of them accounts for minimum 50%
contributions to revenue collection even those negative ones could be positive.

54
CHAPTER FIVE
5.0 CONCLUSION
5.1 Summary
Kinondoni Municipality council is one of the fifth municipalities within the city of
Dar es Salaam in Tanzania. The vision of the municipality is to have a community
which is highly motivated, dynamic, with developed socioeconomic infrastructure.
The overall objective of the mission is provision of quality services to the community
through effective and efficient use of resources; capacity building, good governance
and respect to the rule of law hence improve the living standard. Kinondoni
municipality council is charged with the responsibility of delivering services the
people and those will be solved when revenue are collected has been planned and
targeted.
From the findings the research study shown that kinondoni municipal council collect
revenue from different sources by through different style and system and those
source are licenses and permit, parking fee, fine and penalties, rents , rates and
markets in order to deliver services to the people and meet a targeted budget. Study
revealed that some of central government directives are also responsible for increase
of revenue collection ability to the municipality council. This is largely associated
with the restriction imposed by the government on the certain source of revenue
collection authority. It is also important to acknowledge that with effect from the
property tax fee were reintroduced as an attempt to increase the council revenue
collection by effectively monitored. There has been high level of revenue collection
in Kinondoni municipality compared to other years like 2014/15 and 2015/2016 this

55
has been due to political influence and will on to increase revenue collection. This is
due to strongly enforcement of rules and procedures of collecting revenues. The
government of Tanzania in its quest to increase revenue collection and decided to
impose scientific target on regional in order to obtain a targeted estimate and plan
and also to ensure effectiveness monitoring of revenue collection. As the result this
study identified effectiveness monitoring on revenue collection and this can be seen
on the factors used to verify the statement based on effectiveness monitoring in real
actual amount collected. Highest amount of the revenue from existing resources in
the fast possible time duration as planned. This study was conducted to examine the
effectiveness monitoring on revenue collection based on factors targeted through
respondents mostly specific objectives was so much concerned with factors also
which are strategy, structure, system, styles , staffs , skills and shared values.
Numbers of respondents identified high percentage of shared value in the collection
of revenue as the reasons for high of which more than half of respondents Identified
skills, strategy, system and staffing has been used in good manner for effectiveness
monitoring . It must be noted that shared values is the vital element for effectiveness
monitoring on revenue collection. Currently there is system in place that generates
reliable revenue collection all those comes once when Mckinsey model of
organization is effective monitored in ones of the factors entire the system. All
respondents have recognized the utilization of the system and style of the services
used as factors for effectiveness monitoring on revenue collection. The increase of
use of EFDs also provides the ground for utilization of more effective monitoring
and advancement of management system in the organization. The ratio used in

56
analyzing the success of the effective monitoring on revenue collection is the ratio
equal one which indicates that revenue collection system has been able to collect the
revenue as estimated, targeted and planned in kinondoni municipality. In case the
ratio is less than one it would be the indicator of the failure of effective monitoring
on revenue collection in failure to ratify achieving the budget. If incase this ratio is
higher than one it indicates whether the budget estimation has not been based on real
factors.
5.2 Policy Implications
The fundamental issues to be addressed in the context of effective monitoring on
revenue collection are to recheck the design of current revenue organization structure
and to strengthen TRA management. In additional, Measures are required to enhance
the tax payers compliance and this cannot be done without substantial and consider
political will and support from revenue collected to channel of the service delivery to
the given citizens meaning the government.
The important thing to stress is to encourage citizens and civil society to engage in
financial effective monitoring at all levels this measure should start from accounting
and shared values mechanism it can strengthen the legitimacy and standing of
Authority by contributing with complementary measures to improve and control in
effective monitoring of revenue collection. Revenue collection system is greater
emphases on the cost effectiveness monitoring of revenue collection, taking into
account not only the direct costs of revenue administrative. As Mckinsey 7s models
is working effectively in revenue collection. It is because of consistency between the

57
elements identified in the models as a theory been used in this research. This models
of 7s approach made TRA work in a good procedure as the strong organization to be
able on effective monitoring hence good results in revenue collection as fifth
government needs and demand on more revenue to be collected in every source of
income.
5.3 Recommendations
Based on the findings of the study, it is recommended as follows-:
i. There is a need of putting more emphasize on effectiveness monitoring in revenue
collection throughout all cycle of organization demand and structure starting from
strategy, structure, system, skills, style and shared values so that to maintain an
agreeable revenue collections. This will imply the organization (TRA) to be in
better position to understand what is needed and how should it be done, planned
and targeted in terms of organization cycle hence there will be an improvement in
revenue collections
ii. Current demands, needs and targets should be used when planning and carrying
budget estimation and allocations this will imply the allocation will be as real as
budget to avoid cost overrun which will impact on effectiveness monitoring.
Further the collected revenue should be channeled to the right use.
iii. There is need to improve on more external stakeholders for better insights and
more rational ways of conducting effectiveness monitoring on revenue collection
that would lead to realization of intended results or target.
iv. Should be stricter enforcement of laws from both sides by government and
politicians and severe punishment and penalty of employee who misconduct

58
themselves in fraudulent activities, the Judicial and other assemblies must come
together and implement joint enforcement strategies. This will make sure that
enforcement is in on ground (attained)
v. The utilization of EFDs and other IT matters, promotion, training of the personnel
of revenue collector system it will make more effective monitoring factors.
vi. Lastly, there a need for separation of responsibilities in revenue collections in
order to enable submission of targeted plan or estimate approval, actual spending
and effectiveness monitoring and not to be entirely left for the discretion of
politician people.
Criterion Part Strengths Areas for Improvement
Leadership 1a: Leaders develop the mission, vision, values and ethics and are role models of a culture of excellence.
1a Improved Performance accountability and Transparency
Establishment of internal and external review mechanism
1a Adherence to staff meetings Encourage usage of suggestion box
1a Existence of Medium Term Strategic Plan
Ensure holding of Departmental and workers council meetings
1a Existence of Client Service Charter Carrying out/ initiate the review process to access achievement
1a Openness and Transparency Leadership 1b: Leaders are personally involved in ensuring the organisation’s management system is developed, implemented and continuously improved.
1b Weekly management meetings Enhance capacity for Implementation and monitoring of the MOF Strategic Plan
1b Appointment of Substantive Heads of Department
To enhance Managerial and Negotiation Skills of Leaders
1b Leadership Commitment to improve Performance
Strengthen feedback mechanism on Performance at all levels
1b Establish incentive Package for exemplary Performance
Leadership 1c: Leaders interact with customers, partners and representatives of society
1c Budget guidelines issued timely To have review mechanism of Donor conferences
1c To have programmed Donor meeting 1c Involve Stakeholders in major decisions 1c Leaders meet Stakeholders regularly
1c Participatory approach in Budget preparation

59
Criterion Part Strengths Areas for Improvement
1c Enhanced Transparent approach in Conducting Public business
1c Commitment by partners Effective feedback from Customers 1c To improve Service delivery Leadership 1d: Leaders motivate, support and recognise the organisation’s people.
1d Involvement of staff in setting organization objectives /targets Criterion for selecting best workers (rewarding)
1d Good forum for meeting members of staff SASE needs to be extended to staff below TGS6
1d Trade Union are members of the management team
1d Management team’s meeting held 1d Best staff awarded every year 1d Institutionalized periodic meetings Improvement of an ‘open door policy’ 1d Readiness of Leadership to Cooperate Policy and Strategy 2a: Policy & Strategy are based on the present and future needs and expectations of stakeholders.
2a Improved service delivery accountability and transparency Review mechanism needs to be in place
2a Focused budget Close follow - up and execution of programs
2a Stakeholders views are incorporated into government budget
Institutionalize Customers Service Delivery Surveys
2a Various financial laws reviewed Institutionalize Service Delivery Surveys Policy and Strategy 2b: Policy & Strategy are based on information from performance measurement, research, learning and creativity related activities.
2b Improvement in Tax collection Wider involvement of stakeholders in policy development
2b A policy department in place Capacity building 2b Regular reviews
2b A Planning Unit has been established at DAP
To increase staff and capacity at Policy Department and Planning Unit to conduct research
2b Enhanced capacity at the Policy Analysis Department promising
Policy and Strategy 2c: Policy & Strategy are developed, reviewed and updated. 2c Having more realistic budget Enforcement of IFMS
2c Improved management of financial resources
To have a clear review mechanism of the Policies and Strategies
2c Compliance to PFA in reporting requirements Comprehensive review of the Strategic plan
2c Committed and involved leadership
2c Participation of stakeholders in institutionalized forum
Policy and Strategy 2d: Policy & Strategy are deployed through a framework of key processes.
60
Criterion Part Strengths Areas for Improvement
2d Improvement of revenue collection Capacity building 2d Efficiency in payments Regular review of the processes
2d Ensured value for money and accountability
2d Strategic Plan identifies the critical areas
A System of Evaluation and Monitoring to be established
2d Client Service Charter gives direction Introduce Customer Needs Study
2d Establishment of Planning Unit, Communication and Information Unit and LAN
Introduce Service delivery Surveys
2d External Service Delivery Survey Policy and Strategy 2e: Policy & Strategy are communicated and implemented
2e Computerized financial management system (IFMS) Close follow - up of the implementation process
2e Budget sustainability 2e Timely preparation of budget
2e Presence of institutionalized arrangement for management and departmental meetings
Ensure conduct of departmental weekly meetings
2e Commitment of top management /leadership
Review of effectiveness and frequency of meetings
2e Ensure feedback to workers of the outcome of meetings
People 3a: People resources are planned, managed and improved
3a Existence of Training institutions i.e., IFM, TIA
Need for regular assessment of Employees morale
3a Ensure timely promotion 3a A revised MOF structure in place Trained front line staff in customer care
3a Required number of personnel in place
Provision of conducive working environment for staff
3a Qualified financial management cadre Deliberate effort of retooling
3a Presence / availability of Scheme of Service and job description for workers
Formulation of clear and elaborate motivation and incentive scheme
3a Institution of effective feedback mechanism /system from workers
3a Preparation of implementable training programme
People 3b: People’s knowledge and competencies are identified, developed and sustained. 3b Quality services Regular review of TNA 3b Committed staff Post training evaluation 3b Bond as regards sponsored staff
3b DSA is now TIA. IAA has improved Need to adopt a Human Resource Development Plan
3b Training budget substantially Consider review of salary scales to attract

61
Criterion Part Strengths Areas for Improvement
increased and Government sponsorship of risen
retention
3b The Strategic Action Plan identifies HRD as critical
People 3c: People are involved and empowered.
3c Employees kept informed on the functions of the Ministry
Need for immediate review by Master Workers council
3c Motivated work force Adherence of departmental /annual ministerial workers council (calendar)
3c Workers Council in place Provision of research facilities
3c Commitment of top leadership to involve and empower people
Adequate reward for outstanding performance and assessment criteria
3c Institute system for workers to contribute ideas Source: Secondary Data, 2017
5.4 Suggestion for Further Research Study
A similar study needs to be done comparing effectiveness monitoring on revenue
collection in Tanzania Revenue Authority (TRA),Through application of 7s models
Approach: Case of Kinondoni municipality and National wide.
62
REFERENCES Aaron, H. W. and Gale. P. (1993). Economic effect of fundamental Tax Reform.
New York, Brookings Institule Press.
Aasness, J., Benedictow, A. and Hussein, M. F. (2002). Distributional Efficiency of
Direct and Indirect Taxes. Rapport 69. Economic Research Programme on
Taxation. Statistisk Sentralbyra.
Adam, S. (1976). Proposed canons of Taxation; Equity, certainty, convenience and
efficiency. London: Oxford University Press
Adejoh, E., and Sule, J. G. (2013). Revenue Generation: Its impact on government
developmental effort (A Study of Selected Local Council in Kogi East
Senatorial District). Global Journal of Management and Business Research
Administration and Management. 13 (4), 89-93.
Akintoye, I. R. and Tashie, G. A. (2013). The effect of tax compliance on economic
growth and development in Nigeria, West Africa. British Journal of Arts and
Social Sciences. 11(11), 78-88.
Alfred, D. (2002). Learning; Process, rewards and behavior. California Management
Review 18 (3):234-223.
Alm, J., Kirchler, E. and Muehlbacher, S. (2012). Combining Psychology and
Economics in Analysis of Compliance: From enforcement to cooperation.
Economic analysis and Policy. 42 (2), 987-1120.
Andreoni, J., Erard, B. and Feinstein, J. (1998). Tax Compliance. Journal of
Economic Literature. 36(2), 818-860.
Andrulis, J., and Barton, B. (2002). Revenue and Fiscal Management: Tomorrow’s
government at work. IBM Corporation. IBM Global Service. Route 100.

63
Somers, Ivy. USA.
Arias, L. M. (2007). Wars and the enforcement of revenue collection: Theory and
insights from Colonial Mexico. John, M Olin Program in Law and
Economics. Stanford Law School.
Aryee, G. C. (1996). Tax collection Manual. Acara, Ghana internal Revenue Service
Blaikie, N. (2000). Designing Social Research; The Logic of Anticipation.
Maldenwardworth learning Inc
Casley, D. J., Kumar, K., and Mundial, B. (1988). Collection, analysis and use of
monitoring and evaluation data. In Collection, analysis and use of
monitoring and evaluation data. Johns Hopkins University Press.
Chen, H. T. (1997). Applying mixed methods under the framework of theory-driven
evaluations. New Directions for Evaluation, 74, 61 – 72.
Cohen, T. and Marion, H. (1994). Case study Research –Design and Mothers.
Newbury Park. Sage Publications.
Creswell, J. W. (2003). Research Design Qualitative, Quantitative and Mixed
methods Approaches (2ndEd) Califonia, Sage Publications.
Das-Gupta, A. and Mookherjee, D. (1998). Incentive and Institutional reform in tax
enforcement: An analysis of developing country experience. Oxford
University Press, New York.
Drucker, P. F. (1979). Management in organization. New York, Pan Paperbacks.
Farzbod, J. (2000). Investigation of the effective factors in the Tax efficiency,
unpublished M.A thesis, Tehran University.
Fisher.A. A., Laing, J. E., Stocekel, J. E. and Townsend, J. W. (1998). Handbook for
family planning operations research design. New York: Population council.
64
Fjelstad, O. and Semboja, J. (2001). “Why people pay taxes: The case of the
development levy in Tanzania”. World Development, 29(12), 2059-2074.
Fredman. M. and Roserman, T. (1988). Management in Organizations, New York:,
Prentice Hall.
Gramick, H. and Scott, W. (1982). “Tax Evasion and Mechanisms of social control:
A comparison with grand and petty theft”, Journal of Economic Psychology,
2, 213-230.
Hart, A. G. (1970). Fiscal policy in Latin America. Journal of Political Economy2,
213-230.
Herzberg, F. (1968). One more time: how do you motivate employees? Harvard
Business Review, 46, 213-236.
Holmes, W. (1905). Favourate Quotes. Collector of Internal Revenue, 275, 213-220.
Indaidoo, K. (1997). Collection and enforcement procedure: a proposal for the tax
administration in Ghana. Legon, University of Ghana Press.
Internal Revenue Servive, (2009). Procedure Manual for tax collection. House
Journal of the Internal Revenue Service. 2, 213-230.
Kaldor, N. (1962). An expenditure Tax. London: Urwin University Book.
Kothari, C. K. (1999). Research Methodology: Methods and Techniques, Wiley
Eastern Limited, New Delhi: New Age Publisher.
Legislative Council Debate Session, (1943). History of the Income tax Ordinance.
Public Finance.
Masaru, M. and Masato, N. (1986). The municipal financial planning model: A
simultaneous.
Mullins L. J. (2005). Management and organizational behavior. New Jersey,
65
Prentice Hall.
Nikchehreh, G. M. (2002). Investigation of the Effective Factors in Tax
Collection,Unpublished M.A. thesis. Tehran University.
Ojong, M. O. (2002). Factors that inhibit the performance of local government
generally “Journal of Economic Psychology” 2, 213-230.
Olga, C. (2003). Quality Management. Ontario, Windsor University Press and P.
(1993). Economic Effect of fundamental Tax Reform. New York, Brookings
Institute Press.
Parasuraman, M. and Zeithaml, A. (1982). Making groups effective. San Francisco,
Jossey-Bass.Pope, J. (1995). The compliance cost of major taxes in Australia:
Tax compliance cost-measurement and policy. Institute for Fiscal Studies.
Melbourne University, Australia.
Patton, M. Q. (2002). Qualitative, evaluation methods. beverly Hills, Sage
Publications.
Peters. T. Walterman, R. (1982). “ In search of excellence: Lessons American’s Best
Run Campanies” New York: Sage Publication.
Prest, A. R. (1985). Finance in Developing Countries. London, Butler and Tanner
Limited. regression equations and goal programming approach, European
Journal of Operation Research, 2, 213-230.
Richard, M. B. and Oliver, O. (1975). Readings on Taxation in Developing
Countries. (3rd Ed). Baltimore, The John Hopkins University Press.
Sarantakos, S. (2006). Social Research (3rd Ed). London, Macmillan Press Ltd.
Taghavinezhadian, S. H. (1990). Investigation of Effects of the Organizational
Structure on the Sand. New Delhi: Baath Publications.
66
TRA. (1995/96). Mission, Vision and Core Values of the new Tanzania Revenue
Authority
Twaweza Private Organization report (2010). Dar es Salaam, Tanzania.
Vaillancourt, F. (1987). The compliance cost of Taxes on Business and individuals:
A review of the evidence. Public Finance. 14(2), 465-472.
Walterman, R. Jr. Peters, T. and Phillips, Jr.(1980). ” Structured Is not
Organization “ In Business Horizons 233,14-26.

67
APPENDICES Appendix I: Questionnaire
Effectiveness Monitoring On Revenue Collection in TRA; Through Application
of Mckinsey 7s Model Approach: Case Of Kinondoni Municipality
The main objective of this study is to determine effective monitoring on revenue
collection in TRA; through application of 7s Mckinsey models approach; case of
kinondoni municipality. This interview schedule is designed to elicite information
regarding this research work. Information given will soley be used for this research.
You are also assured of full confidentiality, privacy and anonymity of any
information that you provide. You’re kindly requested to answer the questions as
frankly and openly as you can. Please make a tick [√] where appropriate. Thanks for
your co-operation.
1. AREA: A
Position of respondent …………………………………..Location: …………………
2. AREA: B PERSONAL PARTICULARS
(i) Gender: Male [ ] Female [ ] Level of Education:
Form 4 [ ], Form 6 [ ], Diploma [ ], Adv. /Dip, Undergraduate [ ], Masters [ ],
PhD [ ]
(ii) Working experience in this organization/ business; Less than 2 years [ ],2-5
years [ ], 6-10 years [ ] Over 10 years [ ]
(iv) How do you see the importance of effective monitoring on revenue collection
in TRA? VI =Very important I =Important DK =Don’t know NI =Not important.
NIA =Not Important at All
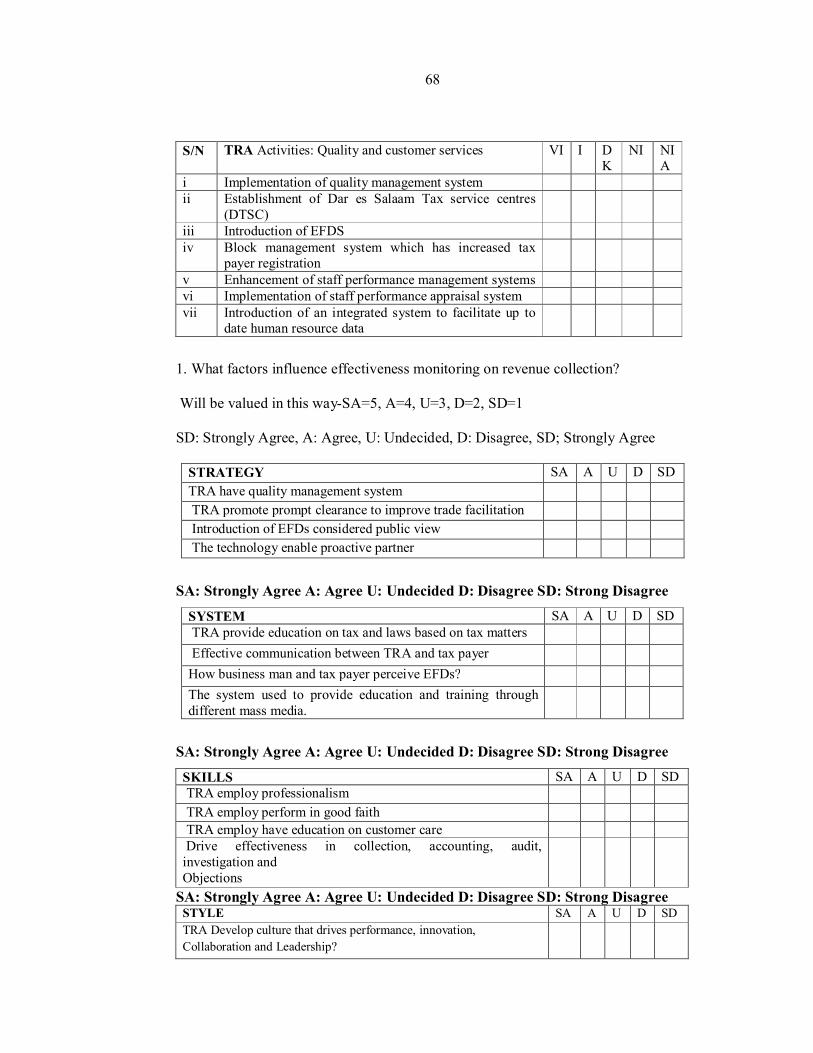
68
S/N TRA Activities: Quality and customer services VI I DK
NI NIA
i Implementation of quality management system ii Establishment of Dar es Salaam Tax service centres
(DTSC)
iii Introduction of EFDS iv Block management system which has increased tax
payer registration
v Enhancement of staff performance management systems vi Implementation of staff performance appraisal system vii Introduction of an integrated system to facilitate up to
date human resource data
1. What factors influence effectiveness monitoring on revenue collection?
Will be valued in this way-SA=5, A=4, U=3, D=2, SD=1
SD: Strongly Agree, A: Agree, U: Undecided, D: Disagree, SD; Strongly Agree
STRATEGY SA A U D SD TRA have quality management system TRA promote prompt clearance to improve trade facilitation Introduction of EFDs considered public view The technology enable proactive partner
SA: Strongly Agree A: Agree U: Undecided D: Disagree SD: Strong Disagree
SYSTEM SA A U D SD TRA provide education on tax and laws based on tax matters Effective communication between TRA and tax payer How business man and tax payer perceive EFDs? The system used to provide education and training through different mass media.
SA: Strongly Agree A: Agree U: Undecided D: Disagree SD: Strong Disagree
SKILLS SA A U D SD TRA employ professionalism TRA employ perform in good faith TRA employ have education on customer care Drive effectiveness in collection, accounting, audit, investigation and Objections
SA: Strongly Agree A: Agree U: Undecided D: Disagree SD: Strong Disagree STYLE SA A U D SD TRA Develop culture that drives performance, innovation, Collaboration and Leadership?

69
TRA Improve strategic human resource capacity Increase ICT availability and utilization TRA Enhance good governance capability
SA: Strongly Agree A: Agree U: Undecided D: Disagree SD: Strong Disagree STRUCTURE SA A U D SD TRA administration enable administrative and policy improvements
TRA Promote segment focused education and service to drive voluntary compliance
Develop culture that drives performance,innovation,collaboration and Leadership
Enable administrative and policy improvements
2. What factors needed to ensure effective monitoring on revenue collection
performance? The following statements describe the factors for effectiveness
monitoring on revenue collection in TRA: case of Kinondoni Municipality. Indicate
the extent to which you agree or disagree with the statements.
SA: Strongly Agree A: Agree U: Undecided D: Disagree SD: Strong Disagree S/N Issue SA A U D SD I Quality staff recruitment and training Ii Open more offices and collection centre iii Staff size should be improved iv Education on tax laws are needed V Proper authorization and verification vi Technological advancement are vital vii Separation of duties in handling accounting transactions viii Good communication within the organization effectively ix Use of IT resources x Verify that all transactions initiated posted in a reasonable period xi Ensure the reliability and integrity of financial information xii Power availability and stability xiii Physical location of business entities to be established and
maintained
3. What are challenges facing effective monitoring on revenue collection in TRA:
case of Kinondoni municipality?

70
SA: Strongly Agree A: Agree U: Undecided D: Disagree SD: Strong Disagree
QNS HOW SA A U D SD How do TRA make things easier for the taxpayers
Simplify – Reduce the administration burden on the taxpayer through guided, automated online workflows. Assist – Address specific taxpayer queries more efficiently through context-sensitive help, and use workflows to channel queries to the right people and departments for improved response times. Engage – Improve taxpayer services through the proactive management of taxpayer or constituent relationships through e-reminders, notices and triggered alerts.
How do TRA reduce internal costs
Improve – Rationalize, decommission and upgrade outdated technology for better system efficiencies, enhanced workflow and a modernized technology infrastructure. Equip – Issue staff with the right tools and information that will help them do their jobs more efficiently and effectively Automate – Streamline, improve and automate tax collection and calculation processes whenever possible
How do TRA improve collections and compliance
Self Service – Promote voluntary compliance and convenience through easy to use “always on” self-service models Act – Deploy high performance analytics to uncover, track, analyze, and address non-compliance quickly and effectively Adapt – Leverage data to research and improve compliance measures and better customize taxpayer services
4. Revenue collected by TRA is effectively monitored and put into use?
(a) SA- Strongly Agree, (b)A- Agree, (c)NS-Not sure, (d) D- disagree
(e) SD- Strongly disagree

71
5. The method used to collect revenue in Kinondoni municipality is it appropriate?
(a) SD- Strongly Agree, (b) A-Agree, (c) NS - Not sure (d) D-disagree (e)
SD-Strongly Agree
6. How do super ordinate goals share values works? : Strategy, Structure, System,
Staff, Style, Skills. To what extent do you see with the following statement towards
to effectiveness monitoring revenue collection management? (SA =Strongly Agree,
A = Agree, DK = Don’t know D=Disagree)
S/N Issue SA A DK D i There is proper authorization of transactions by proper
officials
ii There is clear segregation of duties iii There is proper check of income, collection and
expenditure records
iv There is proper control over cash, receipts, banking, payment and checks on bank reconciliation.
v The financial statements of the organization audited each year.
vi All disbursements made by cheque except for small amount.
vii Efficient and effective operations viii
Provide a mechanism for management to monitor the achievement of operational goals and objectives.
ix
Ensure compliance with the many federal, state and local laws and regulations affecting the operations of our business
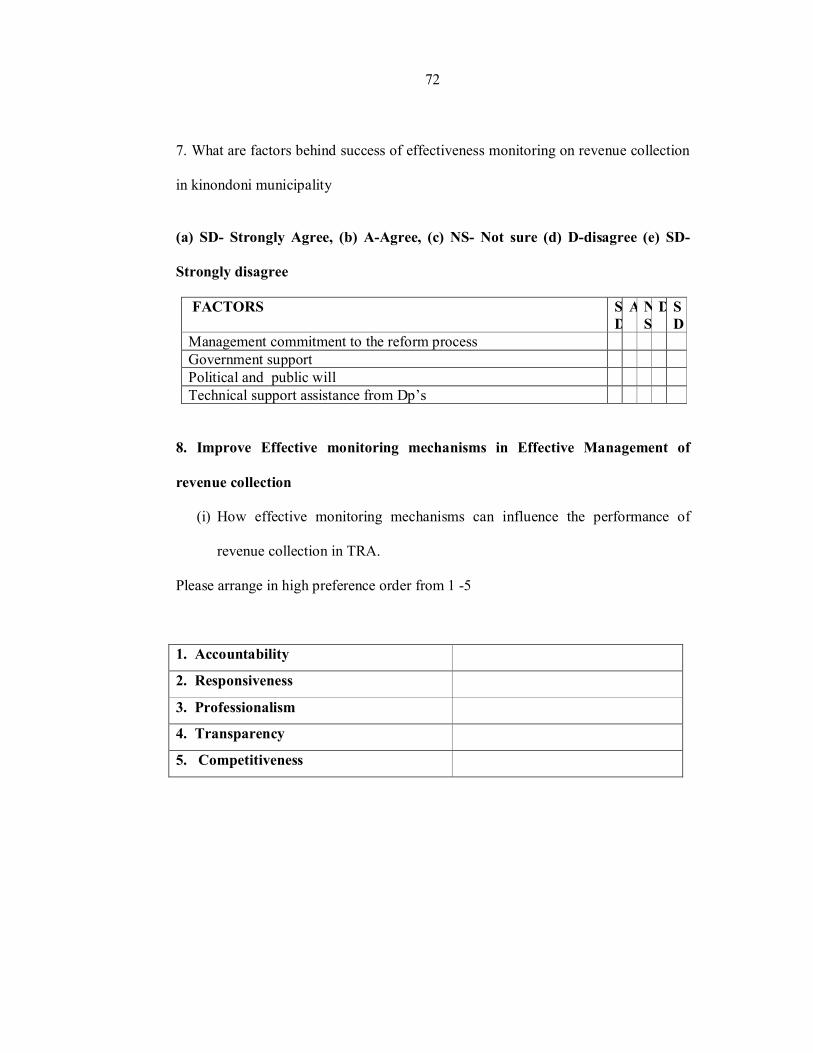
72
7. What are factors behind success of effectiveness monitoring on revenue collection
in kinondoni municipality
(a) SD- Strongly Agree, (b) A-Agree, (c) NS- Not sure (d) D-disagree (e) SD-
Strongly disagree
FACTORS SD
A NS
D SD
Management commitment to the reform process Government support Political and public will Technical support assistance from Dp’s
8. Improve Effective monitoring mechanisms in Effective Management of
revenue collection
(i) How effective monitoring mechanisms can influence the performance of
revenue collection in TRA.
Please arrange in high preference order from 1 -5
1. Accountability
2. Responsiveness
3. Professionalism
4. Transparency
5. Competitiveness

73
Appendix II: TRA Organisation Structure