Embed Size (px)
Citation preview
HAL Id: tel-02162122https://tel.archives-ouvertes.fr/tel-02162122
Submitted on 21 Jun 2019
HAL is a multi-disciplinary open accessarchive for the deposit and dissemination of sci-entific research documents, whether they are pub-lished or not. The documents may come fromteaching and research institutions in France orabroad, or from public or private research centers.
L’archive ouverte pluridisciplinaire HAL, estdestinée au dépôt et à la diffusion de documentsscientifiques de niveau recherche, publiés ou non,émanant des établissements d’enseignement et derecherche français ou étrangers, des laboratoirespublics ou privés.
Application of metabolomics for the determination ofserum biomarkers aiding the prognosis for septic shockand hepatocellular carcinoma using Mass Spectrometry
and ¹H NMR spectroscopy based approachesZhicheng Liu
To cite this version:Zhicheng Liu. Application of metabolomics for the determination of serum biomarkers aiding theprognosis for septic shock and hepatocellular carcinoma using Mass Spectrometry and ¹H NMR spec-troscopy based approaches. Medicinal Chemistry. Université Sorbonne Paris Cité, 2017. English.�NNT : 2017USPCD018�. �tel-02162122�
THÈSE
en vue de l’obtention du grade de
Docteur de l’UNIVERSITE PARIS XIII
Ecole doctorale Galilée
Spécialité : Chimie
Présentée et soutenue publiquement par
Zhicheng LIU
Le 6 février 2017
Directeur de thèse : Pr. Philippe Savarin
Jury
Rapporteurs Dr. Christophe Junot (CEA, Saclay)
Pr. Patrick Emond (Université de Tours, Tours)
Examinateurs Pr. Guowang Xu (DICP, Dalian, Chine)
Pr. Laurence Le Moyec (Université Evry, Evry)
Dr. Mohamed Nawfal Triba (Université Paris 13, Bobigny)
Pr. Philippe Savarin (Université Paris 13, Bobigny)
Application of metabolomics for the determination of serum biomarkers
aiding the prognosis for septic shock and hepatocellular carcinoma using
Mass Spectrometry and 1H NMR spectroscopy based approaches

Acknowledgement
Above all, I would like to express my sincere respects and thanks to my doctorial
supervisor, Pr. Philippe Savarin. It was him who brought the possibility of this doctorial
work to me and granted me too much help that I will never ever forget. He set an
example to me that one should be conscientious and diligent when he is at work and
should be kind and patient when he gets along with others. Even though he is the
leader of the laboratory, who is always too busy indeed, he is still open to answer my
questions, timely and even modestly. I was pretentious before I met Pr. Savarin,
however, I realized that I had no reason to be that proud when I witnessed his humility.
Thus, for me, Pr. Savarin is not only the tutor who imparts his knowledge but a senior
who impacts my personality as well.
I would like to thank Pr. Guowang Xu, the director of our Chinese cooperative
laboratory who accepted me in his laboratory and come all the way for my defense.
During the one year and a half I passed in Dalian, it was a great honor that I was well
accommodated by him with his generosity and geniality. He is a powerful scientific
leader who has a keen insight and is always open to discussion. I was very impressed
by his expertise and his enthusiasm in work which encourage me to learn from him
and to pay more efforts in the following work.
I am really thankful to Dr. Mohamed Triba, Pr. Edith Hantz, Dr. Nadia Bouchemal, Dr.
Roland Amathieu, Agnes Victor-Bala and Pr. Marc Lamy La Chapelle in our French
laboratory for all of their help and care to me during this thesis work. They are all
competent in their own field and have offered me a lot of advises. Moreover, they are
so friendly to me that I feel never isolated in a foreign country. Also, I am equally
thankful to all the other staffs in the Chinese laboratory, especially to Dr. Peiyuan Yin
for all he has done for installing me in Dalian and for his constructive suggestions to
my work; to Dr. Yang Liu for teaching me biological knowledge with his patience and
amity; and to Yanli Li for all her work.

I need to appreciate to all the fellows in the both laboratories. Especially to Dr. Jieyu
Zhao, Dr. Yanni Zhao, Dr. Jia Li, Dr. Junjie Zhang, Dr. Xinyu Liu and Dr. Corentine
Goosense for their guidance and advises in the experiences and in the manipulations
with the apparatus and software. And to Bohong Wang, Lichao Wang, Zaifang Li,
Yongtao Liu, Yang Wang, Jiao Wang, Yang Ouyang, Yanqing Fu, Yuansheng Zhang and
Xiangpin Lin for their companion.
I want to thank to Pr. Christophe Junot and Patrick Emond who have accepted to judge
this thesis work and to be the reporters. My thanks are equal to Laurence Le Moyec
who has accepted to assist in the jury.
I am also thankful to the workers in hospital Jean Verdier where served us all the
clinical samples, to Dr. Pierre Nahon and Nathalie Barget for their work.
Finally, I should thank to all my family and my friends who always support and
encourage me during my life.
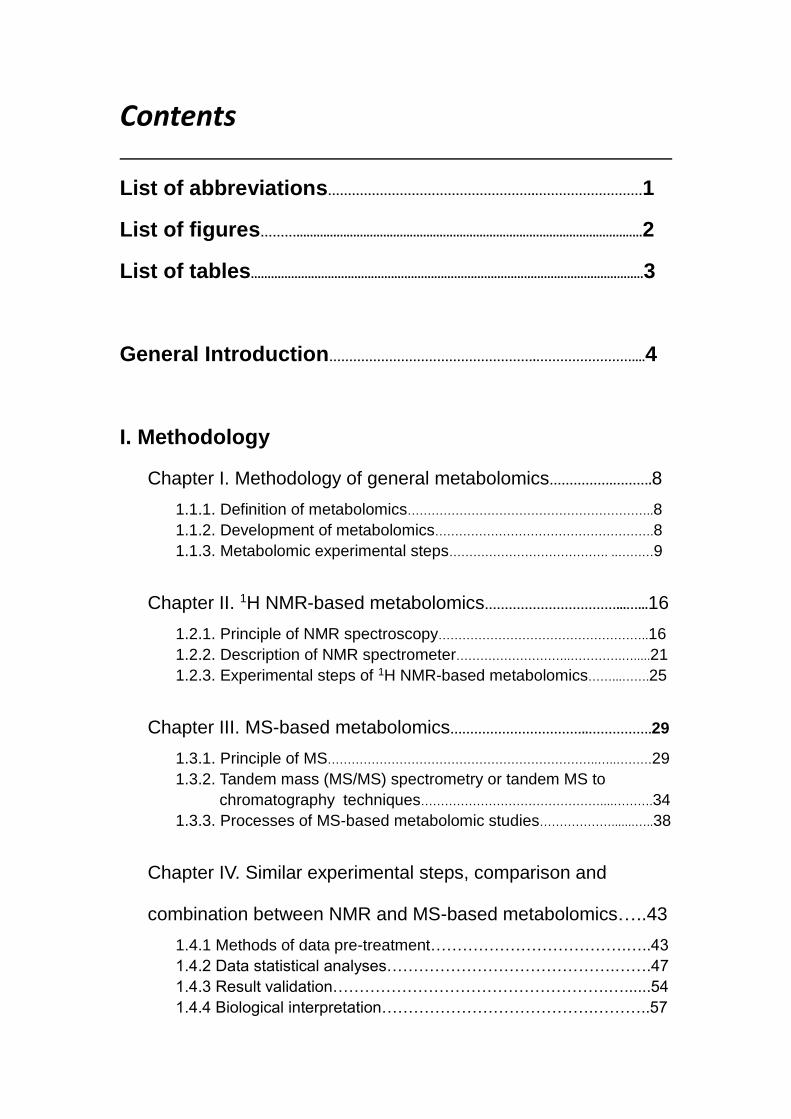
Contents
List of abbreviations…………………………………………….………………………1
List of figures………........................................................................................................2
List of tables......................................................................................................................3
General Introduction…………………………………………….……………………....4
I. Methodology
Chapter I. Methodology of general metabolomics…………….……….8
1.1.1. Definition of metabolomics……………………………………………………..8
1.1.2. Development of metabolomics……………………………………………….8
1.1.3. Metabolomic experimental steps…………………………………. ..………9
Chapter II. 1H NMR-based metabolomics……………………………...…...16
1.2.1. Principle of NMR spectroscopy……………………………………………..16
1.2.2. Description of NMR spectrometer………………………..………….….....21
1.2.3. Experimental steps of 1H NMR-based metabolomics……...…….25
Chapter III. MS-based metabolomics……………………………..…………….29
1.3.1. Principle of MS…………………………………………………………..…..………29
1.3.2. Tandem mass (MS/MS) spectrometry or tandem MS to
chromatography techniques………………………………………....……….34
1.3.3. Processes of MS-based metabolomic studies……………….......…..38
Chapter IV. Similar experimental steps, comparison and
combination between NMR and MS-based metabolomics…..43
1.4.1 Methods of data pre-treatment……………………………….…..43
1.4.2 Data statistical analyses…………………………………….…….47
1.4.3 Result validation…………………………………………….…......54
1.4.4 Biological interpretation………………………………….………..57
1.4.5 Comparison and combination between NMR and MS-based
metabolomics ………………………………………………………….....57
II. Metabolomic studies of sepsis and septic shock…..59
2.1. Introduction of sepsis and septic shock……………………………………..……..59
2.2. State of art for metabolomic studies about sepsis and septic shock...60
2.2.1. Early diagnosis……………………………………………………………………....60
2.2.2. Prognosis……………………………………………………………………………….61
2.2.3. Other metabolomic studies concerning sepsis……………………….62
2.3. Experimental research: Determination of metabolic differences
between the septic shock survivors and survivors............................................... 64
2.3.1. Study 1: Application of LC-MS-based metabolomics method in
differentiating septic survivors from non-survivors….....65
2.3.2. Study 2: Application of NMR-based metabolomics in predicting
the septic shock mortality………………….………………….….74
2.3.3 Conclusion to the first part of experimental research…………..90
III. Metabolomic studies of Hepatocellular carcinoma
………………………………………………………………………………………………………..….………..91
3.1. Introduction of HCC…………………………………………………………….......….…...91
3.2. State of art for metabolomic studies of HCC…………………………….……...92
3.2.1. Metabolomics aiding the diagnosis of HCC………………………,……92
3.2.2. Improvement of HCC prognosis by metabolomics………………….94
3.2.3. Other metabolomic studies on HCC patients with/without
hepatitis…………………………………………………………………………………94
3.3. Experimental research: Determination of potential biomarkers for
predicting the HCC recurrence in the HCC patients with HCV-
infection………………………………………………………………………………….………..99
3.3.1 Study 3: Determination of potential biomarkers for predicting the
HCC recurrence in the HCC patients with HCV-infection……….99
3.3.2 Conclusion to this part of experimental research …………….……134
General Conclusion and perspectives…………………..………..135
Appendix……………………………………………………………………………………………138
References………………………………………………………………………………………..153
5
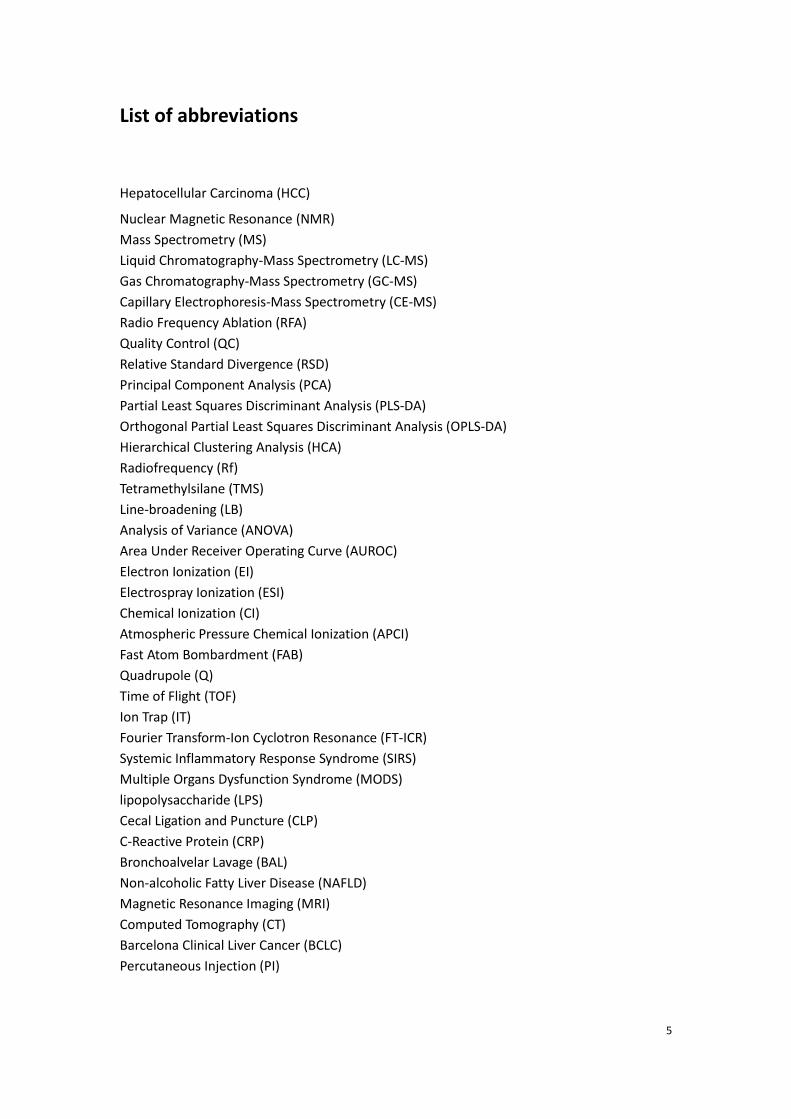
List of abbreviations
Hepatocellular Carcinoma (HCC)
Nuclear Magnetic Resonance (NMR)
Mass Spectrometry (MS)
Liquid Chromatography-Mass Spectrometry (LC-MS)
Gas Chromatography-Mass Spectrometry (GC-MS)
Capillary Electrophoresis-Mass Spectrometry (CE-MS)
Radio Frequency Ablation (RFA)
Quality Control (QC)
Relative Standard Divergence (RSD)
Principal Component Analysis (PCA)
Partial Least Squares Discriminant Analysis (PLS-DA)
Orthogonal Partial Least Squares Discriminant Analysis (OPLS-DA)
Hierarchical Clustering Analysis (HCA)
Radiofrequency (Rf)
Tetramethylsilane (TMS)
Line-broadening (LB)
Analysis of Variance (ANOVA)
Area Under Receiver Operating Curve (AUROC)
Electron Ionization (EI)
Electrospray Ionization (ESI)
Chemical Ionization (CI)
Atmospheric Pressure Chemical Ionization (APCI)
Fast Atom Bombardment (FAB)
Quadrupole (Q)
Time of Flight (TOF)
Ion Trap (IT)
Fourier Transform-Ion Cyclotron Resonance (FT-ICR)
Systemic Inflammatory Response Syndrome (SIRS)
Multiple Organs Dysfunction Syndrome (MODS)
lipopolysaccharide (LPS)
Cecal Ligation and Puncture (CLP)
C-Reactive Protein (CRP)
Bronchoalvelar Lavage (BAL)
Non-alcoholic Fatty Liver Disease (NAFLD)
Magnetic Resonance Imaging (MRI)
Computed Tomography (CT)
Barcelona Clinical Liver Cancer (BCLC)
Percutaneous Injection (PI)
6
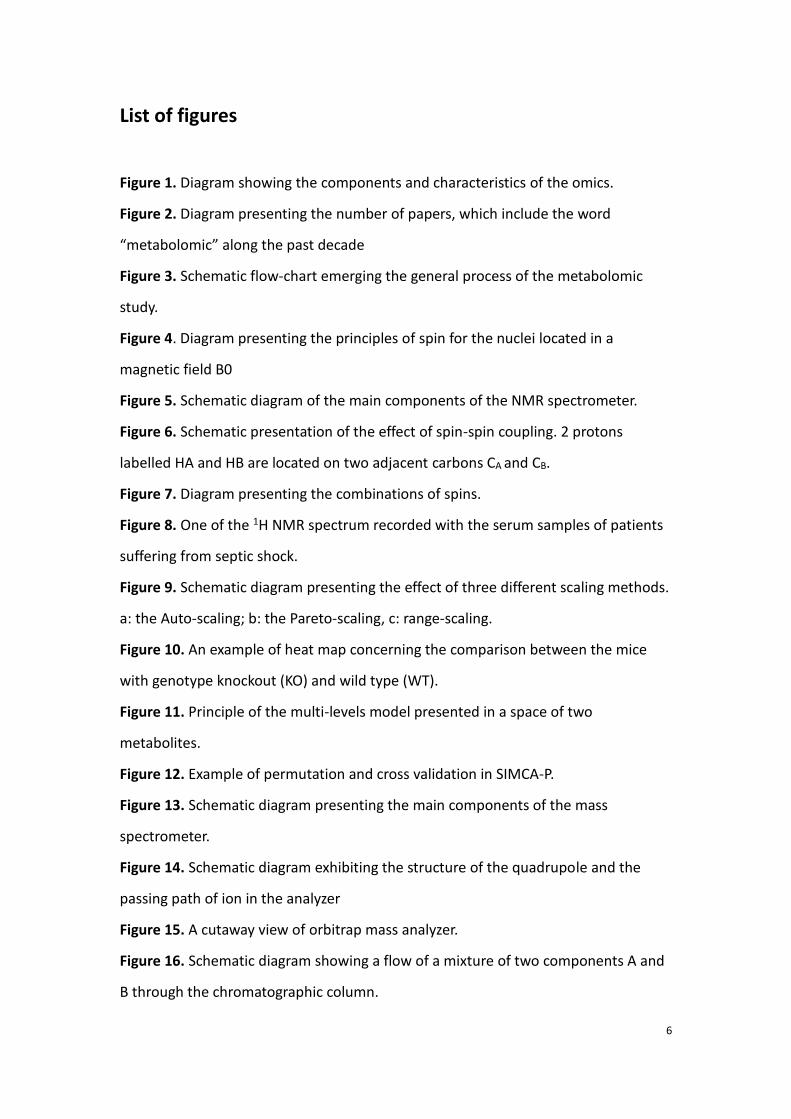
List of figures
Figure 1. Diagram showing the components and characteristics of the omics.
Figure 2. Diagram presenting the number of papers, which include the word
“metabolomic” along the past decade
Figure 3. Schematic flow-chart emerging the general process of the metabolomic
study.
Figure 4. Diagram presenting the principles of spin for the nuclei located in a
magnetic field B0
Figure 5. Schematic diagram of the main components of the NMR spectrometer.
Figure 6. Schematic presentation of the effect of spin-spin coupling. 2 protons
labelled HA and HB are located on two adjacent carbons CA and CB.
Figure 7. Diagram presenting the combinations of spins.
Figure 8. One of the 1H NMR spectrum recorded with the serum samples of patients
suffering from septic shock.
Figure 9. Schematic diagram presenting the effect of three different scaling methods.
a: the Auto-scaling; b: the Pareto-scaling, c: range-scaling.
Figure 10. An example of heat map concerning the comparison between the mice
with genotype knockout (KO) and wild type (WT).
Figure 11. Principle of the multi-levels model presented in a space of two
metabolites.
Figure 12. Example of permutation and cross validation in SIMCA-P.
Figure 13. Schematic diagram presenting the main components of the mass
spectrometer.
Figure 14. Schematic diagram exhibiting the structure of the quadrupole and the
passing path of ion in the analyzer
Figure 15. A cutaway view of orbitrap mass analyzer.
Figure 16. Schematic diagram showing a flow of a mixture of two components A and
B through the chromatographic column.
7
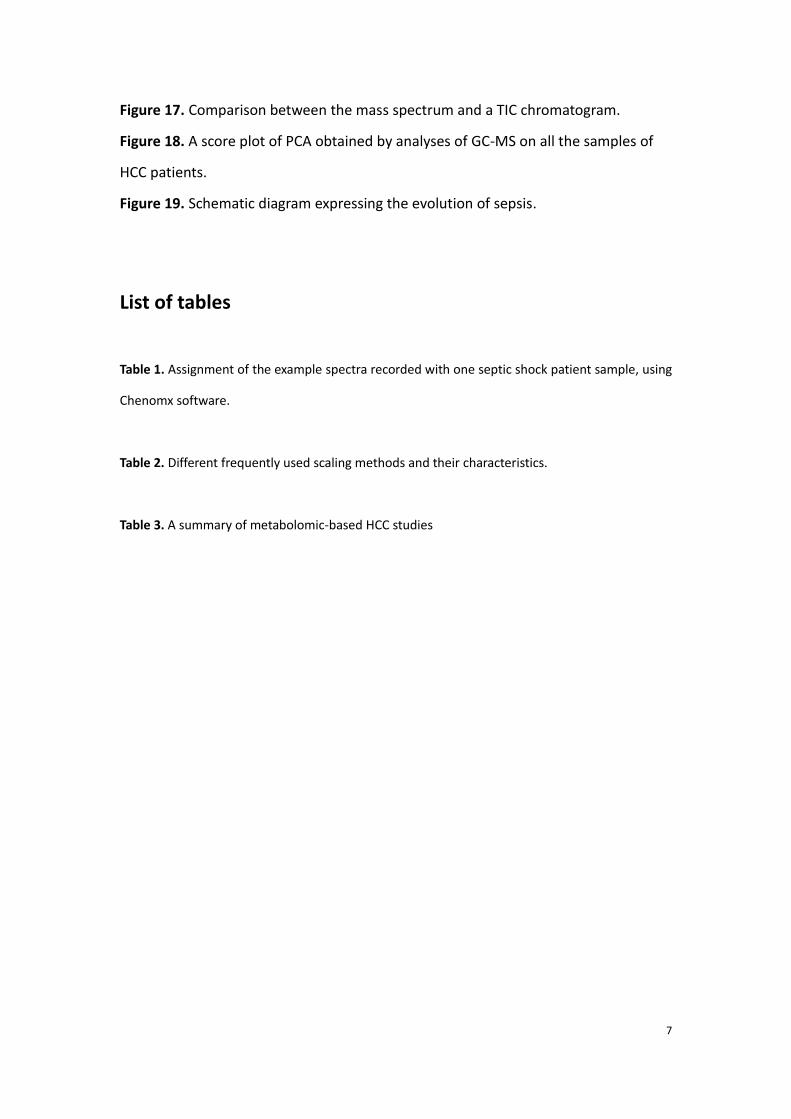
Figure 17. Comparison between the mass spectrum and a TIC chromatogram.
Figure 18. A score plot of PCA obtained by analyses of GC-MS on all the samples of
HCC patients.
Figure 19. Schematic diagram expressing the evolution of sepsis.
List of tables
Table 1. Assignment of the example spectra recorded with one septic shock patient sample, using
Chenomx software.
Table 2. Different frequently used scaling methods and their characteristics.
Table 3. A summary of metabolomic-based HCC studies
8
General Introduction
Metabolomics, which is also noted as “metabonomics”, is the systematic study
involving small biological molecular named “metabolites” [1-3]. It characterizes the
variations at the level of metabolites in living organism triggered by the endogenous
or exogenous stimulations. Metabolomics plays an important role in the systematic
biology, which is also known as “omics”, including genomics, transcriptomics and
proteomics [4]. Compared with the other “omics”, which investigate the innate
properties and modification in the organism, metabolomics is the terminal of systemic
biology that presents the definitive characteristics and even the responses to the
environment distinct in the life. Genomics determines the genome of the living bodies.
Transcriptomics and proteomics analyses the transcriptome and proteome
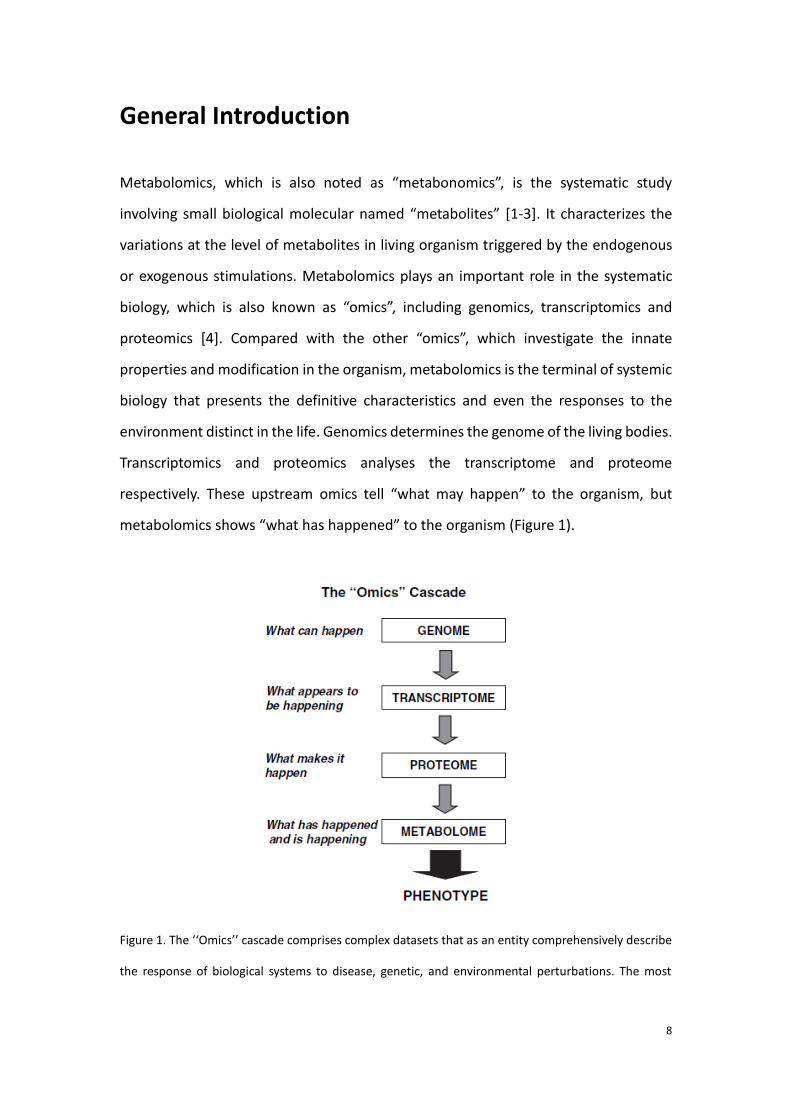
respectively. These upstream omics tell “what may happen” to the organism, but
metabolomics shows “what has happened” to the organism (Figure 1).
Figure 1. The ‘‘Omics’’ cascade comprises complex datasets that as an entity comprehensively describe
the response of biological systems to disease, genetic, and environmental perturbations. The most
9
powerful database will integrate data from all omics levels. However, of these databases the
metabolome is the most predictive of phenotype [5].
Until present, metabolomics has been widely applied in the studies of clinical medicine
[6-8], intestinal flora analysis [9], environment [10], botany [11], drug development
[12], nutrition [13], food science [14, 15].
In the latest years, diagnosis and treatment measurements are revolved by the
presence of the mention “Precision Medicine”[16] which emphasizes the individual
clinical care [16]. As metabolomics allows to investigate the whole metabolic profile of
biological systems, it provides evidence for the understanding of individual cases.
Consequently, in the clinical field, currently, metabolomic is widely applied to improve
the diagnosis and prognosis. Metabolomics is sensitive to figure out the metabolic
variation, which is correlated to certain lesions in the patients. Detection of significant
variations in some specific metabolites leads to the discovery of relevant lesions or
diseases. The metabolite indicators are named as the “biomarkers” of diagnosis [17].
As a consequence, seeking for the new reliable biomarkers, which improves the
diagnosis of disease, has been one of the main purposes of the application of
metabolomics in clinical medicine.
The other primary goal of the application of metabolomics in the field is to predict the
outcome of disease. According to the comparison of the metabolic profile in the
patients, some metabolites are likely to be sensitive and specific in the discrimination
between the patients with and without optimist prognosis. These metabolites are
therefore the biomarkers of prognosis that help to understand the severity of disease
in each individual, even at the onset of the disease, so that the personalized treatment
will be subsequently executed.
However, the individual differences and different reactions and compliances to the
therapy among the patients make it still challenging to determine new biomarkers [18].
To this end, mounting studies aim to seek out the reliable biomarkers for clinical
diagnosis or prognosis. In this study, we focused on the application of metabolomics
to seek out the biomarkers predicting the outcome for septic shock and for
hepatocellular carcinoma (HCC).
10
Metabolomics is usually realized based on two principal analytical methods: nuclear
magnetic resonance (NMR) spectroscopy and mass spectrometry (MS) [19]. With NMR
spectroscopy, the sample preparation is easier than MS method and the method does
no damage to the sample, and it shows a quite good reproducibility. However, its low
sensitivity and the narrow measuring concentration range are the disadvantages. MS,
which is usually coupled by chromatography or by capillary electrophoresis, shows its
excellent sensitivity and its wide dynamic range and a larger metabolome coverage.
Actually, the complementarity of the two techniques in metabolomic study has been
well revealed [20]. Consequently, one of the objectives of this study is to accomplish
the metabolomic studies using both 1H NMR spectroscopy and mass spectrometry.
The project was carried out by the collaboration between the team of “NMR
metabolomic” from the Chimie, Structure, Propriétés de Biomatériaux et d’Agents
Thérapeutiques (CSPBAT) laboratory of University Paris XIII (Bobigny, France) and the
Key Laboratory of Separation Science for Analytical Chemistry from Dalian institute of
chemistry physics (DICP, Dalian, China). NMR spectroscopy and MS based metabolomic
studies are respectively finalized in the two laboratories. The thesis work was also in
close collaboration with Jean Verdier University Hospital (Bondy, Paris, France).
This thesis is composed by four parts: general introduction, methodology,
experimental research and conclusions with perspectives. The methodology part is
principally divided into two sections: 1H NMR-based metabolomics and MS-based
metabolomics.
For the part of experimental research, the first study aims to understand the
differences in the metabolic profile of serum between the surviving and non-surviving
patients in the early stage of septic shock by liquid chromatography-mass
spectrometry (LC-MS) based metabolomics. A non-targeted scan of the metabolic
profile for the septic shock patients was applied using LC-MS. According to the
11
differences at the level of the metabolic profile, septic survivors were distinguished
from the septic non-survivors before clinical interventions.
The second study about the determination of biomarkers predicting the mortality for
the patients who suffered from septic shock by using 1H NMR spectroscopy.
Discriminatory models were revealed to exhibit the differences of serum metabolome
between the evolutions of septic shock survivors and non-survivors during the first 12
hours.
The last part of the study presents a work of discovery of serum biomarkers predicting
the recurrence for HCC patients before and after radio frequency ablation (RFA)
therapy. By comparing the metabolic profile of recurrent HCC patients with those
without relapse, we attempted to find out the key metabolites indicating the HCC
recurrence before and after the RFA treatment. The study was achieved by gas
chromatography-mass spectrometry (GC-MS) based metabolomics.
12
I. Methodology
Chapter I. Methodology of general metabolomics
1.1.1 Definition
Metabolomics, was first defined by Prof. Nicholson as “the quantitative measurement
of the dynamic multiparametric metabolic response of living systems to
pathophysiological stimuli genetic modification” [21]. The other definition from the
point of view of metabolites (small biological molecules ≤1500 Da) is the study aiming
to systematically qualify and quantify metabolites in one biological system (e.g.
biological fluid, cells, tissues, etc.) at one point of time [22].
Metabolomics is an important part of “omics” which is a general name for the studies
determining and quantifying pools of biological molecules that translate into
structures, functions, and dynamics in organisms. It consists of studies such as
genomics, transcriptomics, proteomics, metabolomics, etc. Unlike other above
mentioned “omics”, metabolomics investigates the small molecules which are the
terminal metabolites indicating not only the inner modification in organisms but also
the impact issued from the alteration of environment [23].
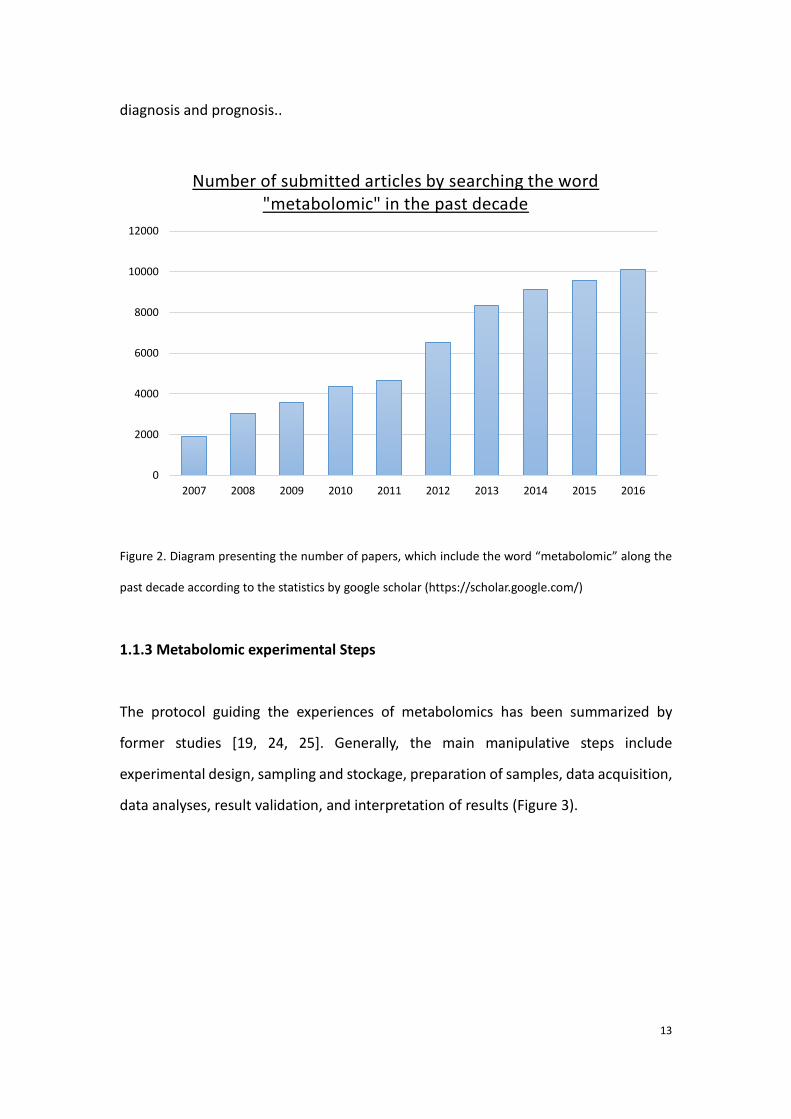
1.1.2 Development of metabolomics
The definition of “metabolomics” was first introduced for biomedical research in the
year of 90s. Until now, it has been applied in kinds of fields [6-15]. It has been well
developed in the recent years by increasing studies. Figure 2 shows the evolution of
the number of submitted articles of metabolomics in the past decade, which reveals
an increasing amount of metabolomic studies. Accordingly, a cascade of researches in
this field has been being ongoing, especially in the 21th century. The present study
focuses on the application of metabolomic seeking the biomarkers for clinical
13
diagnosis and prognosis..
Figure 2. Diagram presenting the number of papers, which include the word “metabolomic” along the
past decade according to the statistics by google scholar (https://scholar.google.com/)
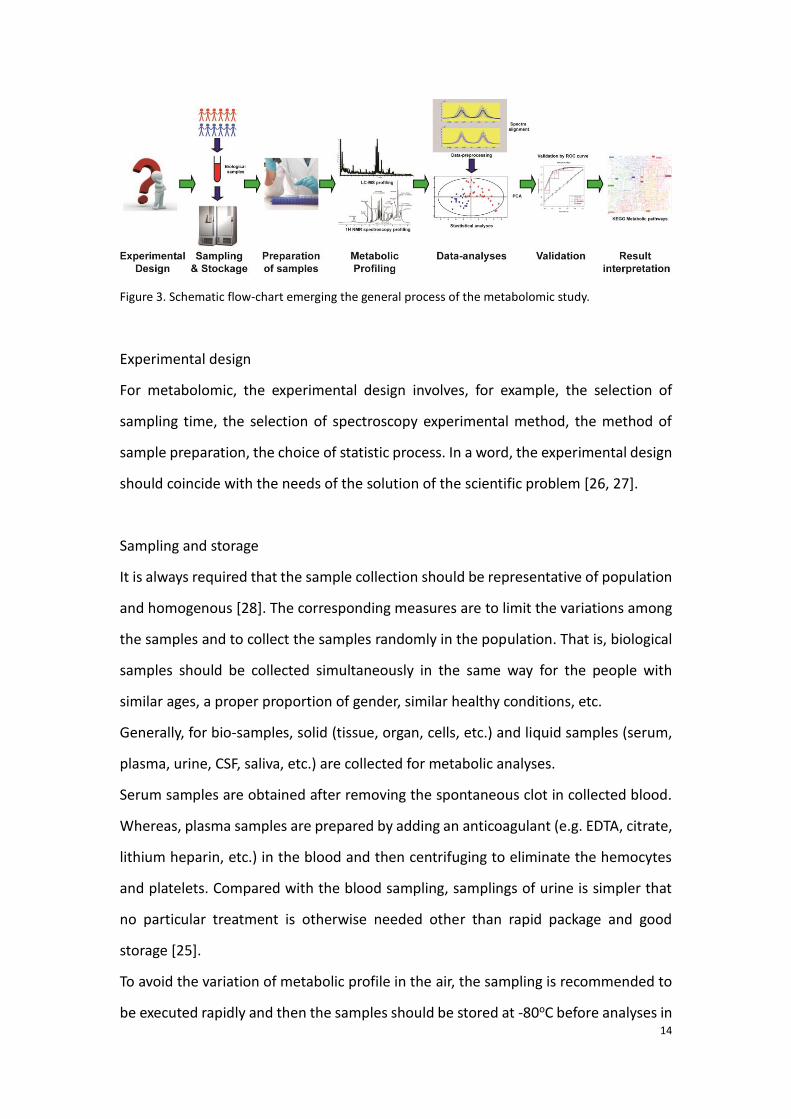
1.1.3 Metabolomic experimental Steps
The protocol guiding the experiences of metabolomics has been summarized by
former studies [19, 24, 25]. Generally, the main manipulative steps include
experimental design, sampling and stockage, preparation of samples, data acquisition,
data analyses, result validation, and interpretation of results (Figure 3).
0
2000
4000
6000
8000
10000
12000
2007 2008 2009 2010 2011 2012 2013 2014 2015 2016
Number of submitted articles by searching the word "metabolomic" in the past decade
14
Figure 3. Schematic flow-chart emerging the general process of the metabolomic study.
Experimental design
For metabolomic, the experimental design involves, for example, the selection of
sampling time, the selection of spectroscopy experimental method, the method of
sample preparation, the choice of statistic process. In a word, the experimental design
should coincide with the needs of the solution of the scientific problem [26, 27].
Sampling and storage
It is always required that the sample collection should be representative of population
and homogenous [28]. The corresponding measures are to limit the variations among
the samples and to collect the samples randomly in the population. That is, biological
samples should be collected simultaneously in the same way for the people with
similar ages, a proper proportion of gender, similar healthy conditions, etc.
Generally, for bio-samples, solid (tissue, organ, cells, etc.) and liquid samples (serum,
plasma, urine, CSF, saliva, etc.) are collected for metabolic analyses.
Serum samples are obtained after removing the spontaneous clot in collected blood.
Whereas, plasma samples are prepared by adding an anticoagulant (e.g. EDTA, citrate,
lithium heparin, etc.) in the blood and then centrifuging to eliminate the hemocytes
and platelets. Compared with the blood sampling, samplings of urine is simpler that
no particular treatment is otherwise needed other than rapid package and good
storage [25].
To avoid the variation of metabolic profile in the air, the sampling is recommended to
be executed rapidly and then the samples should be stored at -80oC before analyses in

15
order to achieve a metabolism quenching [29-31].
The processes from sample preparation to the biological interpretation will be exposed
in the following two chapters.
16
Chapter II. 1H NMR spectroscopy-based metabolomics
1.2.1. Principle of NMR spectroscopy
A. Theory of Lamor frequency
Nuclear Magnetic Resonance (NMR) is a physical phenomenon in which atomic nuclei,
in a magnetic field, absorb and then emit an electromagnetic radiation [32].
When an atomic nucleus possessing unpaired protons and neutrons (such as 1H, 13C,
15N, 31P) is located in an external magnetic B0, the proton spins with an angular speed
and a frequency, v0, called the Larmor frequency, unique for each isotope [33]. The
Larmor frequency is related to the external magnetic field B0 through the
gyromagnetic constant γ.
0 0B (1.2.1)
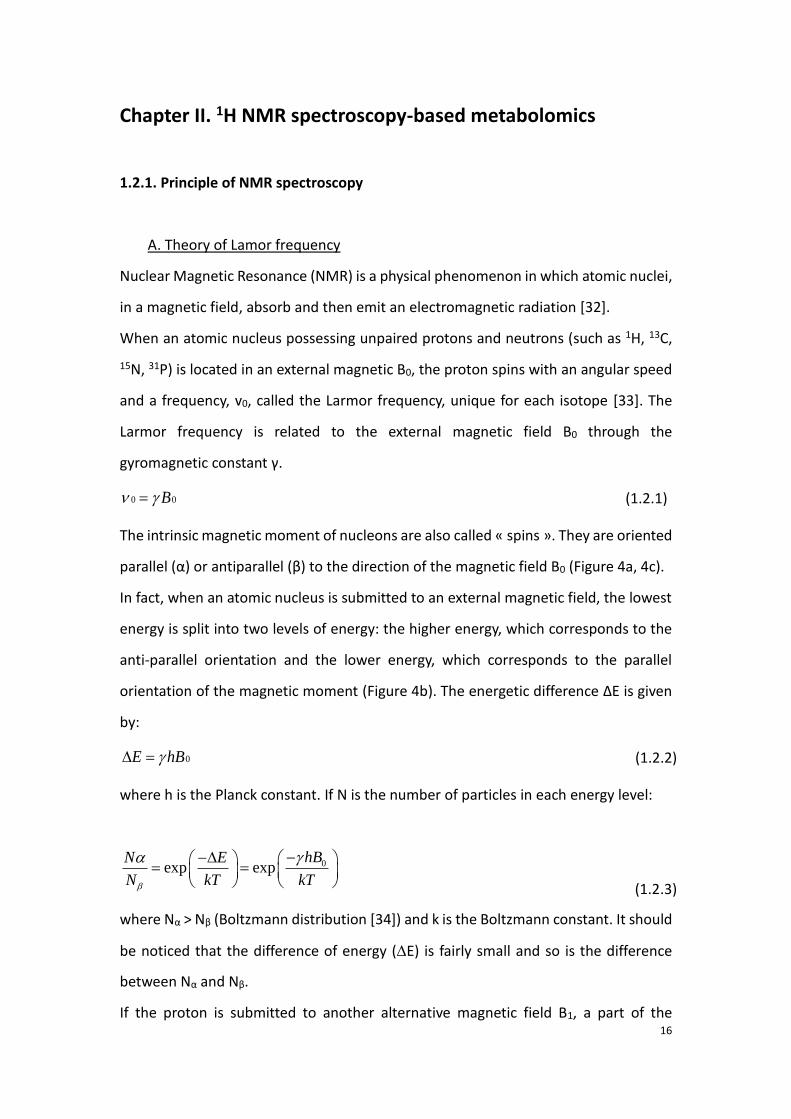
The intrinsic magnetic moment of nucleons are also called « spins ». They are oriented
parallel (α) or antiparallel (β) to the direction of the magnetic field B0 (Figure 4a, 4c).
In fact, when an atomic nucleus is submitted to an external magnetic field, the lowest
energy is split into two levels of energy: the higher energy, which corresponds to the
anti-parallel orientation and the lower energy, which corresponds to the parallel
orientation of the magnetic moment (Figure 4b). The energetic difference ΔE is given
by:
0E hB (1.2.2)
where h is the Planck constant. If N is the number of particles in each energy level:
(1.2.3)
where Nα > Nβ (Boltzmann distribution [34]) and k is the Boltzmann constant. It should
be noticed that the difference of energy (E) is fairly small and so is the difference
between Nα and Nβ.
If the proton is submitted to another alternative magnetic field B1, a part of the
0exp exphBN E
N kT kT
17
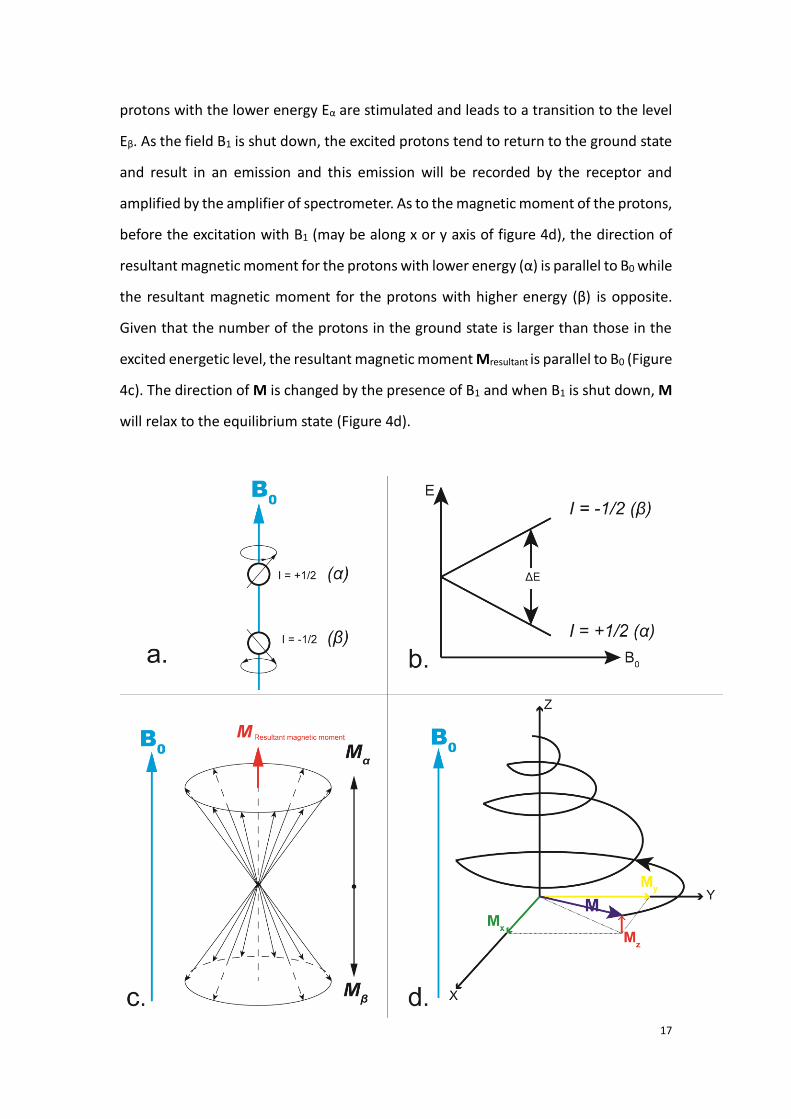
protons with the lower energy Eα are stimulated and leads to a transition to the level
Eβ. As the field B1 is shut down, the excited protons tend to return to the ground state
and result in an emission and this emission will be recorded by the receptor and
amplified by the amplifier of spectrometer. As to the magnetic moment of the protons,
before the excitation with B1 (may be along x or y axis of figure 4d), the direction of
resultant magnetic moment for the protons with lower energy (α) is parallel to B0 while
the resultant magnetic moment for the protons with higher energy (β) is opposite.
Given that the number of the protons in the ground state is larger than those in the
excited energetic level, the resultant magnetic moment Mresultant is parallel to B0 (Figure
4c). The direction of M is changed by the presence of B1 and when B1 is shut down, M
will relax to the equilibrium state (Figure 4d).
18
Figure 4. Diagram presenting the principles of spin for the nuclei located in a magnetic field B0. a: when
located in the magnetic field B0, two types of nucleolus spins are available: spin parallel to the direction
of B0 (I = +1/2, I is the spin characteristics) or spin antiparallel to B0 (I = -1/2). b: Energy splitting in the
presence of an external magnetic field. c: Resultant magnetic moments for all the spins in the B0 field
d : Once nucleus spins receives a radio frequency B1 during a short period, for the excited protons, the
direction of their magnetic moment M will be firstly changed then comes back to the equilibrium state.
B. Chemical shift and coupling
Due to the current elicited by the electron cloud, the real strength of the external field
changes. Formula 1.2.4 exposes the relation between the external field strength (B0)
and the effective field strength (Beff) for the nuclei, where σ is the screening constant.
(1.2.4)
We introduce the chemical shift δ and generally the chemical shift of tetramethylsilane
(TMS) is used as reference for 1H RMN experiences. For one standard substance, its
chemical shift is calculated by the equation 1.2.5:
(1.2.5)
where νsub is the frequency of the substance being measured; νref is the exact
frequency of the TMS, and ν0 depends on the field strength B0. As the value of the ratio
is small, δ is described by multiplying 106.Therefore, δ is presented in ppm.
Spin-spin coupling
It is difficult to identify a substance or even a chemical group only with the help of the
chemical shift. This is because the electron cloud of the chemical groups are influenced
by its chemical spatial environment, and the interaction among the groups not only
alters the original chemical shift of substance but also remolds its multiplicity of the
surrounding electron cloud.
0 1effB B
6
0
10sub ref
19
The effect is dependent on the interaction between the spins, which are located in the
magnetic field.
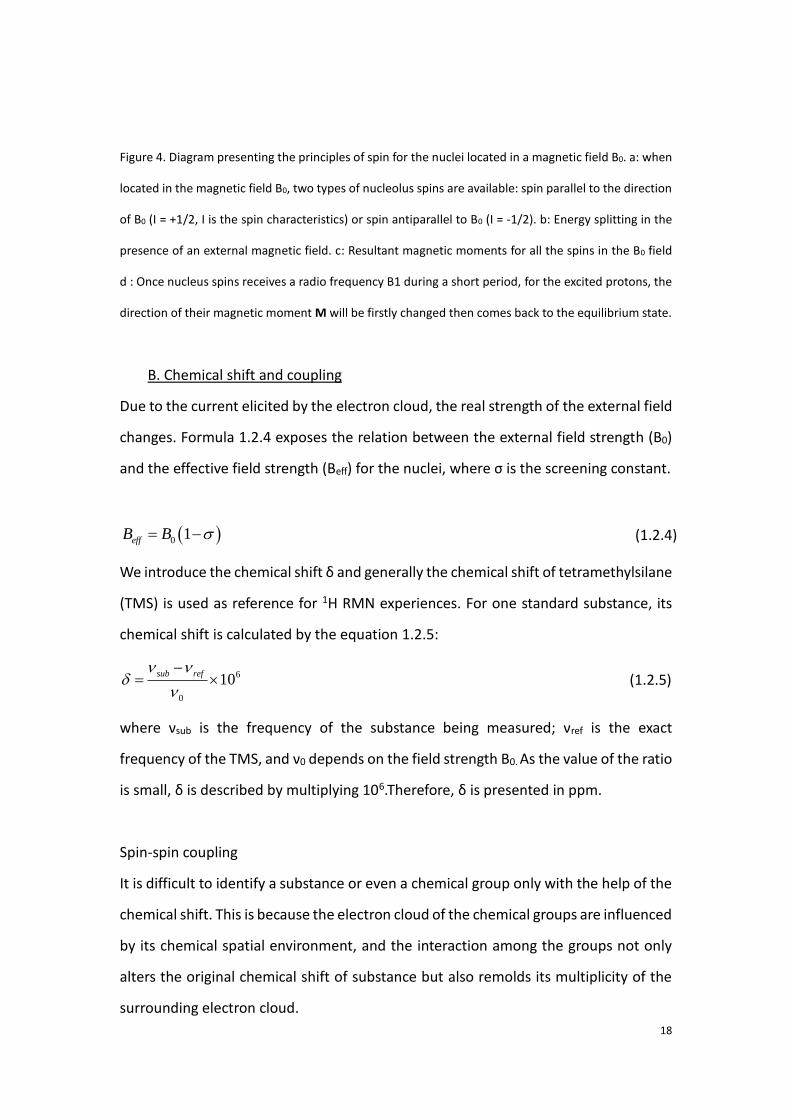
Always for the example of 1H NMR spectroscopy, a molecular model with 2 adjacent
groups of protons HA and HB is shown in the Figure 6. The chemical shift of HA is altered
by the interaction between HA and HB. And as there exists two directions of spin of HB
(Spin = +/- 1/2), two peaks are visible, representing the interaction between HB and HA.
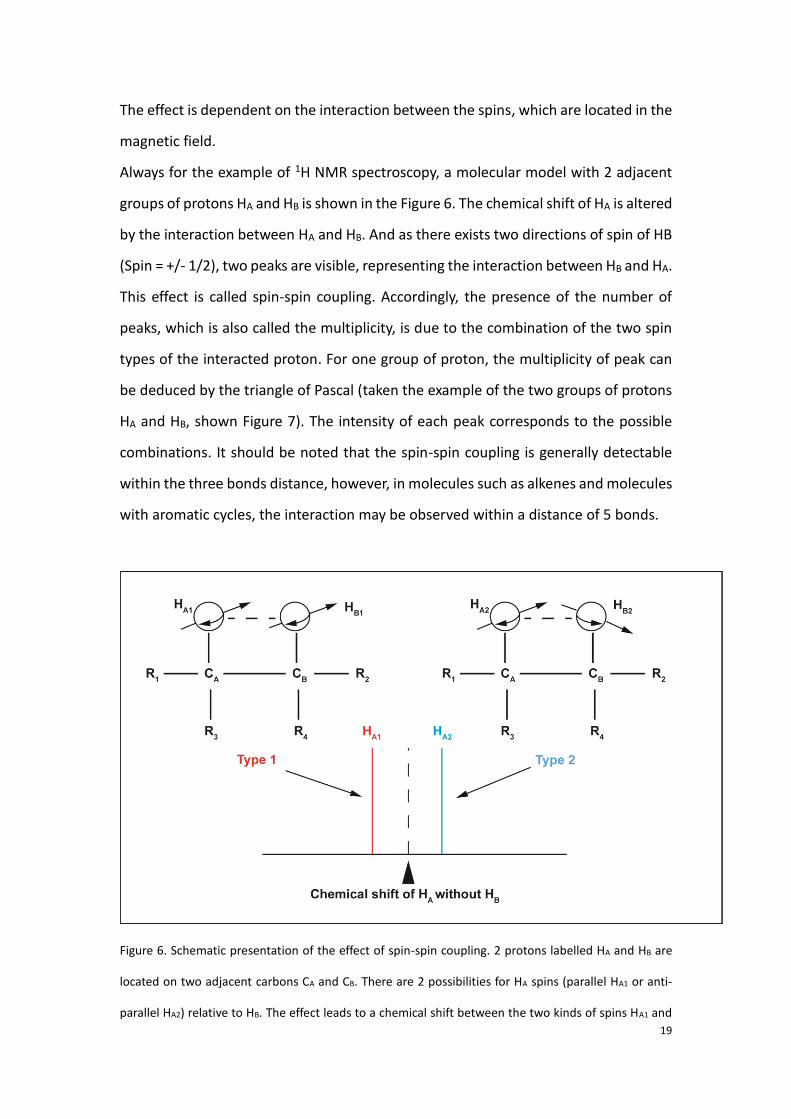
This effect is called spin-spin coupling. Accordingly, the presence of the number of
peaks, which is also called the multiplicity, is due to the combination of the two spin
types of the interacted proton. For one group of proton, the multiplicity of peak can
be deduced by the triangle of Pascal (taken the example of the two groups of protons
HA and HB, shown Figure 7). The intensity of each peak corresponds to the possible
combinations. It should be noted that the spin-spin coupling is generally detectable
within the three bonds distance, however, in molecules such as alkenes and molecules
with aromatic cycles, the interaction may be observed within a distance of 5 bonds.
Figure 6. Schematic presentation of the effect of spin-spin coupling. 2 protons labelled HA and HB are
located on two adjacent carbons CA and CB. There are 2 possibilities for HA spins (parallel HA1 or anti-
parallel HA2) relative to HB. The effect leads to a chemical shift between the two kinds of spins HA1 and
20
HA2.
Figure 7. Diagram presenting the combinations of spins. Peaks are presented by the bars in the
diagram. The intensity of each peak is presented by the height and thickness of the bar. The ratio of
intensity among the peaks is marked on the bars. (A) The law of the combination corresponds to the
triangle of Pascal (B).
C. General NMR data pre-processing
1) Appodization
Once the acquisition of spectrum is done during the Free induction Decay (FID) [35],
the spectrum is beforehand subjected to be multiplied by the factor e-tπ, named line-
broadening (LB, in Hz), which is also called appodization, prior to the transformation
of Fourier. One goal is to enhance the ratio signal/noise in the spectrum. The other
objective is to narrow the peak stretches.
2) Fourier Transform (FT)
21
The FT is the central step in NMR data processing, which transforms the time domain
signal into a frequency domain signal. After the treatment of FT, acquired signals are
converted into bell-shaped peaks whose airs represent the quantification of
corresponding compounds.
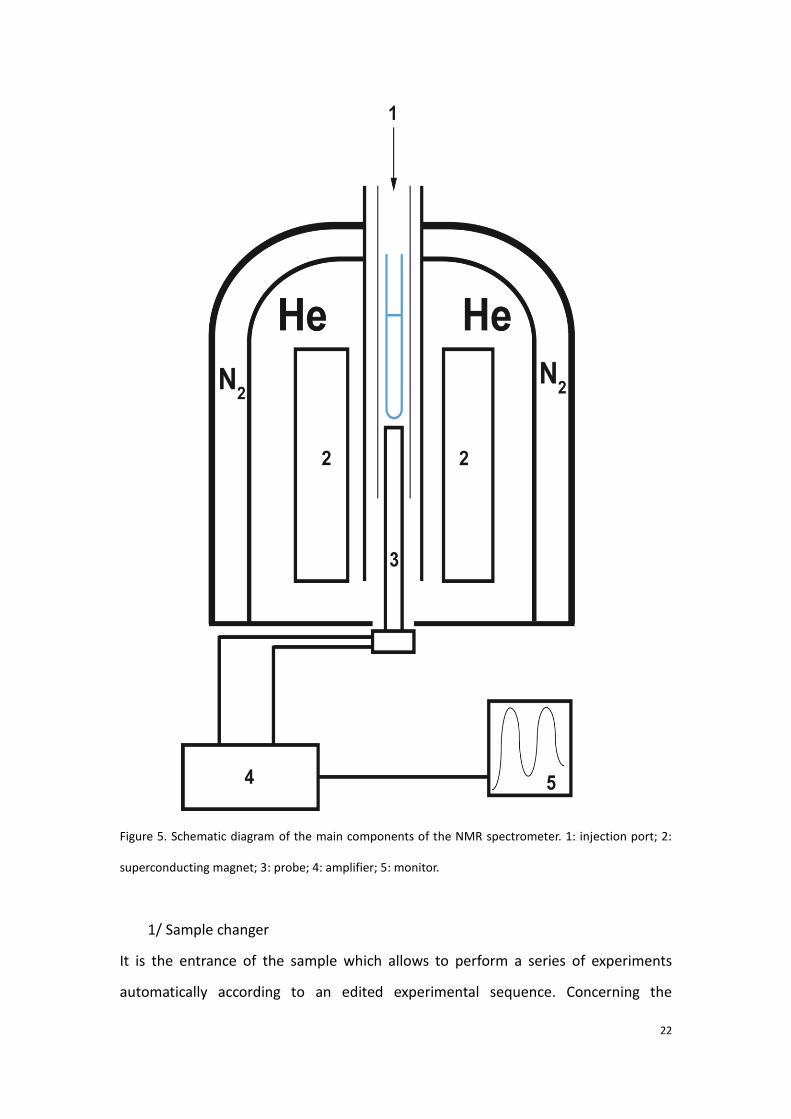
1.2.2 Description of NMR spectrometer
The main parts of the NMR spectrometry include sample changer, superconducting
magnet, probe (containing transmitter and signal receptor), amplifier and signal
processing monitor [36], the schematic diagram is presented in Figure 5.
22
Figure 5. Schematic diagram of the main components of the NMR spectrometer. 1: injection port; 2:
superconducting magnet; 3: probe; 4: amplifier; 5: monitor.
1/ Sample changer
It is the entrance of the sample which allows to perform a series of experiments
automatically according to an edited experimental sequence. Concerning the
23
metabolomic studies, typically, the biological sample is prone to evolve due to the
enzymatic reactions. Aiming at this problem, the sample changer used for sequential
metabolic studies is thermostated at low temperature (4°C).
2/Superconducting magnet
It is produced by the induction coil. The coil is immersed in the liquid helium with its
temperature at 4K to preserve the superconductivity. Meanwhile, liquid nitrogen is
filled at the outer layer of the liquid helium. It helps to isolate the environment of the
superconductor.
3/Probe
It is the core component of the instrument, in terms of exciting the nuclear spins, and
detecting the NMR signal. The sample is inserted into the probe to perform the NMR
experiment. The probe contains the radiofrequency (Rf) coils, tuned at specific
frequencies for specific nuclei in a given magnetic field. The probe also contains the
necessary hardware to control the sample temperature.
4 and 5/Signal amplifier and monitor
The received signals are accumulated by the amplifier and Fourier transform is
subsequently performed.
1.2.3. Experimental steps of NMR-based metabolomics
A. Sample preparation
In the part of NMR-based metabolomic of this thesis work, serum samples were
analyzed with a 500MHz NMR spectrometry (Bruker, Avance III). The samples were
prepared before the acquisition of spectrum. As the samples were kept in the freezer
at -80oC before the experiences, they were first thawed on the ice. Afterwards, 450 μL
of each sera sample was added in the NMR tube. 50 μL of D2O was also added into the
tube.
24
B. Water suppression using pre-saturation pulses during data acquisition
As metabolomics analyzes samples from bio-systems, which usually contain a
considerable quantity of water. The signal of H20 are aimed to be removed during the
acquisition for its high intensity and large peak masking other signals with low
concentrations which are close to it. A low power pulse at the solvent frequency and
is applied during the preparation delay. This low power pulse excites the water proton
signal such that no signal can fully accumulate and be measured. Indeed, the method
cannot remove completely the signal of water, as the peak of water remains large in
our experiences, specifically, further suppression of the region of chemical shift for the
peak of water will be introduced in the part “correction of baseline and region
suppression”.
C. Phasing
To have the peaks of the spectrum as more symmetric as possible, the phasing process
after the transform is always necessary. The available software in our laboratory for
the correction of phase include NMR pipe (https://www.ibbr.umd.edu/nmrpipe/),
Topspin (Bruker, Germany) and Chenomix (Chenomix, Canada). We denote both the
factors by “phase 0” and “phase 1” respectively. Generally, in our works, the phase for
all the spectra was corrected only by the phase 0. The uniform criterion was to balance
the two extremes of the spectrum superior or equal to 0.
D. Correction of baseline and region suppression
The appropriate definition of baseline for the NMR spectrum is basic for the following
analyses. This is because the ultimate assignment and quantification are all dependent.
Especially, in metabolomic studies, the assignment for the peaks representing
metabolites with low concentration but significant is definitely due to the
establishment of baseline. For the qualification of each peak, their intensity should be
integrated from the baseline to the top of the peak. In the current study, the regions
of chemical shift (ppm) such as (-1, 0) and (8.5, 10) were suppressed since there were
25
no signals in the regions. The region (4.8, 5.2) has also been removed because of the
present of the peak H20. And the region (3.7 4) was otherwise rejected in the study of
septic shock because the presence of large peaks in the region corresponds to the
arterial perfusion by starch, in the emergency rescue, which are not belonging to the
metabolome of patients.
C. Calibration and alignment
The variation of magnetic field, pH, salt concentration, temperature or other
instrument-related variables need to be considered [37]. The calibration is the first
general step of the alignment Introduced standard substance such as
trimethylsiylpropionic acid (TSP) or dimethylsilalpentanesulfonic acid (DSS) for being
the referred peak. Nevertheless, these organic compounds have a good affinity to
some serum proteins (e.g. Albumin) [38]. Consequently, the doublet of lactate (1.32d),
the doublet of -glucose (5.23d) and the singlet of formate (8.5s) in the spectra can be
used as the reference to calibrate the spectra.
Further, once the spectrum is calibrated at the chemical shift of the referred peak,
discrepancy of the signals of others peaks may still exist among the multiple
acquisitions. Hence, other peaks are aligned by referring to the average or by the
median of all the spectra.
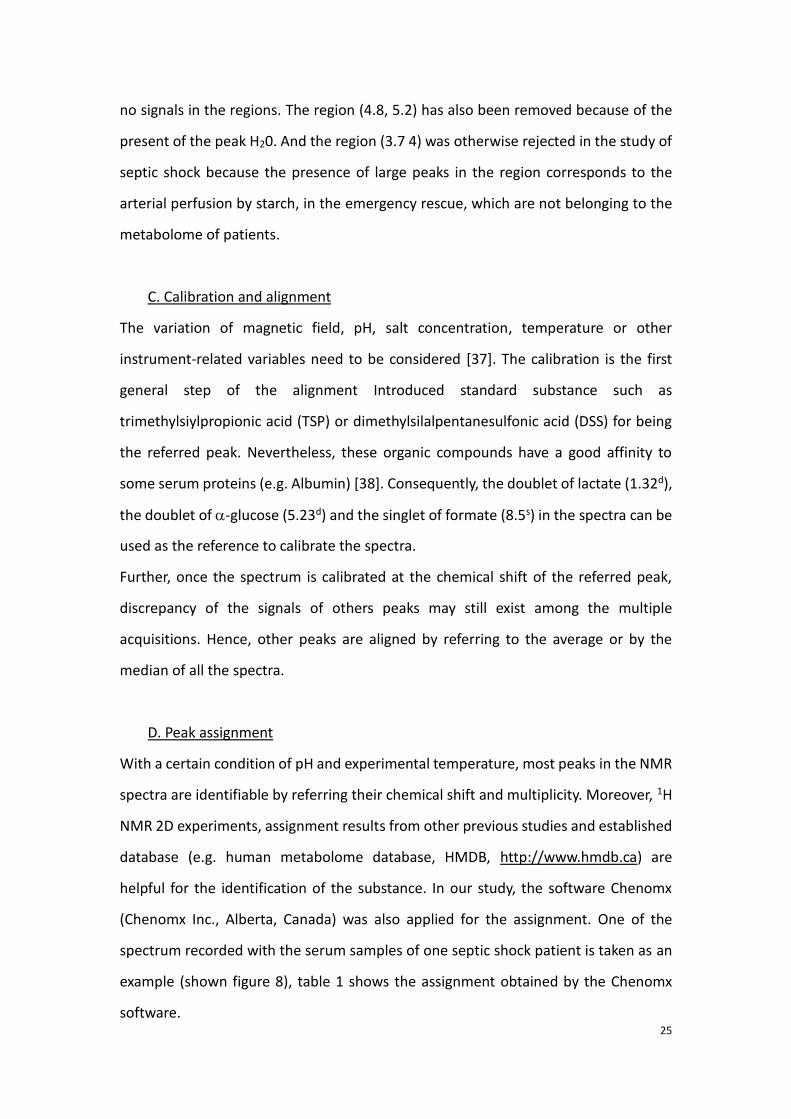
D. Peak assignment
With a certain condition of pH and experimental temperature, most peaks in the NMR
spectra are identifiable by referring their chemical shift and multiplicity. Moreover, 1H
NMR 2D experiments, assignment results from other previous studies and established
database (e.g. human metabolome database, HMDB, http://www.hmdb.ca) are
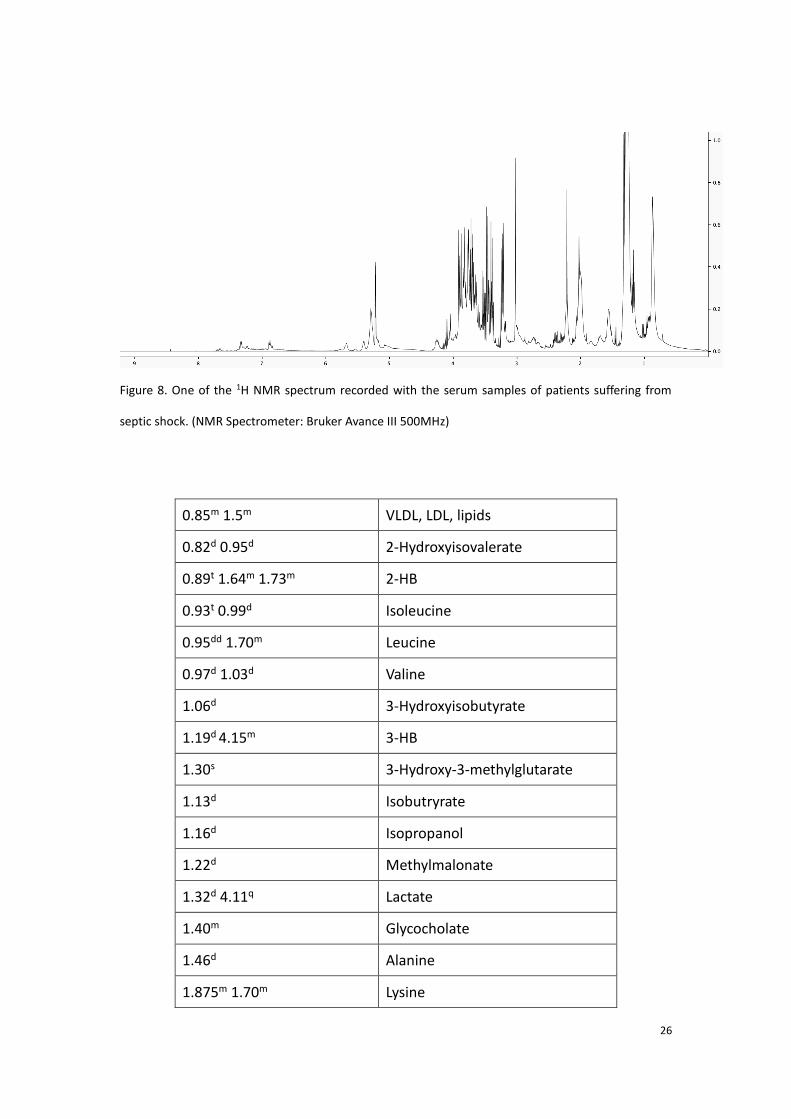
helpful for the identification of the substance. In our study, the software Chenomx
(Chenomx Inc., Alberta, Canada) was also applied for the assignment. One of the
spectrum recorded with the serum samples of one septic shock patient is taken as an
example (shown figure 8), table 1 shows the assignment obtained by the Chenomx
software.
26
Figure 8. One of the 1H NMR spectrum recorded with the serum samples of patients suffering from
septic shock. (NMR Spectrometer: Bruker Avance III 500MHz)
0.85m 1.5m VLDL, LDL, lipids
0.82d 0.95d 2-Hydroxyisovalerate
0.89t 1.64m 1.73m 2-HB
0.93t 0.99d Isoleucine
0.95dd 1.70m Leucine
0.97d 1.03d Valine
1.06d 3-Hydroxyisobutyrate
1.19d 4.15m 3-HB
1.30s 3-Hydroxy-3-methylglutarate
1.13d Isobutryrate
1.16d Isopropanol
1.22d Methylmalonate
1.32d 4.11q Lactate
1.40m Glycocholate
1.46d Alanine
1.875m 1.70m Lysine
27
1.91s Acetate
1.98m 3.32m Proline
1.99s Acetamide
2.02s Glycoproteine
2.12m 2.32m Glutamate
2.09m 2.41m Glutamine
2.2s Acetoacetate
2.36s Pyruvate
2.39s Succinate
2.52d 2.68d Citrate
2.71s Dimethylamine
2.89s Trimethylaimine
2.90s N,N-dimethylglycine
3.05t Proline
3.25s Creatine
3.03s 3.92s Creatinine
3.14s 4.04s Dimethysulfone
?3.18s Acetyl-carnitine/Choline
?3.19s 4.11ddd Choline
3.23t 3.72m 3.82m 4.64d 5.23d Glucose
3.25s TMAO/Betaine
3.27t Glucose-6-phosphate
3.34s Caffeine
3.55s Glycine
3.65dd 3.55dd Glycerol
4.05t Myo-insitol
5.175d Mannose
5.79s Urea
6.52s Fumarate
28
6.88d 7.18d Tyrosine
7.32d 7.36d Phenylalanine
7.77d Tyrosine
7.67s 7.02s 1-MH
7.70s dTTP
8.5s Formate
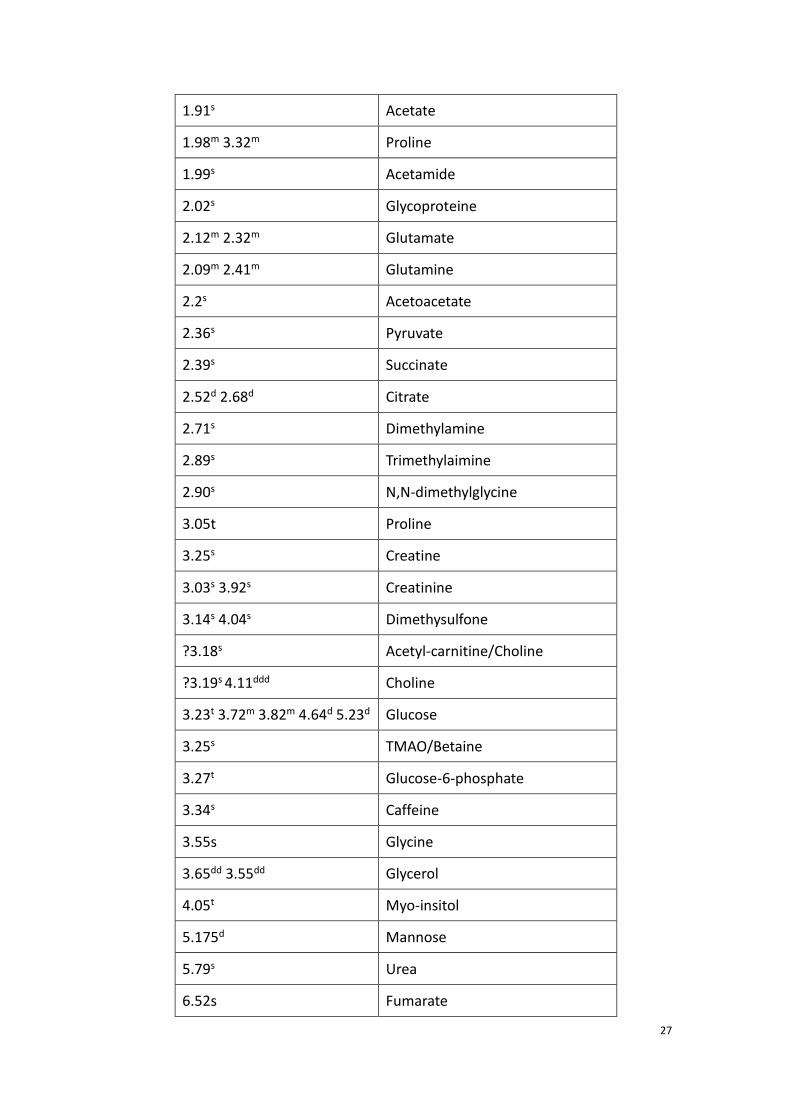
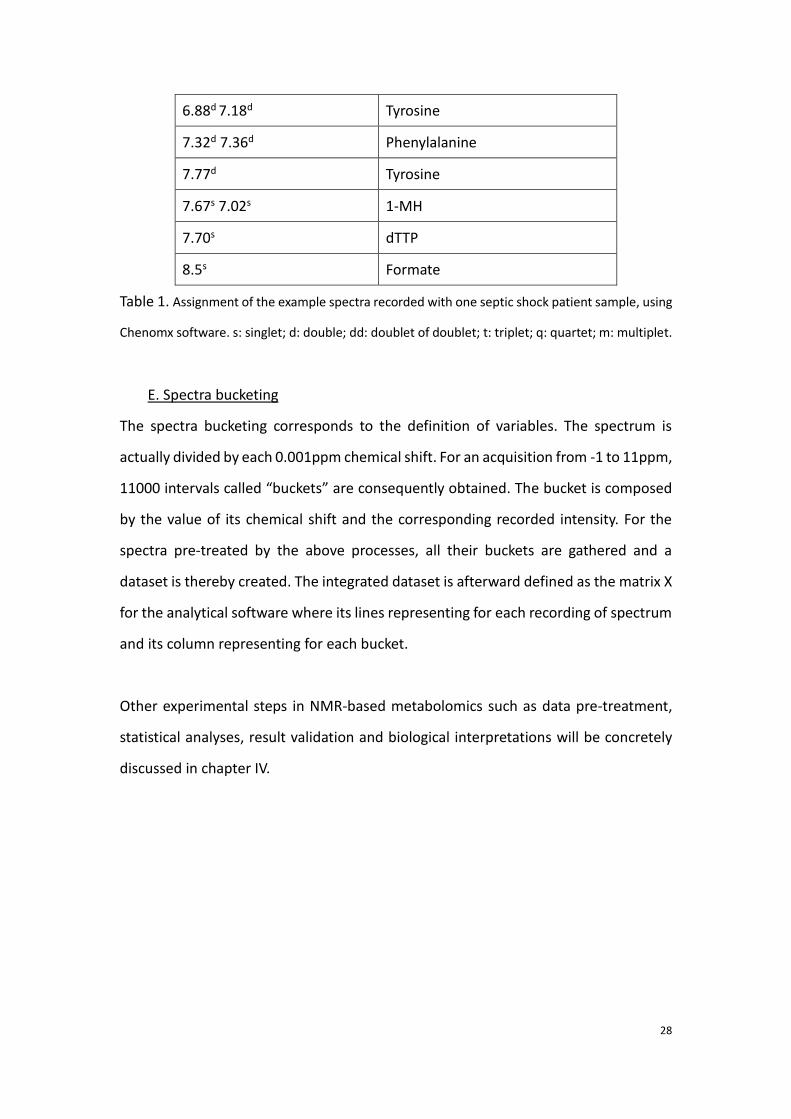
Table 1. Assignment of the example spectra recorded with one septic shock patient sample, using
Chenomx software. s: singlet; d: double; dd: doublet of doublet; t: triplet; q: quartet; m: multiplet.
E. Spectra bucketing
The spectra bucketing corresponds to the definition of variables. The spectrum is
actually divided by each 0.001ppm chemical shift. For an acquisition from -1 to 11ppm,
11000 intervals called “buckets” are consequently obtained. The bucket is composed
by the value of its chemical shift and the corresponding recorded intensity. For the
spectra pre-treated by the above processes, all their buckets are gathered and a
dataset is thereby created. The integrated dataset is afterward defined as the matrix X
for the analytical software where its lines representing for each recording of spectrum
and its column representing for each bucket.
Other experimental steps in NMR-based metabolomics such as data pre-treatment,
statistical analyses, result validation and biological interpretations will be concretely
discussed in chapter IV.
29
Chapter III Mass spectrometry based metabolomics
1.3.1 Principle of mass spectrometer
The mass spectrometry (MS) is an instrument which serves to test the molecular mass
and the structure of substance. The identification of the compounds is achieved by
analyzing the ion fragments ionized from the substance.
After the ionization, the ion fragments are volatilized to gas phase and then separated
in the light of the ratio of mass to charge (M/Z) [39].
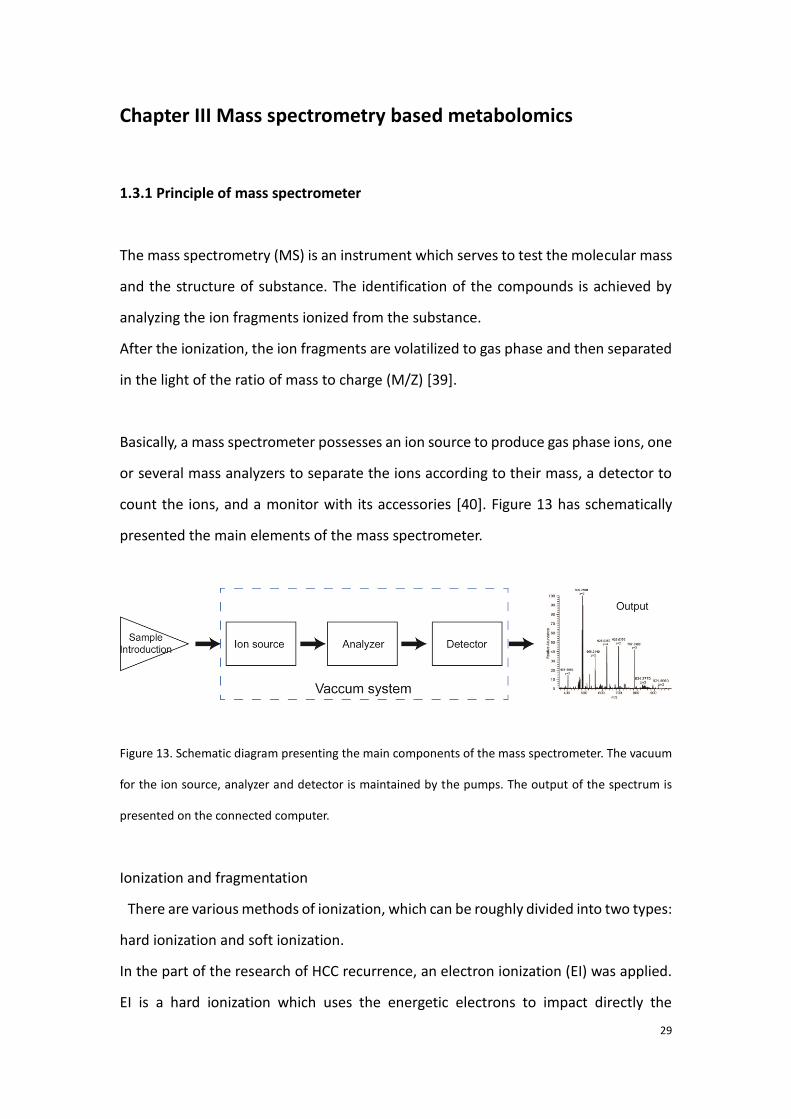
Basically, a mass spectrometer possesses an ion source to produce gas phase ions, one
or several mass analyzers to separate the ions according to their mass, a detector to
count the ions, and a monitor with its accessories [40]. Figure 13 has schematically
presented the main elements of the mass spectrometer.
Figure 13. Schematic diagram presenting the main components of the mass spectrometer. The vacuum
for the ion source, analyzer and detector is maintained by the pumps. The output of the spectrum is
presented on the connected computer.
Ionization and fragmentation
There are various methods of ionization, which can be roughly divided into two types:
hard ionization and soft ionization.
In the part of the research of HCC recurrence, an electron ionization (EI) was applied.
EI is a hard ionization which uses the energetic electrons to impact directly the
30
molecule. The principle of the formation of molecular ion in the EI is expressed by the
following equation:
M + e- → M+ + 2e- (1.3.1)
where M is the ionized molecule to be ionized and M+ is the molecular ion after the
electronic reaction.
After the impact, energy belonging to e- is transmitted to the molecular ion M+, results
in further fragmentations. The secondary fragmentations may be ionic or neutral. In
the part of metabolomic study on HCC recurrence research, as well as many other past
metabolomic studies using the tandem of gas chromatography and mass spectrometry,
the EI source is applied.
An electrospray ionization (ESI) was employed to combine to ultra-performance liquid
chromatography for studying the septic shock mortality.
Compared with the hard ionization method, the ESI source is classified as a soft-
ionization since less energy is sent up to the molecule, and the molecule is then
disrupted into positively charged molecular ion and electron in the ion source. The
molecular ion is then further fragmented.
As to its application in the combination of LC-MS, the liquid of sample (whose pH is
usually adjusted) is smashed into micro droplets (1-2μm) by a high voltage. The
molecule wrapped in the droplets is then ionized by the effect of Coulomb explosion,
which is issued from the evaporation by the pneumatic nebulization and the
inhomogeneous distribution of charges between inside and outside of the droplets.
The ions are detected in the form of cations such as [M+H]+, [M+Na]+ and [M+nH]+ in
the positive mode and detected as [M-H]- in the negative mode.
Other rifely used ion sources which are connected to the MS include chemical
ionization (CI) [41], fast atom bombardment (FAB) [42], atmosphere pressure chemical
ionization (APCI) [43] and matrix assisted laser desorption ionization (MALDI) [44].
Analyzer
The analyzer may serve for collision, selection and analysis of the ions. After the
injection of the ions from the ion source, the ions are subjected to the analyzer and
31
their kinetic energy is provided by the force of electric and magnetic field forces. The
ions are separated by their different radius of rotation based on its m/z. There are
various types of MS analyzer such quadrupole (Q) [45], time of flight (TOF) [46], ion
trap (IT) [47], orbitrap [48], and Fourier transform ion cyclotron resonance (FT-ICR)
[49]. In this thesis work, the tandem of analyzers linear trap quadrupoles-orbitrap
(LTQ-orbitrap) and quadrupole were applied for the analyses in LC-MS and GC-MS
respectively.
Quadrupole (Q)
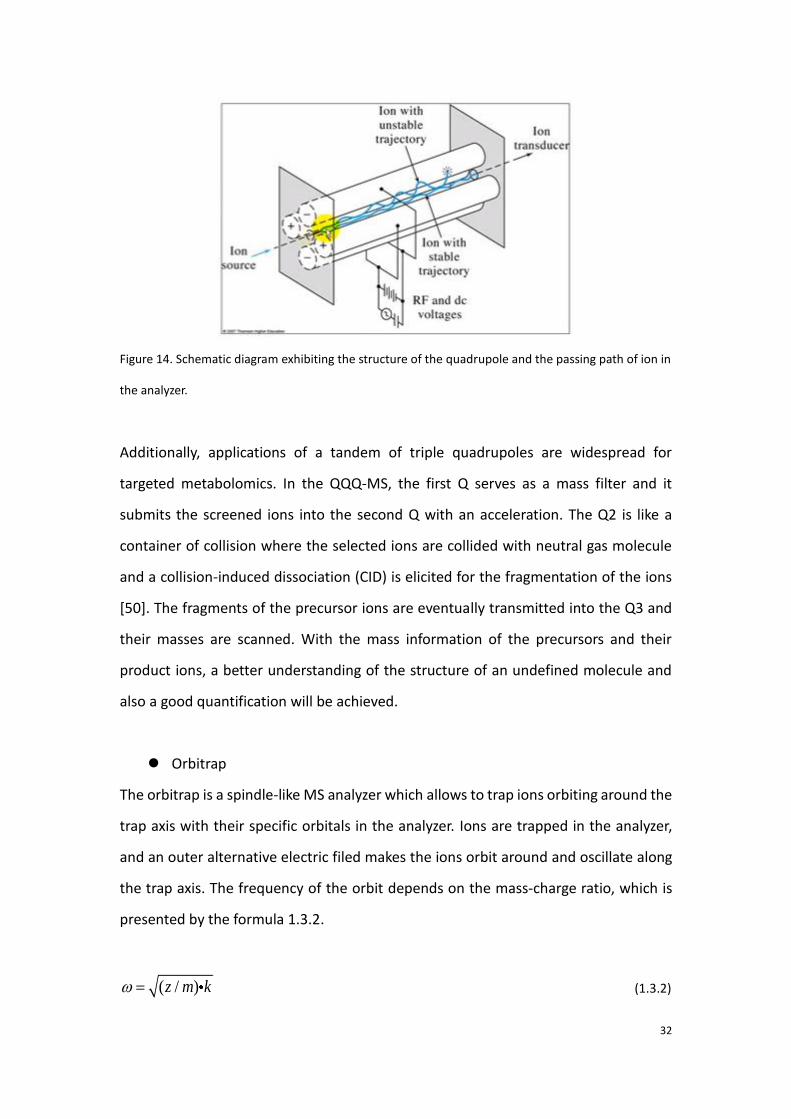
As shown in Figure 14 below, the quadrupole analyzer is composed by the four
electrodes in which there are two connected pairs of rods. All the rods are connected
with one direct current (DC) source and an alternative current source which is
generated by a radiofrequency. At one certain time point, between one pair of rods
there is an electric field with a voltage (=VDC+VRFcos(ωt)) and between the other pair
the field intensity is meanwhile adverse (=-VDC-VRFcos(ωt)). With an EI source which is
widely used in the GC-MS, only positive ions are injected into the quadrupole. The ion
is therefore attracted by the rod with negative field and repelled by the positive one.
Due to the alternative filed intensity, the ion will go through the analyzer with an
oscillation. The ion selection and separation depend on its ratio m/z. With the
presence of the introduced DC, non-selected ions will hit the rod (shown in the figure
by the “unstable trajectory”) and those ions within the range of detection are allowed
to pass through the analyzer. The amplitude of the oscillation corresponds to the ratio
m/z, too. This is because the ions with smaller m/z will be accelerated faster than big
ones, and therefore lead to a larger amplitude which is perpendicular to the central
axis of the quadrupole. Thus, ions with smaller m/z spend longer time than ones with
bigger m/z on passing the analyzer, which is the feature of the ion separation.
32
Figure 14. Schematic diagram exhibiting the structure of the quadrupole and the passing path of ion in
the analyzer.
Additionally, applications of a tandem of triple quadrupoles are widespread for
targeted metabolomics. In the QQQ-MS, the first Q serves as a mass filter and it
submits the screened ions into the second Q with an acceleration. The Q2 is like a
container of collision where the selected ions are collided with neutral gas molecule
and a collision-induced dissociation (CID) is elicited for the fragmentation of the ions
[50]. The fragments of the precursor ions are eventually transmitted into the Q3 and
their masses are scanned. With the mass information of the precursors and their
product ions, a better understanding of the structure of an undefined molecule and
also a good quantification will be achieved.
Orbitrap
The orbitrap is a spindle-like MS analyzer which allows to trap ions orbiting around the
trap axis with their specific orbitals in the analyzer. Ions are trapped in the analyzer,
and an outer alternative electric filed makes the ions orbit around and oscillate along
the trap axis. The frequency of the orbit depends on the mass-charge ratio, which is
presented by the formula 1.3.2.
( / )z m k (1.3.2)
33
where ω is the angular velocity of the oscillation, z/m is the mass-charge ration and k
is field curvature. Hence, the ions are separated and recognized in the light of their
different frequency.
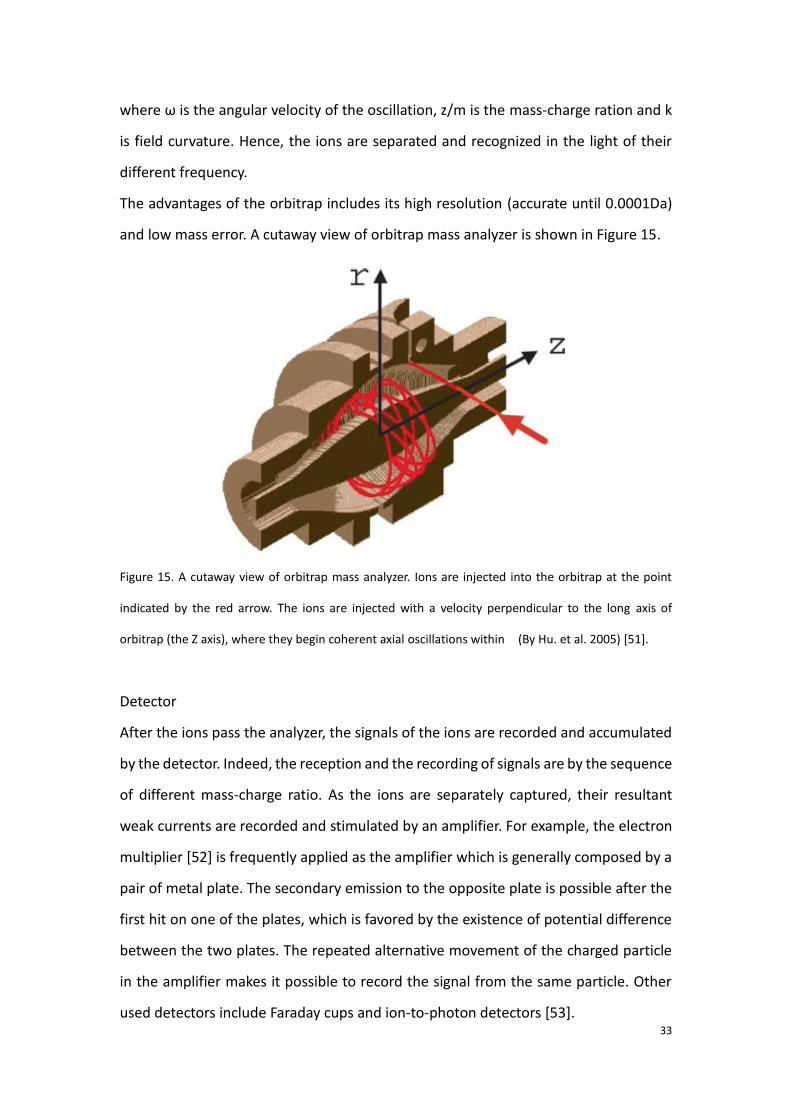
The advantages of the orbitrap includes its high resolution (accurate until 0.0001Da)
and low mass error. A cutaway view of orbitrap mass analyzer is shown in Figure 15.
Figure 15. A cutaway view of orbitrap mass analyzer. Ions are injected into the orbitrap at the point
indicated by the red arrow. The ions are injected with a velocity perpendicular to the long axis of
orbitrap (the Z axis), where they begin coherent axial oscillations within (By Hu. et al. 2005) [51].
Detector
After the ions pass the analyzer, the signals of the ions are recorded and accumulated
by the detector. Indeed, the reception and the recording of signals are by the sequence
of different mass-charge ratio. As the ions are separately captured, their resultant
weak currents are recorded and stimulated by an amplifier. For example, the electron
multiplier [52] is frequently applied as the amplifier which is generally composed by a
pair of metal plate. The secondary emission to the opposite plate is possible after the
first hit on one of the plates, which is favored by the existence of potential difference
between the two plates. The repeated alternative movement of the charged particle
in the amplifier makes it possible to record the signal from the same particle. Other
used detectors include Faraday cups and ion-to-photon detectors [53].
34
1.3.2 Tandem mass spectrometry (MS/MS) or tandem MS to chromatography
techniques
MS/MS[54]
The tandem mass spectrometry, also noted as MS/MS or MS2 is commonly used in the
metabolomic studies for the qualification of the ion peaks or for determining the
structure of the unknown compounds.
As regard to the principle of the MS/MS, briefly, the ions are firstly selected and
separated in the first MS by their m/z. Then, further dissociation of the ions takes place
in the second MS [50]. Eventually, the experience provides information not only the
mass-to-charge ratio of both the precursor ion and the product ion, but also the
position of fracture in the initial ion.
In the case that only one mass spectrometry is applied, the assignment of the MS
peaks is primarily realized by referring the obtained value of m/z to the exact mass of
the ion. However, this is not reliable for the existence of isomers. Through the
application of MS/MS technique, the qualification should be more convincible if the
product ions of the observed ion can be also matched to those which are obtained by
the standard substance or to some data base of note. On the other hand, the
difference of m/z between the precursor and product ion allows to speculate the
position of the fractured bond in the precursor ion, and therefore to speculate the
configuration of the unknown substance.
Chromatography–MS
In the studies of metabolomics, as the analyte is usually a mixture of extensive
molecules, if the bio-samples are analyzed directly by the MS, the repetition of
fragment ions from different molecules makes it hard to interpret the MS peaks. Hence,
a tandem of chromatography with MS is appreciated, which allows to beforehand
separate the analyte in the light of the property of its elements [55]. The isolated
components are eluted in gradient and then ionized in the ion source.
35
Concretely, the analyte is packed by the carrier, which may be gas or liquid, flows
through the chromatographic column. The chromatographic column plays a role as a
stationary phase which is able to absorb the analyte in the mobile phase by a certain
percentage of quantity of the analyte. The coefficient of distribution (K) of the
component in both the stationary and mobile phase is a constant at equilibrium
(formula 1.3.3). The absorbed fractions are gradually washed off and detected
respectively by the detector. Meanwhile, the time of retention (Rt), which is calculated
by the formula 1.3.4, is recorded for each component. A flow through the
chromatographic column about a mixture of two substance is taken as an example,
shown Figure 16.
K = Cs/Cm (1.3.3)
0 0s
m
VRt t t K
V (1.3.4)
where Cs and Cm are the concentrations in the stationary phase and mobile phase of
the absorbed solute; the Vs and Vm are the volumes retained by the two phases
respectively. t0 is the dead time [56].
The gas chromatography-mass spectrometry and the liquid chromatography-mass
spectrometry are widely used for carrying out metabolomic studies.
36
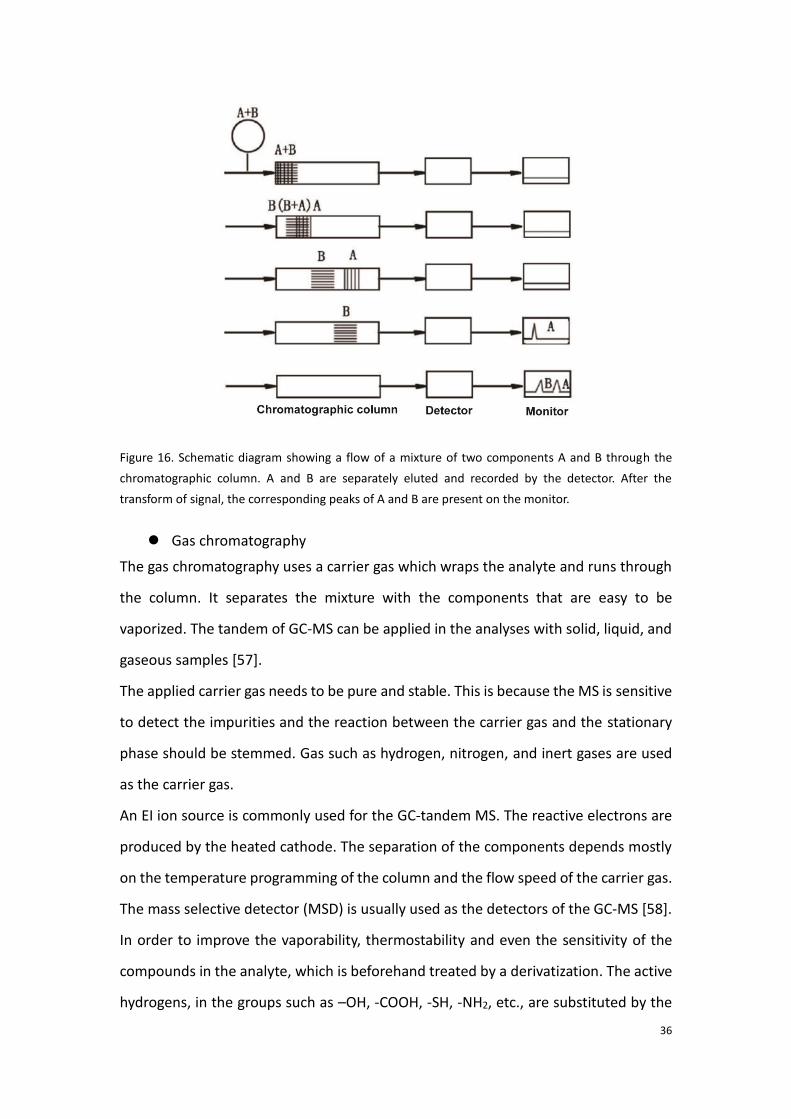
Figure 16. Schematic diagram showing a flow of a mixture of two components A and B through the
chromatographic column. A and B are separately eluted and recorded by the detector. After the
transform of signal, the corresponding peaks of A and B are present on the monitor.
Gas chromatography
The gas chromatography uses a carrier gas which wraps the analyte and runs through
the column. It separates the mixture with the components that are easy to be
vaporized. The tandem of GC-MS can be applied in the analyses with solid, liquid, and
gaseous samples [57].
The applied carrier gas needs to be pure and stable. This is because the MS is sensitive
to detect the impurities and the reaction between the carrier gas and the stationary
phase should be stemmed. Gas such as hydrogen, nitrogen, and inert gases are used
as the carrier gas.
An EI ion source is commonly used for the GC-tandem MS. The reactive electrons are
produced by the heated cathode. The separation of the components depends mostly
on the temperature programming of the column and the flow speed of the carrier gas.
The mass selective detector (MSD) is usually used as the detectors of the GC-MS [58].
In order to improve the vaporability, thermostability and even the sensitivity of the
compounds in the analyte, which is beforehand treated by a derivatization. The active
hydrogens, in the groups such as –OH, -COOH, -SH, -NH2, etc., are substituted by the
37
groups with lower polarity. In the view of need, the derivatization strategies can be
chosen among the methods such as silanization, acylation, halogenate, etc. [59]
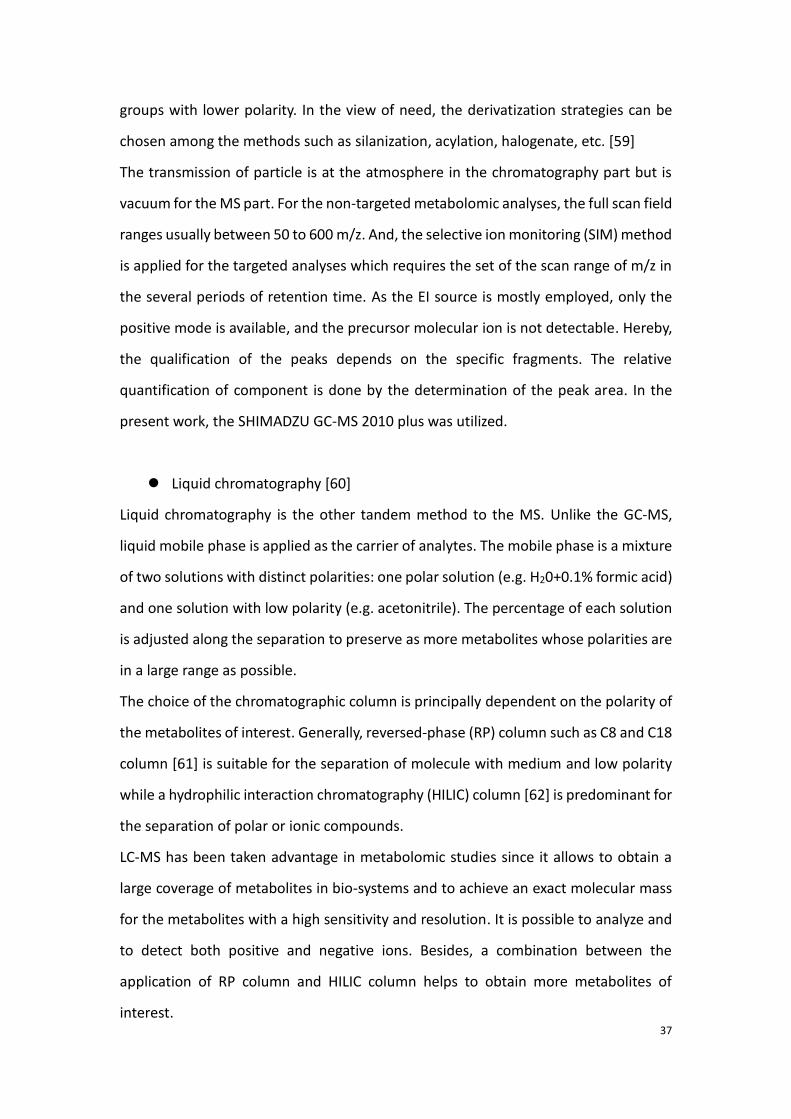
The transmission of particle is at the atmosphere in the chromatography part but is
vacuum for the MS part. For the non-targeted metabolomic analyses, the full scan field
ranges usually between 50 to 600 m/z. And, the selective ion monitoring (SIM) method
is applied for the targeted analyses which requires the set of the scan range of m/z in
the several periods of retention time. As the EI source is mostly employed, only the
positive mode is available, and the precursor molecular ion is not detectable. Hereby,
the qualification of the peaks depends on the specific fragments. The relative
quantification of component is done by the determination of the peak area. In the
present work, the SHIMADZU GC-MS 2010 plus was utilized.
Liquid chromatography [60]
Liquid chromatography is the other tandem method to the MS. Unlike the GC-MS,
liquid mobile phase is applied as the carrier of analytes. The mobile phase is a mixture
of two solutions with distinct polarities: one polar solution (e.g. H20+0.1% formic acid)
and one solution with low polarity (e.g. acetonitrile). The percentage of each solution
is adjusted along the separation to preserve as more metabolites whose polarities are
in a large range as possible.
The choice of the chromatographic column is principally dependent on the polarity of
the metabolites of interest. Generally, reversed-phase (RP) column such as C8 and C18
column [61] is suitable for the separation of molecule with medium and low polarity
while a hydrophilic interaction chromatography (HILIC) column [62] is predominant for
the separation of polar or ionic compounds.
LC-MS has been taken advantage in metabolomic studies since it allows to obtain a
large coverage of metabolites in bio-systems and to achieve an exact molecular mass
for the metabolites with a high sensitivity and resolution. It is possible to analyze and
to detect both positive and negative ions. Besides, a combination between the
application of RP column and HILIC column helps to obtain more metabolites of
interest.
38
During this study, an ultra-performance liquid chromatography (UPLC)-MS is applied.
The column is filled with particles inferior to 2μm, which increases linear velocity with
a high pressure. Compared with the high-performance liquid chromatography (HPLC)
technology using fillings of 3.0 to 4.6μm, the UPLC leads to a better resolution,
sensitivity and a faster analytical speed [63]. A HSS (high strength silica) T3 column
(Waters, Milford, MA, USA) which is a RP column has been applied. It is actually a
modified C18 column which performs a better separation in polar molecule and in a
larger pH range than C18 column. Using such a column in untargeted metabolomic
analyses, we have achieved not only a good retention of nonpolar molecule such as
kinds of lipids but also a good retention of polar metabolites such as amino acids.
Other than tandem chromatography-MS, the combination between capillary
electrophoresis (CE) and MS is also well applied for metabolomic studies. The major
aimed metabolites by the technique are the polar metabolites [64, 65].
1.3.3 Processes of mass spectrometry-based metabolomics
The process of execute the mass spectrometry based metabolomics is mostly similar
to the process of NMR spectroscopy-based metabolomic which has been exposed in
the last chapter. However, some operations in the steps distinguish from those in the
precedent method. The remarkable feature of the MS based metabolomics is
therefore introduced as following:
Sample preparation
The sample preparation begins from the removal of proteins. Solution of extractant
such as methanol, acetonitrile is added to the biofluid. After a centrifugation, the
proteins are precipitated while the supernatant is drawn and lyophilized. Indeed, the
metabolites to be analyzed are dissolved in the supernatant liquid. In this thesis work,
methanol water solution (volume ratio 1:4) was used as the extractant. However, it
should be underlined that for lipidomics studies (important branch of metabolomics,
not included in this study) [66], which focus on the analyses in the extensive kinds of
39
lipids, the extractant is different from the mentioned compounds, solution with less
polarity is applied for the dissolution of the lipids.
The freeze-dried samples should be redissolved before the instrumental analyses. For
LC-MS the solution can be consistent with the extractant. For GC-MS studies,
derivatization reagent is added into the lyophilized samples, and the sample analyses
are performed after the extraction of the supernatant after the derivatization
reactions.
The preparation of quality control (QC) samples are demanded at the same time of the
preparation of the real samples. The QC samples are collected usually by the mixture
and a subpackage of all the real samples. The method of extraction should be in accord
with that in real samples.
Moreover, one or several internal standard references are also added into the samples
during the preparation. The internal standard substance does not exist in the analyte
and it serves to a better quantification with their known concentration.
Spectra acquisition and peak assignment
In the sequence of analyses, the QC samples are inserted after an equal amount of real
samples. They are used to affirm the stability of the instrument and to acquire
complementary product ion information [26].
Unlike the spectrum of NMR spectroscopy, the spectrum of MS within the scan scope
of m/z is not necessarily continuous. A mass spectrum is presented by bars
accompanied by a determined mass. Each peak represents a molecular ion or an ion
fragment which are corresponding to certain metabolites. However, in the experiences
of chromatography tandem to MS, the total ion current (TIC) chromatogram is
continuous which describes the integrated intensity across the entire range of masses
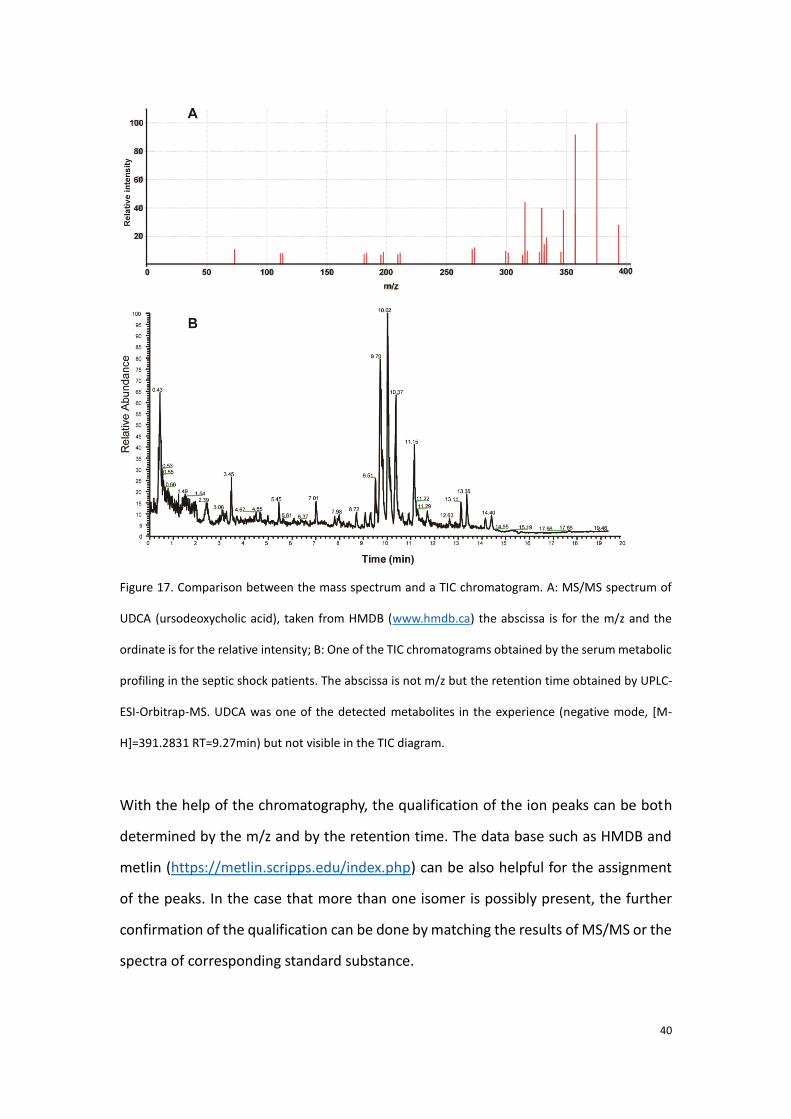
being detected at every point of retention time in the analysis. Figure 17 shows a
comparison between the mass spectrum and a TIC chromatogram.
40
Figure 17. Comparison between the mass spectrum and a TIC chromatogram. A: MS/MS spectrum of
UDCA (ursodeoxycholic acid), taken from HMDB (www.hmdb.ca) the abscissa is for the m/z and the
ordinate is for the relative intensity; B: One of the TIC chromatograms obtained by the serum metabolic
profiling in the septic shock patients. The abscissa is not m/z but the retention time obtained by UPLC-
ESI-Orbitrap-MS. UDCA was one of the detected metabolites in the experience (negative mode, [M-
H]=391.2831 RT=9.27min) but not visible in the TIC diagram.
With the help of the chromatography, the qualification of the ion peaks can be both
determined by the m/z and by the retention time. The data base such as HMDB and
metlin (https://metlin.scripps.edu/index.php) can be also helpful for the assignment
of the peaks. In the case that more than one isomer is possibly present, the further
confirmation of the qualification can be done by matching the results of MS/MS or the
spectra of corresponding standard substance.
41
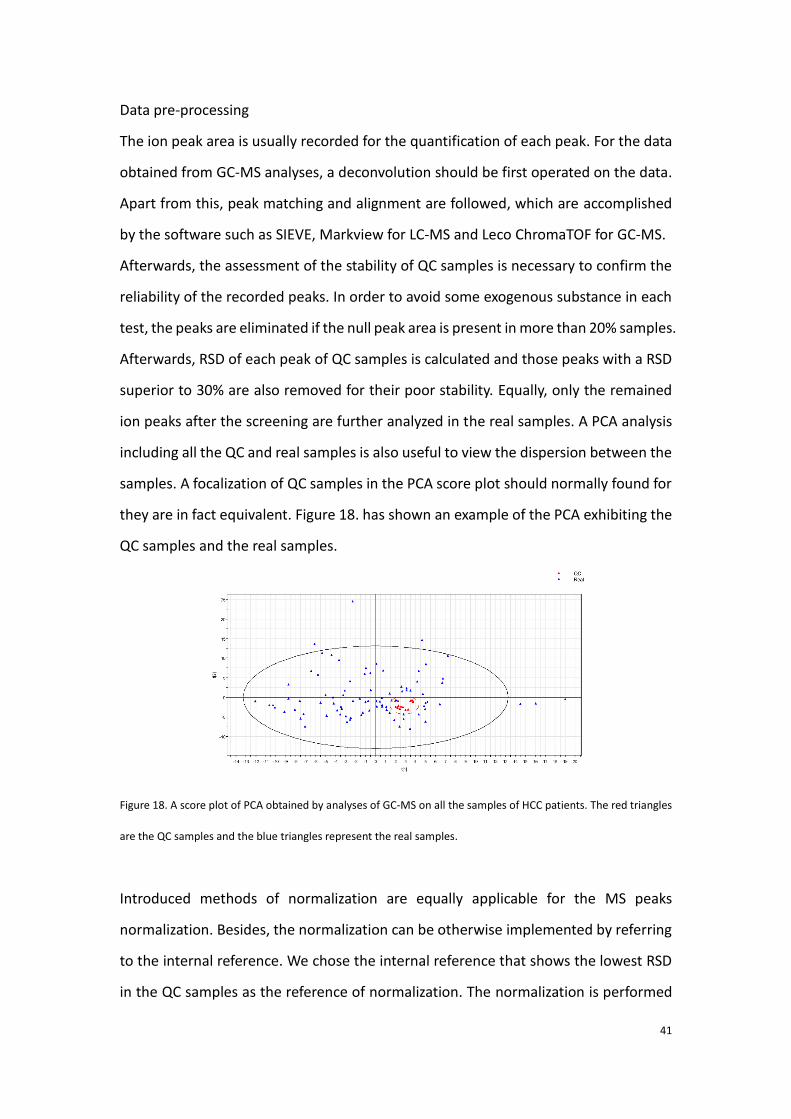
Data pre-processing
The ion peak area is usually recorded for the quantification of each peak. For the data
obtained from GC-MS analyses, a deconvolution should be first operated on the data.
Apart from this, peak matching and alignment are followed, which are accomplished
by the software such as SIEVE, Markview for LC-MS and Leco ChromaTOF for GC-MS.
Afterwards, the assessment of the stability of QC samples is necessary to confirm the
reliability of the recorded peaks. In order to avoid some exogenous substance in each
test, the peaks are eliminated if the null peak area is present in more than 20% samples.
Afterwards, RSD of each peak of QC samples is calculated and those peaks with a RSD
superior to 30% are also removed for their poor stability. Equally, only the remained
ion peaks after the screening are further analyzed in the real samples. A PCA analysis
including all the QC and real samples is also useful to view the dispersion between the
samples. A focalization of QC samples in the PCA score plot should normally found for
they are in fact equivalent. Figure 18. has shown an example of the PCA exhibiting the
QC samples and the real samples.
Figure 18. A score plot of PCA obtained by analyses of GC-MS on all the samples of HCC patients. The red triangles
are the QC samples and the blue triangles represent the real samples.
Introduced methods of normalization are equally applicable for the MS peaks
normalization. Besides, the normalization can be otherwise implemented by referring
to the internal reference. We chose the internal reference that shows the lowest RSD
in the QC samples as the reference of normalization. The normalization is performed

42
by the ratio of intensity of each peak to the detected intensity of standard reference
in every real sample.
Once the data is processed, the statistical analyses methods as well as result validation
and biological interpretation which are similar to those applied with NMR-based
approach will be exposed in the next chapter.
43
Chapter IV. Similar experimental steps and comparison
between NMR and MS-based metabolomics
For both NMR and MS-based metabolomics, methods of data pre-treatment
encompassing the spectra normalization, the variable scaling are similar. Similarity can
be also found for the methods of statistical analyses as well as the result validation and
biological interpretation. First part of this chapter summarizes the similar experimental
steps for both the techniques-based metabolomics. A brief comparison between the
two techniques is concluded at the end of the chapter.
1.4.1 Methods of data pre-treatment
A. Normalization
The normalization of spectrum is a method attenuating macroscopically the dilution
effect. Except for the experimental errors, a common source of non-induced variance
issues from the large dynamic range of metabolite concentrations in the studied
samples, which gives rise to unequal variance of residuals [67]. But, the variability of
one certain metabolite is often analyzed by its mean concentration, the
heterogeneous changes in different samples elicit errors in the results. On the other
hand, for the analyses in the biofluid, urine for example, another important influencing
factor is the inequivalent intake of water among different subjects. Thus, a
normalization of the peaks for each spectrum in the whole dataset is needed.
Numbers of normalization methods are available, among which, the integrated peak
area normalization, quotient normalization and quantile normalization are the most
employed.
1) Integral peak area normalization
Integral peak area normalization is simple for we only need to sum up the total peak
area of one spectrum and then integrate the area for each peak and calculate its
44
proportion to the total. However, this method is prone to be biased as the intense
peaks occupy a large proportion in the total area and the spectrum is extremely
sensitive to their variation. In this case, small but significant peaks in a bucket are
possible to be unequally normalized.
2) Quotient normalization
Compared with integral normalization, the quotient normalization is more frequently
suggested in the data pre-treatment of metabolomics. This is because it is less
hampered by extreme amounts of metabolites than the above. And, normalization in
samples with low metabolic variations is more exact [68]. The algorithm is as following:
1. Perform an integral normalization for all the test spectrum
2. Calculate the median spectrum (usually we choose the median spectrum)
3. Calculate the quotients of all variables included in test spectrum to those in the
reference spectrum
4. Calculate the median of the obtained variable quotients
5. Divide all the variables of the test spectrum by this median
3) Quantile normalization
The quantile normalization is frequently performed by the following steps [69, 70]:
1. List and assign each of the variables to a column and metabolites to a row (for
mass, for NMR, each row represents a sample).
2. Each column is sorted by intensity from the lowest to the highest.
3. Determine the arithmetical mean of each row according to sorted rank.
4. Substitute the mean value for each intensity value in the row.
5. Restore the original order of the assigned mean values to determine the
normalized relative intensity.
Hence, quantile normalization is a normalization method based on the ranking of the
variables. It reduces the non-biological systematic errors.
45
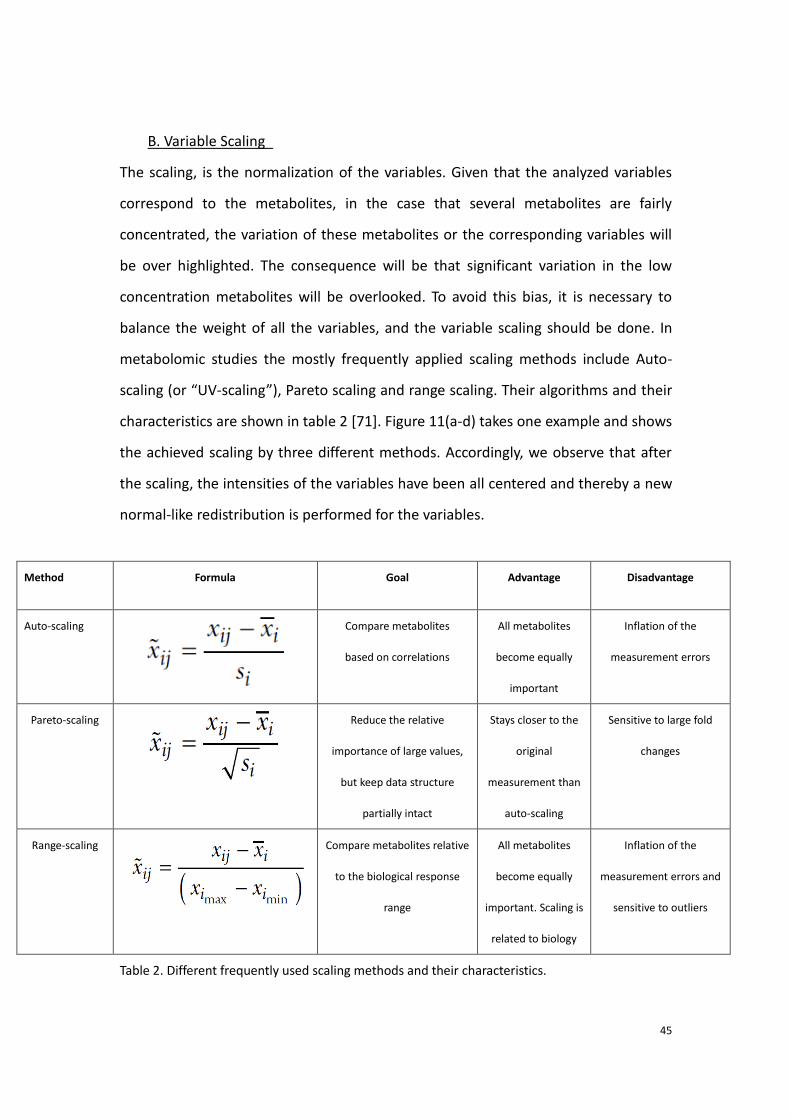
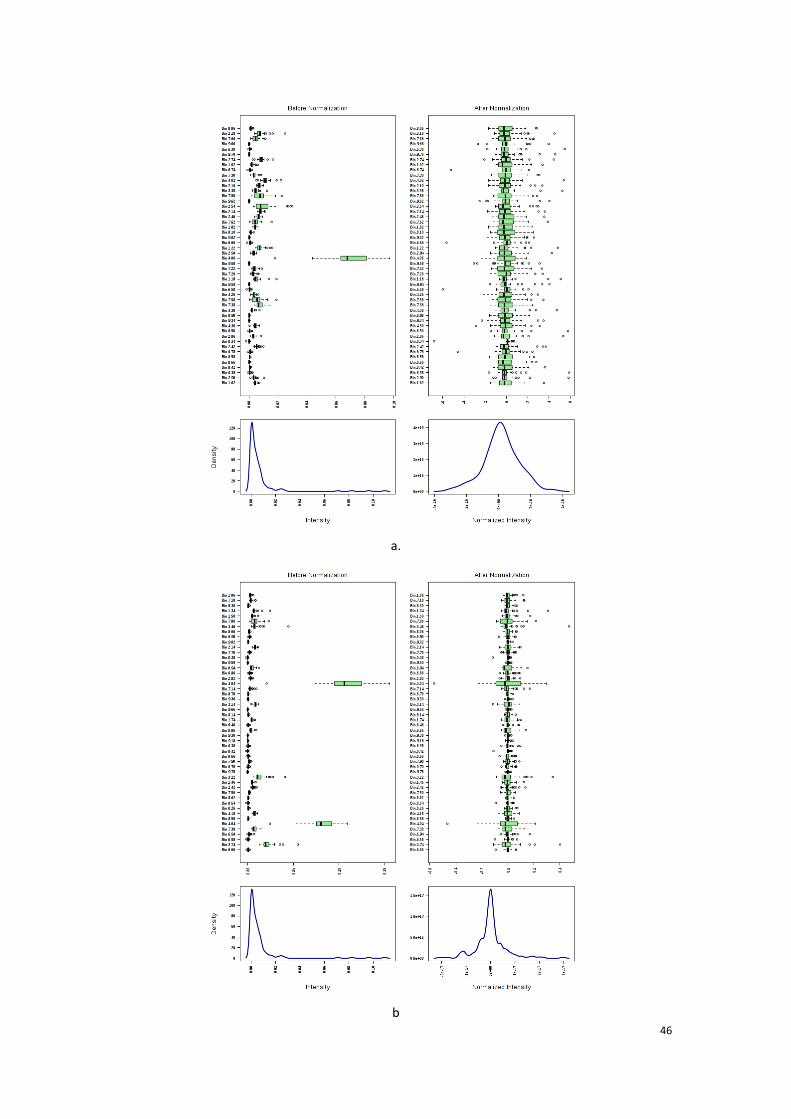
B. Variable Scaling
The scaling, is the normalization of the variables. Given that the analyzed variables
correspond to the metabolites, in the case that several metabolites are fairly
concentrated, the variation of these metabolites or the corresponding variables will
be over highlighted. The consequence will be that significant variation in the low
concentration metabolites will be overlooked. To avoid this bias, it is necessary to
balance the weight of all the variables, and the variable scaling should be done. In
metabolomic studies the mostly frequently applied scaling methods include Auto-
scaling (or “UV-scaling”), Pareto scaling and range scaling. Their algorithms and their
characteristics are shown in table 2 [71]. Figure 11(a-d) takes one example and shows
the achieved scaling by three different methods. Accordingly, we observe that after
the scaling, the intensities of the variables have been all centered and thereby a new
normal-like redistribution is performed for the variables.
Method Formula Goal Advantage Disadvantage
Auto-scaling Compare metabolites
based on correlations
All metabolites
become equally
important
Inflation of the
measurement errors
Pareto-scaling Reduce the relative
importance of large values,
but keep data structure
partially intact
Stays closer to the
original
measurement than
auto-scaling
Sensitive to large fold
changes
Range-scaling Compare metabolites relative
to the biological response
range
All metabolites
become equally
important. Scaling is
related to biology
Inflation of the
measurement errors and
sensitive to outliers
Table 2. Different frequently used scaling methods and their characteristics.
46
a.
b
47
c
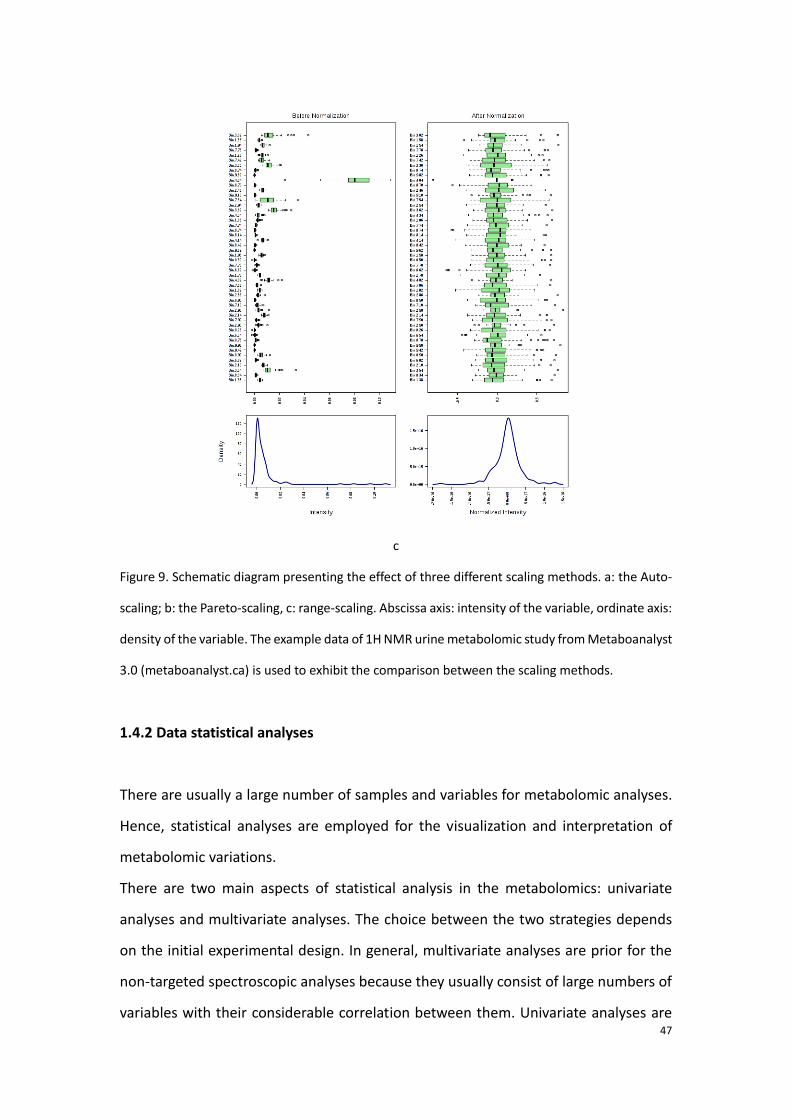
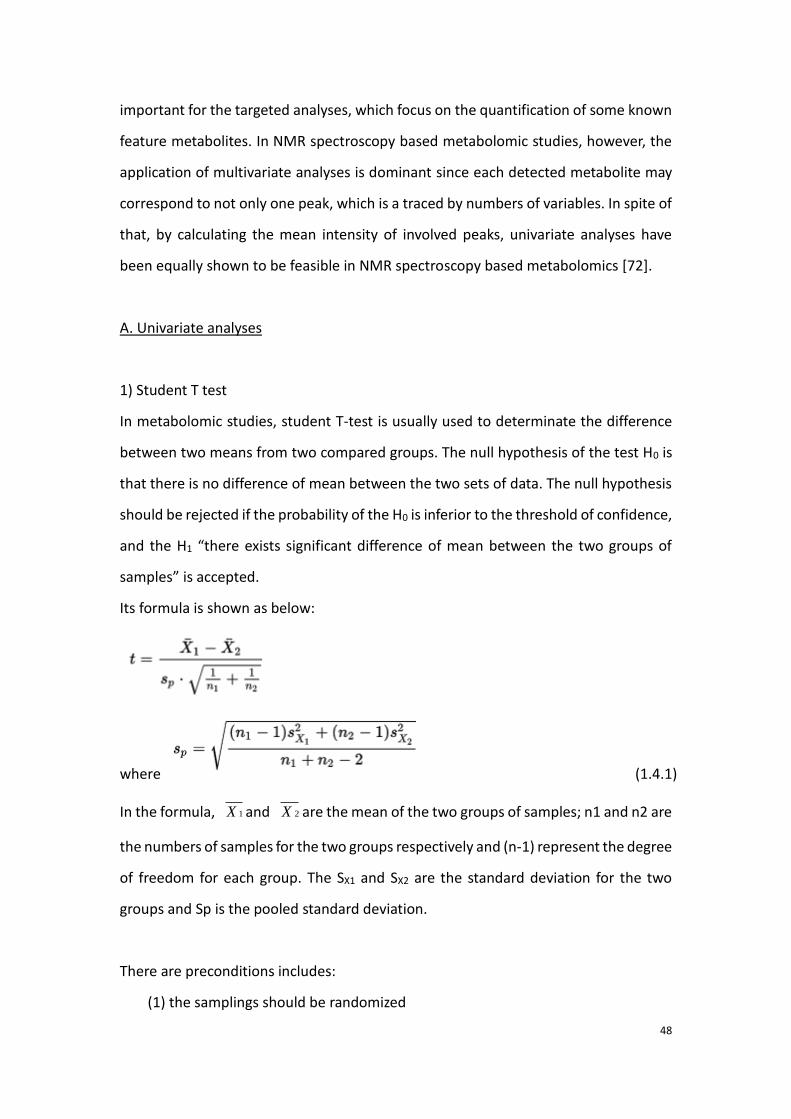
Figure 9. Schematic diagram presenting the effect of three different scaling methods. a: the Auto-
scaling; b: the Pareto-scaling, c: range-scaling. Abscissa axis: intensity of the variable, ordinate axis:
density of the variable. The example data of 1H NMR urine metabolomic study from Metaboanalyst
3.0 (metaboanalyst.ca) is used to exhibit the comparison between the scaling methods.
1.4.2 Data statistical analyses
There are usually a large number of samples and variables for metabolomic analyses.
Hence, statistical analyses are employed for the visualization and interpretation of
metabolomic variations.
There are two main aspects of statistical analysis in the metabolomics: univariate
analyses and multivariate analyses. The choice between the two strategies depends
on the initial experimental design. In general, multivariate analyses are prior for the
non-targeted spectroscopic analyses because they usually consist of large numbers of
variables with their considerable correlation between them. Univariate analyses are
48
important for the targeted analyses, which focus on the quantification of some known
feature metabolites. In NMR spectroscopy based metabolomic studies, however, the
application of multivariate analyses is dominant since each detected metabolite may
correspond to not only one peak, which is a traced by numbers of variables. In spite of
that, by calculating the mean intensity of involved peaks, univariate analyses have
been equally shown to be feasible in NMR spectroscopy based metabolomics [72].
A. Univariate analyses
1) Student T test
In metabolomic studies, student T-test is usually used to determinate the difference
between two means from two compared groups. The null hypothesis of the test H0 is
that there is no difference of mean between the two sets of data. The null hypothesis
should be rejected if the probability of the H0 is inferior to the threshold of confidence,
and the H1 “there exists significant difference of mean between the two groups of
samples” is accepted.
Its formula is shown as below:
where (1.4.1)
In the formula, and are the mean of the two groups of samples; n1 and n2 are
the numbers of samples for the two groups respectively and (n-1) represent the degree
of freedom for each group. The SX1 and SX2 are the standard deviation for the two
groups and Sp is the pooled standard deviation.
There are preconditions includes:
(1) the samplings should be randomized
1X 2X
49
(2) each studied group should be independent to others;
(3) the distribution of the studied variables should follow or almost follow the
normal distribution in the population;
(4) the variance of variable among different population should be equivalent.
In metabolomic analyses, T test is frequently used to verify whether one metabolite is
significantly varied in the comparison between two studied groups of subjects. The
threshold p < 0.05 is usually regarded as the criterion that difference of concentration
of the metabolite is significant.
2) T’ test
The T’ test is the derivative test from student T-test. It is used when the variances of
the two compared groups are not equivalent.
3) Binomial test
If the distribution of the variables does not follow the normal distribution, the student
T-test or T’ test are not available. In this case, nonparametric tests [73] are employable
to understand whether the two groups are significantly different. There are types of
nonparametric tests, in which the binomial test [74] is frequently used in metabolomic
analyses. In the test, the variable is only possible with two values (e.g. control group
vs. experience group). In our studies, the binomial test is realized in the SPSS software
(IBM, Chicago, USA) [75], whose initial hypothesis and final decision are analogous to
that in T-test. As an example, when the amount of sample is relatively small, to figure
out if the concentration of one metabolite is significantly different between healthy
controls and patients, the binomial test is proposed.
4) ANOVA
ANOVA, short for Analysis of Variance is another statistical test providing whether the
means of two or more than two groups are equal. [76]. It is similar to the student T-
test when only two groups are analyzed.
For the studied variable(s), in fact, their variations exist between inter- and intra-
50
groups. The null hypothesis is similar to that in T-test: we suppose initially that there
is no difference of mean among the groups, and refuse finally the hypothesis if the
intergroup mean difference is much larger than that in the intragroup. For the
metabolomic study, ANOVA is therefore predominant when there are more than two
studied groups.
B. Multivariate analyses
1) Unsupervised methods
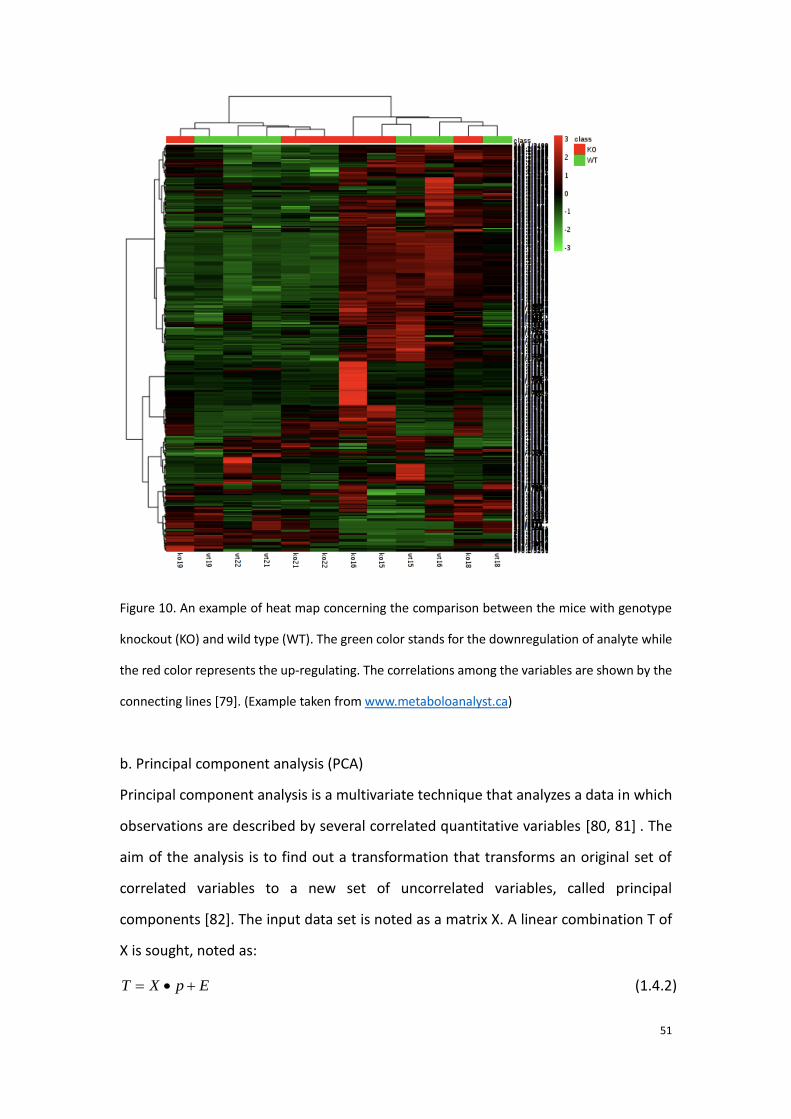
a. Hierarchical cluster analysis
There are numbers of algorithms in cluster analysis [77], in which the subjects and the
analytes are first grouped to subsets and analyzed separately. The advantage is that it
shows clearly both quantitative relationship and correlation among the analytes and
the samples. In metabolomic studies, hierarchical cluster analysis (HCA) [78] is the
frequently applied to discover the metabolite discriminators. Figure 12 presents an
example of heat map which complies with the HCA algorithm.
51
Figure 10. An example of heat map concerning the comparison between the mice with genotype
knockout (KO) and wild type (WT). The green color stands for the downregulation of analyte while
the red color represents the up-regulating. The correlations among the variables are shown by the
connecting lines [79]. (Example taken from www.metaboloanalyst.ca)
b. Principal component analysis (PCA)
Principal component analysis is a multivariate technique that analyzes a data in which
observations are described by several correlated quantitative variables [80, 81] . The
aim of the analysis is to find out a transformation that transforms an original set of
correlated variables to a new set of uncorrelated variables, called principal
components [82]. The input data set is noted as a matrix X. A linear combination T of
X is sought, noted as:
(1.4.2) T X p E
52
where p is the weight of X and E is the residue. In the space of T, the first component
T1 is the first column of T matrix that represents the largest variation among the
variables. The components are obtained in order of decreasing importance, and the
aim is to reduce the dimension of the variables. The second component is
perpendicular to T1 and T3 is perpendicular to the plane formed by T1 and T2, and so
on. Consequently, the data is usually represented by two or three dimensions.
The two analyses HCA and PCA belong to unsupervised learning methods in which the
data is not labelled.
2)Supervised methods
a) PLS-DA
Compared with the unsupervised methods, supervised multivariate methods
introduce extraneously a matrix of response Y, which is related to the classification.
Partial least squares discriminant analysis (PLS-DA), is derived from PLS regression
(PLS-R) [83], which finds the linear relationship between Y and X:
Y = f(X) + E (1.4.3)
b) OPLS-DA
Orthogonal partial least squares – discriminant analysis (OPLS-DA) is an extension of
PLS-DA. It allows to remove the systematic variation of matrix X which are not
correlated with Y, which helps to make the model simpler to be interpreted. With a
similar regression algorithm as PLS-DA, a single component is used to predict the class
while the other components describe the orthogonal variation with respect to this first
predictive component [84].
Important parameters in the PLS/OPLS-DA:
53
R2 and Q2
R2X and R2Y record the fraction of explained variance of X and of Y respectively by
each calculated component. Q2 represents the predictability of the model [85]. The
closer to 1, the better ability of prediction is for Q2.
VIP
The variable importance in projection (VIP) is the weight of each variable in the
model. In the part of MS-based metabolomic study the VIP was used to define the
most important metabolite discriminator for different groups. It also can be used to
select variables in order to filter the noise and other uncorrelated variables [86].
AUROC
The area under receiver operating characteristic curve (AUROC), is a graphical plot
that displays the performance of a binary classifier system as its discrimination
threshold is varied [87]. The ROC curve is characterized by the sensitivity (axis y) and
specificity (1-specificity for the axis x) of the classification. Taking example of clinical
applications of ROC curve, the sensitivity of a diagnostic test is the proportion of
patients for whom the outcome is positive that are correctly identified by the test. The
specificity is the proportion of patients for whom the outcome is negative that are
correctly identified by the test.
Method of multi-levels model
In the study aiming to investigate the evolution of septic shock, we have employed the
multi-levels models on the patients who provided two points of samplings [88], which
aims to analyze the samples belonging to the same subject in the multivariate analysis.
The method allows to remove the variation of inter-individual, which is often
calculated as the principal difference between the samples in the model of
multivariate analysis, shown Figure 11. Hence, we use this method to determinate the
metabolic differences between the two samplings for each patient, providing us the
information of the effect of the clinical intervention and the individual feedback.
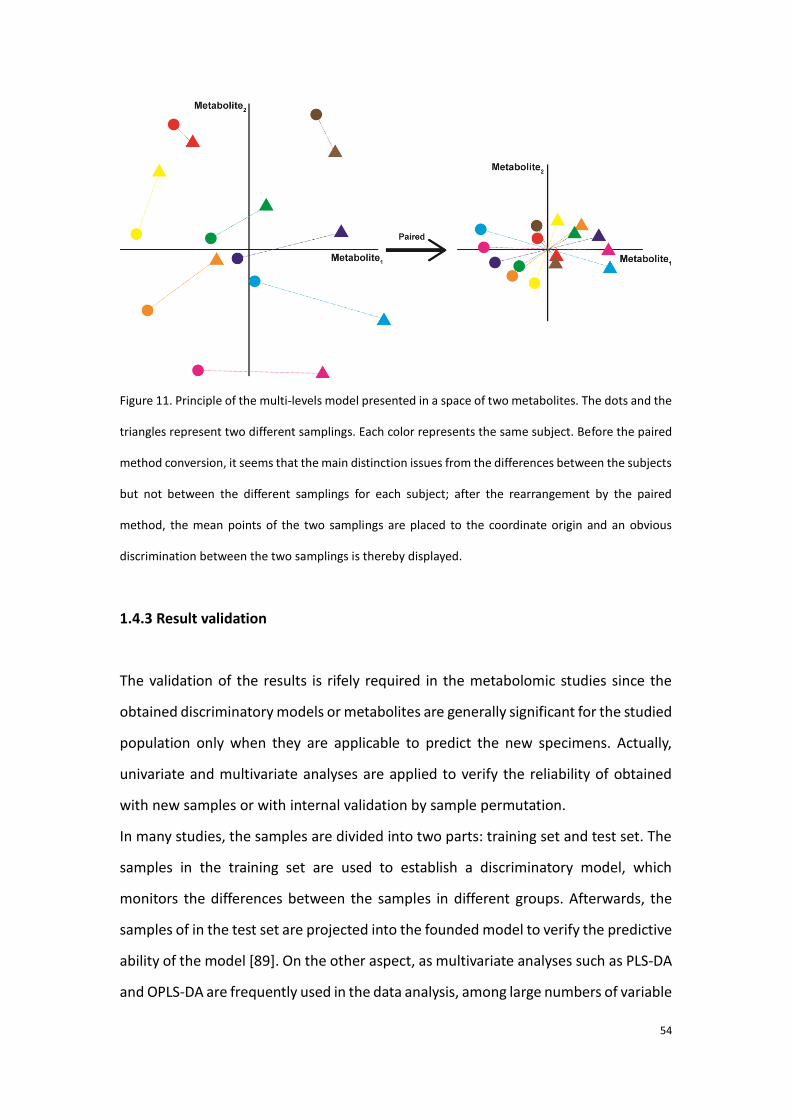
54
Figure 11. Principle of the multi-levels model presented in a space of two metabolites. The dots and the
triangles represent two different samplings. Each color represents the same subject. Before the paired
method conversion, it seems that the main distinction issues from the differences between the subjects
but not between the different samplings for each subject; after the rearrangement by the paired
method, the mean points of the two samplings are placed to the coordinate origin and an obvious
discrimination between the two samplings is thereby displayed.
1.4.3 Result validation
The validation of the results is rifely required in the metabolomic studies since the
obtained discriminatory models or metabolites are generally significant for the studied
population only when they are applicable to predict the new specimens. Actually,
univariate and multivariate analyses are applied to verify the reliability of obtained
with new samples or with internal validation by sample permutation.
In many studies, the samples are divided into two parts: training set and test set. The
samples in the training set are used to establish a discriminatory model, which
monitors the differences between the samples in different groups. Afterwards, the
samples of in the test set are projected into the founded model to verify the predictive
ability of the model [89]. On the other aspect, as multivariate analyses such as PLS-DA
and OPLS-DA are frequently used in the data analysis, among large numbers of variable
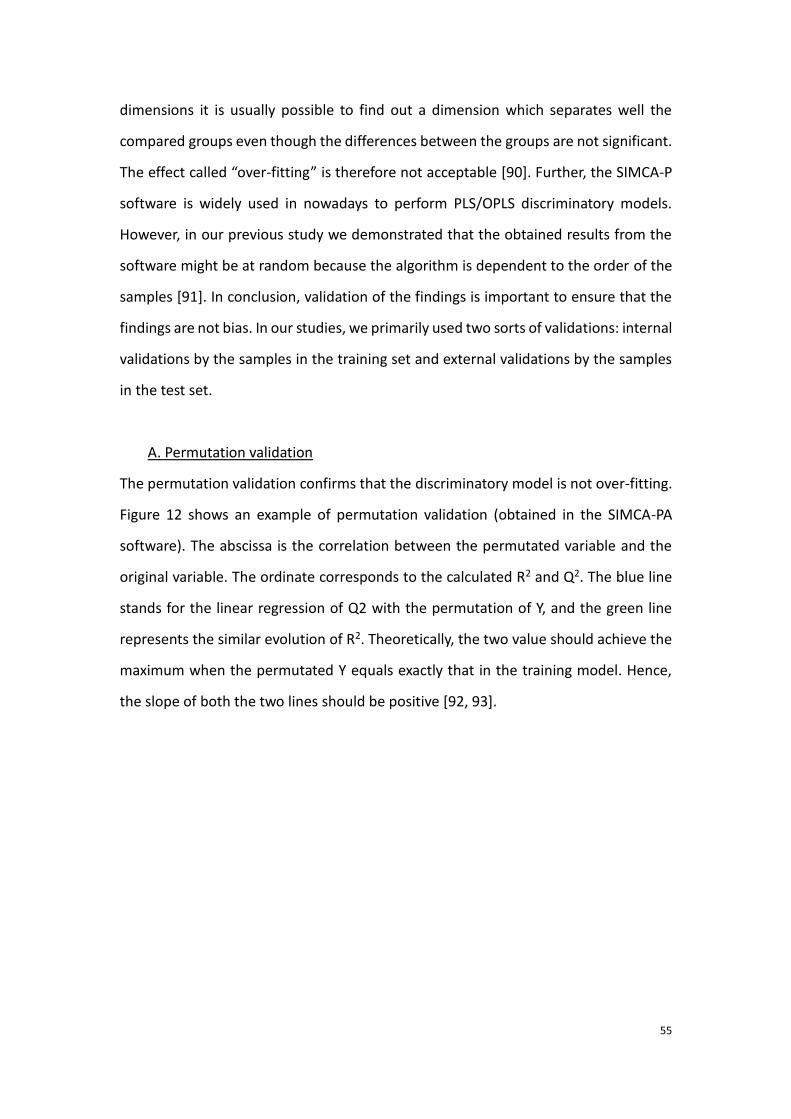
55
dimensions it is usually possible to find out a dimension which separates well the
compared groups even though the differences between the groups are not significant.
The effect called “over-fitting” is therefore not acceptable [90]. Further, the SIMCA-P
software is widely used in nowadays to perform PLS/OPLS discriminatory models.
However, in our previous study we demonstrated that the obtained results from the
software might be at random because the algorithm is dependent to the order of the
samples [91]. In conclusion, validation of the findings is important to ensure that the
findings are not bias. In our studies, we primarily used two sorts of validations: internal
validations by the samples in the training set and external validations by the samples
in the test set.
A. Permutation validation
The permutation validation confirms that the discriminatory model is not over-fitting.
Figure 12 shows an example of permutation validation (obtained in the SIMCA-PA
software). The abscissa is the correlation between the permutated variable and the
original variable. The ordinate corresponds to the calculated R2 and Q2. The blue line
stands for the linear regression of Q2 with the permutation of Y, and the green line
represents the similar evolution of R2. Theoretically, the two value should achieve the
maximum when the permutated Y equals exactly that in the training model. Hence,
the slope of both the two lines should be positive [92, 93].
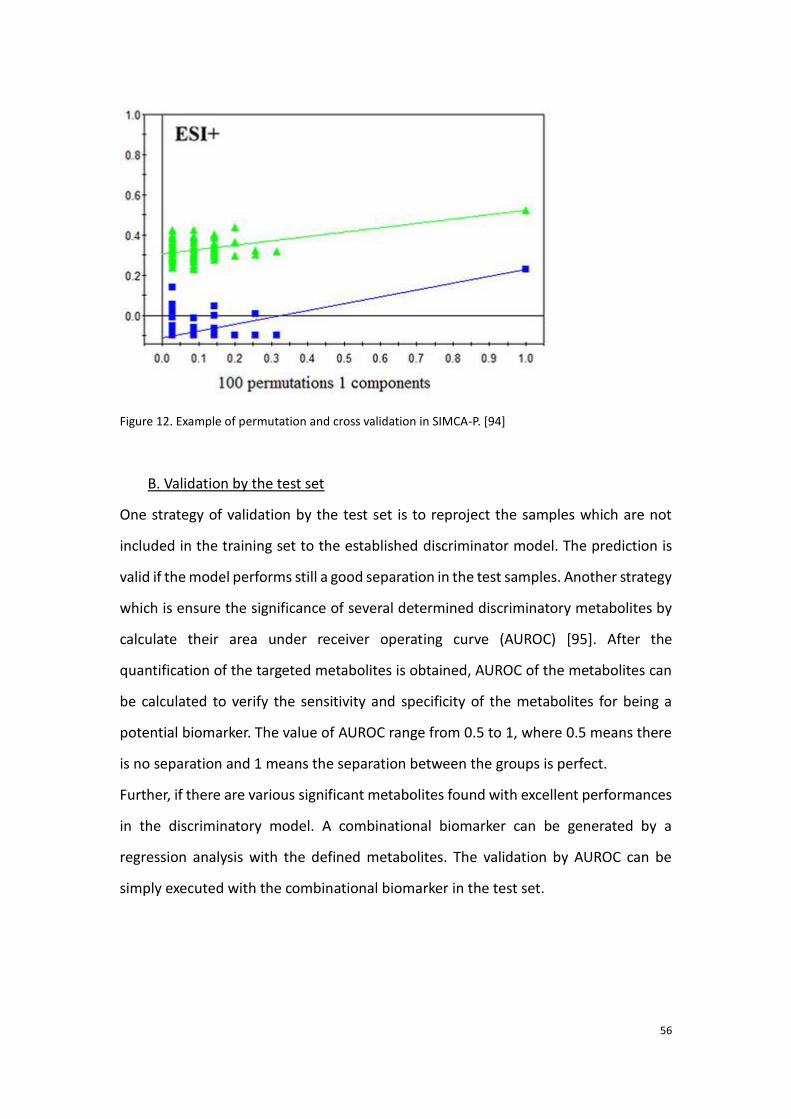
56
Figure 12. Example of permutation and cross validation in SIMCA-P. [94]
B. Validation by the test set
One strategy of validation by the test set is to reproject the samples which are not
included in the training set to the established discriminator model. The prediction is
valid if the model performs still a good separation in the test samples. Another strategy
which is ensure the significance of several determined discriminatory metabolites by
calculate their area under receiver operating curve (AUROC) [95]. After the
quantification of the targeted metabolites is obtained, AUROC of the metabolites can
be calculated to verify the sensitivity and specificity of the metabolites for being a
potential biomarker. The value of AUROC range from 0.5 to 1, where 0.5 means there
is no separation and 1 means the separation between the groups is perfect.
Further, if there are various significant metabolites found with excellent performances
in the discriminatory model. A combinational biomarker can be generated by a
regression analysis with the defined metabolites. The validation by AUROC can be
simply executed with the combinational biomarker in the test set.
57
1.4.4 Biological interpretation
The detection of the significant variations in the metabolites enables to deduce the
variation of the involved metabolic pathways. Typically, for the clinical application of
metabolomics, the understanding of deregulation of the metabolic pathways is
important which provides evidence to improve the diagnosis, prognosis and as well as
the treatment protocol. Frequently used database of metabolic pathways include
“KEGG pathway” (http://www.kegg.jp/kegg/pathway.html) and “HMDB pathway”
(http://www.hmdb.ca/pathways) [96-98]. The database not only reveals the
attribution of metabolic pathway for the metabolites, but it provides information of
related proteins and genes as well. Furthermore, the metabolomic results inspire the
complementary experiences with other omics platforms. Accordingly, the parallel
observation in the genome or proteome improves the understanding of the origin of
the variation of metabolites. Besides, some online software such as “Metaboanalyst
3.0” (www.metaboanalyst.ca) [99] and “Biocyc” (http://biocyc.org) [100] are available
to induce the metabolic and signaling pathways which are correlated with the
determined discriminators. Some commercial bioinformatics solutions (e.g IPA
https://www.qiagenbioinformatics.com/products/ingenuity-pathway-analysis/ and
MetaCore https://portal.genego.com/ ) provide useful features for performing
molecular pathway and network analyses. Most of them integrate information from
different omics approaches and focus on providing solutions that facilitate a deeper
insight into the role of the metabolites in the molecular mechanisms of patho-
physiological processes [101].
1.4.5 Comparison and combination between NMR-based and MS-based
metabolomics.
Both NMR and MS, which are the two principal techniques in metabolomics, have
been used for the determination of clinical biomarkers in this study.
58
A comparison between the two approaches concerning their application in
metabolomics shows that MS provides a wider coverage of metabolites than NMR
does. The reason should be that MS brings a better sensitivity. Metabolome is usually
analyzed in 1H NMR-based metabolomics with limits of detection on the order of
10μM [102]. A study of Nicolson et al. has eventually determined about 55
metabolomics in human plasma by different sequences using a 750MHz NMR
spectrometer [103]. The number of defined metabolites increased to 70 in another
study using GC-MS during only one analysis in the plasma of sheep [104], given that
more metabolites are possible to be identified with LC-MS. Even though using a
cryoprobe helps to improve the sensitivity and resolution for NMR, the high cost limits
its use. Indeed, especially for untargeted metabolic profiling, the coverage of
metabolites is crucial to find out as more significant variations as possible in the
metabolome.
However, the quantification of NMR-based method is more reliable since the
reproducibility is better and the acquisition is less influenced by the salinity of the
sample [102]. Alterations may be present among the results obtained from MS
instruments within different tandems and from the bias of alignment and peak
matching which are performed with the software for a same sample [105]. Besides,
NMR-based method needs a simpler preparation of samples and also do less damage
to the samples.
Studies using the combination of both NMR and MS-based methods have been
performed, which showed that the two methods were well complementary.
Apparently, the coverage of metabolites is improved by using both of the two
techniques and it was shown that the combination of the data sets from the two
methods is promising for metabolomic studies [106, 107]. Using the combination of
the two techniques helps to develop a high-throughput metabolomic method of tissue
extraction [108]. Another study showed that using the two methods together helps to
fast identify unknown metabolites [109].
59
II. Metabolomic studies of sepsis and septic shock
2.1 Introduction of sepsis and septic shock
Sepsis is defined as a systemic inflammatory response syndrome (SIRS) which is caused
by infections [110, 111]. It’s diagnosed by the symptoms such as abnormal body
temperature, rapid breathing, elevated heart rate, confusion and edema [112, 113].
As sepsis develops, severe sepsis is characterized by the advent of organ dysfunction
or tissue hypoperfusion [114]. Septic shock is the most severe stage which is
accompanied by multiple organ dysfunction syndrome (MODS) [115] and a continuous
intractable low blood tension [116, 117]. The evolution of sepsis is shown in Figure 19
[117]. Furthermore, complications such as bleeding [118], coagulation and thrombus
[119, 120], necrosis [121] are also frequently present along the sepsis which aggravate
the case. Sepsis is usually caused by bacterial infection and it is also possible to be
caused by the invasion of fungi or virus [122]. Of which, kinds of gram-positive and
gram-negative bacteria were found to be mainly related [123].
In recent years, although improvement of effective antibiotic therapies are applied in
the treatment [124], and the early goal-directed therapy is also widely suggested [125,
126], but the mortality of sepsis, or especially septic shock, remains high (up to 30% -
50%) [127, 128] because of complexities and the lack of evidence in the early prognosis
with the frequently used biomarkers (e.g. CRP, IL-6, PCT, etc.)[129, 130] or clinical score
assessments (e.g. SOFA), in this context, new methods for the diagnosis and for
predicting the outcome of sepsis in the early stage are eagerly required.
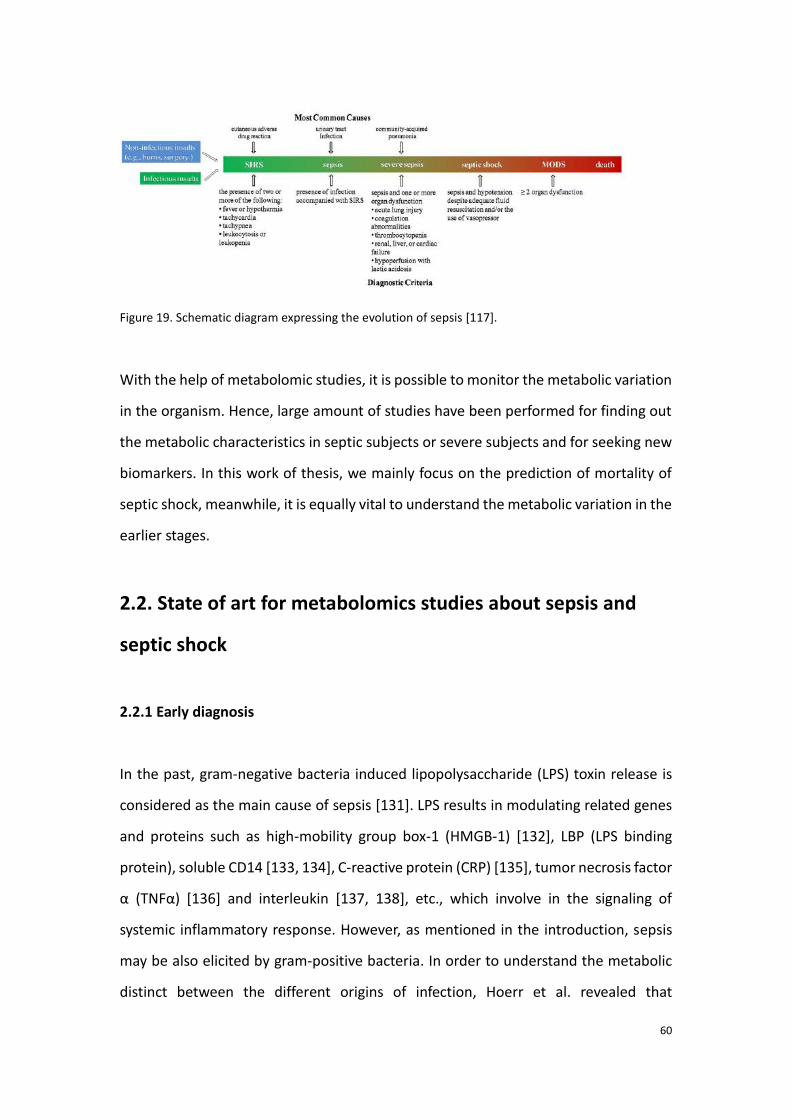
60
Figure 19. Schematic diagram expressing the evolution of sepsis [117].
With the help of metabolomic studies, it is possible to monitor the metabolic variation
in the organism. Hence, large amount of studies have been performed for finding out
the metabolic characteristics in septic subjects or severe subjects and for seeking new
biomarkers. In this work of thesis, we mainly focus on the prediction of mortality of
septic shock, meanwhile, it is equally vital to understand the metabolic variation in the
earlier stages.
2.2. State of art for metabolomics studies about sepsis and
septic shock
2.2.1 Early diagnosis
In the past, gram-negative bacteria induced lipopolysaccharide (LPS) toxin release is
considered as the main cause of sepsis [131]. LPS results in modulating related genes
and proteins such as high-mobility group box-1 (HMGB-1) [132], LBP (LPS binding
protein), soluble CD14 [133, 134], C-reactive protein (CRP) [135], tumor necrosis factor
α (TNFα) [136] and interleukin [137, 138], etc., which involve in the signaling of
systemic inflammatory response. However, as mentioned in the introduction, sepsis
may be also elicited by gram-positive bacteria. In order to understand the metabolic
distinct between the different origins of infection, Hoerr et al. revealed that
61
differences in metabolic profile exist between gram-positive and gram-negative
induced infections in mouse model. The main discriminators were detected as kinds
of amino acids, urea, and Krebs cycle involved metabolites [139].
Metabolomic approach is applicable to deduce the stage of sepsis as a LC-MS based
metabolomic study has shown discrimination of metabolic profile among the different
stage of sepsis [140].
Using 1H NMR-based metabolomic analyses with lung tissue, BAL fluid and serum
respectively, Izquierdo-Garcia et al. realized new models which consists of
discriminatory metabolites such as alanine, creatinine and myoinositol differing septic
rats from healthy ones [141]. In human patients, with the help of the similar approach,
another work using serum concerning sepsis early diagnosis was performed by
Mickiewicz et al. In their work, metabolic differences were compared not only
between septic and control subjects but also between the septic and SIRS patients.
Accordingly, it’s shown that it was feasible to achieve discriminations among the three
group of patients with high specificity and sensitivity [142]. On the other hand, urine
samples analyzed by GC-MS also showed separation among controls, late and early
onset of neonatal sepsis [143]. Besides, targeted metabolomics study involving 186
analytes emerged important discriminations between SIRS without infection patients
and septic ones. In the study, fatty acid (C10:1) and PCaaC32:0 showed good reliability
to characterize sepsis compared with SIRS [144].
2.2.2 Prognosis
Sepsis, especially severe sepsis and septic shock trigger a high mortality rate in the
patients. Accordingly, there is always an urgent needs of accurate prognosis in the
early stage. As the variation of metabolic profile is sensible to the evaluation of the
disease severity, metabolomics is therefore a useful tool to predict the outcome of
sepsis.
In the study of Lin et al, cecal ligation and puncture (CLP) was operated for imitating
sepsis in rodents [145]. They predicted thereby the prognosis of sepsis by comparing
62
the metabolic profile according to NMR spectroscopy of the surviving rats and the non-
survivors. It was found in their work that elevated level of lactate, alanine,
acetoacetate, acetate and hydroxybutyrate were witnessed in the non-surviving rats.
Meanwhile, the decreased metabolite was formate [146]. Similar work which was
performed by the (high performance liquid chromatography) HPLC-MS has revealed
that considerable variations were further found in the serum fatty acids such as oleic
and linoleic acid [147].
The prediction of outcome in the human patients is extensively focused by the
researchers. With the NMR-based metabolomic study on urine from severe sepsis or
septic shock patients, patients with positive prognosis were separable from the ones
with negative prognosis. The major discriminators included some amino acids, glucose
and ethanol [148].
Recently, combination of multiple platform is favored in the prognosis of sepsis. Indeed,
with the help of various techniques, the findings will be ensured. By integrating
metabolomic analyses and inflammatory mediator profiling, death in sepsis was well
predicted, they found that the combination of metabolites and inflammatory
mediators show a better sensitivity and specificity in the prediction than the classical
clinical evolution systems (e.g. SOFA, APACHE) [149]. Furthermore, applying together
metabolomics and proteomics also showed an excellent improvement of prognosis by
Langley et al [150]. They reported that the defect of fatty acids and their related
carnitine variations were the first obvious characteristics of adverse outcome in sepsis.
Some energy-related metabolites such as lactate, citrate, malate and gluconeogenic
amino were generally increased in the serum of non-survivors. Their findings were
generally in accord with other studies except that they did not find differences in the
metabolic profiles between different origins infected sepsis (among S. pneumonia, S.
aureus, or E. coli infections).
2.2.3 Other metabolomic studies concerning sepsis
Sepsis-induced dysfunction of organ is one of the main aggravated factors of the
63
disease [151, 110, 152-156]. Hence, various studies focused on determining the
metabolic variations of dysfunction of different organs. For example, research of
sepsis-induced acute lung injury exhibited a remarkable increase of glutathione,
adenosine, phosphatidylserine in septic patients compared with the healthy controls,
which indicated the increased oxidant stress, loss of ATP homeostasis and apoptosis
respectively; and a decrease level of sphingomyelin which reflected the disruption of
endothelial barrier function [157]. For the case sepsis-induced liver dysfunction,
targeted metabolome in rats were analyzed by Racknagel et al. Increasing levels of bile
acids were discovered in the septic patients with liver dysfunction than those in
controls [158]. Sepsis involved heart and kidney injury were also studied by
metabolomics, as to the findings, abnormal concentration of carnitine and its
derivatives were correlated to the acute kidney injury (AKI) [159], and the affected
Krebs cycle enzymes by the sepsis was considered as the main factor of heart failure
[160].
Other metabolomic studies on sepsis includes the one of Stinger et al., who explained
in their studies that metabolomic studies on whole blood (WB) might be less lengthy
and might retain more information including blood cells. According to their work, most
metabolites leads to a higher concentration of metabolites than those in the serum;
18 vital metabolites were uniquely detected in the WB. Their work remind us using the
WB might be in priority for studying sepsis [161].
64
2.3 Experimental research: Determination of metabolic
differences between the septic shock survivors and non-
survivors
As it has been introduced in the beginning of the chapter, to date, the mortality rate
in the septic shock patients still remains high, thus, there is always an urgent need of
effective prognostic method. Hence, we attempt to investigate the metabolic
differences between the septic shock survivors and non-survivors by using the
metabolomic approach. We expected to better understand the clinical features in the
cases with poor outcome, according to our results, which might give reason to execute
specific treatments.
We are aware that more information can be obtained by using both NMR spectroscopy
and MS metabolomics. Thus, the two methods were experienced to finalize the
experimental research. Our first study aims to use LC-MS to find out the metabolic
differences between the septic shock survivors and non-survivors before clinical
interventions.
Before the performance of the study, the choice of studied cohort and the
selection of the samples are crucial within the experimental design. The cohort of
subjects is screened in order to homogenize the samples.
As it was well known that the age was related to the survival rate of sepsis [162], and
the majority of patients were aged more than 55 years old. Consequently, a few
patients younger than 30 years were primarily excluded. The patients with cancer were
also excluded in the analyses. This is because extensive metabolic pathways are prone
to be modified by the tumor-related signaling [163]. Patients with cirrhosis or chronic
kidney diseases were also removed since the injury in the liver and kidney by the two
complications hinders the immune defense [164]. Also, the two factors were reported
to impact the survival by the previous studies [165, 166]. Indeed, the patients affected
by blood diseases were not included because the innate distinct in the blood might
influence the discriminatory analyses.
65
Sera metabolomics has been proven effective in the previous studies. Of note, sera
metabolome is informative. Serum is also easy to be collected and stored. Compared
with other biofluids, the stability and integrity of sera are preeminent [167]. Hence,
serum is focused as the prime subject in the thesis works of metabolomics.
As regard to the determination of metabolic differences between the septic survivors
and non-survivors. The samplings at the admission of hospitalization were in priority
to be used for the metabolomic study, for the metabolic profiles are least intervened
by the clinical treatment. Besides, the investigation in the samplings before treatments
seems the most significant to display the internal variations which are triggered by the
disease. As a consequence, the first study predicting the mortality of septic shock by
the metabolome variations was done with the samples at H0 (drawn before clinical
interventions).
2.3.1 Study 1: Application of LC-MS-based metabolomics method in differentiating
septic survivors from non-survivors.
74
According to the findings in the first study, we were informed that the metabolic
profiles of the septic shock survivors were well distinguished from those of the non-
survivors. In the following step, we considered to understand if there also exists
differences of evolutions of the case in the metabolome between the survived and
dead septic shock patients. Also, a NMR-based metabolomic study may confirm our
findings of the LC-MS-based study and may provide complementary information of
metabolome variations predicting the septic shock mortality. Consequently, the
second study on the determination of metabolite biomarkers for predicting septic
shock mortality was performed with 1H NMR spectroscopy in our French laboratory.
2.3.2. Study 2: 1H NMR spectroscopy based metabolomic study predicting the
mortality of septic shock in the early stage and during its evolution
75
1H NMR spectroscopy based metabolomic study
predicting the mortality of septic shock in the early
stage and during its evolution
Zhicheng LIU1, Roland AMATHIEU1,2, Mohamed TRIBA1, Nadia BOUCHEMAL1,
Xiangping Lin1, Laurence LE MOYEC3, Philippe Savarin1
1. Sorbonne Paris Cité, Laboratoire de Chimie, Structures et Propriétés de
Biomateriaux et d’Agents Therapeutiques, UMR 7244, University Paris 13 Bobigny,
France
2. Intensive Care Unit Jean Verdier Teaching Hospital, AP-H, Bondy, France
3. University of Evry Val d’Essonne, UBIAE, INSERM U902, Evry, France
Abstract
Septic shock is the most severe phase of sepsis, leading a high mortality. However, the
prognosis of septic shock remains difficult for the present. In the current study, to
investigate the differences of metabolic profile between the septic shock survivors and
the non-survivors, we set up models separating the two group of patients using NMR
based metabolomic. We report that the metabolic differences are found both before
the clinical treatment and during 24 hours after the hospitalization. Further, the up-
regulating metabolites such as glucose, lactate, creatinine in the separations between
survivors and non-survivors are exposed to be decreased in the survivors during 24
hours after the hospitalization. Our separating models also show better predictions of
mortality than the clinical scores. The results determine that the NMR based
metabolomic is useful for the prediction of mortality of septic shock.
Key words: 1H Nuclear Magnetic Resonance spectroscopy, metabolomics, septic shock,
discriminatory model, biomarkers.
76
Introduction
Septic shock is the most severe phase of sepsis [1, 2]. It is intractable as it is usually
accompanied by types of complications such as hypotension and multiple organ
dysfunctions syndrome (MODS) [3]. The common strategies of treatment for septic
shock include the antibiotic therapy and the compressive infusion. In recent years, the
early goal-directed therapy (EGDT) which improves curative effect is recommended to
be applied [4, 5]. However, the early personalized prognosis and diagnosis remain
challenging because of the complicated etiology and pathogenesis. Evaluation with
some biomarkers (e.g. TNF-alpha, IL-6 and PCT, etc.) and with clinical scores such as
sequential organ failure assessment (SOFA) [6] have been applied for the prognostic,
their reliabilities are not satisfactory [7]. Thus, there is still an urgent task to find new
methods the early prognosis and diagnosis.
Recently, studies have shown that the metabolomics is employable for early diagnosis
and for predicting clinical prognosis. As regard to the researches in sepsis, in the
comparison between the septic patients and healthy subjects, potential biomarkers
have been announced with their good performance characterizing sepsis. Mickiewicz
et al. reported that they were able to distinguish the differences between systemic
inflammatory response syndrome (SIRS) [8]. Some other works have shown
discriminations of metabolic profile of septic patients in the early stage of sepsis in the
condition of the outcome. In our previous pilot study, we have also applied the liquid-
chromatography – mass spectrometry (LC-MS) based metabolomic to expose
important differences in the metabolic prolife between the septic shock survivors and
non-survivors before clinical intervention. Most of these studies were designed to be
performed by using the samples at a single time point. However, empirically, good
outcome of the illness also depends on positive compliance to the treatment and a
good understanding of individual feedback should be therefore the foundation of
personalized therapy. Consequently, in the present study we proceed to discover the
discrimination of metabolic profile between the septic shock survivors and non-
77
survivors both before and during the treatment by using 1H NMR spectroscopy
metabolomics.
Materials and Methods
Patients and samples collection
All human serum samples were collected by the Jean Verdier Hospital, Paris, written
informed consent was obtained from all subjects or their surrogate decision maker.
Patients according with specific published criteria for septic shock at admission to the
intensive care unit (ICU) were enrolled in this study. The samplings were fulfilled from
January 2009 to December 2011. The screening standard included following factors:
(1) younger than 30 years old; (2) hematonosis; (3) cancer and other metabolic-related
diseases; (4) cirrhosis or chronic kidney disease. We included definitely 29 patients
who died within 7 days after admission to the ICU and 21 alive patients in our study.
All the samplings were obtained before clinical therapies on the patients under fasting
condition. Serum were subsequently stored at -80oC before experiments.
The serum samples were drawn under fasting conditions and were subsequently
stored at -80oC.
Sample preparation
450 μL of unfreezed samples were pipetted into a NMR tube of 5mm diameter
together with 50μL of D2O. Prepared samples were then submitted to the NMR
spectroscopy (Advance III, Bruker, Germany) Spectra were acquired at 297K (Other
parameters). The 1H NMR spectra were recorded by the Carr-Purcell-Meiboom-Gill
(CPMG) sequence [9]. The spin-spin relaxation delay was during 18ms with 128
transients in one record. For several samples, the 2D NMR experiments by the total
correlation spectroscopy (TOCSY) sequence were achieved to affirm the quantification
with the 1D spectra. The mixing time was 80ms with 32 transients in one record.
78
Data processing
After the spectra were acquired for all the samples, they were manually phased and
their linear baseline were unified based on the NMRPipe Software[10]. All free
induction decays (FIDs) were multiplied by a 0.3 Hz exponential line broadening factor
prior to Fourier Transformation. The spectral region was restricted between -1 to
10ppm with 11000 divisions of 0.01ppm. The region of water (4.6-5.5ppm) was
excluded in order to avoid the impact of its massive intense on other signals. Peaks
from 3.7 to 4.4ppm were also removed since peaks in the section represented the
infusion of the starch, which aided to heighten the blood tension in the patients. The
spectra were then normalized by the algorithm of quotient [11]. All the peaks were
centered by the method of auto-scaling. The peaks were adequately identified by the
Human metabolome database (HMDB, www.hmdb.ca) NMR library and by the
Chenomx software (Chenomx Inc, Canada).
Multivariate analyses
All the multivariate analyses were achieved in-house using the Matlab software
(version 2012b, Massachusetts, USA), based on the code of Trygg and Wold. A principal
component analysis (PCA) for all the recorded spectra data was first used to detect
outliers which may contain abnormally acquired peaks. Orthogonal projection to
latent structure-discriminant analysis (OPLS-DA) was applied to establish the
discriminatory models between different groups of patients. The models were
validated by the cross-validation method [12].
Results
Sample distribution
116 samples from 56 patients were obtained in which 49 enrolled samples were drawn
at the admission of hospitalization before clinical interventions (samples H0) in a part
of the patients and 57 samples were obtained 24 hours after the hospitalization with
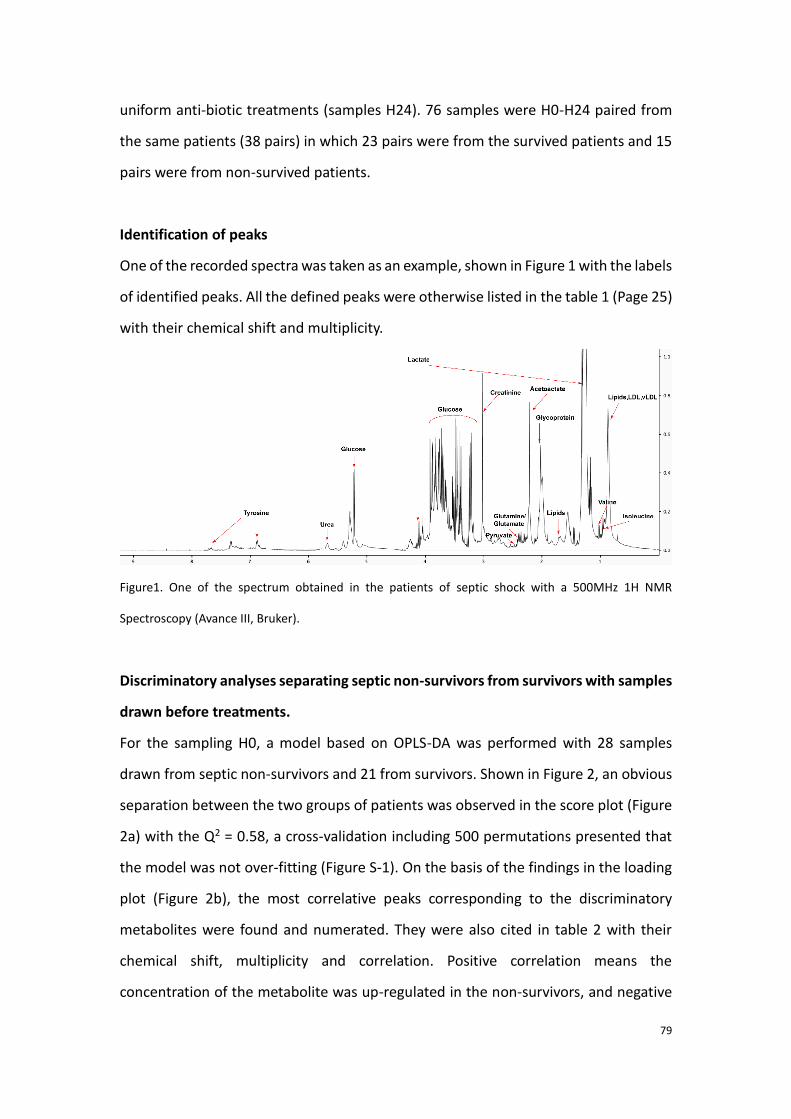
79
uniform anti-biotic treatments (samples H24). 76 samples were H0-H24 paired from
the same patients (38 pairs) in which 23 pairs were from the survived patients and 15
pairs were from non-survived patients.
Identification of peaks
One of the recorded spectra was taken as an example, shown in Figure 1 with the labels
of identified peaks. All the defined peaks were otherwise listed in the table 1 (Page 25)
with their chemical shift and multiplicity.
Figure1. One of the spectrum obtained in the patients of septic shock with a 500MHz 1H NMR
Spectroscopy (Avance III, Bruker).
Discriminatory analyses separating septic non-survivors from survivors with samples
drawn before treatments.
For the sampling H0, a model based on OPLS-DA was performed with 28 samples
drawn from septic non-survivors and 21 from survivors. Shown in Figure 2, an obvious
separation between the two groups of patients was observed in the score plot (Figure
2a) with the Q2 = 0.58, a cross-validation including 500 permutations presented that
the model was not over-fitting (Figure S-1). On the basis of the findings in the loading
plot (Figure 2b), the most correlative peaks corresponding to the discriminatory
metabolites were found and numerated. They were also cited in table 2 with their
chemical shift, multiplicity and correlation. Positive correlation means the
concentration of the metabolite was up-regulated in the non-survivors, and negative
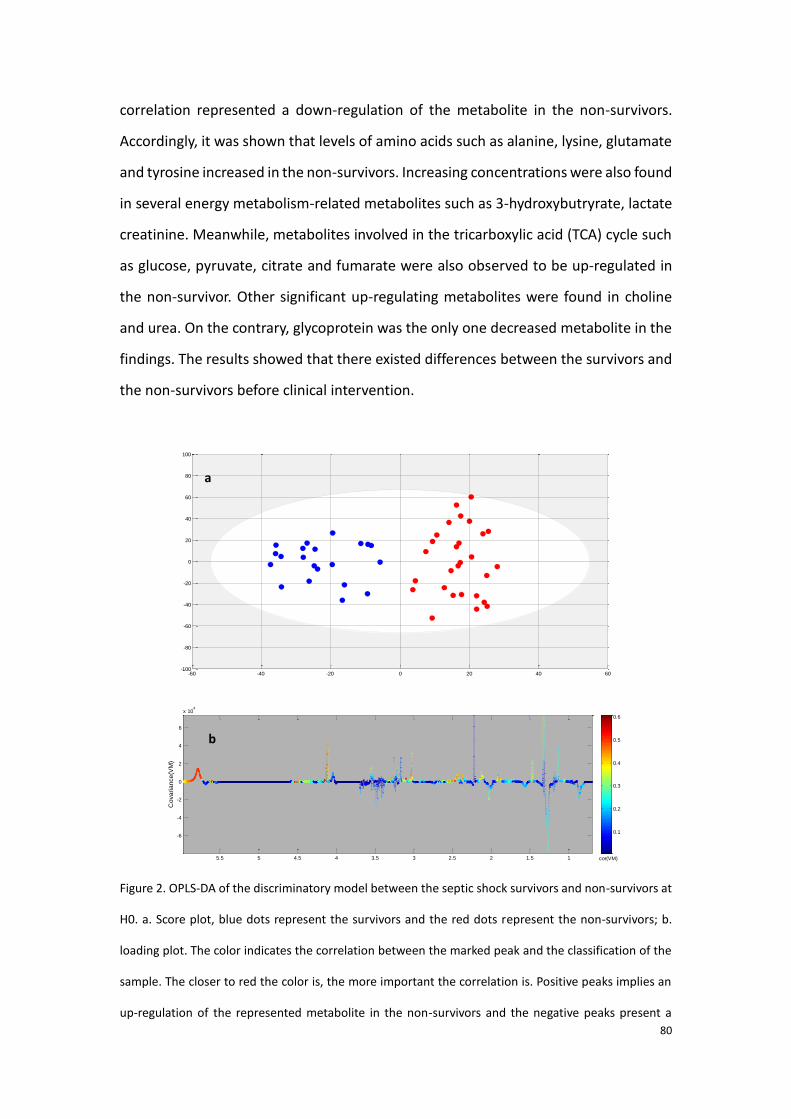
80
correlation represented a down-regulation of the metabolite in the non-survivors.
Accordingly, it was shown that levels of amino acids such as alanine, lysine, glutamate
and tyrosine increased in the non-survivors. Increasing concentrations were also found
in several energy metabolism-related metabolites such as 3-hydroxybutryrate, lactate
creatinine. Meanwhile, metabolites involved in the tricarboxylic acid (TCA) cycle such
as glucose, pyruvate, citrate and fumarate were also observed to be up-regulated in
the non-survivor. Other significant up-regulating metabolites were found in choline
and urea. On the contrary, glycoprotein was the only one decreased metabolite in the
findings. The results showed that there existed differences between the survivors and
the non-survivors before clinical intervention.
Figure 2. OPLS-DA of the discriminatory model between the septic shock survivors and non-survivors at
H0. a. Score plot, blue dots represent the survivors and the red dots represent the non-survivors; b.
loading plot. The color indicates the correlation between the marked peak and the classification of the
sample. The closer to red the color is, the more important the correlation is. Positive peaks implies an
up-regulation of the represented metabolite in the non-survivors and the negative peaks present a
Tpred
(7.3%)
To
rth (
15
.6%
)
-60 -40 -20 0 20 40 60-100
-80
-60
-40
-20
0
20
40
60
80
100
VM
0
0.25
0.5
0.75
1
11.522.533.544.555.5-5
0
5
10
15x 10
5
Chemical shift (ppm)
Me
dia
n s
ign
al in
ten
sity
cor-1-0.8-0.6-0.4-0.200.20.40.60.81
11.522.533.544.555.5
-6
-4
-2
0
2
4
6
x 104
Chemical shift (ppm)
Co
va
ria
nce
(VM
)
cor(VM)
0.1
0.2
0.3
0.4
0.5
0.6
a
b
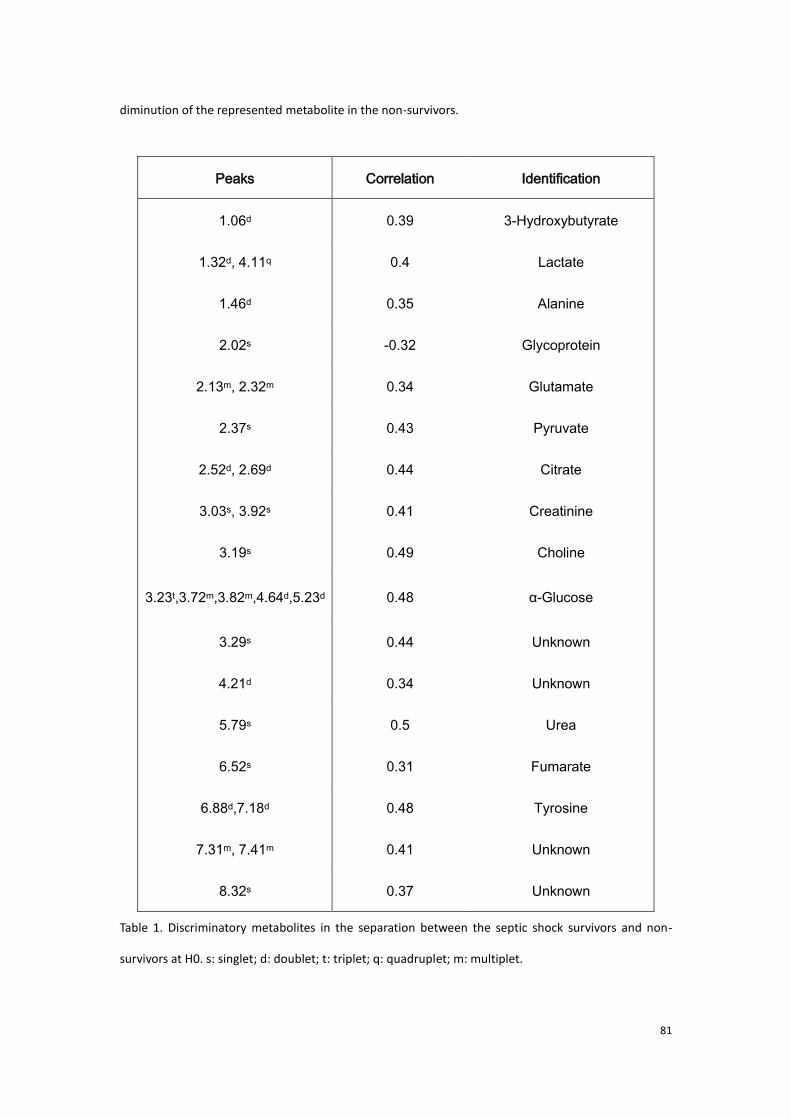
81
diminution of the represented metabolite in the non-survivors.
Peaks Correlation Identification
1.06d 0.39 3-Hydroxybutyrate
1.32d, 4.11q 0.4 Lactate
1.46d 0.35 Alanine
2.02s -0.32 Glycoprotein
2.13m, 2.32m 0.34 Glutamate
2.37s 0.43 Pyruvate
2.52d, 2.69d 0.44 Citrate
3.03s, 3.92s 0.41 Creatinine
3.19s 0.49 Choline
3.23t,3.72m,3.82m,4.64d,5.23d 0.48 α-Glucose
3.29s 0.44 Unknown
4.21d 0.34 Unknown
5.79s 0.5 Urea
6.52s 0.31 Fumarate
6.88d,7.18d 0.48 Tyrosine
7.31m, 7.41m 0.41 Unknown
8.32s 0.37 Unknown
Table 1. Discriminatory metabolites in the separation between the septic shock survivors and non-
survivors at H0. s: singlet; d: doublet; t: triplet; q: quadruplet; m: multiplet.
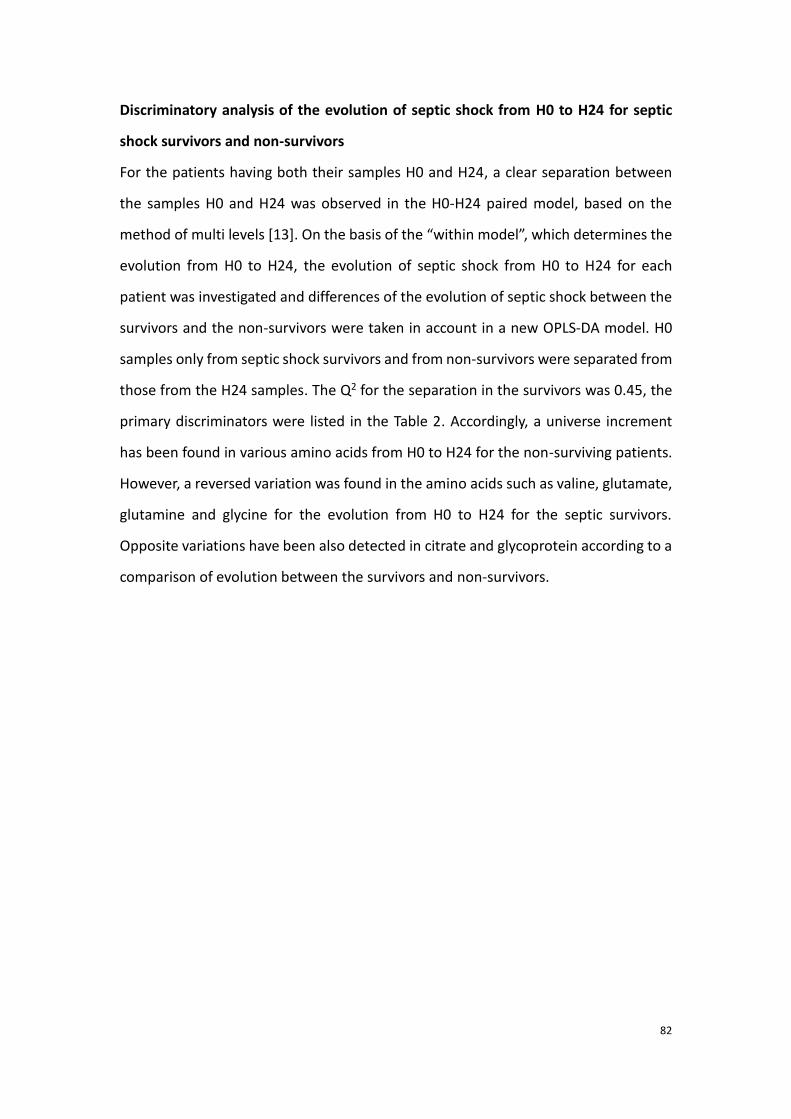
82
Discriminatory analysis of the evolution of septic shock from H0 to H24 for septic
shock survivors and non-survivors
For the patients having both their samples H0 and H24, a clear separation between
the samples H0 and H24 was observed in the H0-H24 paired model, based on the
method of multi levels [13]. On the basis of the “within model”, which determines the
evolution from H0 to H24, the evolution of septic shock from H0 to H24 for each
patient was investigated and differences of the evolution of septic shock between the
survivors and the non-survivors were taken in account in a new OPLS-DA model. H0
samples only from septic shock survivors and from non-survivors were separated from
those from the H24 samples. The Q2 for the separation in the survivors was 0.45, the
primary discriminators were listed in the Table 2. Accordingly, a universe increment
has been found in various amino acids from H0 to H24 for the non-surviving patients.
However, a reversed variation was found in the amino acids such as valine, glutamate,
glutamine and glycine for the evolution from H0 to H24 for the septic survivors.
Opposite variations have been also detected in citrate and glycoprotein according to a
comparison of evolution between the survivors and non-survivors.
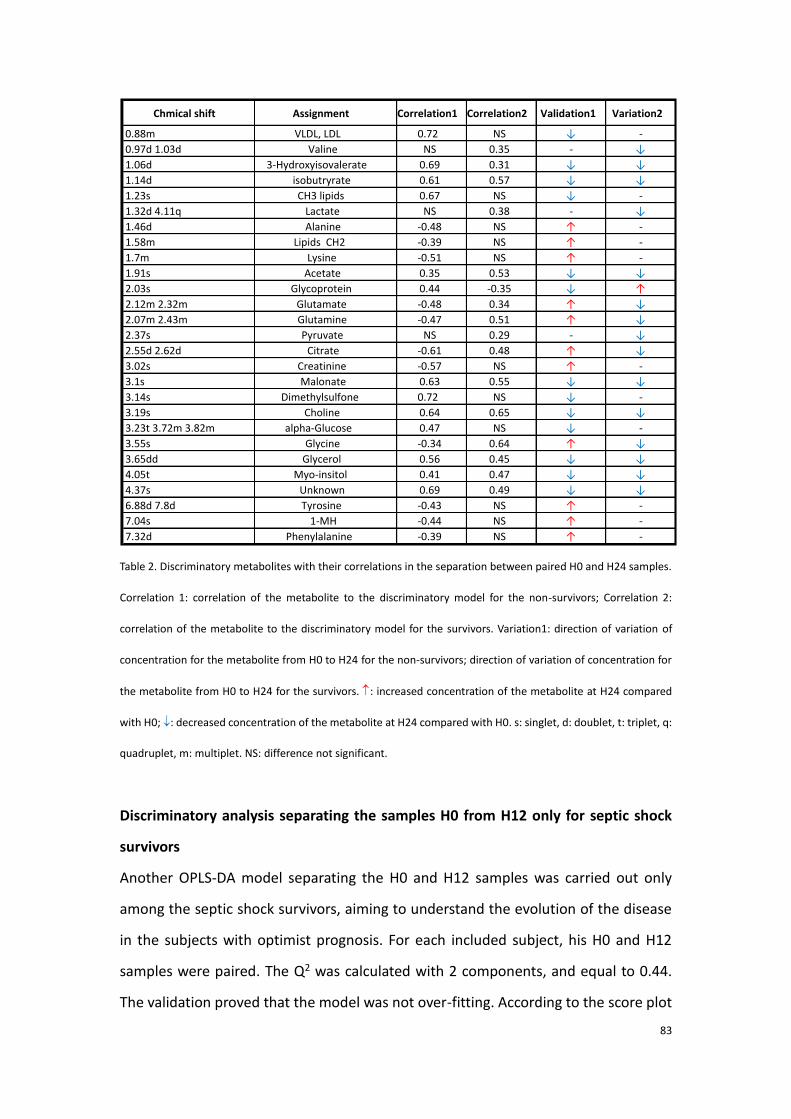
83
Table 2. Discriminatory metabolites with their correlations in the separation between paired H0 and H24 samples.
Correlation 1: correlation of the metabolite to the discriminatory model for the non-survivors; Correlation 2:
correlation of the metabolite to the discriminatory model for the survivors. Variation1: direction of variation of
concentration for the metabolite from H0 to H24 for the non-survivors; direction of variation of concentration for
the metabolite from H0 to H24 for the survivors. : increased concentration of the metabolite at H24 compared
with H0; : decreased concentration of the metabolite at H24 compared with H0. s: singlet, d: doublet, t: triplet, q:
quadruplet, m: multiplet. NS: difference not significant.
Discriminatory analysis separating the samples H0 from H12 only for septic shock
survivors
Another OPLS-DA model separating the H0 and H12 samples was carried out only
among the septic shock survivors, aiming to understand the evolution of the disease
in the subjects with optimist prognosis. For each included subject, his H0 and H12
samples were paired. The Q2 was calculated with 2 components, and equal to 0.44.
The validation proved that the model was not over-fitting. According to the score plot
Chmicalshift Assignment Correlation1 Correlation2 Validation1 Variation2
0.88m VLDL,LDL 0.72 NS ↓ -
0.97d1.03d Valine NS 0.35 - ↓
1.06d 3-Hydroxyisovalerate 0.69 0.31 ↓ ↓
1.14d isobutryrate 0.61 0.57 ↓ ↓
1.23s CH3lipids 0.67 NS ↓ -
1.32d4.11q Lactate NS 0.38 - ↓
1.46d Alanine -0.48 NS ↑ -
1.58m LipidsCH2 -0.39 NS ↑ -
1.7m Lysine -0.51 NS ↑ -
1.91s Acetate 0.35 0.53 ↓ ↓
2.03s Glycoprotein 0.44 -0.35 ↓ ↑
2.12m2.32m Glutamate -0.48 0.34 ↑ ↓
2.07m2.43m Glutamine -0.47 0.51 ↑ ↓
2.37s Pyruvate NS 0.29 - ↓
2.55d2.62d Citrate -0.61 0.48 ↑ ↓
3.02s Creatinine -0.57 NS ↑ -
3.1s Malonate 0.63 0.55 ↓ ↓
3.14s Dimethylsulfone 0.72 NS ↓ -
3.19s Choline 0.64 0.65 ↓ ↓
3.23t3.72m3.82m alpha-Glucose 0.47 NS ↓ -
3.55s Glycine -0.34 0.64 ↑ ↓
3.65dd Glycerol 0.56 0.45 ↓ ↓
4.05t Myo-insitol 0.41 0.47 ↓ ↓
4.37s Unknown 0.69 0.49 ↓ ↓
6.88d7.8d Tyrosine -0.43 NS ↑ -
7.04s 1-MH -0.44 NS ↑ -
7.32d Phenylalanine -0.39 NS ↑ -
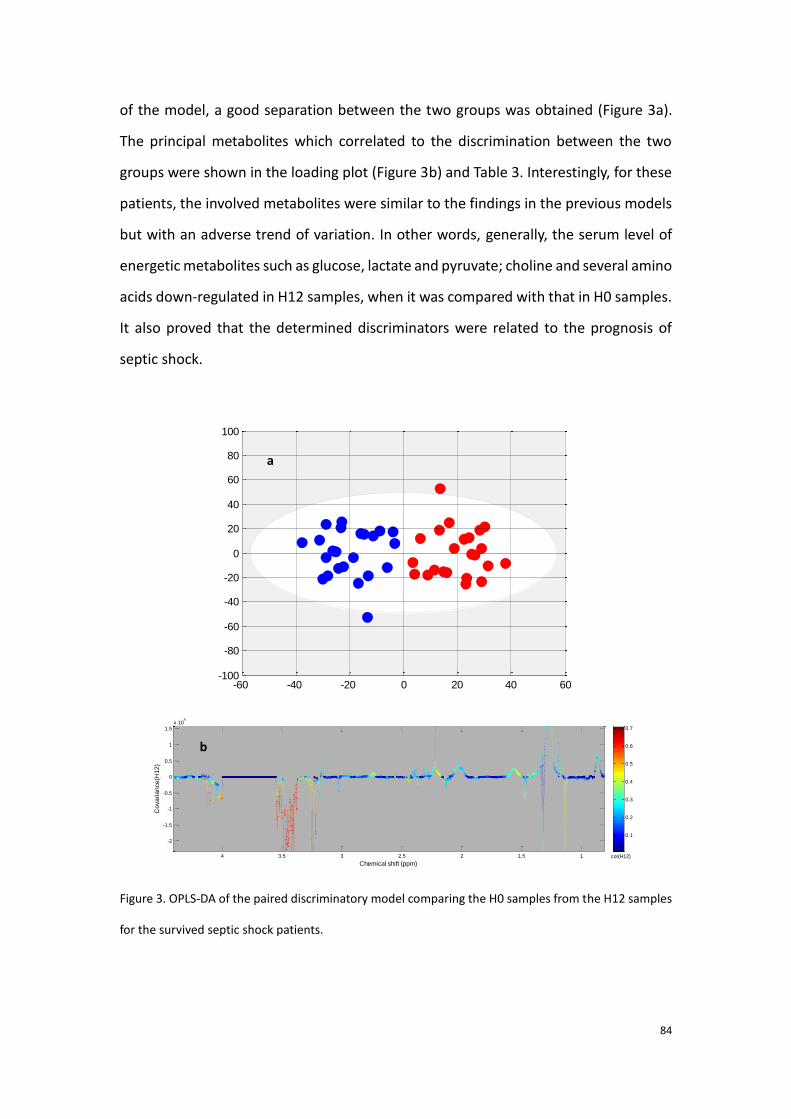
84
of the model, a good separation between the two groups was obtained (Figure 3a).
The principal metabolites which correlated to the discrimination between the two
groups were shown in the loading plot (Figure 3b) and Table 3. Interestingly, for these
patients, the involved metabolites were similar to the findings in the previous models
but with an adverse trend of variation. In other words, generally, the serum level of
energetic metabolites such as glucose, lactate and pyruvate; choline and several amino
acids down-regulated in H12 samples, when it was compared with that in H0 samples.
It also proved that the determined discriminators were related to the prognosis of
septic shock.
Figure 3. OPLS-DA of the paired discriminatory model comparing the H0 samples from the H12 samples
for the survived septic shock patients.
Tpred
(9.2%)
To
rth (
13
.3%
)
-60 -40 -20 0 20 40 60-100
-80
-60
-40
-20
0
20
40
60
80
100
H12
0
0.25
0.5
0.75
1
11.522.533.540
2
4
6x 10
7
Chemical shift (ppm)
Me
dia
n s
ign
al in
ten
sity
cor-1-0.8-0.6-0.4-0.200.20.40.60.81
11.522.533.54
-2
-1.5
-1
-0.5
0
0.5
1
1.5x 10
4
Chemical shift (ppm)
Co
va
ria
nce
(H1
2)
cor(H12)
0.1
0.2
0.3
0.4
0.5
0.6
0.7
a
b
.
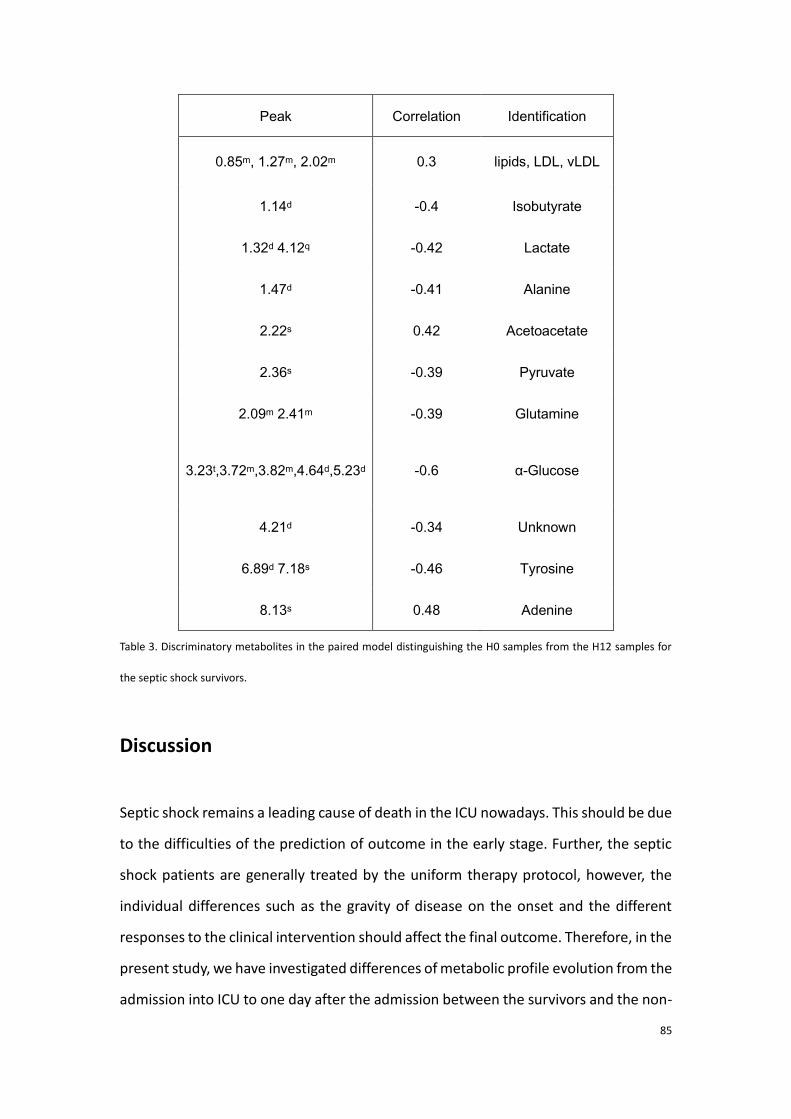
85
Peak Correlation Identification
0.85m, 1.27m, 2.02m 0.3 lipids, LDL, vLDL
1.14d -0.4 Isobutyrate
1.32d 4.12q -0.42 Lactate
1.47d -0.41 Alanine
2.22s 0.42 Acetoacetate
2.36s -0.39 Pyruvate
2.09m 2.41m -0.39 Glutamine
3.23t,3.72m,3.82m,4.64d,5.23d -0.6 α-Glucose
4.21d -0.34 Unknown
6.89d 7.18s -0.46 Tyrosine
8.13s 0.48 Adenine
Table 3. Discriminatory metabolites in the paired model distinguishing the H0 samples from the H12 samples for
the septic shock survivors.
Discussion
Septic shock remains a leading cause of death in the ICU nowadays. This should be due
to the difficulties of the prediction of outcome in the early stage. Further, the septic
shock patients are generally treated by the uniform therapy protocol, however, the
individual differences such as the gravity of disease on the onset and the different
responses to the clinical intervention should affect the final outcome. Therefore, in the
present study, we have investigated differences of metabolic profile evolution from the
admission into ICU to one day after the admission between the survivors and the non-
86
survivors. On the basis of our results, we exposed that metabolic differences might
exist both before and during the clinical therapy between the septic shock survivors
and non-survivors. Discriminators such as lactate, creatinine, glucose and glutamate
were present in the two separation, they were all up-regulated in the non-survivors.
According to the comparison of evolution H0 to H24 between survivors and non-
survivors, opposite variations in the metabolites such as several amino acids, citrate
and glycoprotein were found. An increased level of various amino acids and citrate in
the non-survivors at H24, compared with H0, showed a more severe case of septic
shock as the same result had been exhibited with the separation between the
survivors and non-survivors before clinical intervention. Besides, the decrement of
glycoprotein from H0 to H24 for the non-surviving patients was accord with the finding
obtained in the survivors vs. non-survivors model at H0. On the contrary, decreased
levels of amino acids such as glutamate, glutamine and glycine, as well as citrate were
found in the H0 to H24 evolution for the survivors and an increased concentration of
glycoprotein was obtained at H24 compared with H0 for the survivors, which affirm
that the defined significant discriminators were responsible for the death before and
even after clinical intervention.
Also, we report that the above discriminators decreased in the survivors from H0 to
H12, this finding confirmed that the blood level of the discovered discriminators were
correlated with bad prognosis of septic shock. Namely, the higher the level of these
molecule was, the poorer the outcome was during the first twelve hours after
hospitalization.
It has been reported that sepsis related systemic inflammatory responses (SIRS)
elicited insulin resistance (IR). Local activation of immunological response is induced
by the reactions to the endotoxin released by the infectious bacteria. The reactions
suppress insulin receptor subtract-1 and therefore attenuate insulin receptor signaling.
As the level of blood sugar is directly modulated by insulin, in the current study, the
present of glycemia in the septic non-survivors might provide evidence of a more
severe inflammation in the non-survivors before clinical interventions. The effect was
also proved to be related with poor outcome in the model 2 and 4. On the contrary,
87
for the model separating H0 and H24 samples for the survivors, the level of glucose
decreased at H24, which showed an optimist evolution of case.
Lactate is another one of the common indicators of bad outcome in all the achieved
models, its level in the serum reflects the severity of hypoxia and disorder of the
energy supply. Correspondingly, pyruvate, which is an important materiel for the TCA
cycle, was also found to be elevated in the more severe septic shock cases.
Interestingly, although considerable amount of pyruvate was transferred to lactate due
to the low oxygen press in the blood, increases of two TCA cycle-related metabolites
(fumarate and citrate) were still present in the non-survivors. One reason might be
that the increased level of various amino acids induced anaplerotic reactions and
enhanced the concentration of the related TCA cycle metabolites. The results were
similar to those in several other works and equally revealed in our previous study.
Furthermore, it has been known that mitochondria were injured by the over-
production of NO and free residues during the sepsis [14, 15]. Thus, the disorder of
the respiratory chain might be another reason for the accumulation of TCA cycle
related metabolites and for the conversion from pyruvate to lactate.
Glycoprotein is mostly located on the membrane of cells, the diminution of its level in
the non-survivors might indicate the existence of cell injuring. Further, it has been well
known that the waste of muscle tissue and a sever protein breakdown, which might
be another issue of the suppress of glycoprotein, is present in the case. Likewise, it
was declared by Wang et al. that the ratio lactate/albumin was an independent marker
of multi-organ dysfunctions (MODs) and death [16].
Meanwhile, as it is known, the up-regulating creatinine indicates the waste of muscle
tissue. Thus, both the augment of the amino acids and creatinine could be a proof of
the breakdown of glycoprotein. Other significant discriminators between the survivors
and the non-survivors included choline and urea. Choline was known to be bond with
the reaction of cell signaling responding the inflammation [17]. A mounting of urea
could be a signal of the more severe kidney injury [18].
It has been widely reported that the clinical scores evaluating the severity of sepsis
was not accurate. In the current study, we exhibit that the NMR metabolomics based
88
discriminatory models experience a better prediction of mortality than the two clinical
scores (AUROCSOFA=0.63 and AUROCAPSII = 0.76). Our results may help to improve
the early characterization of severe cases in the septic shock patients, which may be
an evidence for the personalized treatment.
Conclusion
In this study, we reveal metabolic differences between the survivors and non-survivors
both before and different evolutions during the 24 first hours after hospitalization of
septic shock between the survivors and non-survivors. The deregulation of some
amino acids and some energy-related metabolites such as glucose, lactate and
creatinine account for the discrimination between the septic survivors and the non-
survivors. We note that the consistence of the variation in such metabolites was found
in the separation of patients before and after clinical intervention. The comparison
between the AUROC of our model and the prediction of mortality by the SOFA or APSII
score showed that our models are more reliable to predict the outcome of septic shock.
Our findings illustrate that the 1H NMR based metabolomics is helpful to improve the
prognosis of septic shock.
89
References 1. Bone RC, Balk RA, Cerra FB, Dellinger RP, Fein AM, Knaus WA et al. DEFINITIONS FOR SEPSIS AND
ORGAN FAILURE AND GUIDELINES FOR THE USE OF INNOVATIVE THERAPIES IN SEPSIS. Chest.
1992;101(6):1644-55.
2. Levy MM, Fink MP, Marshall JC, Abraham E, Angus D, Cook D et al. 2001 SCCM/ESICM/ACCP/ATS/SIS
International Sepsis Definitions Conference. Crit Care Med. 2003;31(4):1250-6.
3. Balk RA. Pathogenesis and management of multiple organ dysfunction or failure in severe sepsis and
septic shock. Crit Care Clin. 2000;16(2):337-+.
4. Rivers E, Nguyen B, Havstad S, Ressler J, Muzzin A, Knoblich B et al. Early goal-directed therapy in the
treatment of severe sepsis and septic shock. New Engl J Med. 2001;345(19):1368-77.
5. Dellinger RP, Levy MM, Carlet JM, Bion J, Parker MM, Jaeschke R et al. Surviving Sepsis Campaign:
International guidelines for management of severe sepsis and septic shock: 2008. Crit Care Med.
2008;36(1):296-327.
6. Vincent JL, de Mendonca A, Cantraine F, Moreno R, Takala J, Suter PM et al. Use of the SOFA score to
assess the incidence of organ dysfunction/failure in intensive care units: Results of a multicenter,
prospective study. Crit Care Med. 1998;26(11):1793-800.
7. Lee WJ, Woo SH, Kim DH, Seol SH, Park SK, Choi SP et al. Are prognostic scores and biomarkers such
as procalcitonin the appropriate prognostic precursors for elderly patients with sepsis in the emergency
department? Aging Clin Exp Res. 2016;28(5):917-24.
8. Mickiewicz B, Vogel HJ, Wong HR, Winston BW. Metabolomics as a novel approach for early diagnosis
of pediatric septic shock and its mortality. Am J Respir Crit Care Med. 2013;187(9):967-76.
9. Foxall PJ, Spraul M, Farrant RD, Lindon LC, Neild GH, Nicholson JK. 750 MHz 1H-NMR spectroscopy of
human blood plasma. J Pharm Biomed Anal. 1993;11(4-5):267-76.
10. Delaglio F, Grzesiek S, Vuister GW, Zhu G, Pfeifer J, Bax A. NMRPipe: a multidimensional spectral
processing system based on UNIX pipes. J Biomol Nmr. 1995;6(3):277-93.
11. Dieterle F, Ross A, Schlotterbeck G, Senn H. Probabilistic quotient normalization as robust method
to account for dilution of complex biological mixtures. Application in 1H NMR metabonomics. Anal
Chem. 2006;78(13):4281-90.
12. Westerhuis JA, Hoefsloot HCJ, Smit S, Vis DJ, Smilde AK, van Velzen EJJ et al. Assessment of PLSDA
cross validation. Metabolomics. 2008;4(1):81-9.
13. Westerhuis JA, van Velzen EJ, Hoefsloot HC, Smilde AK. Multivariate paired data analysis: multilevel
PLSDA versus OPLSDA. Metabolomics. 2010;6(1):119-28.
14. Kim S-C, Pierro A, Zamparelli M, Spitz L, Eaton S. Fatty acid oxidation in neonatal hepatocytes: effects
of sepsis and glutamine. Nutrition. 2002;18(4):298-300.
15. Nava E, Palmer R, Moncada S. Inhibition of nitric oxide synthesis in septic shock: how much is
beneficial? The Lancet. 1991;338(8782-8783):1555-7.
16. Wang B, Chen G, Cao Y, Xue J, Li J, Wu Y. Correlation of lactate/albumin ratio level to organ failure
and mortality in severe sepsis and septic shock. J Crit Care. 2015;30(2):271-5.
17. Parrish WR, Rosas-Ballina M, Gallowitsch-Puerta M, Ochani M, Ochani K, Yang LH et al. Modulation
of TNF release by choline requires alpha7 subunit nicotinic acetylcholine receptor-mediated signaling.
Mol Med. 2008;14(9-10):567-74.
18. Waikar SS, Liu KD, Chertow GM. Diagnosis, epidemiology and outcomes of acute kidney injury. Clin
J Am Soc Nephrol. 2008;3(3):844-61.
90
2.3.3 Conclusion to the first part of experimental research
Septic shock is the most severe case of sepsis inducing always a high mortality.
However, the mechanism of the evolution from septic shock to death for the patients
eventually died of septic shock is still not clear. From a point of view of metabolomics,
the alterations in the metabolic profile might reveal the related varied pathways in the
non-survivors compared with the survivors.
In this first part of thesis work, the goal is to predict septic shock mortality by both
NMR and MS-based metabolomics. The separation between the septic shock survivors
and non-survivors was found before clinical intervention according to the analyses of
metabolic profiles of the patients, using the above two techniques. Beyond the
coincide metabolites detected by the two methods, metabolites such as kinds of fatty
acids, bile acids were only detected with the MS-based approach whilie the NMR-
based analyses determined glucose and glycoprotein which were not detectable in our
LC-MS experiences. Further, on the basis of the results involving the evolution of septic
shock metabolome during the first 24 hours after the admission into the ICU,
differences of evolution from H0 to H24 between the survivors and the non-survivors
have been revealed. Notably, the deregulation of energy-related metabolism and a
comprehensive up-regulation of the amino acids, as well as the decline of glycoprotein
are found to be specific in the non-survivors. Moreover, using both MS and NMR based
metabolomics shows a power to acquire a reamarkable coverage of metabolites and
they are mutally complementary.
91
III. Metabolomic studies of hepatocellular carcinoma
(HCC)
3.1 Introduction of hepatocellular carcinoma
Hepatocellular carcinoma is the fifth most malignant common type of cancer, and is
the most common type of liver cancer [168]. According to the previous report, the
incidence of HCC is more than 3 cases in 100000 people, and the number is increasing
in recent years [169]. More than 80% of the HCC cases were reported caused by the
hepatitis virus (hepatitis B or C) infection or virus-induced cirrhosis [170]. Other
possible inducing factors includes hepatic injury caused by frequent alcohol abuse
[171] or other kinds of intoxication [172], and by obesity induced non-alcoholic fatty
liver disease (NAFLD) [173, 174], etc.
The HCC is diagnosed by some physical symptoms (such as malaise, anorexia, wasting,
right upper quadrant abdominal pain, and distension). And confirmed by the clinical
imaging (such as ultrasound, IMR, CT, etc.). The increasing blood concentration of α-
fetoprotein AFP is well referred as the signal of the development of HCC [175]. The
Barcelona clinical Liver Cancer (BCLC) staging is proposed as the grading standard of
HCC [176]. The staging system estimates the tumor stage (the Milan criteria is
frequently referred [176]), liver function status, physical status and cancer symptoms.
The main treatments of HCC includes the liver transplantation [177], surgical resection
[178], percutaneous injection (PI) [179], radiotherapy and radio frequency ablation
(RFA) [180]. Among which, the first two strategies were reported with slightly better
outcome than the others, but they are easier to introduce additional surgical trauma
[181]. And, HCC is not sensitive to chemotherapies because of its abnormal apoptosis
[182].
Early screening, especially the follow-up in the patients affected by cirrhosis or
hepatitis by imaging tests has been rifely recommended as a crucial improvement for
the outcome. Yet, due to the liver compensatory function and the insufficient of the
92
molecular biomarker like AFP, the early diagnosis of HCC remains challenging and HCC
is still one of the most lethal cancers. The mortality was recently noted till more than
50% [183]. Furthermore, like other cancers, the primary threats for the survival of HCC
are the metastasis and recurrence. Until present, there is always a lack of evidence to
predict the two risks in the perioperative period. Hence, to sum up, the discovery of
predicting biomarkers is an urgent demand for both the diagnosis and prognosis of
HCC.
3.2 State of arts for metabolomic studies of HCC
3.2.1. Metabolomics aiding the diagnosis of HCC
Even though the detection of HCC by the clinical imaging techniques is reliable for the
diagnostic of HCC. For the people “in high risk” of suffering from HCC, such as cirrhosis
or hepatitis patients, or even the hepatitis B virus carriers, the early screening is
important. This is because the development from cirrhosis or from hepatitis to HCC is
common. Besides, the misdiagnosis in the early stage may happen by the confusion of
the hypervascular nodules or by the concealment of the cirrhotic fibers [184]. The
chemical examination that determines the blood level of AFP was regarded as useful
for the diagnosis of HCC. However, it has been previously reported that AFP was not
as specific as the biomarker of HCC. As metabolomics is powerful in the discovery of
novel biomarkers, the search for new biomarkers of HCC has become an important
task in many metabolomic studies.
Various metabolomic studies based on the analyses on serum has been performed. In
one of the precedent works from our laboratory (Dalian, China) metabolomic study
aiming to find out the biomarkers of diagnosis of HCC has been performed in the
model of rats and then tested in the model of human patients. In the study, non-
targeted method using LC-MS revealed that 3 metabolites (taurocholic acid,
lysophosphoethanolamine 16:0, and lysophosphatidylcholine 22:5) were potential to
93
affirm the rats with HCC against the control rats. Additionally, they were equally useful
to distinguish different HCC stages in the rats. The following test study of the effect of
the 3 metabolites in human patients showed that the defined markers were effective
for the discrimination between small HCC and cirrhosis. They were ulteriorly found to
be significant separating HCC patients from the patients with chronic liver disease
[185].
Similar work was done by Liu et al, who used RPLC-MS, HILIC-MS and NMR approaches
for the HCC discovery in human patients. According to their findings, variations of the
metabolites such as β-hydroxybutyrate, oxaloacetate, short chain fatty acids, bile acids,
carnitines and lysoPCs between healthy volunteers and HCC patients were found. The
altered metabolites indicated disorders in the pathways such as ketogenesis, TCA cycle,
lipid genesis, and bile acids in HCC patients. Further, HCC patients were also found
separable from the cirrhotic patients. Precisely, levels of glycerol, β-hydroxybutyrate,
and acetylcarnitine were adjacent between cirrhotic patients and healthy controls
while their levels were elevated in HCC cases. Opposite distinction was found in
tyrosine, phytosphingosine, PC 4:0 and LPC 16:0 [186]. The findings in deregulation of
lipids were supported by analogic reports by Fages, Zhou and Nahon as well [187-189].
Not only with serum samples, but also urine samples were found useful to distinguish
the HCC from benign tumor or healthy controls. The abnormal levels of bile acids are
confirmed in the patients of HCC [190].
Furthermore, another our precedent work exhibited the metabolic variation of the
HCC tumor compared with the peripheral tissues. Determined varied pathways such
as glycolysis, gluconeogenesis, and beta-oxidation with the suppressed TCA cycle were
account for the separation [191]. In all the above studies, the sensitivity and the
specificity of the defined metabolite discriminators performed better than AFP in
diagnosing HCC. In brief, both NMR and MS based-metabolomics are useful to improve
the HCC diagnosis.
3.2.2. Improvement of HCC prognosis by metabolomics
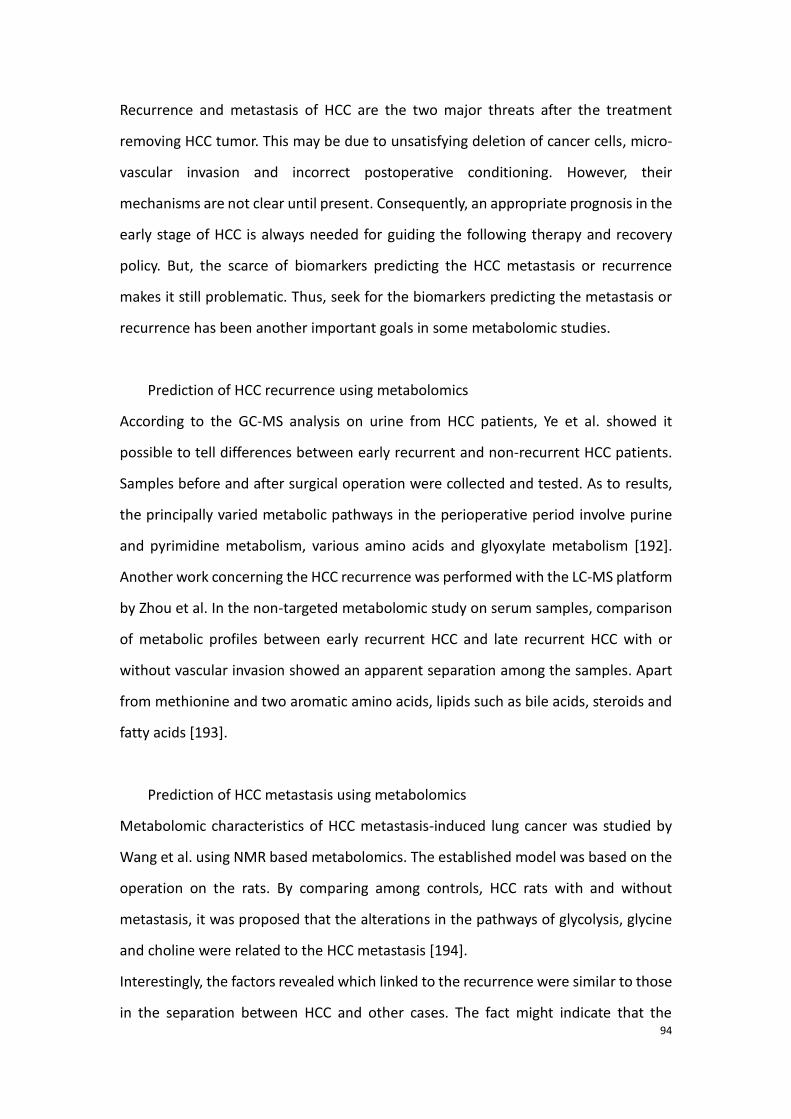
94
Recurrence and metastasis of HCC are the two major threats after the treatment
removing HCC tumor. This may be due to unsatisfying deletion of cancer cells, micro-
vascular invasion and incorrect postoperative conditioning. However, their
mechanisms are not clear until present. Consequently, an appropriate prognosis in the
early stage of HCC is always needed for guiding the following therapy and recovery
policy. But, the scarce of biomarkers predicting the HCC metastasis or recurrence
makes it still problematic. Thus, seek for the biomarkers predicting the metastasis or
recurrence has been another important goals in some metabolomic studies.
Prediction of HCC recurrence using metabolomics
According to the GC-MS analysis on urine from HCC patients, Ye et al. showed it
possible to tell differences between early recurrent and non-recurrent HCC patients.
Samples before and after surgical operation were collected and tested. As to results,
the principally varied metabolic pathways in the perioperative period involve purine
and pyrimidine metabolism, various amino acids and glyoxylate metabolism [192].
Another work concerning the HCC recurrence was performed with the LC-MS platform
by Zhou et al. In the non-targeted metabolomic study on serum samples, comparison
of metabolic profiles between early recurrent HCC and late recurrent HCC with or
without vascular invasion showed an apparent separation among the samples. Apart
from methionine and two aromatic amino acids, lipids such as bile acids, steroids and
fatty acids [193].
Prediction of HCC metastasis using metabolomics
Metabolomic characteristics of HCC metastasis-induced lung cancer was studied by
Wang et al. using NMR based metabolomics. The established model was based on the
operation on the rats. By comparing among controls, HCC rats with and without
metastasis, it was proposed that the alterations in the pathways of glycolysis, glycine
and choline were related to the HCC metastasis [194].
Interestingly, the factors revealed which linked to the recurrence were similar to those
in the separation between HCC and other cases. The fact might indicate that the
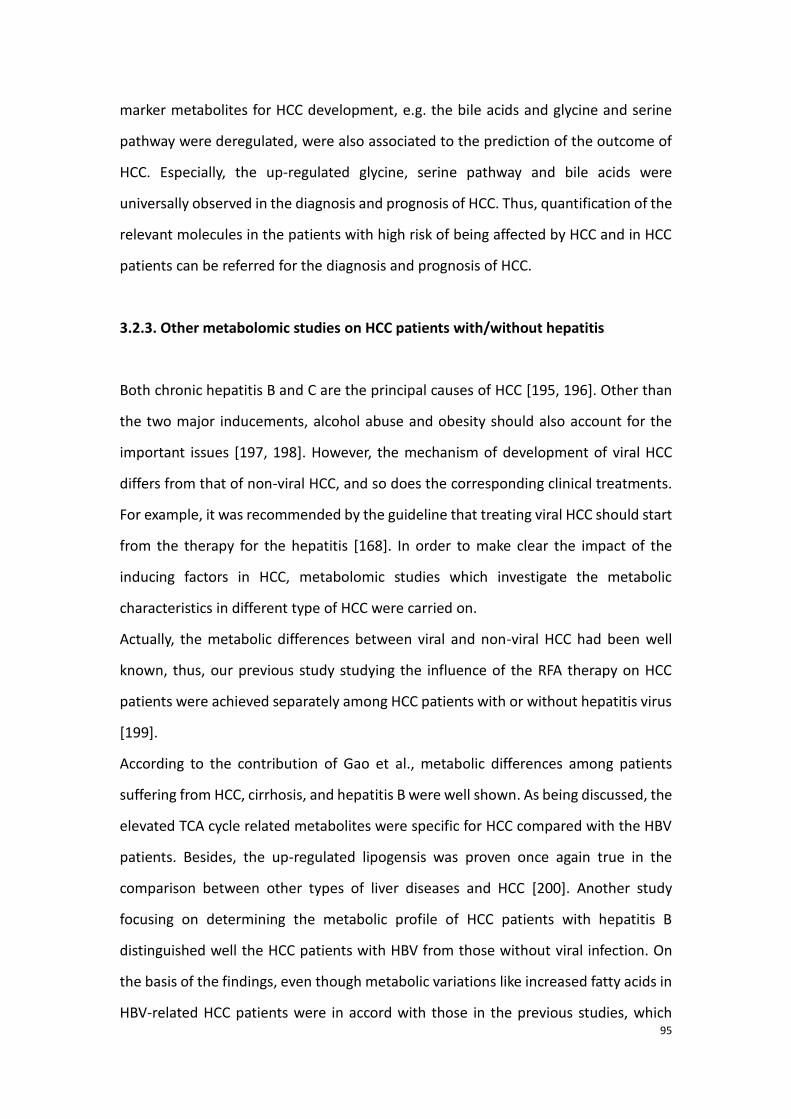
95
marker metabolites for HCC development, e.g. the bile acids and glycine and serine
pathway were deregulated, were also associated to the prediction of the outcome of
HCC. Especially, the up-regulated glycine, serine pathway and bile acids were
universally observed in the diagnosis and prognosis of HCC. Thus, quantification of the
relevant molecules in the patients with high risk of being affected by HCC and in HCC
patients can be referred for the diagnosis and prognosis of HCC.
3.2.3. Other metabolomic studies on HCC patients with/without hepatitis
Both chronic hepatitis B and C are the principal causes of HCC [195, 196]. Other than
the two major inducements, alcohol abuse and obesity should also account for the
important issues [197, 198]. However, the mechanism of development of viral HCC
differs from that of non-viral HCC, and so does the corresponding clinical treatments.
For example, it was recommended by the guideline that treating viral HCC should start
from the therapy for the hepatitis [168]. In order to make clear the impact of the
inducing factors in HCC, metabolomic studies which investigate the metabolic
characteristics in different type of HCC were carried on.
Actually, the metabolic differences between viral and non-viral HCC had been well
known, thus, our previous study studying the influence of the RFA therapy on HCC
patients were achieved separately among HCC patients with or without hepatitis virus
[199].
According to the contribution of Gao et al., metabolic differences among patients
suffering from HCC, cirrhosis, and hepatitis B were well shown. As being discussed, the
elevated TCA cycle related metabolites were specific for HCC compared with the HBV
patients. Besides, the up-regulated lipogensis was proven once again true in the
comparison between other types of liver diseases and HCC [200]. Another study
focusing on determining the metabolic profile of HCC patients with hepatitis B
distinguished well the HCC patients with HBV from those without viral infection. On
the basis of the findings, even though metabolic variations like increased fatty acids in
HBV-related HCC patients were in accord with those in the previous studies, which
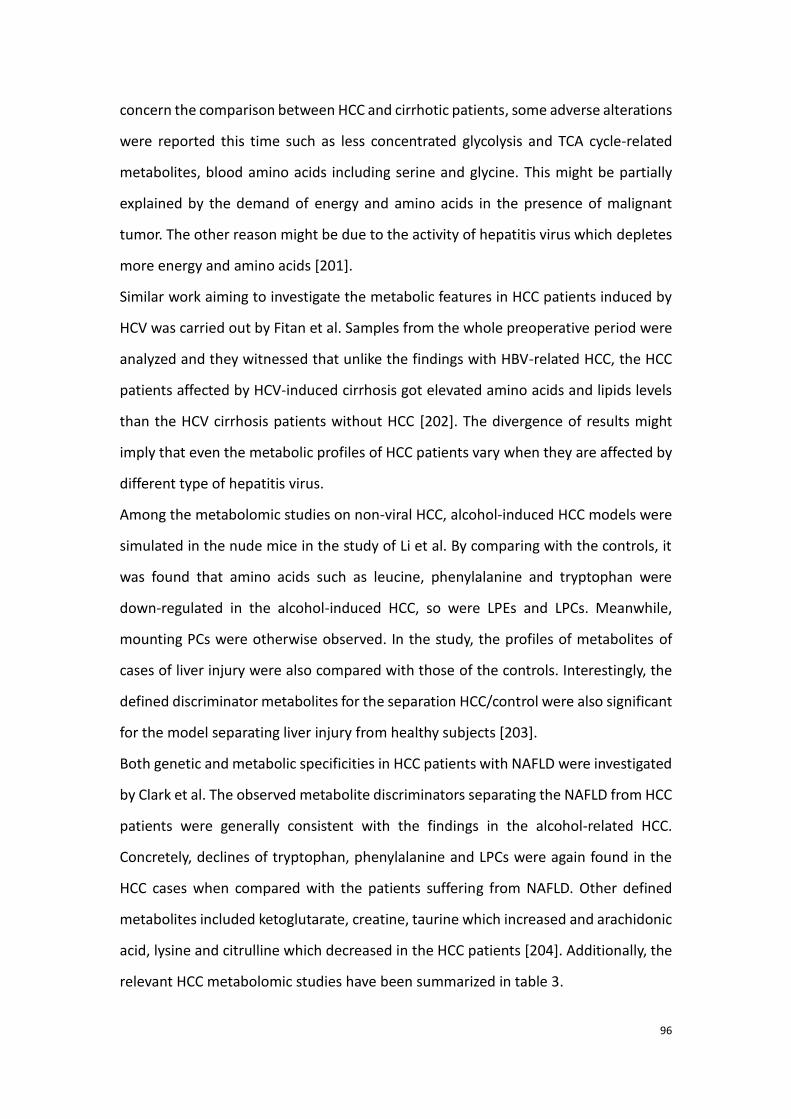
96
concern the comparison between HCC and cirrhotic patients, some adverse alterations
were reported this time such as less concentrated glycolysis and TCA cycle-related
metabolites, blood amino acids including serine and glycine. This might be partially
explained by the demand of energy and amino acids in the presence of malignant
tumor. The other reason might be due to the activity of hepatitis virus which depletes
more energy and amino acids [201].
Similar work aiming to investigate the metabolic features in HCC patients induced by
HCV was carried out by Fitan et al. Samples from the whole preoperative period were
analyzed and they witnessed that unlike the findings with HBV-related HCC, the HCC
patients affected by HCV-induced cirrhosis got elevated amino acids and lipids levels
than the HCV cirrhosis patients without HCC [202]. The divergence of results might
imply that even the metabolic profiles of HCC patients vary when they are affected by
different type of hepatitis virus.
Among the metabolomic studies on non-viral HCC, alcohol-induced HCC models were
simulated in the nude mice in the study of Li et al. By comparing with the controls, it
was found that amino acids such as leucine, phenylalanine and tryptophan were
down-regulated in the alcohol-induced HCC, so were LPEs and LPCs. Meanwhile,
mounting PCs were otherwise observed. In the study, the profiles of metabolites of
cases of liver injury were also compared with those of the controls. Interestingly, the
defined discriminator metabolites for the separation HCC/control were also significant
for the model separating liver injury from healthy subjects [203].
Both genetic and metabolic specificities in HCC patients with NAFLD were investigated
by Clark et al. The observed metabolite discriminators separating the NAFLD from HCC
patients were generally consistent with the findings in the alcohol-related HCC.
Concretely, declines of tryptophan, phenylalanine and LPCs were again found in the
HCC cases when compared with the patients suffering from NAFLD. Other defined
metabolites included ketoglutarate, creatine, taurine which increased and arachidonic
acid, lysine and citrulline which decreased in the HCC patients [204]. Additionally, the
relevant HCC metabolomic studies have been summarized in table 3.
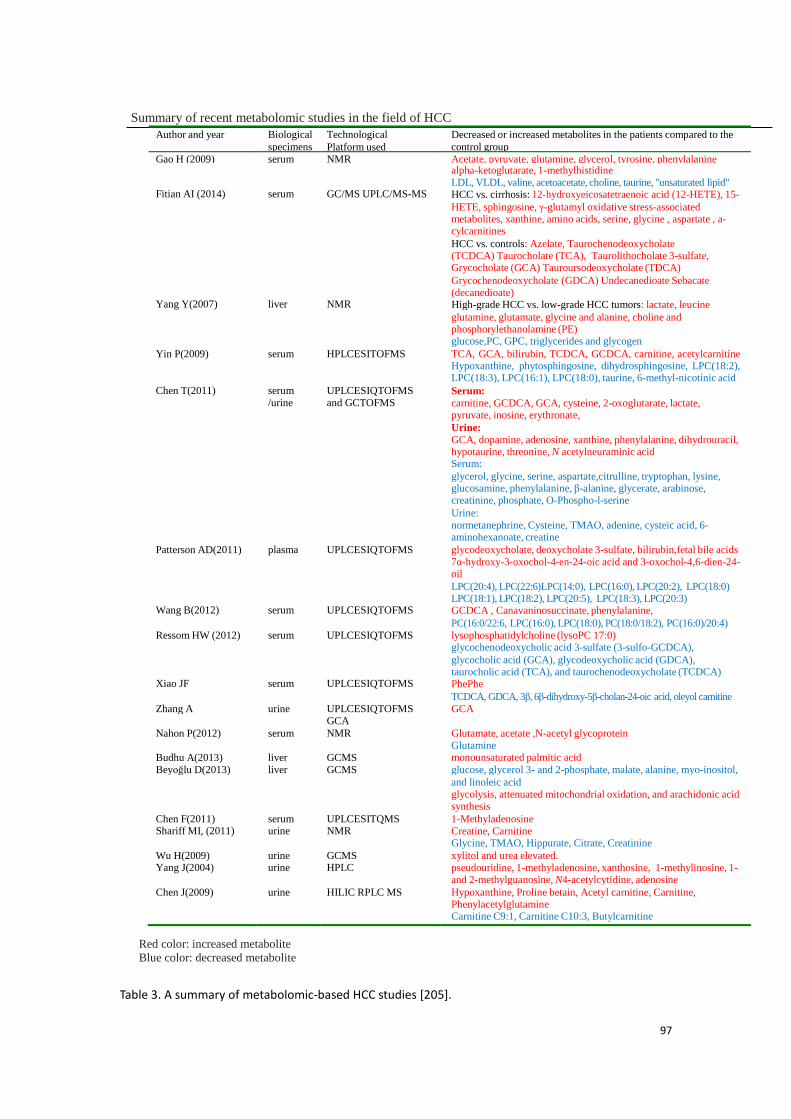
97
Table 3. A summary of metabolomic-based HCC studies [205].
Summary of recent metabolomic studies in the field of HCC
Author and year Biological
specimens
Technological
Platform used
Decreased or increased metabolites in the patients compared to the
control group
Gao H (2009) serum NMR Acetate, pyruvate, glutamine, glycerol, tyrosine, phenylalanine
Fitian AI (2014)
serum
GC/MS UPLC/MS-MS
alpha-ketoglutarate, 1-methylhistidine LDL, VLDL, valine, acetoacetate, choline, taurine, "unsaturated lipid" HCC vs. cirrhosis: 12-hydroxyeicosatetraenoic acid (12-HETE), 15-
HETE, sphingosine, γ-glutamyl oxidative stress-associated metabolites, xanthine, amino acids, serine, glycine , aspartate , a- cylcarnitines
HCC vs. controls: Azelate, Taurochenodeoxycholate (TCDCA) Taurocholate (TCA), Taurolithocholate 3-sulfate, Grycocholate (GCA) Tauroursodeoxycholate (TDCA)
Yang Y(2007)
liver
NMR
Grycochenodeoxycholate (GDCA) Undecanedioate Sebacate (decanedioate) High-grade HCC vs. low-grade HCC tumors: lactate, leucine
glutamine, glutamate, glycine and alanine, choline and phosphorylethanolamine (PE) glucose,PC, GPC, triglycerides and glycogen
Yin P(2009) serum HPLCESITOFMS TCA, GCA, bilirubin, TCDCA, GCDCA, carnitine, acetylcarnitine Hypoxanthine, phytosphingosine, dihydrosphingosine, LPC(18:2), LPC(18:3), LPC(16:1), LPC(18:0), taurine, 6-methyl-nicotinic acid
Chen T(2011) serum
/urine
UPLCESIQTOFMS
and GCTOFMS Serum:
carnitine, GCDCA, GCA, cysteine, 2-oxoglutarate, lactate, pyruvate, inosine, erythronate,
Urine: GCA, dopamine, adenosine, xanthine, phenylalanine, dihydrouracil, hypotaurine, threonine, N acetylneuraminic acid Serum:
glycerol, glycine, serine, aspartate,citrulline, tryptophan, lysine, glucosamine, phenylalanine, β-alanine, glycerate, arabinose, creatinine, phosphate, O-Phospho-l-serine
Urine: normetanephrine, Cysteine, TMAO, adenine, cysteic acid, 6- aminohexanoate, creatine
Patterson AD(2011) plasma UPLCESIQTOFMS glycodeoxycholate, deoxycholate 3-sulfate, bilirubin,fetal bile acids 7α-hydroxy-3-oxochol-4-en-24-oic acid and 3-oxochol-4,6-dien-24- oil
Wang B(2012)
serum
UPLCESIQTOFMS
LPC(20:4), LPC(22:6)LPC(14:0), LPC(16:0), LPC(20:2), LPC(18:0) LPC(18:1), LPC(18:2), LPC(20:5), LPC(18:3), LPC(20:3) GCDCA , Canavaninosuccinate, phenylalanine,
Ressom HW (2012)
serum
UPLCESIQTOFMS
PC(16:0/22:6, LPC(16:0), LPC(18:0), PC(18:0/18:2), PC(16:0)/20:4) lysophosphatidylcholine (lysoPC 17:0) glycochenodeoxycholic acid 3-sulfate (3-sulfo-GCDCA),
Xiao JF
serum
UPLCESIQTOFMS
glycocholic acid (GCA), glycodeoxycholic acid (GDCA), taurocholic acid (TCA), and taurochenodeoxycholate (TCDCA) PhePhe
Zhang A
urine
UPLCESIQTOFMS
TCDCA, GDCA, 3β, 6β-dihydroxy-5β-cholan-24-oic acid, oleyol carnitine GCA
GCA Nahon P(2012)
Budhu A(2013)
serum
liver
NMR
GCMS
Glutamate, acetate ,N-acetyl glycoprotein Glutamine monounsaturated palmitic acid
Beyoğlu D(2013) liver GCMS glucose, glycerol 3- and 2-phosphate, malate, alanine, myo-inositol,
and linoleic acid glycolysis, attenuated mitochondrial oxidation, and arachidonic acid synthesis
Chen F(2011) Shariff MI, (2011)
serum urine
UPLCESITQMS NMR
1-Methyladenosine Creatine, Carnitine Glycine, TMAO, Hippurate, Citrate, Creatinine
Wu H(2009) Yang J(2004)
urine urine
GCMS HPLC
xylitol and urea elevated. pseudouridine, 1-methyladenosine, xanthosine, 1-methylinosine, 1- and 2-methylguanosine, N4-acetylcytidine, adenosine
Chen J(2009) urine HILIC RPLC MS Hypoxanthine, Proline betain, Acetyl carnitine, Carnitine, Phenylacetylglutamine Carnitine C9:1, Carnitine C10:3, Butylcarnitine
Red color: increased metabolite
Blue color: decreased metabolite
98
3.3. Experimental research: Comparison of the metabolomic
profiles in the patients suffering from hepatitis C-related
hepatocellular Carcinoma with and without recurrence.
The second part of the thesis work concerns the prediction of recurrence in small HCC
patients. It is known that small HCCs (≤5 cm or up to 3 lesions ≤3cm) lead a better
outcome than big ones [206]. And, for the small HCCs, the RFA treatment is
recommended since it is effective and brings less operational wound to the patients.
Even though, the HCC recurrence and metastasis remain the principal threats for the
outcome. It was reported that the rate of HCC recurrence was up to 70% for 3 years
and 80% for 5 years after the treatment [207, 208].
Biomarkers such as AFP, MAGEs and CK19 were currently accepted to predict the HCC
recurrence [209]. But, the altered metabolic pathway correlated to the relapse of HCC
is still not clear. Thus, finding out novel metabolite biomarkers predicting the
recurrence is always required.
As introduced before, many metabolomic studies have been performed to achieve the
goal, and some potential metabolite biomarkers were discovered with their
remarkable sensibility and specificity. For example, in one of the past studies of the
Chinese laboratory, LC-MS was applied to determine the metabolic characteristics in
early and late HCC recurrent patients. Various lipids were found significant in the
discrimination between early recurrent and late recurrent HCC patient [193]. For the
current study of HCC recurrence, we attempted to make clear of the variations in the
pathways such as glycolysis and TCA cycle in the recurrent subjects. GC-MS is qualified
to detect and well quantify such metabolites, it was therefore chosen to be applied.
Additionally, different types of HCC like viral-HCC and non-viral HCC should be
distinguished in the treatment and prognosis. The metabolic differences between
viral-HCC and non-viral HCC have also been well emerged in one of our past studies
[199]. However, to our known, these differences were not viewed in the past
metabolomic studies which aim to determine the biomarkers of relapse. Besides, more

99
than one sampling before and after clinical interventions may help to understand the
feedbacks to the treatment. Thus, in the current work, we intend to find out potential
biomarkers in viral and non-viral HCC respectively, with two samplings in pre- and post-
operative periods.
3.3.1 Study 3: Determination of metabolite biomarker candidate for recurrence of
hepatocellular carcinoma in the hepatitis C virus-related HCC patients
100
Determination of metabolite biomarker candidate
for recurrence of hepatocellular carcinoma in the
hepatitis C virus-related HCC patients
Zhicheng Liu1,2, Pierre Nahon3,4, Zaifang Li1, Peiyuan Yin1 , Yanli Li1 Roland
Amathieu2,5, Nathalie Ganne-Carrié3, Marianne Ziol6,7, Nicolas Sellier8, Olivier Seror8,
Laurence Le Moyec9, Philippe Savarin2* and Guowang Xu1*
1. CAS Key Laboratory of Separation Science for Analytical Chemistry, Dalian
Institute of Chemical Physics, Chinese Academy of Sciences, 457 Zhongshan Road,
Dalian 116023, China
2. Université Paris 13, Sorbonne Paris Cité, Laboratoire de Chimie, Structures et
Propriétés de Biomateriaux et d’Agents Therapeutiques, UMR 7244, F-93017
Bobigny, Bobigny 93000, France
3. Hepatology service, Jean Verdier Teaching Hospital, AP-HP, Bondy 93140, France
4. INSERM U1162, Génomique Fonctionnelle des Tumeurs solides, INSERM
U1162, , Paris, France
5. Intensive Care Unit, Jean Verdier Teaching Hospital, AP-HP, Bondy 93140, France
6. APHP, service d'Anatomie Pathologique, Hôpital Jean Verdier; BB-0033-00027.
Centre de Ressources Biologiques Maladies du foie. Groupe Hospitalier Paris-
Seine-Saint-Denis,France
7. BB-0033-00027. Centre de Ressources Biologiques Maladies du foie, Groupe
hospitalier Paris-Seine-Saint-Denis, Bondy, France
8. APHP, service de Radiologie, Hôpital Jean Verdier, Bondy, France
101
9. Université d’Evry Val d’Essonne, UBIAE, EA7362, Evry, France
* Corresponding author:
Prof. Dr. Philippe Savarin, Université Paris 13, Sorbonne Paris Cité, Laboratoire de
Chimie, Structures et Propriétés de Biomateriaux et d’Agents Therapeutiques, UMR
7244, F-93017 Bobigny, Bobigny 93000, France. E-mail: [email protected].
Prof. Dr. Guowang Xu, CAS Key Laboratory of Separation Science for Analytical
Chemistry, Dalian Institute of Chemical Physics, Chinese Academy of Sciences, Dalian
116023, China. Tel. /fax: 0086-411-84379530. [email protected]
102
Abstract
Hepatitis C virus (HCV) infection leads to a high risk of converting to hepatocellular
carcinoma (HCC). Radio frequency ablation (RFA) has been proved effective for early
stage of small HCC. Whereas, the HCC relapse is still the primary threat for the
outcome after the therapy. In the present study, with the comparison between recurrent
and non-recurrent patients, we aim to understand the characteristics of metabolic profile
variation for HCC recurrence before and after RFA therapy by applying gas
chromatography-mass spectrometry (GC-MS) based metabolomics. Significant
variations were observed in the pathways such as glycerolipid, TCA cycle, fatty acids
and amino acids between recurrent and non-recurrent patients. We report that the
variation trend of the involved pathways are not coincided except for the fatty acids
before and after RFA treatment. Using a random forest (RF) test and a validation with
other samples in the validation set, the combination biomarker by glutamate and
aspartate showed a good performance in predicting the HCC recurrence before RFA
treatment while the combination of glycerol and proline was determined for predicting
recurrence in HCV-related HCC patients after RFA treatment.
Key words: HCC, HCV, recurrence, gas chromatography metabolomics, combinational
biomarker.
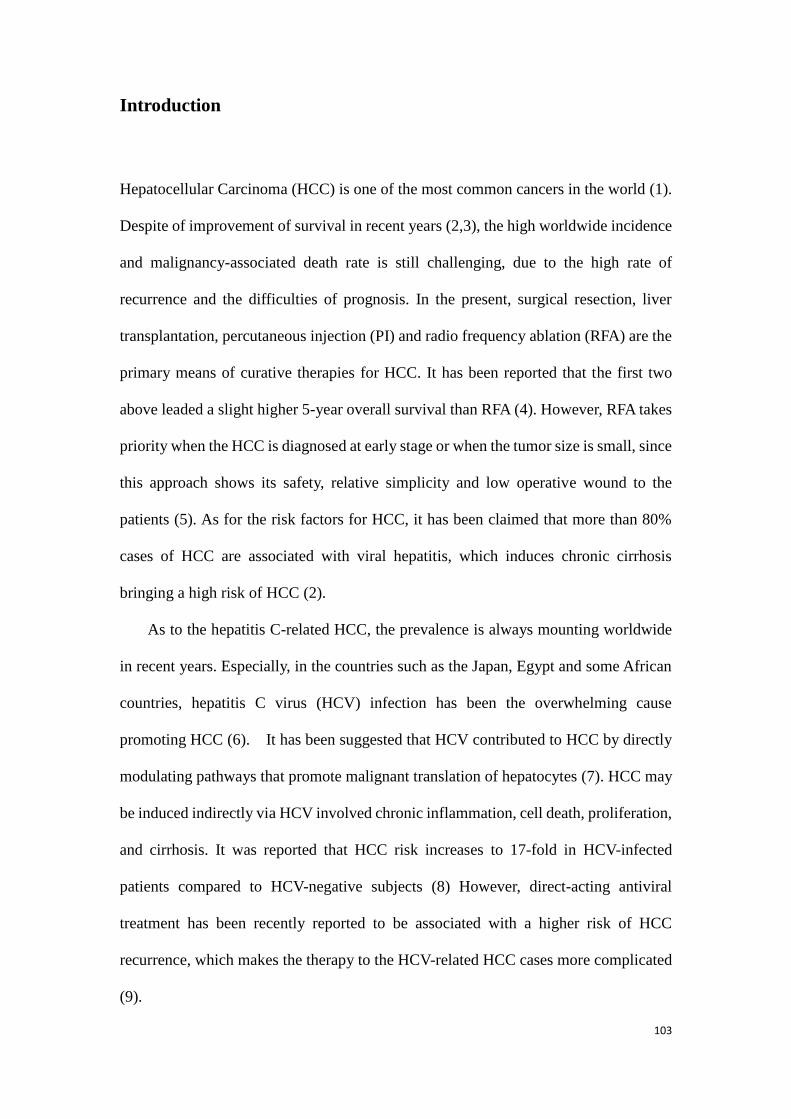
103
Introduction
Hepatocellular Carcinoma (HCC) is one of the most common cancers in the world (1).
Despite of improvement of survival in recent years (2,3), the high worldwide incidence
and malignancy-associated death rate is still challenging, due to the high rate of
recurrence and the difficulties of prognosis. In the present, surgical resection, liver
transplantation, percutaneous injection (PI) and radio frequency ablation (RFA) are the
primary means of curative therapies for HCC. It has been reported that the first two
above leaded a slight higher 5-year overall survival than RFA (4). However, RFA takes
priority when the HCC is diagnosed at early stage or when the tumor size is small, since
this approach shows its safety, relative simplicity and low operative wound to the
patients (5). As for the risk factors for HCC, it has been claimed that more than 80%
cases of HCC are associated with viral hepatitis, which induces chronic cirrhosis
bringing a high risk of HCC (2).
As to the hepatitis C-related HCC, the prevalence is always mounting worldwide
in recent years. Especially, in the countries such as the Japan, Egypt and some African
countries, hepatitis C virus (HCV) infection has been the overwhelming cause
promoting HCC (6). It has been suggested that HCV contributed to HCC by directly
modulating pathways that promote malignant translation of hepatocytes (7). HCC may
be induced indirectly via HCV involved chronic inflammation, cell death, proliferation,
and cirrhosis. It was reported that HCC risk increases to 17-fold in HCV-infected
patients compared to HCV-negative subjects (8) However, direct-acting antiviral
treatment has been recently reported to be associated with a higher risk of HCC
recurrence, which makes the therapy to the HCV-related HCC cases more complicated
(9).
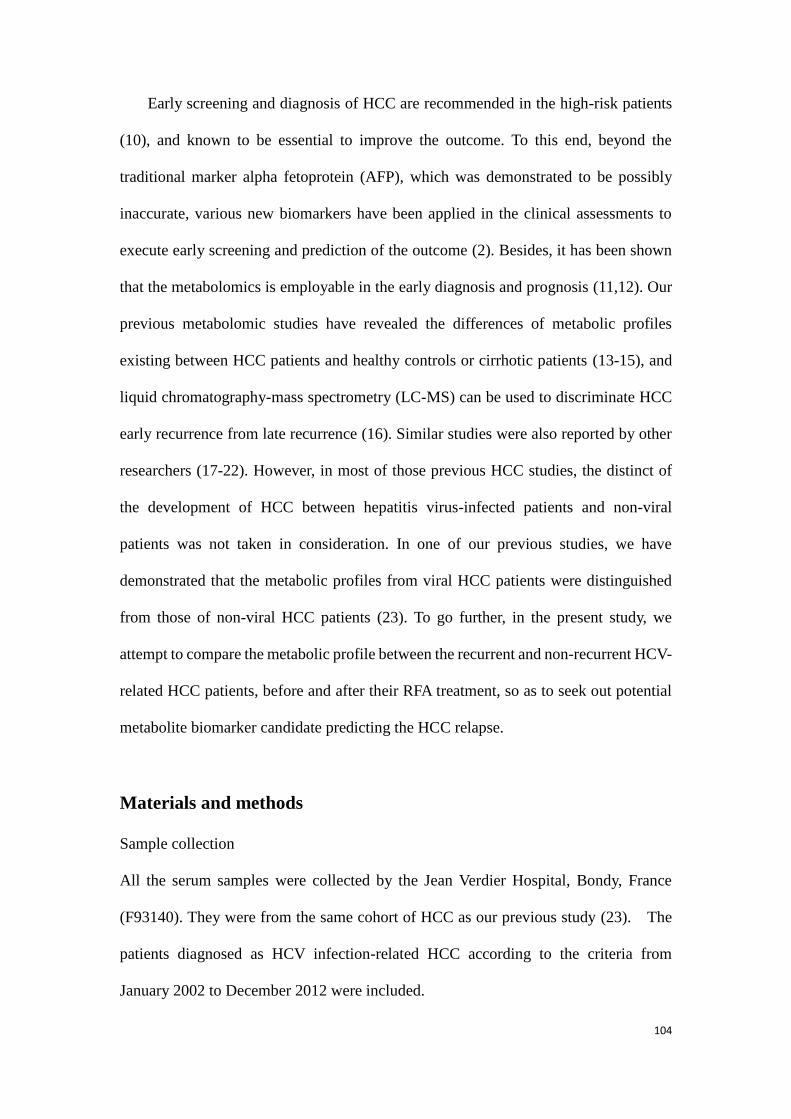
104
Early screening and diagnosis of HCC are recommended in the high-risk patients
(10), and known to be essential to improve the outcome. To this end, beyond the
traditional marker alpha fetoprotein (AFP), which was demonstrated to be possibly
inaccurate, various new biomarkers have been applied in the clinical assessments to
execute early screening and prediction of the outcome (2). Besides, it has been shown
that the metabolomics is employable in the early diagnosis and prognosis (11,12). Our
previous metabolomic studies have revealed the differences of metabolic profiles
existing between HCC patients and healthy controls or cirrhotic patients (13-15), and
liquid chromatography-mass spectrometry (LC-MS) can be used to discriminate HCC
early recurrence from late recurrence (16). Similar studies were also reported by other
researchers (17-22). However, in most of those previous HCC studies, the distinct of
the development of HCC between hepatitis virus-infected patients and non-viral
patients was not taken in consideration. In one of our previous studies, we have
demonstrated that the metabolic profiles from viral HCC patients were distinguished
from those of non-viral HCC patients (23). To go further, in the present study, we
attempt to compare the metabolic profile between the recurrent and non-recurrent HCV-
related HCC patients, before and after their RFA treatment, so as to seek out potential
metabolite biomarker candidate predicting the HCC relapse.
Materials and methods
Sample collection
All the serum samples were collected by the Jean Verdier Hospital, Bondy, France
(F93140). They were from the same cohort of HCC as our previous study (23). The
patients diagnosed as HCV infection-related HCC according to the criteria from
January 2002 to December 2012 were included.
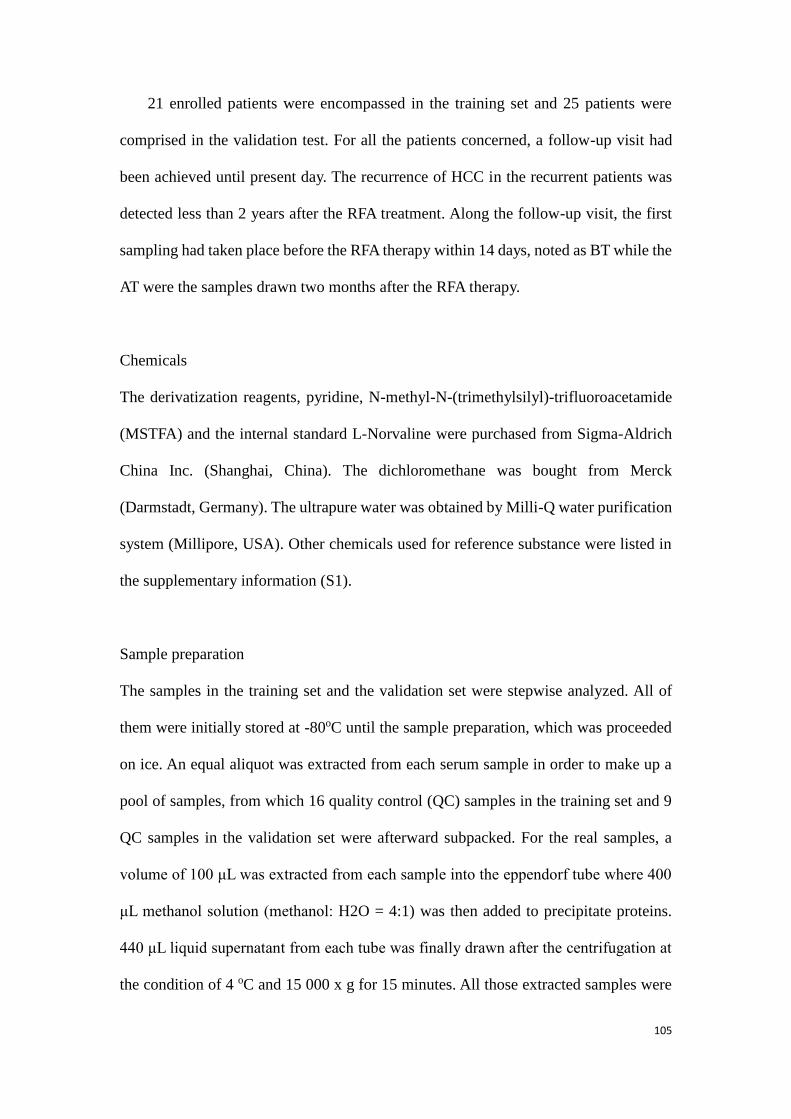
105
21 enrolled patients were encompassed in the training set and 25 patients were
comprised in the validation test. For all the patients concerned, a follow-up visit had
been achieved until present day. The recurrence of HCC in the recurrent patients was
detected less than 2 years after the RFA treatment. Along the follow-up visit, the first
sampling had taken place before the RFA therapy within 14 days, noted as BT while the
AT were the samples drawn two months after the RFA therapy.
Chemicals
The derivatization reagents, pyridine, N-methyl-N-(trimethylsilyl)-trifluoroacetamide
(MSTFA) and the internal standard L-Norvaline were purchased from Sigma-Aldrich
China Inc. (Shanghai, China). The dichloromethane was bought from Merck
(Darmstadt, Germany). The ultrapure water was obtained by Milli-Q water purification
system (Millipore, USA). Other chemicals used for reference substance were listed in
the supplementary information (S1).
Sample preparation
The samples in the training set and the validation set were stepwise analyzed. All of
them were initially stored at -80oC until the sample preparation, which was proceeded
on ice. An equal aliquot was extracted from each serum sample in order to make up a
pool of samples, from which 16 quality control (QC) samples in the training set and 9
QC samples in the validation set were afterward subpacked. For the real samples, a
volume of 100 μL was extracted from each sample into the eppendorf tube where 400
μL methanol solution (methanol: H2O = 4:1) was then added to precipitate proteins.
440 μL liquid supernatant from each tube was finally drawn after the centrifugation at
the condition of 4 oC and 15 000 x g for 15 minutes. All those extracted samples were
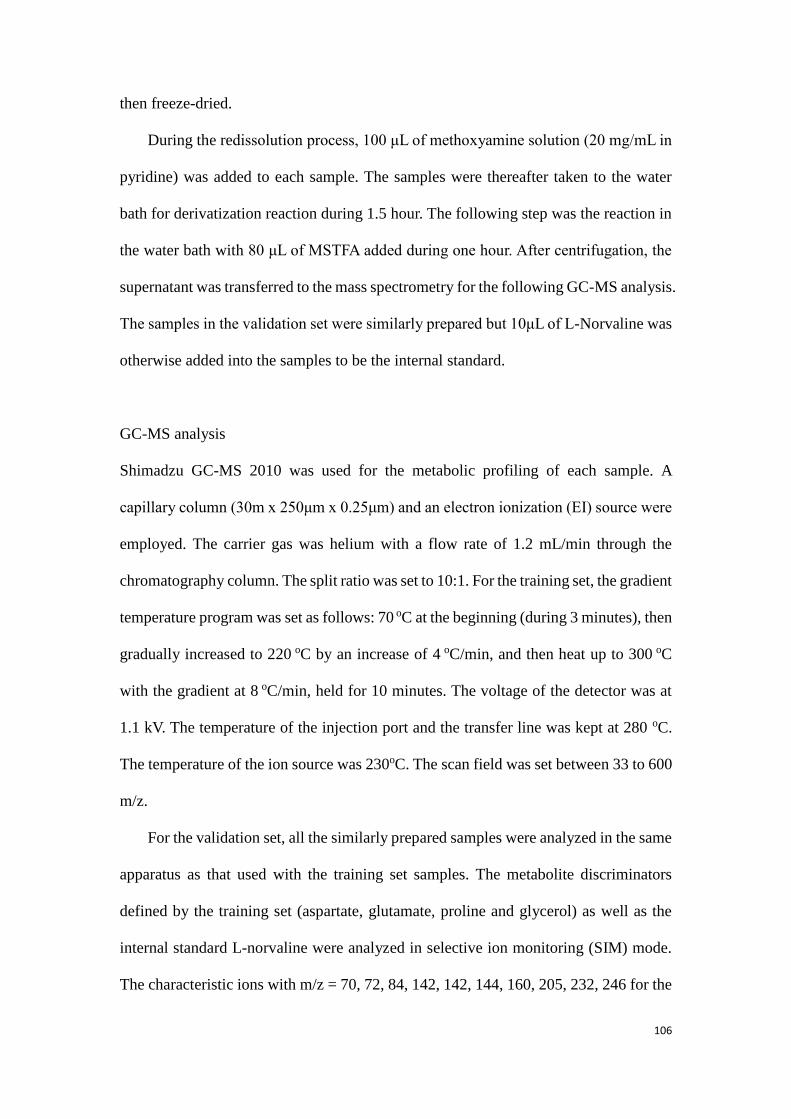
106
then freeze-dried.
During the redissolution process, 100 μL of methoxyamine solution (20 mg/mL in
pyridine) was added to each sample. The samples were thereafter taken to the water
bath for derivatization reaction during 1.5 hour. The following step was the reaction in
the water bath with 80 μL of MSTFA added during one hour. After centrifugation, the
supernatant was transferred to the mass spectrometry for the following GC-MS analysis.
The samples in the validation set were similarly prepared but 10μL of L-Norvaline was
otherwise added into the samples to be the internal standard.
GC-MS analysis
Shimadzu GC-MS 2010 was used for the metabolic profiling of each sample. A
capillary column (30m x 250μm x 0.25μm) and an electron ionization (EI) source were
employed. The carrier gas was helium with a flow rate of 1.2 mL/min through the
chromatography column. The split ratio was set to 10:1. For the training set, the gradient
temperature program was set as follows: 70 oC at the beginning (during 3 minutes), then
gradually increased to 220 oC by an increase of 4 oC/min, and then heat up to 300 oC
with the gradient at 8 oC/min, held for 10 minutes. The voltage of the detector was at
1.1 kV. The temperature of the injection port and the transfer line was kept at 280 oC.
The temperature of the ion source was 230oC. The scan field was set between 33 to 600
m/z.
For the validation set, all the similarly prepared samples were analyzed in the same
apparatus as that used with the training set samples. The metabolite discriminators
defined by the training set (aspartate, glutamate, proline and glycerol) as well as the
internal standard L-norvaline were analyzed in selective ion monitoring (SIM) mode.
The characteristic ions with m/z = 70, 72, 84, 142, 142, 144, 160, 205, 232, 246 for the
107
five targeted metabolites were obtained by analyses on their standards and assigned by
referring to the database, presented later, according to their mass-to-charge ratio (m/z)
and their retention time, shown in the Table S-1. The retention time ranges
corresponding to the above ions have been displayed in the Table S-2. The gradient
temperature program was different from that in the training set: started by 70oC in the
first 3 minutes, the temperature was increased to 180oC by 5oC/min, then went up to
310oC by 20oC/min, retained for 5 minutes. The even time was set to 0.2s.
Several blank samples (without containing in the vial) were tested before the
sample analysis for wiping off the residues remaining in the column. Before the analysis
of the real samples, several QC samples were beforehand analyzed to confirm the
stability of the instrument. Every injection took 1 μL of droplet from all the sample. 1
QC sample was inserted after every 6 real samples in the sequence of analysis to
monitor the reproducibility and stability of the method. When spectra of all the samples
were recorded, a light diesel sample was subsequently analyzed for acquiring the
retention index (RI).
Data processing
The pretreatment such as the deconvolution, the peaks matching, the retention time
alignment, etc. of the spectrum was performed with the help of Leco ChromaTOF
software (St. Joseph MI, version 3.25) and XCMS (xcmsonline.scripps.edu). The
assignment of the ion peaks was achieved by matching the library (NIST, Mainlib,
Replib, Wiley and Feihn). The assignment of peaks was based on the value of m/z and
the calculated RI. The qualification for most of the principal discriminators was
confirmed by analyzing correspondent reference substances. For the case that several
peaks correspond to one same metabolite, we retained the one with lower RSD and
108
higher ratio of signal and noise (S/N).
The recording of the area for each determined ion peak was regarded as the relative
quantification for its corresponding metabolite. A data set recording the area for the ion
peaks was therefore generated. The peaks that contained more than 20% null area in all
the QC samples were excluded. Normalization of the peaks was then done. The relative
standard deviation (RSD) for every normalized peak in the QC samples was also
calculated. Those peaks whose RSDs were superior to 0.3 were also removed.
The principal component analysis (PCA) and the partial least square discriminant
analysis (PLS-DA) were achieved by submitting the data set to the SIMCA-P software
(version 11, Umetrics, Umeå, Sweden). Heat maps were displayed by the
MultiExperiement Viewer (Mev, version 4.9.0, Dana-Farber Cancer Institute, MA,
USA). Other statistical analyses were assumed by the SPSS statistics (version 19, IBM,
Chicago, USA). The acquisition of spectra for some available reference substance was
served to confirm the qualification of most of the discriminators.
To investigate the ability of prediction of the defined biomarker candidate of HCC
recurrence, the validation of defined principal metabolites was performed by the feature
selection of random forest (RF). The calculation was realized by the algorithm written
in the C++ language. For the discrimination between the recurrent and non-recurrent
HCV-HCC patients, two third of samples were utilized to be the training data while the
remaining one third of the samples were acted as the validation set. Both the two RF
analyses were run 100 times, the frequency of the present of a certain discriminator in
all runs was obtained. Discriminator with a frequency of present superior to 50% was
considered as a potential biomarker.
The binary logistic regression (BLR) with the method “condition: forward” was
used to select the potential biomarkers in the discriminators. The data of the obtained
109
discriminators were again submitted to the BLR with the method “enter”. A probability
representing the combination of the discriminators was calculated for each sample. And
the probability was sent up to test the area under receiver operating characteristic curve
(AUROC).
Results
For the samples in the training set, data pretreatment was started with the 16 QC
samples. After the deconvolution and peak alignment for the QC samples, 459 peaks
were initially detected. After removing the peaks with more than 20% null area, it was
shown that 87% of the peaks were found stable with their RSD of area inferior to 30%,
occupying 94% of total peak area. Other peaks with RSD superior to 30% were
therefore excluded. To test the stability of the analytical sequence, an assessment by
PCA for all the QC samples was performed (Figure S-1), a focalization of the QC
samples was observed by comparing to all other real samples, which showed a good
stability of the analytical sequence. Finally, 230 peaks which correspond to comprised
compounds in the serum were obtained. Afterward, peaks in the real samples were
qualified by the characterized peaks in QC samples and then quantified by the
integration of their area. The information of peak area represents the relative
concentration of corresponding compound in the serum. Finally, a data set for real
samples containing peak area information for all their 230 defined peaks was therefore
established, and analyzed in the following discriminatory analyses.
For the experiences with the samples in the validation set, the estimation of the
RSD for the targeted peaks in the 9 QC samples were obtained, shown in the table S-3,
the peaks with smaller RSD were selected and submitted to the tests of AUROC.
110
Baseline characteristic of patients.
85 samples from 46 patients fulfilling the inclusion criteria were ultimately included in
the present study. Among the samples, 38 were included in the training set while 47
others were encompassed in the validation set. The distribution of all the samples was
noted in Figure 1. The samples were regrouped by the sampling time (BT: before RFA
therapy; AT: 2 months after RFA therapy) and recurrence (NR: non-recurrent patients;
R: recurrent patients). e.g. RBT means the sample obtained before RFA treatment from
non-HCV infection HCC patient with recurrence; NRAT means the sample drawn from
HCV-infected patient without recurrence after RFA therapy. The baseline information
for all the included patients is shown in Table 1. On the basis of the statistical data in
the table, no significant variation (p>0.05) from the clinical assessments was found
between the recurrent group and the non-recurrent group.
On the contrary, significant differences between HCV-HCC patients and non-viral HCC
patients were found in the largest nodule size, the cholesterol, the blood sugar content
and two transaminases. The results implied that the principal discrepancy among the
patients corresponds to the fact whether the patient was affected by viral hepatitis,
which has been determined in our previous study (23).
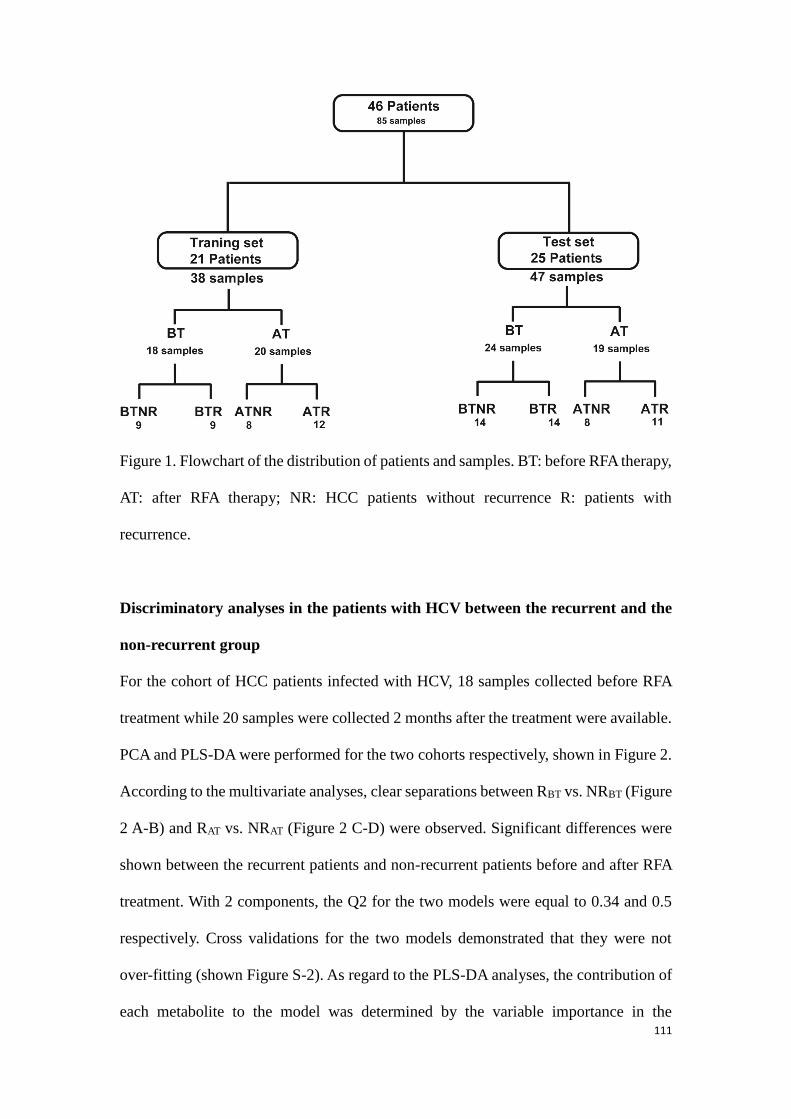
111
Figure 1. Flowchart of the distribution of patients and samples. BT: before RFA therapy,
AT: after RFA therapy; NR: HCC patients without recurrence R: patients with
recurrence.
Discriminatory analyses in the patients with HCV between the recurrent and the
non-recurrent group
For the cohort of HCC patients infected with HCV, 18 samples collected before RFA
treatment while 20 samples were collected 2 months after the treatment were available.
PCA and PLS-DA were performed for the two cohorts respectively, shown in Figure 2.
According to the multivariate analyses, clear separations between RBT vs. NRBT (Figure
2 A-B) and RAT vs. NRAT (Figure 2 C-D) were observed. Significant differences were
shown between the recurrent patients and non-recurrent patients before and after RFA
treatment. With 2 components, the Q2 for the two models were equal to 0.34 and 0.5
respectively. Cross validations for the two models demonstrated that they were not
over-fitting (shown Figure S-2). As regard to the PLS-DA analyses, the contribution of
each metabolite to the model was determined by the variable importance in the
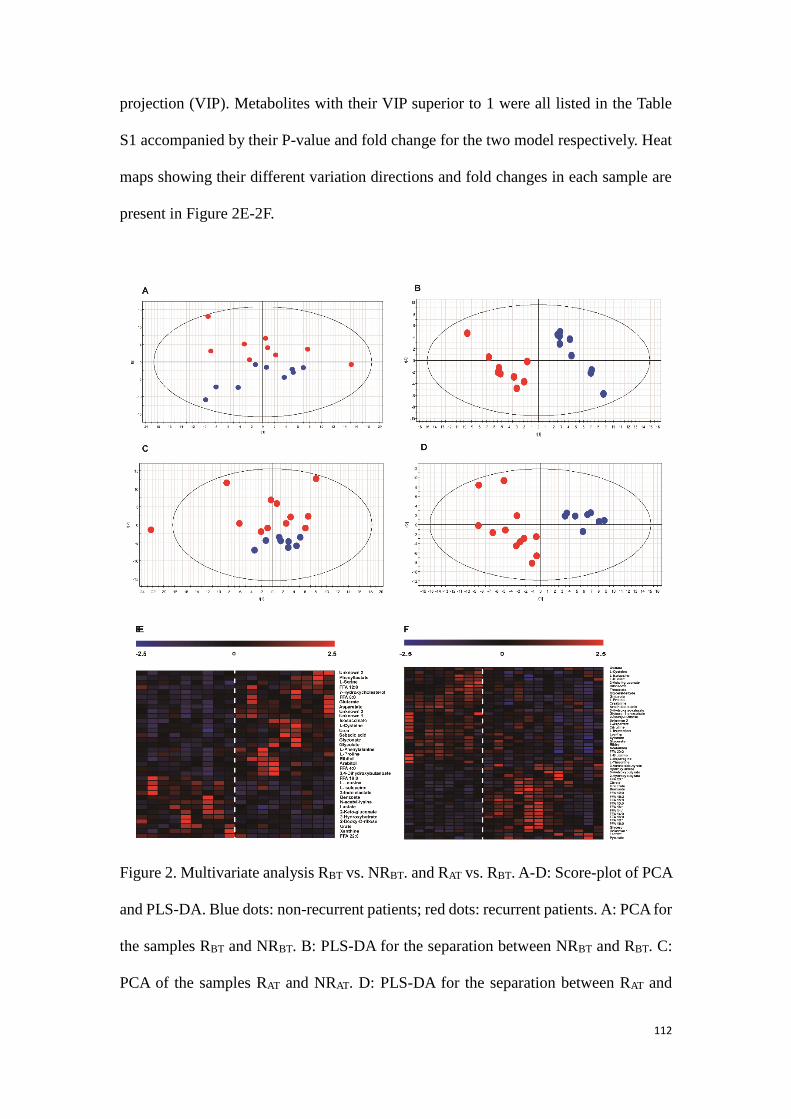
112
projection (VIP). Metabolites with their VIP superior to 1 were all listed in the Table
S1 accompanied by their P-value and fold change for the two model respectively. Heat
maps showing their different variation directions and fold changes in each sample are
present in Figure 2E-2F.
Figure 2. Multivariate analysis RBT vs. NRBT. and RAT vs. RBT. A-D: Score-plot of PCA
and PLS-DA. Blue dots: non-recurrent patients; red dots: recurrent patients. A: PCA for
the samples RBT and NRBT. B: PLS-DA for the separation between NRBT and RBT. C:
PCA of the samples RAT and NRAT. D: PLS-DA for the separation between RAT and
113
NRAT. E-F: Heat map presenting the hierarchical clustering analysis for the two
separation, on the left of the dotted line: non-recurrent patients; on the right of the dotted
line: recurrent patients. E: heat map for RBT vs. NRBT; F: heat map for RAT vs. NRAT.
Metabolome differences between the recurrent and the non-recurrent groups
before the RFA therapy (BT)
As it has been shown in Figure 2E, 35 metabolites were determined to be significant in
the comparison between RBT and NRBT. Among the significant discriminators, we
exhibited a general increased level of amino acids in the RBT, compared with NRBT.
Concerning the free fatty acids in the serum, FFA 4:0 and FFA 12:0 were elevated in
the RBTs compared with those in NRBT, while FFA 18:0 and FFA 22:6
(Docosahexaenoic acid, DHA) varied in the opposite direction. Besides, upregulation
of two pentose phosphate pathway (PPP) involved metabolites such as ribitol and
arabitol was observed. Being linked to the purine metabolism, xanthine and urate were
down-regulated in the recurrent patients. Several energy-related organic acids such as
lactic acid, glycolic acid, glutaric acid and sebacic acid were also shown to be
responsible for the separation of RBT vs. NRBT. Other significant discriminators
included indolelactate, benzeneacetate, benzoate and urea. A pathway showing the
discriminations in involved metabolites between the RBT and the NRBT has been shown
in Figure 3.

114
Figure 3. Discriminators with their relative quantification and their involving pathways
of NRBT (blue bars) vs. RBT (red bars). *: p<0.05, **: p<0.01.
Metabolome differences between the recurrent and the non-recurrent patients
after the RFA therapy (AT)
For the comparison between RAT and NRAT, 50 metabolites were shown significantly
varied (shown Figure 2F). Among them, generally heightened fatty acids were found in
the recurrent cases, except for arachidonic acid (ARA, FFA 20:4), which was similar to
115
the finding in the fatty acids with BT. But, we noticed kinds of metabolites such as
amino acids, PPP involved metabolites and lactate altering adversely against the
comparison in BT. Opposite variation directions of certain metabolites against their
regularities observed with BT were otherwise true for metabolites such as benzoate and
glutarate. Moreover, 2 metabolites involved in the TCA cycle, citrate and isocitrate,
augmented in recurrent cases, which was not found in the comparison of RBT vs. NRBT.
Other significant differences related to the post-operational recurrence were found in
the metabolites such as creatinine, citrulline, threonate, 2-hydroxybutyrate, 3-
aminoisobuyrate, etc. (Table S-4). Relative quantifications of some metabolite
discriminators distinguishing the RAT from the NRAT have been shown within their
involving pathways the Figure 4.
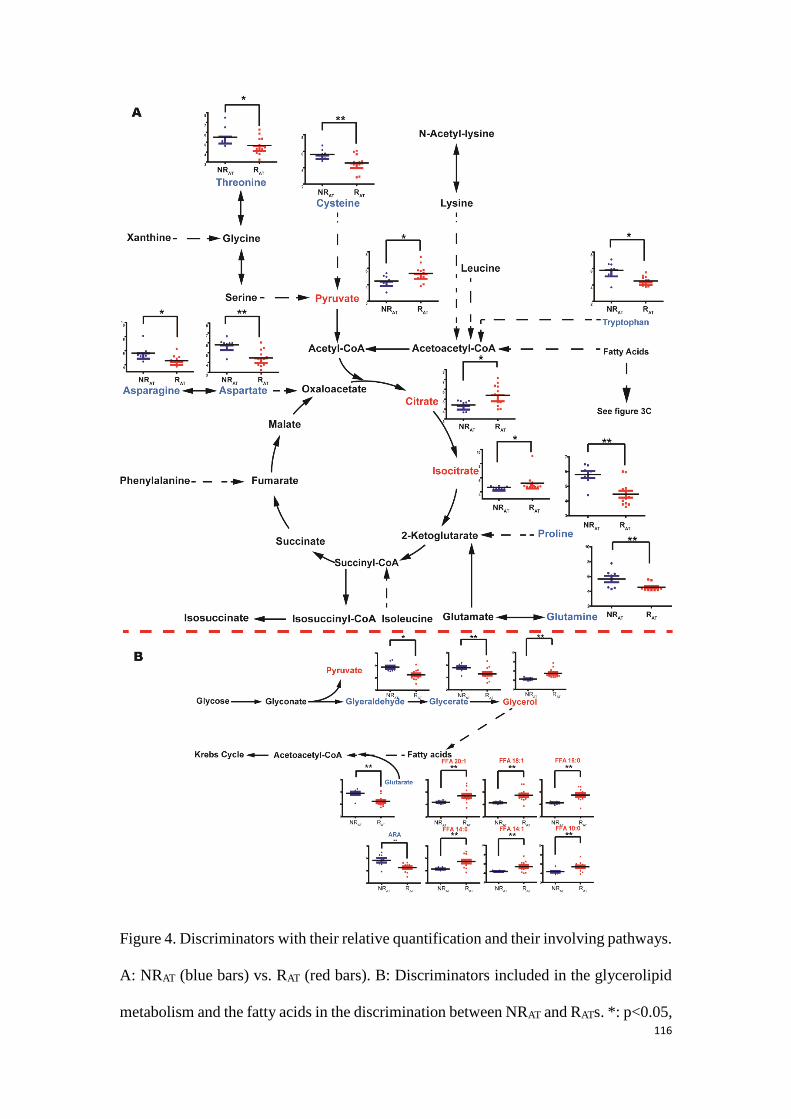
116
Figure 4. Discriminators with their relative quantification and their involving pathways.
A: NRAT (blue bars) vs. RAT (red bars). B: Discriminators included in the glycerolipid
metabolism and the fatty acids in the discrimination between NRAT and RATs. *: p<0.05,
117
**: p<0.01.
Determination of potential biomarkers predicting HCC recurrence for the HCV-
related patients
Further determination of key discriminators was achieved by the analysis of volcano
plot (Figure 5). N-acetyl-lysine, glutamate and aspartate were defined for their acute
variation in the RBT vs. NRBT comparison; aspartate, proline, glutarate, glycerol and
FFA 14:0 were characterized as the metabolites highly correlated to the prediction of
HCC relapse after the treatment. Area under receiver operating characteristic curve
(AUROC) for each defined metabolite was subsequently calculated to affirm its
reliability of recurrence prediction (shown in Table 2 and Figure 5C-D). Accordingly,
apart from FFA 14:0, all the defined principal discriminators showed outstanding
performances with their AUROC superior to 0.80.
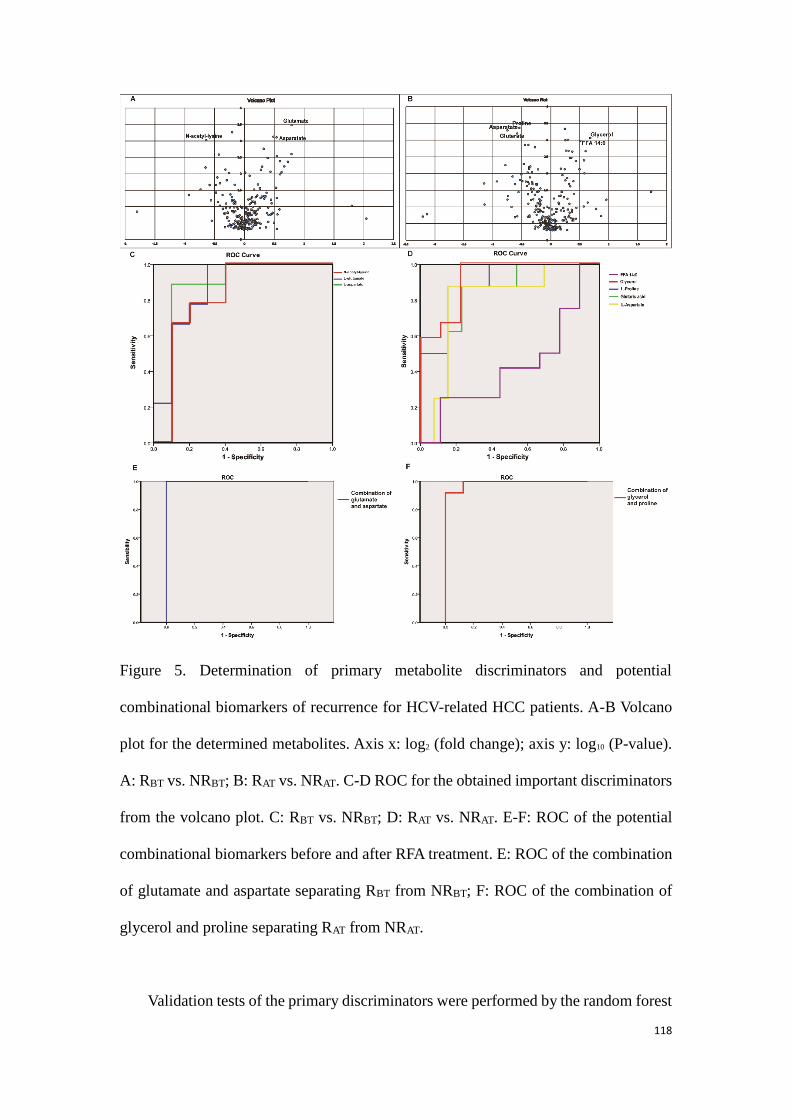
118
Figure 5. Determination of primary metabolite discriminators and potential
combinational biomarkers of recurrence for HCV-related HCC patients. A-B Volcano
plot for the determined metabolites. Axis x: log2 (fold change); axis y: log10 (P-value).
A: RBT vs. NRBT; B: RAT vs. NRAT. C-D ROC for the obtained important discriminators
from the volcano plot. C: RBT vs. NRBT; D: RAT vs. NRAT. E-F: ROC of the potential
combinational biomarkers before and after RFA treatment. E: ROC of the combination
of glutamate and aspartate separating RBT from NRBT; F: ROC of the combination of
glycerol and proline separating RAT from NRAT.
Validation tests of the primary discriminators were performed by the random forest
119
(RF) during 100 runs. For the comparison by the recurrence prior to the treatment, the
average accuracy rate on independent tests was 80.7%±7.6%; the result for the RAT
and NRAT separation was 82.9%±8.0%. Table 2 displays the probability of presence of
the discriminator in the 100 runs of RF models. It can be observed that N-acetyl-lysine
and FFA 14:0 were present in less than half of the RF models, which should be rejected
for being biomarker candidates. Other metabolites were proved to be more important
for the two models.
Finally, after the exclusion of the two metabolites with poor performances in the
RF models, the remaining metabolites were submitted to determine potential
combinational biomarkers. For the model based on the samples obtained before the
treatment (BT), the combination of aspartate and glutamate showed an accuracy of 100%
in ROC (Figure 5E). For AT, glycerol and proline were the two crucial variables for the
prediction. Their combination showed 99% accuracy of prediction for post-operative
recurrence (Figure 5F).
Validation by the validation set
The predictability of recurrence of the two combinational biomarker candidates in the
samples of validation set was verified by another ROCs. As shown in Figure 6, the
combination of aspartate and glutamate presents an AUROC = 0.83 for the prediction
of HCC recurrence in the BT. The AUROC was equal to 0.78 for the prediction of HCC
recurrence in AT by the combination of glycerol and proline.
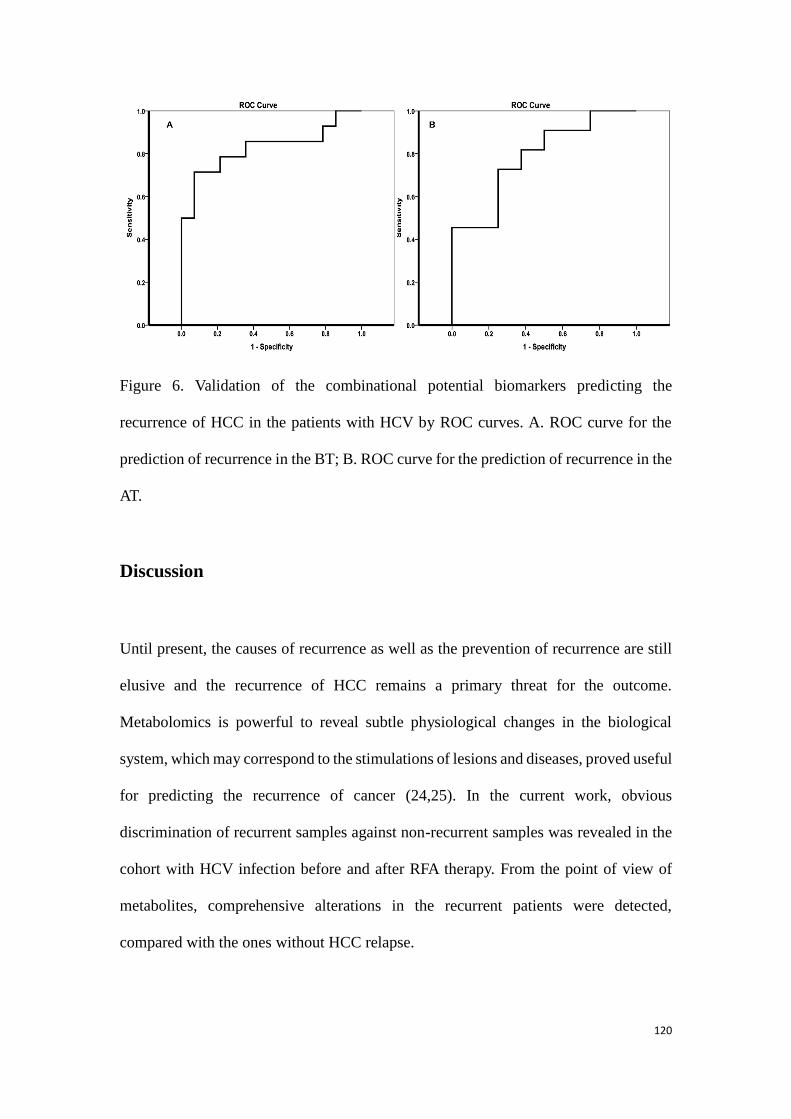
120
Figure 6. Validation of the combinational potential biomarkers predicting the
recurrence of HCC in the patients with HCV by ROC curves. A. ROC curve for the
prediction of recurrence in the BT; B. ROC curve for the prediction of recurrence in the
AT.
Discussion
Until present, the causes of recurrence as well as the prevention of recurrence are still
elusive and the recurrence of HCC remains a primary threat for the outcome.
Metabolomics is powerful to reveal subtle physiological changes in the biological
system, which may correspond to the stimulations of lesions and diseases, proved useful
for predicting the recurrence of cancer (24,25). In the current work, obvious
discrimination of recurrent samples against non-recurrent samples was revealed in the
cohort with HCV infection before and after RFA therapy. From the point of view of
metabolites, comprehensive alterations in the recurrent patients were detected,
compared with the ones without HCC relapse.
121
Free fatty acids glycerolipid metabolism
Among the HCV-related HCC patients, it was notable that a comprehensive turnover of
free fatty acids in the recurrent patients was found both before and after RFA treatment
compared with those without recurrence. Even-carbon chain fatty acids including long-
chain and medium-chain saturated fatty acids (SFAs) and monounsaturated fatty acids
(MUFAs) were up-regulated in the comparison NRAT vs. RAT. Interestingly, short-chain
and medium-chain fatty acids were determined up-regulated in RBT compared to NRBT.
However, arachidonic acid (ARA, 20:4) and docosahexaenoic acid (DHA 22:6), which
are long-chain polyunsaturated acids (PUFAs), were meanwhile down-regulated in RAT
and RBT respectively (Shown in Figure 3, 4A). First, immune function like anti-
inflammatory of PUFAs was well known (26). The depletion of PUFAs might refer to
a poor prognosis owing to the hepatic viral infection. Second, HCV core protein causes
insulin resistance which might be the direct origin of the wide increase of fatty acids in
blood (27). It was also known as activating the liver X receptor alpha (LXRα), which
modulated inflammatory genes and resulted in lipogensis (28). Being associated with
the LXR, the raised level of 7-hydroxycholesterol (P<0.05) in recurrent patients also
referred to a hypercholesterolemia and consequently cancer growth (29). Third,
significant increased level in FFAs was found in the comparison between HCV infected
cells and controls (30), a higher level in the HCC patients with HCV might imply a
more activated HCV core protein. Finally, FFAs were demonstrated responsible for the
cancer invasion and migration of HCC cancer cells (31). Taken together, both before
and after RFA therapy, the deregulation of FFA in the serum of HCV infected HCC
patients should account for the HCC recurrence.
Glycerolipid metabolism, TCA cycle and energy-related metabolism
122
Notable upregulation of glycerol (p<0.01), which is another precursor of triglyceride
(TG) synthesis other than FFAs, was observed in RAT compared with NRAT. Meanwhile,
as being two upstream metabolites for glycerol, glyceraldehyde (p<0.05) and glycerate
(p<0.01) were down-regulated. It has been discussed that the HCV induced insulin
resistance and inhibition of synthesis of TG, consistent with the accumulation of
glycerol and FFAs in the patients with relapse, shown in Figure 4B.
On the other hand, enhanced lactate (p<0.05) synthesis from pyruvate (p<0.05) in
the recurrent patients was observed. We ever reported upregulation of lactate as a
potential biomarker for the HCC recurrence (32). This is due to a high energy demand
from the HCC cell emergence (33). Notably, it was best known that the HCV core
protein activates the hypoxia-inducible factor 1 (HIF1), which promotes hypoxic
environment for the development of HCC (34)..
Increments of two metabolites in the TCA cycle, citrate (p<0.05) and isocitrate
(p<0.05) were only found in recurrent patients after their treatment, which could be
attributed to the growth of energy demand for generation of tumor.
Amino acids
According to our analyses before and after RFA therapy, the level of amino acids was
of great importance for the separation between the recurrent and non-recurrent group
(shown in Figure3 and 4A).
For the discriminatory analyses of recurrence in AT, the downregulation of various
amino acids presented in Figure 4 had been widely reported as less optimist prognosis
in HCC patients (14,18,20,35-38), which was primarily due to the comprehensive
protein depletion after clinical treatment and the upregulation of anabolism prior to the
relapse.
123
But, as a contrast to the results above in AT, except for two branched chain amino
acids (BCCA), reverse variation trend was found in numbers of amino acids alteration
emerged in NRBT vs RBT. As it has been documented, the up-regulated serine and
threonine pathway was considered as an important signal of bad outcome of cancer
(18,20). Upregulation of proline and cysteine pathway was otherwise observed along
the proliferation and the cell cycle of HCC (39). The elevated level of glutamate and
aspartate might be related to the deregulation of the aminotransferases such as GGC
and AST in the case of HCC (40,41).
Pentose phosphate metabolism
Arabitol and ribitol, which were included in pentose phosphate pathway (PPP), were
found significantly up-regulated in the comparison of RBT to NRBT. Being related to the
synthesis of nucleoside, upregulation of pentose related pathway might be due to
dynamic proliferation of DNA in the recurrent patients before RFA therapy. On the
contrary, after the tumor was removed, significant declines not only in the two above
metabolites but also in ribonic acid and xylonic acid in RAT compared to NRAT. Given
that TCA cycle involved metabolites and lactate were found elevated in the recurrent
group after RFA therapy, the decrement of the PPP metabolites might issue from a
down-regulation of the energy supply from this pathway.
Other significantly varied metabolites in the recurrent patients
For the model NRBT vs. RBT, beyond discussed metabolites and pathways, other
metabolites listed in the Table S1 were also significantly altered in RBT. The decline of
xanthine, accompanied by the decrease of urate might be subjected to the consumption
of purine during the replication of DNA. Elevated methylmalonate was linked to the
124
up-regulated TCA cycle and the degradation of BCCAs. The acetylation of lysine was
reported attenuated in another cancers (42), in accordance to our result. We previously
reported heightened 2-hydroxybutyrate (2-HB) as a potential marker separating HCC
patients and health controls (14), however, in this work, decline of 2-HB was exhibited
in small HCC patients with relapse.
Metabolites such as citrulline and oxalate also contributed to the separation
between NRAT and RAT. Citrulline is synthetized in liver, decreased citrulline indicated
an altered liver function and a deprivation of synthesis citrulline from argininosuccinate
(43). As for oxalate, it was also reported remarkably augmented in recurrent patients
when compared with non-recurrent patients (32).
Determination of the combinational biomarkers of recurrence for the HCC
patients with HCV
The primary discriminators related to the recurrence were defined, shown in Figure
5. Eventually, the combination of aspartate and glutamate shows potential to predict
recurrence for the BT. As discussed above, previous studies have reported the
predictability of HCC recurrence by AST and GGT, providing evidence that the two
amino acids which are directly regulated by the two aminotransferases may be also
significant indicators for recurrence before the clinical operation. On the other aspect,
after the small HCC was removed by the RFA treatment, strikingly, the remarkable
upregulation of glycerol, accompanied by the increment of various fatty acids should
attribute to the HCV-induced insulin resistance which hindered the synthesis of TG.
The combination of glycerol and proline was eventually shown powerful to predict
HCC recurrence for the AT. Our experiences of validation with external test samples
125
showed the predictability of the determined combinational biomarker candidates were
acceptable both before and after RFA therapy.
Conclusions
In our previous study, considerable metabolic differences were reported between HCC
patients with and without hepatitis virus infections. In the present study, we contribute
to investigate the metabolic differences between recurrent and non-recurrent HCC
patients before and after their RFA therapy. In the HCC patients with HCV infection,
clear separation by recurrence is found both before and after the RFA treatment. Further
analysis concerning the patients shows a general increase of various fatty acids in the
recurrent patients compared with the non-recurrent patients, which may indicate a
dynamic activity of the HCV core protein in the recurrent patients. Whereas,
inconsistent alterations regularity for the pathways of amino acids and PPP were
otherwise revealed between pre-operation and post-operation. We suppose that specific
metabolic variations before the suppression of tumor in the recurrent patients were
linked to DNA replication and tumor proliferation. However, observed decline of amino
acid and deregulation of energy-related metabolites, especially TCA cycle-involved
metabolites, may be associated with the protein depletion after clinical operation and
up-regulated anabolism for tumor genesis. With the confirmation of external validation,
finally, we suggest that the combination of glutamate and aspartate and the combination
of glycerol and proline are potential to be the combinational biomarkers for the
prediction of HCC recurrence with HCV before and after RFA treatment respectively.
126
Acknowledgement
We first thank to Xin Huang for his programming and technic assistance on the random
forest analysis, and to Corentine Goossense, Xianping Lin and Alexandre Baillard for
their help of the preparation of samples. We need also express our thanks to Dr. Yang
Liu, Dr. Yanni Zhao and Dr. Jieyu Zhao for their inspiring suggestions. The study has
been supported by the key foundation (No. 21435006) from the National Natural
Science Foundation of China.
127
References
1. Llovet JM, Burroughs A, Bruix J. Hepatocellular carcinoma. The Lancet 2003;362(9399):1907-
17.
2. Llovet JM, Bruix J. Novel advancements in the management of hepatocellular carcinoma in
2008. J Hepatol 2008;48 Suppl 1:S20-37.
3. Wong LL, Limm WM, Severino R, Wong LM. Improved survival with screening for hepatocellular
carcinoma. Liver transplantation : official publication of the American Association for the Study
of Liver Diseases and the International Liver Transplantation Society 2000;6(3):320-5.
4. Facciorusso A, Del Prete V, Antonino M, Neve V, Amoruso A, Crucinio N, et al. Conditional
survival analysis of hepatocellular carcinoma patients treated with radiofrequency ablation.
Hepatol Res 2015;45(10):E62-72.
5. Livraghi T, Goldberg SN, Lazzaroni S, Meloni F, Solbiati L, Gazelle GS. Small hepatocellular
carcinoma: Treatment with radio-frequency ablation versus ethanol injection. Radiology
1999;210(3):655-61.
6. El-Serag HB. Epidemiology of viral hepatitis and hepatocellular carcinoma. Gastroenterology
2012;142(6):1264-73 e1.
7. Levrero M. Viral hepatitis and liver cancer: the case of hepatitis C. Oncogene 2006;25(27):3834-
47.
8. Donato F, Tagger A, Gelatti U, Parrinello G, Boffetta P, Albertini A, et al. Alcohol and
hepatocellular carcinoma: the effect of lifetime intake and hepatitis virus infections in men and
women. Am J Epidemiol 2002;155(4):323-31.
9. Buonfiglioli F, Conti F, Andreone P, Crespi C, Foschi F, Lenzi M, et al. Development of
hepatocellular carcinoma in HCV cirrhotic patients treated with direct acting antivirals. J
Hepatol 2016;64(2):S215.
10. El-Serag HB, Marrero JA, Rudolph L, Reddy KR. Diagnosis and treatment of hepatocellular
carcinoma. Gastroenterology 2008;134(6):1752-63.
11. Mamas M, Dunn WB, Neyses L, Goodacre R. The role of metabolites and metabolomics in
clinically applicable biomarkers of disease. Arch Toxicol 2011;85(1):5-17.
12. Xia J, Broadhurst DI, Wilson M, Wishart DS. Translational biomarker discovery in clinical
metabolomics: an introductory tutorial. Metabolomics 2013;9(2):280-99.
13. Zhou L, Ding L, Yin P, Lu X, Wang X, Niu J, et al. Serum metabolic profiling study of hepatocellular
carcinoma infected with hepatitis B or hepatitis C virus by using liquid chromatography-mass
spectrometry. Journal of proteome research 2012;11(11):5433-42.
14. Zeng J, Yin P, Tan Y, Dong L, Hu C, Huang Q, et al. Metabolomics study of hepatocellular
carcinoma: discovery and validation of serum potential biomarkers by using capillary
electrophoresis-mass spectrometry. Journal of proteome research 2014;13(7):3420-31.
15. Nahon P, Amathieu R, Triba MN, Bouchemal N, Nault JC, Ziol M, et al. Identification of serum
proton NMR metabolomic fingerprints associated with hepatocellular carcinoma in patients
with alcoholic cirrhosis. Clin Cancer Res 2012;18(24):6714-22.
16. Zhou L, Liao Y, Yin P, Zeng Z, Li J, Lu X, et al. Metabolic profiling study of early and late recurrence
of hepatocellular carcinoma based on liquid chromatography-mass spectrometry. J
Chromatogr B Analyt Technol Biomed Life Sci 2014;966:163-70.
128
17. Nezami Ranjbar MR, Luo Y, Di Poto C, Varghese RS, Ferrarini A, Zhang C, et al. GC-MS Based
Plasma Metabolomics for Identification of Candidate Biomarkers for Hepatocellular Carcinoma
in Egyptian Cohort. PloS one 2015;10(6):e0127299.
18. Fitian AI, Nelson DR, Liu C, Xu Y, Ararat M, Cabrera R. Integrated metabolomic profiling of
hepatocellular carcinoma in hepatitis C cirrhosis through GC/MS and UPLC/MS-MS. Liver
international : official journal of the International Association for the Study of the Liver
2014;34(9):1428-44.
19. Budhu A, Roessler S, Zhao X, Yu Z, Forgues M, Ji J, et al. Integrated metabolite and gene
expression profiles identify lipid biomarkers associated with progression of hepatocellular
carcinoma and patient outcomes. Gastroenterology 2013;144(5):1066-75 e1.
20. Chen T, Xie G, Wang X, Fan J, Qiu Y, Zheng X, et al. Serum and Urine Metabolite Profiling Reveals
Potential Biomarkers of Human Hepatocellular Carcinoma. Molecular & Cellular Proteomics
2011;10(7).
21. Patterson AD, Maurhofer O, Beyoglu D, Lanz C, Krausz KW, Pabst T, et al. Aberrant lipid
metabolism in hepatocellular carcinoma revealed by plasma metabolomics and lipid profiling.
Cancer Res 2011;71(21):6590-600.
22. Wu H, Xue R, Dong L, Liu T, Deng C, Zeng H, et al. Metabolomic profiling of human urine in
hepatocellular carcinoma patients using gas chromatography/mass spectrometry. Anal Chim
Acta 2009;648(1):98-104.
23. Goossens C, Nahon P, Le Moyec L, Triba MN, Bouchemal N, Amathieu R, et al. Sequential Serum
Metabolomic Profiling after Radiofrequency Ablation of Hepatocellular Carcinoma Reveals
Different Response Patterns According to Etiology. Journal of proteome research
2016;15(5):1446-54.
24. Asiago VM, Alvarado LZ, Shanaiah N, Gowda GAN, Owusu-Sarfo K, Ballas RA, et al. Early
Detection of Recurrent Breast Cancer Using Metabolite Profiling. Cancer Res
2010;70(21):8309-18.
25. Cao MD, Sitter B, Bathen TF, Bofin A, Lonning PE, Lundgren S, et al. Predicting long-term survival
and treatment response in breast cancer patients receiving neoadjuvant chemotherapy by MR
metabolic profiling. Nmr Biomed 2012;25(2):369-78.
26. Calder PC. Omega-3 fatty acids and inflammatory processes. Nutrients 2010;2(3):355-74.
27. Li HC, Ma HC, Yang CH, Lo SY. Production and pathogenicity of hepatitis C virus core gene
products. World J Gastroenterol 2014;20(23):7104-22.
28. Lima-Cabello E, Garcia-Mediavilla MV, Miquilena-Colina ME, Vargas-Castrillon J, Lozano-
Rodriguez T, Fernandez-Bermejo M, et al. Enhanced expression of pro-inflammatory mediators
and liver X-receptor-regulated lipogenic genes in non-alcoholic fatty liver disease and hepatitis
C. Clin Sci (Lond) 2011;120(6):239-50.
29. Nelson ER, Wardell SE, Jasper JS, Park S, Suchindran S, Howe MK, et al. 27-Hydroxycholesterol
Links Hypercholesterolemia and Breast Cancer Pathophysiology. Science
2013;342(6162):1094-8.
30. Roe B, Kensicki E, Mohney R, Hall WW. Metabolomic Profile of Hepatitis C Virus-Infected
Hepatocytes. PloS one 2011;6(8):e23641.
31. Nath A, Li I, Roberts LR, Chan C. Elevated free fatty acid uptake via CD36 promotes epithelial-
mesenchymal transition in hepatocellular carcinoma. Sci Rep 2015;5:14752.
32. Ye G, Zhu B, Yao Z, Yin P, Lu X, Kong H, et al. Analysis of urinary metabolic signatures of early
129
hepatocellular carcinoma recurrence after surgical removal using gas chromatography-mass
spectrometry. Journal of proteome research 2012;11(8):4361-72.
33. Vander Heiden MG, Cantley LC, Thompson CB. Understanding the Warburg effect: the
metabolic requirements of cell proliferation. Science (New York, NY) 2009;324(5930):1029-33.
34. Arzumanyan A, Reis HM, Feitelson MA. Pathogenic mechanisms in HBV- and HCV-associated
hepatocellular carcinoma. Nature reviews Cancer 2013;13(2):123-35.
35. DeBerardinis RJ, Cheng T. Q's next: the diverse functions of glutamine in metabolism, cell
biology and cancer. Oncogene 2010;29(3):313-24.
36. Long J, Wang H, Lang Z, Wang T, Long M, Wang B. Expression level of glutamine synthetase is
increased in hepatocellular carcinoma and liver tissue with cirrhosis and chronic hepatitis B.
Hepatology international 2011;5(2):698-706.
37. Zhang B, Dong LW, Tan YX, Zhang J, Pan YF, Yang C, et al. Asparagine synthetase is an
independent predictor of surgical survival and a potential therapeutic target in hepatocellular
carcinoma. Br J Cancer 2013;109(1):14-23.
38. Loayza-Puch F, Rooijers K, Buil LC, Zijlstra J, Oude Vrielink JF, Lopes R, et al. Tumour-specific
proline vulnerability uncovered by differential ribosome codon reading. Nature
2016;530(7591):490-4.
39. De Giorgi V, Buonaguro L, Worschech A, Tornesello ML, Izzo F, Marincola FM, et al. Molecular
Signatures Associated with HCV-Induced Hepatocellular Carcinoma and Liver Metastasis. PloS
one 2013;8(2):e56153.
40. Song P, Inagaki Y, Wang Z, Hasegawa K, Sakamoto Y, Arita J, et al. High Levels of Gamma-
Glutamyl Transferase and Indocyanine Green Retention Rate at 15 min as Preoperative
Predictors of Tumor Recurrence in Patients With Hepatocellular Carcinoma. Medicine
(Baltimore) 2015;94(21):e810.
41. Poon RT, Fan ST, Ng IO, Lo CM, Liu CL, Wong J. Different risk factors and prognosis for early and
late intrahepatic recurrence after resection of hepatocellular carcinoma. Cancer
2000;89(3):500-7.
42. Zhao D, Zou SW, Liu Y, Zhou X, Mo Y, Wang P, et al. Lysine-5 acetylation negatively regulates
lactate dehydrogenase A and is decreased in pancreatic cancer. Cancer cell 2013;23(4):464-76.
43. Wheatley DN, Kilfeather R, Stitt A, Campbell E. Integrity and stability of the citrulline-arginine
pathway in normal and tumour cell lines. Cancer Lett 2005;227(2):141-52.
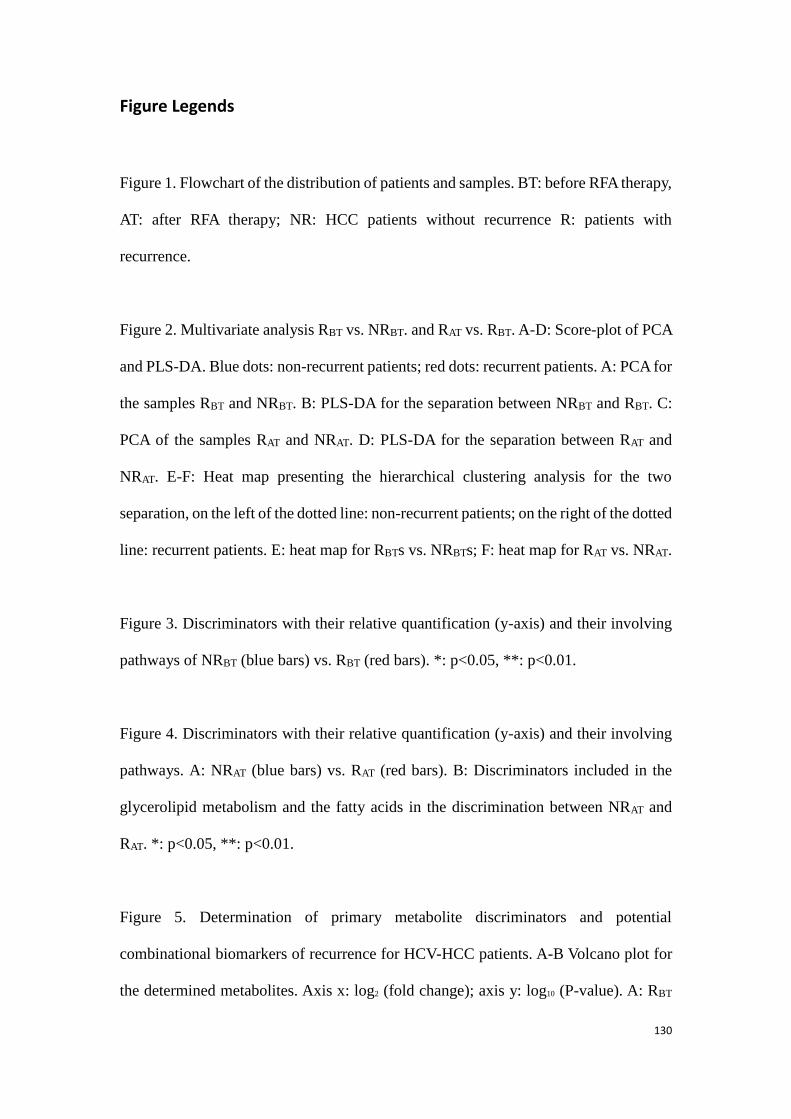
130
Figure Legends
Figure 1. Flowchart of the distribution of patients and samples. BT: before RFA therapy,
AT: after RFA therapy; NR: HCC patients without recurrence R: patients with
recurrence.
Figure 2. Multivariate analysis RBT vs. NRBT. and RAT vs. RBT. A-D: Score-plot of PCA
and PLS-DA. Blue dots: non-recurrent patients; red dots: recurrent patients. A: PCA for
the samples RBT and NRBT. B: PLS-DA for the separation between NRBT and RBT. C:
PCA of the samples RAT and NRAT. D: PLS-DA for the separation between RAT and
NRAT. E-F: Heat map presenting the hierarchical clustering analysis for the two
separation, on the left of the dotted line: non-recurrent patients; on the right of the dotted
line: recurrent patients. E: heat map for RBTs vs. NRBTs; F: heat map for RAT vs. NRAT.
Figure 3. Discriminators with their relative quantification (y-axis) and their involving
pathways of NRBT (blue bars) vs. RBT (red bars). *: p<0.05, **: p<0.01.
Figure 4. Discriminators with their relative quantification (y-axis) and their involving
pathways. A: NRAT (blue bars) vs. RAT (red bars). B: Discriminators included in the
glycerolipid metabolism and the fatty acids in the discrimination between NRAT and
RAT. *: p<0.05, **: p<0.01.
Figure 5. Determination of primary metabolite discriminators and potential
combinational biomarkers of recurrence for HCV-HCC patients. A-B Volcano plot for
the determined metabolites. Axis x: log2 (fold change); axis y: log10 (P-value). A: RBT
131
vs. NRBT; B: RAT vs. NRAT. C-D ROC for the obtained important discriminators from
the volcano plot. C: RBT vs. NRBT; D: RAT vs. NRAT. E-F: ROC of the potential
combinational biomarkers before and after RFA treatment. E: ROC of the combination
of glutamate and aspartate separating RBT from NRBT; F: ROC of the combination of
glycerol and proline separating RAT from NRAT.
Figure 6. Validation of the combinational potential biomarkers predicting the
recurrence of HCC in the patients with HCV by ROC curves. A. ROC curve for the
prediction of recurrence in the BT; B. ROC curve for the prediction of recurrence in the
AT.
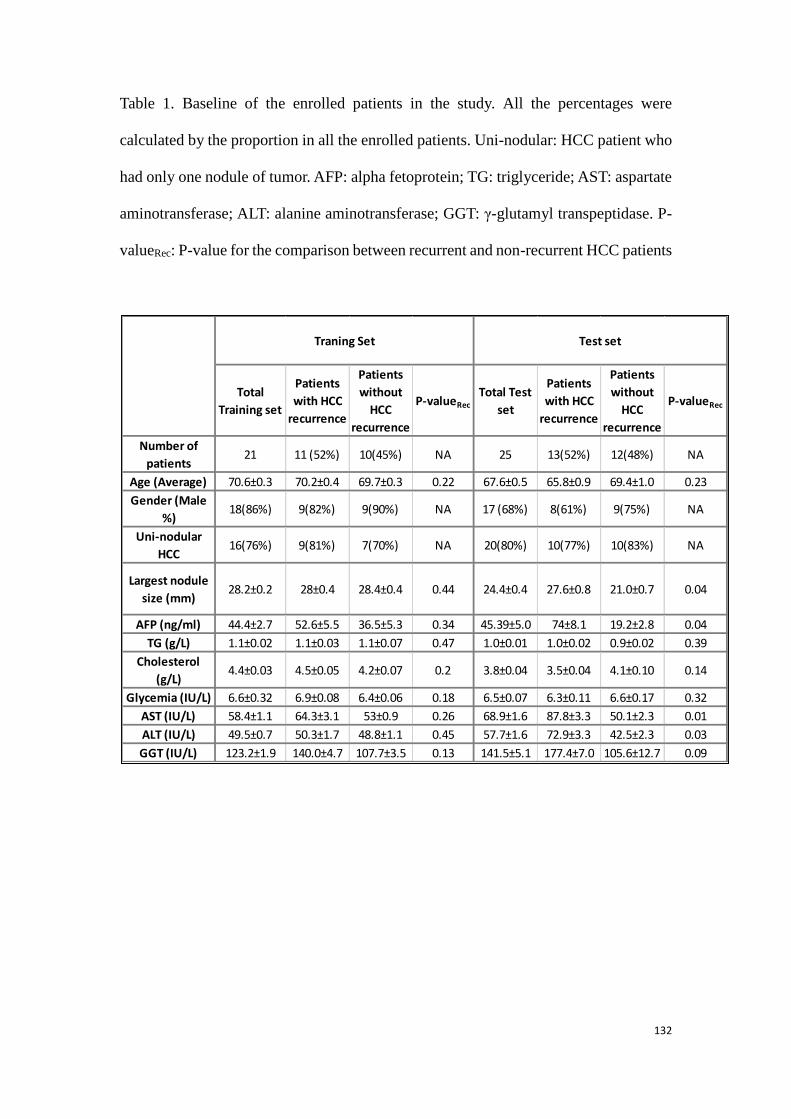
132
Table 1. Baseline of the enrolled patients in the study. All the percentages were
calculated by the proportion in all the enrolled patients. Uni-nodular: HCC patient who
had only one nodule of tumor. AFP: alpha fetoprotein; TG: triglyceride; AST: aspartate
aminotransferase; ALT: alanine aminotransferase; GGT: γ-glutamyl transpeptidase. P-
valueRec: P-value for the comparison between recurrent and non-recurrent HCC patients
Total
Training set
Patients
with HCC
recurrence
Patients
without
HCC
recurrence
P-valueRec
Total Test
set
Patients
with HCC
recurrence
Patients
without
HCC
recurrence
P-valueRec
Number of
patients21 11 (52%) 10(45%) NA 25 13(52%) 12(48%) NA
Age (Average) 70.6±0.3 70.2±0.4 69.7±0.3 0.22 67.6±0.5 65.8±0.9 69.4±1.0 0.23
Gender (Male
%)18(86%) 9(82%) 9(90%) NA 17 (68%) 8(61%) 9(75%) NA
Uni-nodular
HCC16(76%) 9(81%) 7(70%) NA 20(80%) 10(77%) 10(83%) NA
Largest nodule
size (mm)28.2±0.2 28±0.4 28.4±0.4 0.44 24.4±0.4 27.6±0.8 21.0±0.7 0.04
AFP (ng/ml) 44.4±2.7 52.6±5.5 36.5±5.3 0.34 45.39±5.0 74±8.1 19.2±2.8 0.04
TG (g/L) 1.1±0.02 1.1±0.03 1.1±0.07 0.47 1.0±0.01 1.0±0.02 0.9±0.02 0.39
Cholesterol
(g/L)4.4±0.03 4.5±0.05 4.2±0.07 0.2 3.8±0.04 3.5±0.04 4.1±0.10 0.14
Glycemia (IU/L) 6.6±0.32 6.9±0.08 6.4±0.06 0.18 6.5±0.07 6.3±0.11 6.6±0.17 0.32
AST (IU/L) 58.4±1.1 64.3±3.1 53±0.9 0.26 68.9±1.6 87.8±3.3 50.1±2.3 0.01
ALT (IU/L) 49.5±0.7 50.3±1.7 48.8±1.1 0.45 57.7±1.6 72.9±3.3 42.5±2.3 0.03
GGT (IU/L) 123.2±1.9 140.0±4.7 107.7±3.5 0.13 141.5±5.1 177.4±7.0 105.6±12.7 0.09
Test setTraning Set
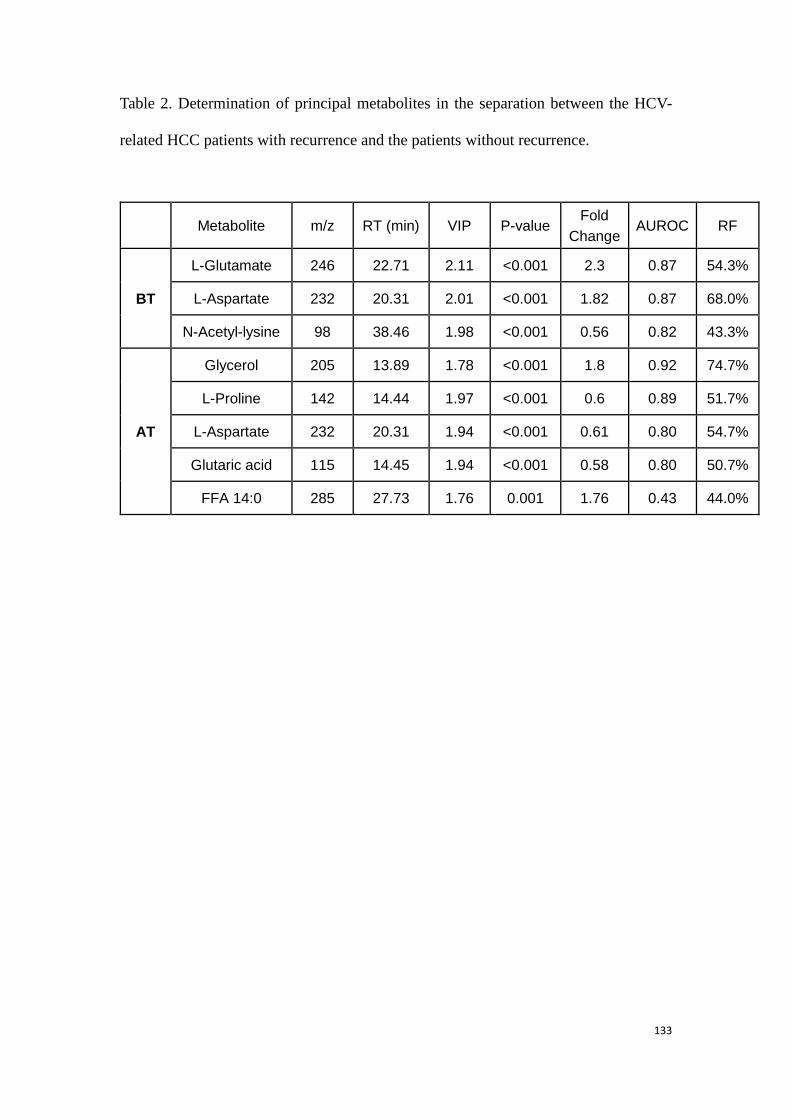
133
Table 2. Determination of principal metabolites in the separation between the HCV-
related HCC patients with recurrence and the patients without recurrence.
Metabolite m/z RT (min) VIP P-value Fold
Change AUROC RF
BT
L-Glutamate 246 22.71 2.11 <0.001 2.3 0.87 54.3%
L-Aspartate 232 20.31 2.01 <0.001 1.82 0.87 68.0%
N-Acetyl-lysine 98 38.46 1.98 <0.001 0.56 0.82 43.3%
AT
Glycerol 205 13.89 1.78 <0.001 1.8 0.92 74.7%
L-Proline 142 14.44 1.97 <0.001 0.6 0.89 51.7%
L-Aspartate 232 20.31 1.94 <0.001 0.61 0.80 54.7%
Glutaric acid 115 14.45 1.94 <0.001 0.58 0.80 50.7%
FFA 14:0 285 27.73 1.76 0.001 1.76 0.43 44.0%
134
3.3.2 Conclusion to this part of experimental research
HCC is primary in liver cancer which leads to a high rate of recurrence and mortality.
However, current prediction of HCC recurrence is not as reliable as expected. HCV
infection is one of the primary causes of HCC. Our previous study has shown
comprehensive differences of metabolome between the viral and non-viral HCC
patients. Even though some studies concerning the recurrence of HCC has been
performed before, to our known, the metabolome of the patients was not analyzed in
the condition of a classification of the patients by the fact of virus infection.
In the present study, GC-MS-based metabolomics has been applied to analyze the
differences of metabolome between the recurrent and non-recurrent HCC patients,
especially in the patients who are affected by the HCV infection. We report that clear
separations have been found with the metabolic profiles between the HCV-related
recurrent and non-recurrent HCC patients, before and after their RFA therapies.
Metabolites involved the pathways such as amino acids, fatty acids, glycerolipid
metabolism, PPP accounted for the prediction of HCC recurrence in the HCV-HCC
patients. With our validations of results, our eventually defined combinational
biomarker candidates were shown to be potential for the prediction of HCC relapse
before and after RFA treatment.
On the contrary, no clear separation about the HCC relapse was found when we
compared the two groups of non-viral patients, same results were found with all the
enrolled patients. Since variations in considerable kinds of lipids were revealed to be
responsible to the HCC recurrence, next study should be performed with a systematic
lipidomics which will provide further information of the variations of lipids and
relevant pathways.
135
General conclusions and perspectives
The development of metabolomics makes it an important component in the system
biology. It has been shown that the determination of the expression of certain
metabolites was directly related to a physiological state. Therefore, its application in
the field of clinical research is potential. One of the core tasks of metabolomics in the
clinical applications is to find out novel and accurate biomarkers with which we are
able to have a better understanding of individual physiological situation in time, to
predict the outcome of disease and to perform targeted treatments.
In the first part of the study, we aimed to determine the biomarkers predicting the
mortality of septic shock. Metabolic differences were uncovered by both LC-MS and
1D NMR spectroscopy between the septic survivors and the non-survivors before
clinical intervention. Further, with the help of paired model by NMR-based approach,
the evolution of metabolic profiles from the hospitalization to 24h later were
investigated, and an apparent separation between the survivors and non-survivors was
found again. Interestingly, according to the results found with the NMR experiences,
variations of the metabolites such as energy-related metabolites and some amino
acids in the non-survivors were in accord with those found with MS experiences. On
the other hand, for example, variations in some urea cycle-involved metabolites and
in glucose were only determined by the LC-MS-based method and by the NMR-based
method respectively. According to the study using the both techniques, we figure out
the method with LC-MS a better coverage of metabolites is achievable, but, an easier
sample preparation and data analysis is proceeded with NMR than MS. Also, it is
shown that both the MS and NMR-based metabolomics are useful for the clinical
application and the two techniques are complementary. We claim that using
meanwhile both the techniques will provide more information of the metabolome
than using only one platform and the similar obtained findings from the two
techniques can be a mutual confirmation for the two work.
In the second part of the work, biomarkers were sought for predicting HCC relapse in
136
the HCC patients who were also suffered from HCV infection. Serum samples from HCC
patients before and after RFA treatment were studied separately by the fact of
infectious hepatitis virus. GC-MS has been applied for the serum metabolome analyses.
Accordingly, considerable differences of metabolic profiles have been exhibited
between HCC recurrent patients and non-recurrent patients before and after RFA
therapy. As regard to the obtained results, similar variation in the fatty acids, which
may be related to the activity of HCV core protein, in the recurrent patients compared
with the non-recurrent patients before and after RFA therapy. However, strikingly,
opposite regularities in the pathways such as amino acids and PPP are found from the
two discriminant models about HCC relapse. We suggest that the difference of
variation directions in the involved pathways issue from the exclusion of tumor.
This study brings some imperfectness which might be accomplished in the following
work. Above all, the number of samples was a remarkable limit in the both parts of
the work. More other samples, especially some samples obtained from other hospitals
should be tested to confirm the obtained results. Besides, we witnessed that there
were a variety of variations in lipids along the study. Thus, to achieve a larger coverage
of all kinds of lipids, lipidomics studies are suggested in the future work to detect
concrete changes in certain lipids.
For the part concerning the septic shock, to better understand the exact mechanism
from the septic shock to death in the non-survivors, the isotropic tracing technique is
preferred to find out the origin of the variations in the discriminatory metabolites.
Further, exhibited deregulation of urea cycle in the septic non-survivors implied severe
kidney injury in these patients. A further metabolomic study using urine samples may
be more direct and provide more information of alterations in kidney injury-related
pathways.
For the study on HCC, as limited by the cohort, we principally worked on the
recurrence in the patients with hepatitis C, but not in those with hepatitis B. It has
been reported recently that the hepatitis B has become the main cause of HCC
incidence, a following work may concentrate on determining the biomarkers
predicting the recurrence in the HCC patients with hepatitis B.
137
Actually, the parts of the study are shared by our French and Chinese laboratory, but
all the serum samples were taken in France. A validation of our results in the Chinese
relevant patients in the future may make the results generally significant.
Finally, revealed metabolic variations in the non-survived patients of septic shock or in
the HCC-HCV recurrent patients may indicate related alterations in the genome and
proteome. Thus, studies applying other omics may provide a further understanding of
the deregulation of relevant metabolic pathways and help to better understand the
mechanisms for the patients with different outcomes.
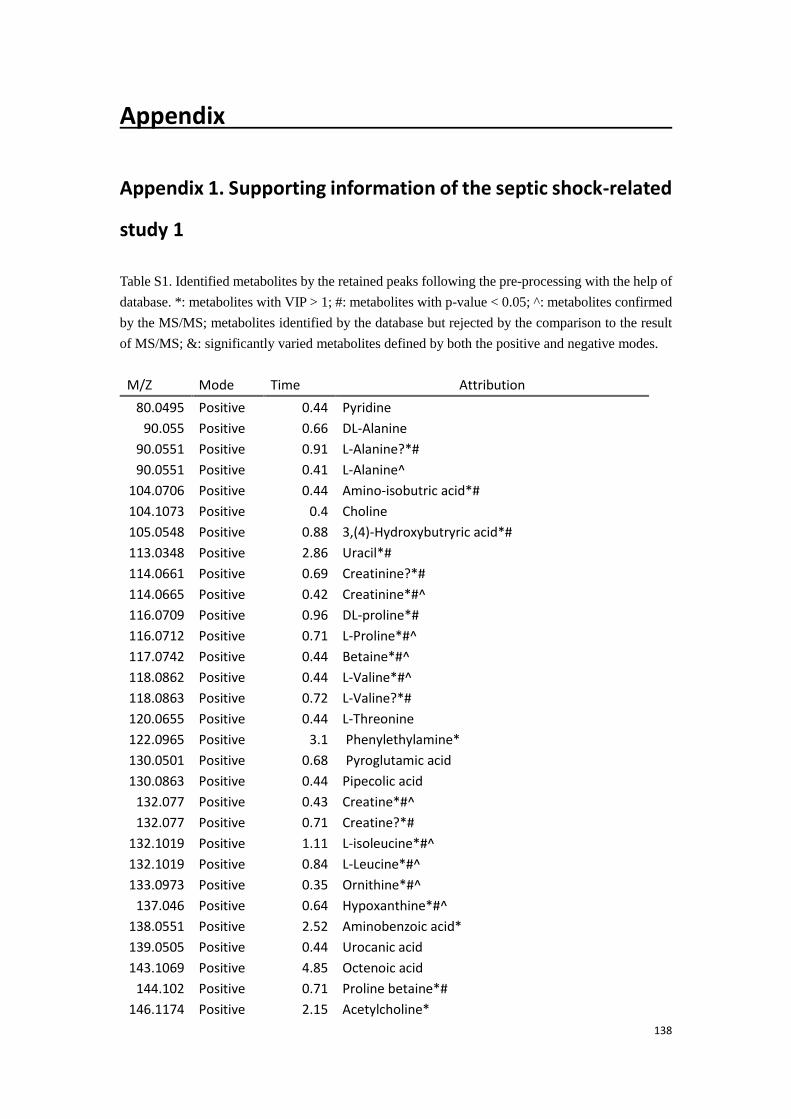
138
Appendix
Appendix 1. Supporting information of the septic shock-related
study 1
Table S1. Identified metabolites by the retained peaks following the pre-processing with the help of
database. *: metabolites with VIP > 1; #: metabolites with p-value < 0.05; ^: metabolites confirmed
by the MS/MS; metabolites identified by the database but rejected by the comparison to the result
of MS/MS; &: significantly varied metabolites defined by both the positive and negative modes.
M/Z Mode Time Attribution
80.0495 Positive 0.44 Pyridine
90.055 Positive 0.66 DL-Alanine
90.0551 Positive 0.91 L-Alanine?*#
90.0551 Positive 0.41 L-Alanine^
104.0706 Positive 0.44 Amino-isobutric acid*#
104.1073 Positive 0.4 Choline
105.0548 Positive 0.88 3,(4)-Hydroxybutryric acid*#
113.0348 Positive 2.86 Uracil*#
114.0661 Positive 0.69 Creatinine?*#
114.0665 Positive 0.42 Creatinine*#^
116.0709 Positive 0.96 DL-proline*#
116.0712 Positive 0.71 L-Proline*#^
117.0742 Positive 0.44 Betaine*#^
118.0862 Positive 0.44 L-Valine*#^
118.0863 Positive 0.72 L-Valine?*#
120.0655 Positive 0.44 L-Threonine
122.0965 Positive 3.1 Phenylethylamine*
130.0501 Positive 0.68 Pyroglutamic acid
130.0863 Positive 0.44 Pipecolic acid
132.077 Positive 0.43 Creatine*#^
132.077 Positive 0.71 Creatine?*#
132.1019 Positive 1.11 L-isoleucine*#^
132.1019 Positive 0.84 L-Leucine*#^
133.0973 Positive 0.35 Ornithine*#^
137.046 Positive 0.64 Hypoxanthine*#^
138.0551 Positive 2.52 Aminobenzoic acid*
139.0505 Positive 0.44 Urocanic acid
143.1069 Positive 4.85 Octenoic acid
144.102 Positive 0.71 Proline betaine*#
146.1174 Positive 2.15 Acetylcholine*
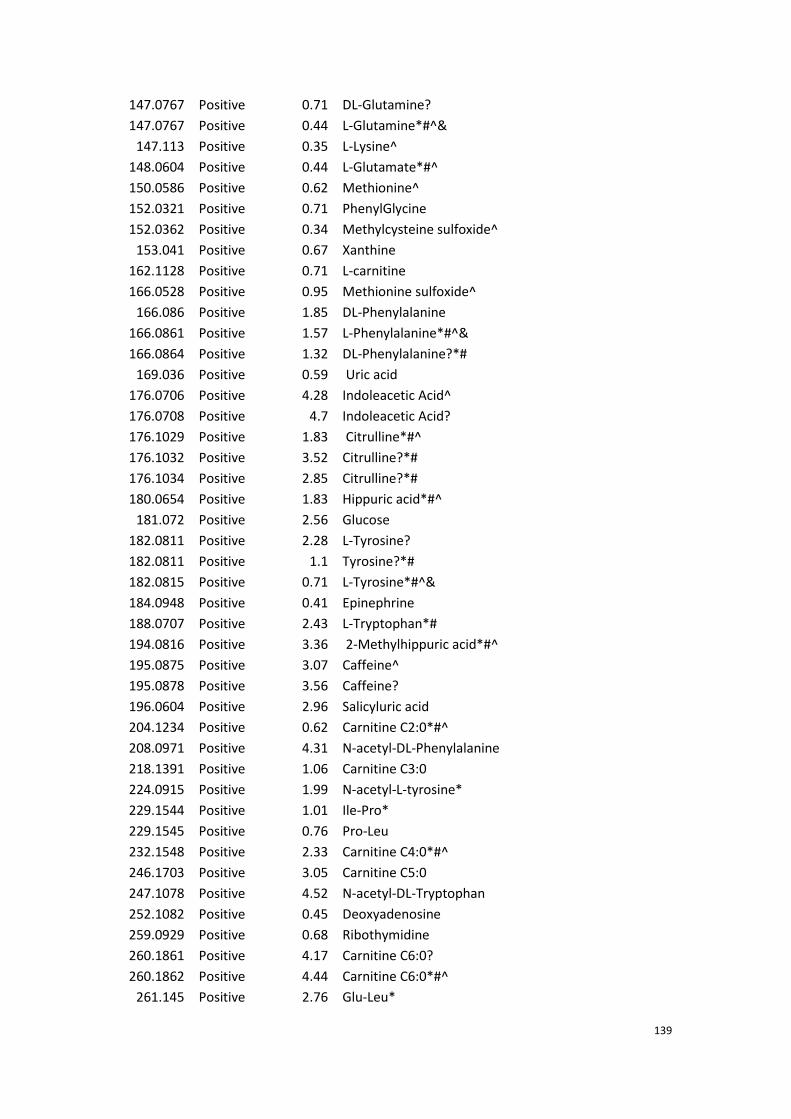
139
147.0767 Positive 0.71 DL-Glutamine?
147.0767 Positive 0.44 L-Glutamine*#^&
147.113 Positive 0.35 L-Lysine^
148.0604 Positive 0.44 L-Glutamate*#^
150.0586 Positive 0.62 Methionine^
152.0321 Positive 0.71 PhenylGlycine
152.0362 Positive 0.34 Methylcysteine sulfoxide^
153.041 Positive 0.67 Xanthine
162.1128 Positive 0.71 L-carnitine
166.0528 Positive 0.95 Methionine sulfoxide^
166.086 Positive 1.85 DL-Phenylalanine
166.0861 Positive 1.57 L-Phenylalanine*#^&
166.0864 Positive 1.32 DL-Phenylalanine?*#
169.036 Positive 0.59 Uric acid
176.0706 Positive 4.28 Indoleacetic Acid^
176.0708 Positive 4.7 Indoleacetic Acid?
176.1029 Positive 1.83 Citrulline*#^
176.1032 Positive 3.52 Citrulline?*#
176.1034 Positive 2.85 Citrulline?*#
180.0654 Positive 1.83 Hippuric acid*#^
181.072 Positive 2.56 Glucose
182.0811 Positive 2.28 L-Tyrosine?
182.0811 Positive 1.1 Tyrosine?*#
182.0815 Positive 0.71 L-Tyrosine*#^&
184.0948 Positive 0.41 Epinephrine
188.0707 Positive 2.43 L-Tryptophan*#
194.0816 Positive 3.36 2-Methylhippuric acid*#^
195.0875 Positive 3.07 Caffeine^
195.0878 Positive 3.56 Caffeine?
196.0604 Positive 2.96 Salicyluric acid
204.1234 Positive 0.62 Carnitine C2:0*#^
208.0971 Positive 4.31 N-acetyl-DL-Phenylalanine
218.1391 Positive 1.06 Carnitine C3:0
224.0915 Positive 1.99 N-acetyl-L-tyrosine*
229.1544 Positive 1.01 Ile-Pro*
229.1545 Positive 0.76 Pro-Leu
232.1548 Positive 2.33 Carnitine C4:0*#^
246.1703 Positive 3.05 Carnitine C5:0
247.1078 Positive 4.52 N-acetyl-DL-Tryptophan
252.1082 Positive 0.45 Deoxyadenosine
259.0929 Positive 0.68 Ribothymidine
260.1861 Positive 4.17 Carnitine C6:0?
260.1862 Positive 4.44 Carnitine C6:0*#^
261.145 Positive 2.76 Glu-Leu*
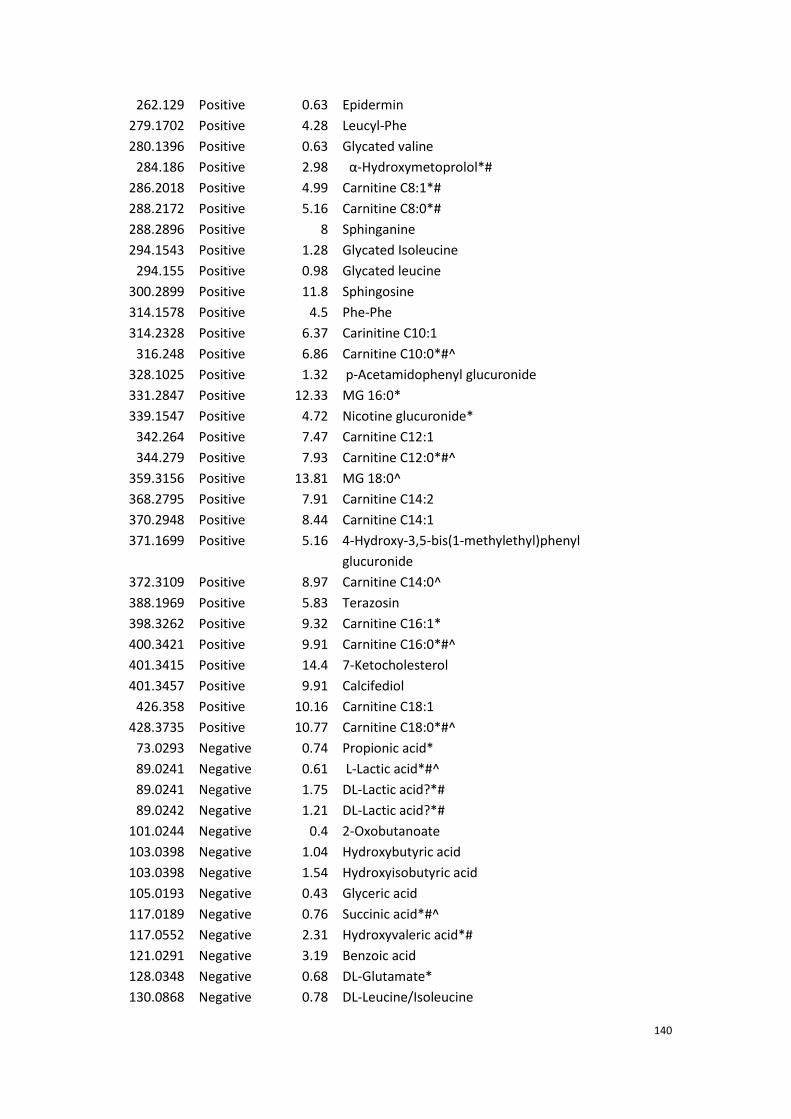
140
262.129 Positive 0.63 Epidermin
279.1702 Positive 4.28 Leucyl-Phe
280.1396 Positive 0.63 Glycated valine
284.186 Positive 2.98 α-Hydroxymetoprolol*#
286.2018 Positive 4.99 Carnitine C8:1*#
288.2172 Positive 5.16 Carnitine C8:0*#
288.2896 Positive 8 Sphinganine
294.1543 Positive 1.28 Glycated Isoleucine
294.155 Positive 0.98 Glycated leucine
300.2899 Positive 11.8 Sphingosine
314.1578 Positive 4.5 Phe-Phe
314.2328 Positive 6.37 Carinitine C10:1
316.248 Positive 6.86 Carnitine C10:0*#^
328.1025 Positive 1.32 p-Acetamidophenyl glucuronide
331.2847 Positive 12.33 MG 16:0*
339.1547 Positive 4.72 Nicotine glucuronide*
342.264 Positive 7.47 Carnitine C12:1
344.279 Positive 7.93 Carnitine C12:0*#^
359.3156 Positive 13.81 MG 18:0^
368.2795 Positive 7.91 Carnitine C14:2
370.2948 Positive 8.44 Carnitine C14:1
371.1699 Positive 5.16 4-Hydroxy-3,5-bis(1-methylethyl)phenyl
glucuronide
372.3109 Positive 8.97 Carnitine C14:0^
388.1969 Positive 5.83 Terazosin
398.3262 Positive 9.32 Carnitine C16:1*
400.3421 Positive 9.91 Carnitine C16:0*#^
401.3415 Positive 14.4 7-Ketocholesterol
401.3457 Positive 9.91 Calcifediol
426.358 Positive 10.16 Carnitine C18:1
428.3735 Positive 10.77 Carnitine C18:0*#^
73.0293 Negative 0.74 Propionic acid*
89.0241 Negative 0.61 L-Lactic acid*#^
89.0241 Negative 1.75 DL-Lactic acid?*#
89.0242 Negative 1.21 DL-Lactic acid?*#
101.0244 Negative 0.4 2-Oxobutanoate
103.0398 Negative 1.04 Hydroxybutyric acid
103.0398 Negative 1.54 Hydroxyisobutyric acid
105.0193 Negative 0.43 Glyceric acid
117.0189 Negative 0.76 Succinic acid*#^
117.0552 Negative 2.31 Hydroxyvaleric acid*#
121.0291 Negative 3.19 Benzoic acid
128.0348 Negative 0.68 DL-Glutamate*
130.0868 Negative 0.78 DL-Leucine/Isoleucine
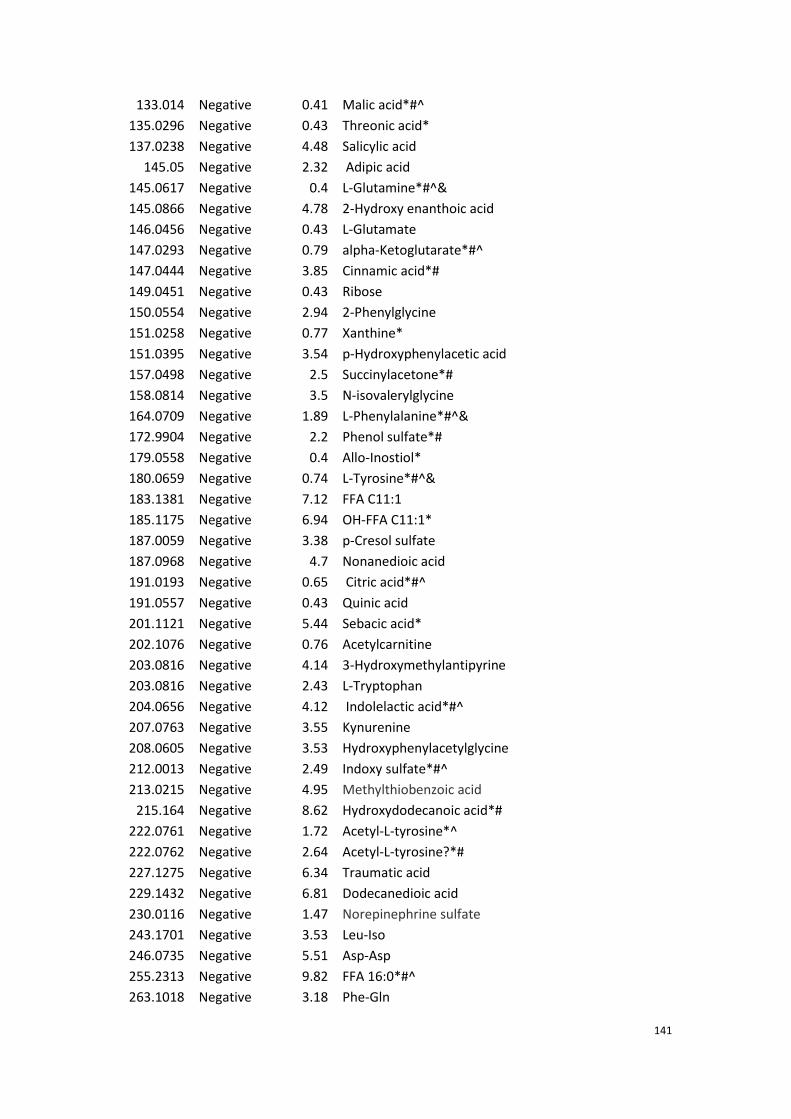
141
133.014 Negative 0.41 Malic acid*#^
135.0296 Negative 0.43 Threonic acid*
137.0238 Negative 4.48 Salicylic acid
145.05 Negative 2.32 Adipic acid
145.0617 Negative 0.4 L-Glutamine*#^&
145.0866 Negative 4.78 2-Hydroxy enanthoic acid
146.0456 Negative 0.43 L-Glutamate
147.0293 Negative 0.79 alpha-Ketoglutarate*#^
147.0444 Negative 3.85 Cinnamic acid*#
149.0451 Negative 0.43 Ribose
150.0554 Negative 2.94 2-Phenylglycine
151.0258 Negative 0.77 Xanthine*
151.0395 Negative 3.54 p-Hydroxyphenylacetic acid
157.0498 Negative 2.5 Succinylacetone*#
158.0814 Negative 3.5 N-isovalerylglycine
164.0709 Negative 1.89 L-Phenylalanine*#^&
172.9904 Negative 2.2 Phenol sulfate*#
179.0558 Negative 0.4 Allo-Inostiol*
180.0659 Negative 0.74 L-Tyrosine*#^&
183.1381 Negative 7.12 FFA C11:1
185.1175 Negative 6.94 OH-FFA C11:1*
187.0059 Negative 3.38 p-Cresol sulfate
187.0968 Negative 4.7 Nonanedioic acid
191.0193 Negative 0.65 Citric acid*#^
191.0557 Negative 0.43 Quinic acid
201.1121 Negative 5.44 Sebacic acid*
202.1076 Negative 0.76 Acetylcarnitine
203.0816 Negative 4.14 3-Hydroxymethylantipyrine
203.0816 Negative 2.43 L-Tryptophan
204.0656 Negative 4.12 Indolelactic acid*#^
207.0763 Negative 3.55 Kynurenine
208.0605 Negative 3.53 Hydroxyphenylacetylglycine
212.0013 Negative 2.49 Indoxy sulfate*#^
213.0215 Negative 4.95 Methylthiobenzoic acid
215.164 Negative 8.62 Hydroxydodecanoic acid*#
222.0761 Negative 1.72 Acetyl-L-tyrosine*^
222.0762 Negative 2.64 Acetyl-L-tyrosine?*#
227.1275 Negative 6.34 Traumatic acid
229.1432 Negative 6.81 Dodecanedioic acid
230.0116 Negative 1.47 Norepinephrine sulfate
243.1701 Negative 3.53 Leu-Iso
246.0735 Negative 5.51 Asp-Asp
255.2313 Negative 9.82 FFA 16:0*#^
263.1018 Negative 3.18 Phe-Gln
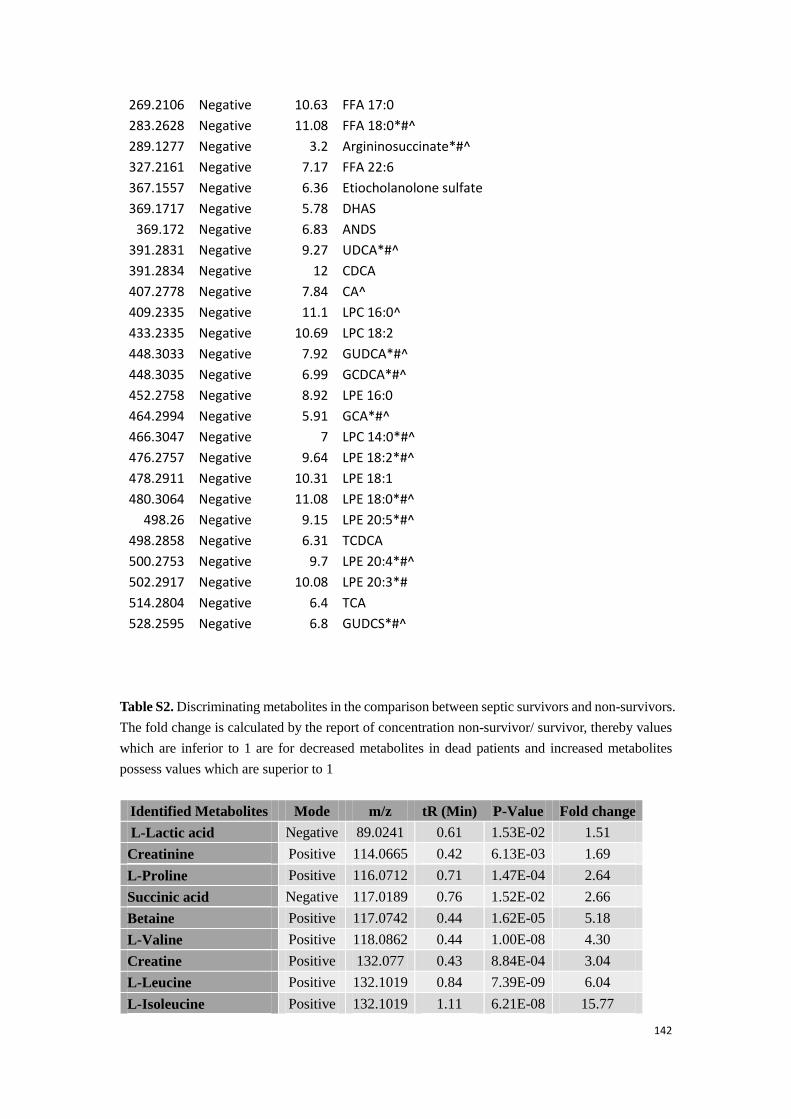
142
269.2106 Negative 10.63 FFA 17:0
283.2628 Negative 11.08 FFA 18:0*#^
289.1277 Negative 3.2 Argininosuccinate*#^
327.2161 Negative 7.17 FFA 22:6
367.1557 Negative 6.36 Etiocholanolone sulfate
369.1717 Negative 5.78 DHAS
369.172 Negative 6.83 ANDS
391.2831 Negative 9.27 UDCA*#^
391.2834 Negative 12 CDCA
407.2778 Negative 7.84 CA^
409.2335 Negative 11.1 LPC 16:0^
433.2335 Negative 10.69 LPC 18:2
448.3033 Negative 7.92 GUDCA*#^
448.3035 Negative 6.99 GCDCA*#^
452.2758 Negative 8.92 LPE 16:0
464.2994 Negative 5.91 GCA*#^
466.3047 Negative 7 LPC 14:0*#^
476.2757 Negative 9.64 LPE 18:2*#^
478.2911 Negative 10.31 LPE 18:1
480.3064 Negative 11.08 LPE 18:0*#^
498.26 Negative 9.15 LPE 20:5*#^
498.2858 Negative 6.31 TCDCA
500.2753 Negative 9.7 LPE 20:4*#^
502.2917 Negative 10.08 LPE 20:3*#
514.2804 Negative 6.4 TCA
528.2595 Negative 6.8 GUDCS*#^
Table S2. Discriminating metabolites in the comparison between septic survivors and non-survivors.
The fold change is calculated by the report of concentration non-survivor/ survivor, thereby values
which are inferior to 1 are for decreased metabolites in dead patients and increased metabolites
possess values which are superior to 1
Identified Metabolites Mode m/z tR (Min) P-Value Fold change
L-Lactic acid Negative 89.0241 0.61 1.53E-02 1.51
Creatinine Positive 114.0665 0.42 6.13E-03 1.69
L-Proline Positive 116.0712 0.71 1.47E-04 2.64
Succinic acid Negative 117.0189 0.76 1.52E-02 2.66
Betaine Positive 117.0742 0.44 1.62E-05 5.18
L-Valine Positive 118.0862 0.44 1.00E-08 4.30
Creatine Positive 132.077 0.43 8.84E-04 3.04
L-Leucine Positive 132.1019 0.84 7.39E-09 6.04
L-Isoleucine Positive 132.1019 1.11 6.21E-08 15.77
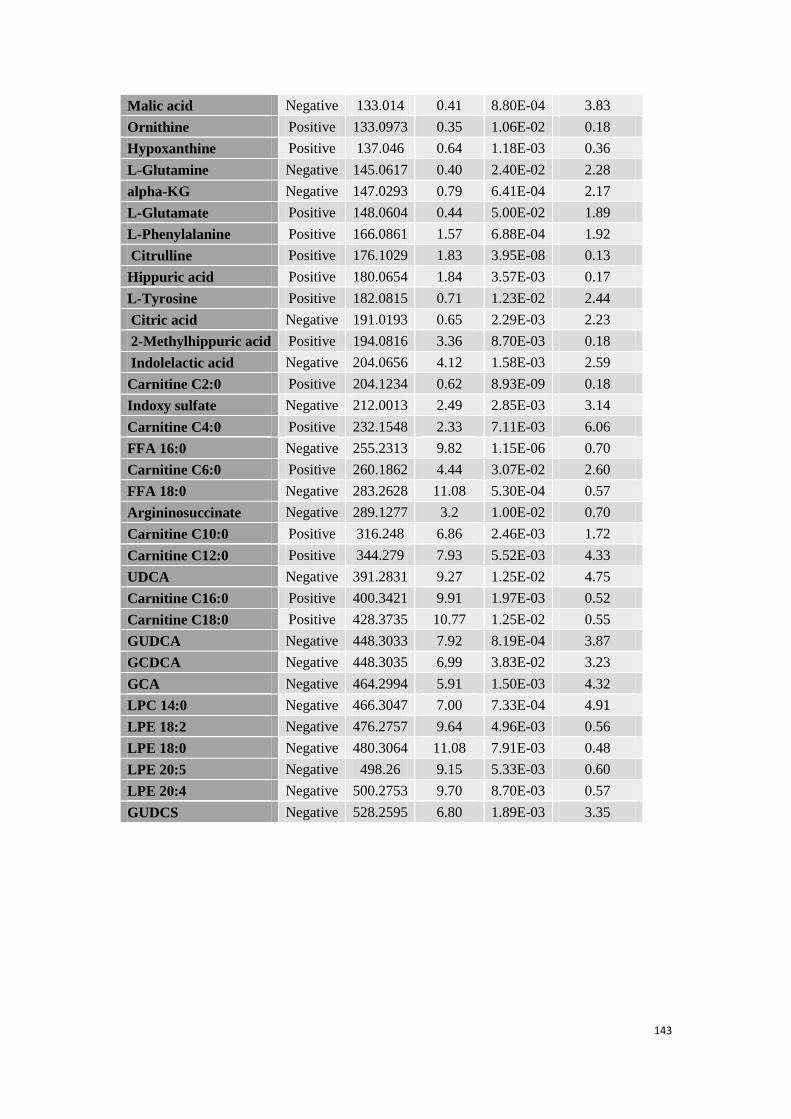
143
Malic acid Negative 133.014 0.41 8.80E-04 3.83
Ornithine Positive 133.0973 0.35 1.06E-02 0.18
Hypoxanthine Positive 137.046 0.64 1.18E-03 0.36
L-Glutamine Negative 145.0617 0.40 2.40E-02 2.28
alpha-KG Negative 147.0293 0.79 6.41E-04 2.17
L-Glutamate Positive 148.0604 0.44 5.00E-02 1.89
L-Phenylalanine Positive 166.0861 1.57 6.88E-04 1.92
Citrulline Positive 176.1029 1.83 3.95E-08 0.13
Hippuric acid Positive 180.0654 1.84 3.57E-03 0.17
L-Tyrosine Positive 182.0815 0.71 1.23E-02 2.44
Citric acid Negative 191.0193 0.65 2.29E-03 2.23
2-Methylhippuric acid Positive 194.0816 3.36 8.70E-03 0.18
Indolelactic acid Negative 204.0656 4.12 1.58E-03 2.59
Carnitine C2:0 Positive 204.1234 0.62 8.93E-09 0.18
Indoxy sulfate Negative 212.0013 2.49 2.85E-03 3.14
Carnitine C4:0 Positive 232.1548 2.33 7.11E-03 6.06
FFA 16:0 Negative 255.2313 9.82 1.15E-06 0.70
Carnitine C6:0 Positive 260.1862 4.44 3.07E-02 2.60
FFA 18:0 Negative 283.2628 11.08 5.30E-04 0.57
Argininosuccinate Negative 289.1277 3.2 1.00E-02 0.70
Carnitine C10:0 Positive 316.248 6.86 2.46E-03 1.72
Carnitine C12:0 Positive 344.279 7.93 5.52E-03 4.33
UDCA Negative 391.2831 9.27 1.25E-02 4.75
Carnitine C16:0 Positive 400.3421 9.91 1.97E-03 0.52
Carnitine C18:0 Positive 428.3735 10.77 1.25E-02 0.55
GUDCA Negative 448.3033 7.92 8.19E-04 3.87
GCDCA Negative 448.3035 6.99 3.83E-02 3.23
GCA Negative 464.2994 5.91 1.50E-03 4.32
LPC 14:0 Negative 466.3047 7.00 7.33E-04 4.91
LPE 18:2 Negative 476.2757 9.64 4.96E-03 0.56
LPE 18:0 Negative 480.3064 11.08 7.91E-03 0.48
LPE 20:5 Negative 498.26 9.15 5.33E-03 0.60
LPE 20:4 Negative 500.2753 9.70 8.70E-03 0.57
GUDCS Negative 528.2595 6.80 1.89E-03 3.35
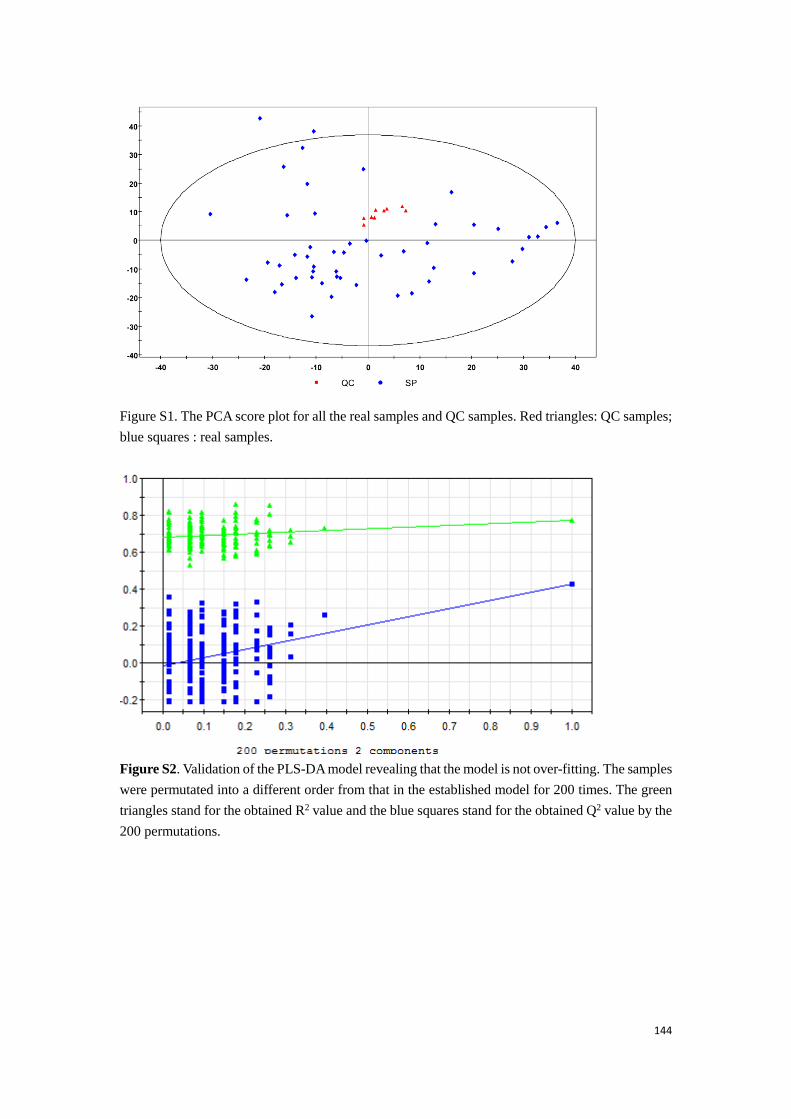
144
Figure S1. The PCA score plot for all the real samples and QC samples. Red triangles: QC samples;
blue squares : real samples.
Figure S2. Validation of the PLS-DA model revealing that the model is not over-fitting. The samples
were permutated into a different order from that in the established model for 200 times. The green
triangles stand for the obtained R2 value and the blue squares stand for the obtained Q2 value by the
200 permutations.
145
Appendix 2: Supporting information of the HCC-related study.
S1. Chemical reference substance used in the study.
2-Hydroxybutyrate, 3-Hydroxybutyrate, 3-aminoisobutyrate, 7-hydroxycholesterol,
benzoate, citrate, isocitrate, gluconate, glyceraldehyde, glycerate, glycerol, glycolate,
hydroxyisovalerate, hydroxylamine, isosuccinate, lactate, threonate, oxalate, urate,
xanthine, citrulline, L- asparagine, L-aspartate, L-cysteine, L-glutamine, L-glutamate,
L-isoleucine, L-leucine, L-proline, L-threonine, L-serine, L-tryptophan and N-acetyl-
L-lysine were purchased from Sigma-Aldrich China Inc. (Shanghai, China); D-arabitol,
D-ribitol, butanoic acid (FFA 4:0), hexanoic acid (FFA 6:0), decanoic acid (FFA 10:0),
dodecanoic acid (FFA 12:0), pentadecanoic acid (FFA 15:0), palmitic acid (FFA 16:0),
octadecanoic acid (FFA 18:0), 11-Eicosenoic acid (FFA 20:1), Arachidonic acid (FFA
20:4) and Docosahexaenoic acid (FFA 22:6) were offered by the J&K Scientific Ltd.
(Beijing, China).
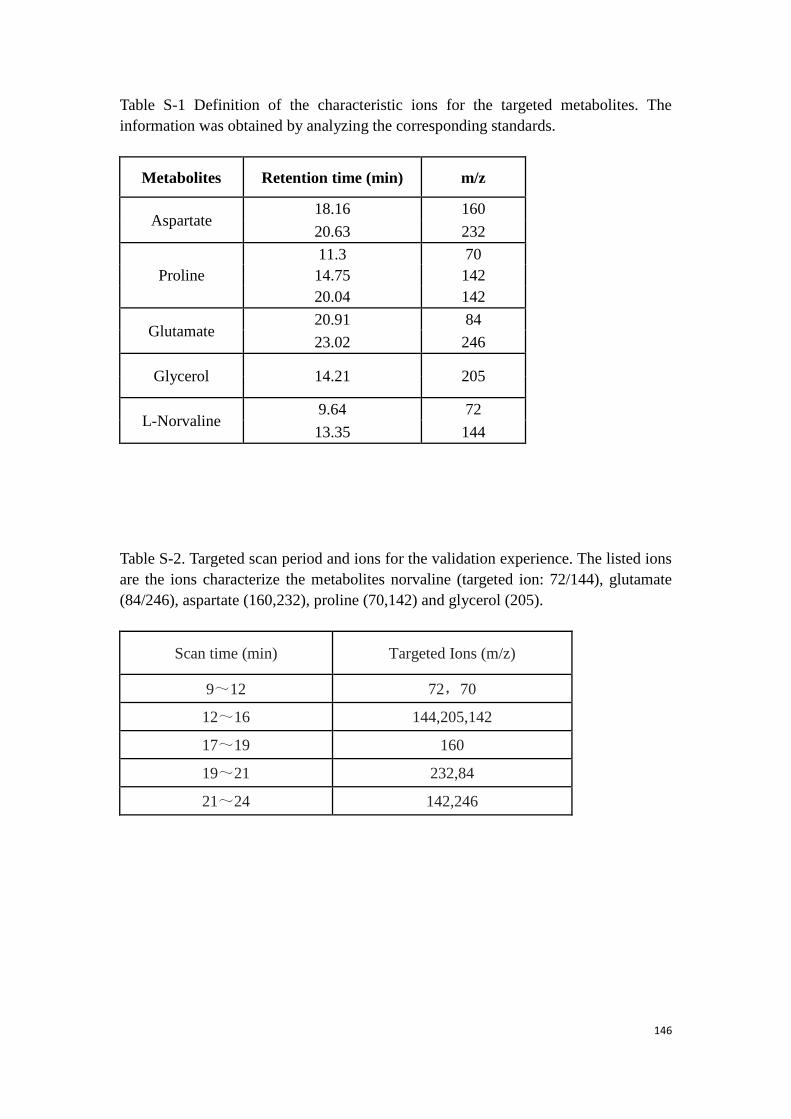
146
Table S-1 Definition of the characteristic ions for the targeted metabolites. The
information was obtained by analyzing the corresponding standards.
Metabolites Retention time (min) m/z
Aspartate 18.16 160
20.63 232
11.3 70
Proline 14.75 142
20.04 142
Glutamate 20.91 84
23.02 246
Glycerol 14.21 205
L-Norvaline 9.64 72
13.35 144
Table S-2. Targeted scan period and ions for the validation experience. The listed ions
are the ions characterize the metabolites norvaline (targeted ion: 72/144), glutamate
(84/246), aspartate (160,232), proline (70,142) and glycerol (205).
Scan time (min) Targeted Ions (m/z)
9~12 72,70
12~16 144,205,142
17~19 160
19~21 232,84
21~24 142,246
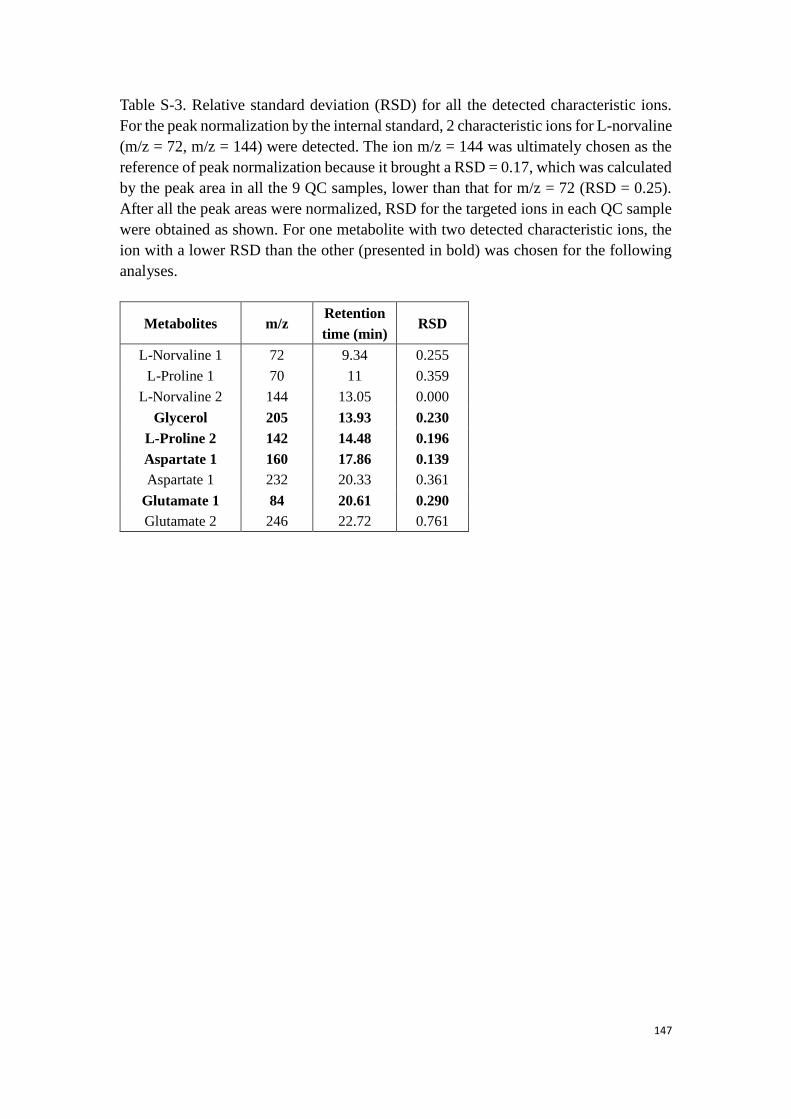
147
Table S-3. Relative standard deviation (RSD) for all the detected characteristic ions.
For the peak normalization by the internal standard, 2 characteristic ions for L-norvaline
(m/z = 72, m/z = 144) were detected. The ion m/z = 144 was ultimately chosen as the
reference of peak normalization because it brought a RSD = 0.17, which was calculated
by the peak area in all the 9 QC samples, lower than that for m/z = 72 (RSD = 0.25).
After all the peak areas were normalized, RSD for the targeted ions in each QC sample
were obtained as shown. For one metabolite with two detected characteristic ions, the
ion with a lower RSD than the other (presented in bold) was chosen for the following
analyses.
Metabolites m/z Retention
time (min) RSD
L-Norvaline 1 72 9.34 0.255
L-Proline 1 70 11 0.359
L-Norvaline 2 144 13.05 0.000
Glycerol 205 13.93 0.230
L-Proline 2 142 14.48 0.196
Aspartate 1 160 17.86 0.139
Aspartate 1 232 20.33 0.361
Glutamate 1 84 20.61 0.290
Glutamate 2 246 22.72 0.761
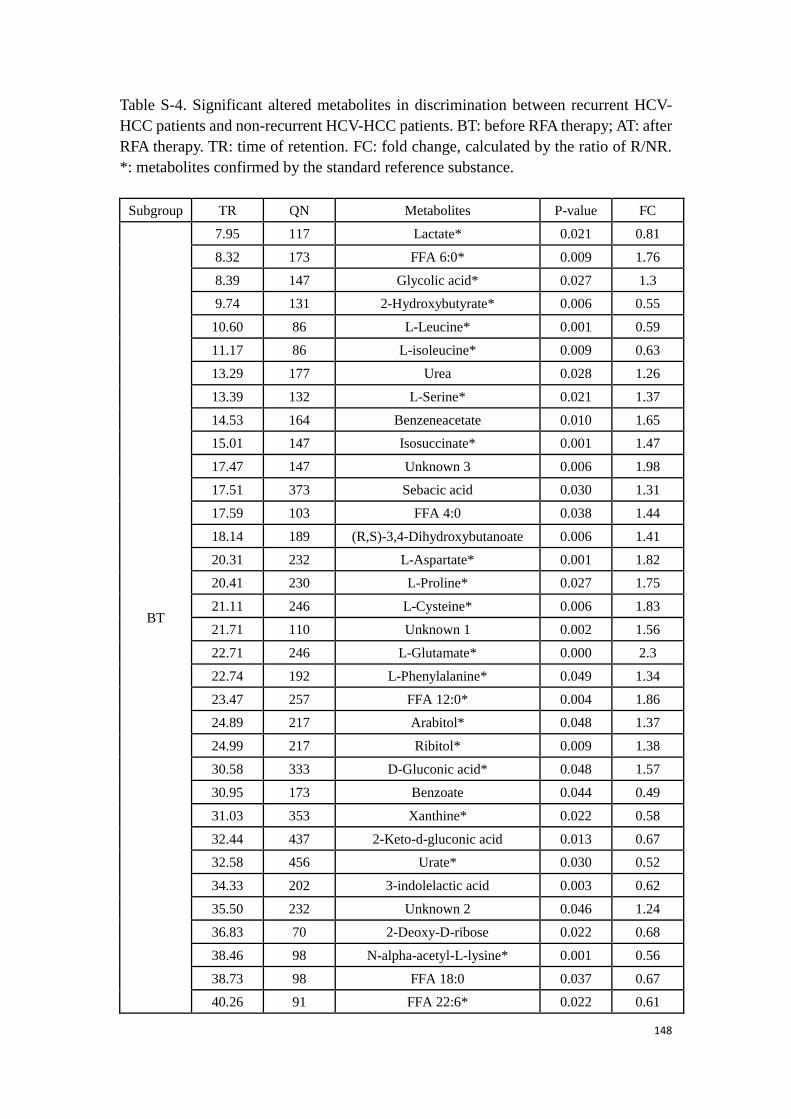
148
Table S-4. Significant altered metabolites in discrimination between recurrent HCV-
HCC patients and non-recurrent HCV-HCC patients. BT: before RFA therapy; AT: after
RFA therapy. TR: time of retention. FC: fold change, calculated by the ratio of R/NR.
*: metabolites confirmed by the standard reference substance.
Subgroup TR QN Metabolites P-value FC
BT
7.95 117 Lactate* 0.021 0.81
8.32 173 FFA 6:0* 0.009 1.76
8.39 147 Glycolic acid* 0.027 1.3
9.74 131 2-Hydroxybutyrate* 0.006 0.55
10.60 86 L-Leucine* 0.001 0.59
11.17 86 L-isoleucine* 0.009 0.63
13.29 177 Urea 0.028 1.26
13.39 132 L-Serine* 0.021 1.37
14.53 164 Benzeneacetate 0.010 1.65
15.01 147 Isosuccinate* 0.001 1.47
17.47 147 Unknown 3 0.006 1.98
17.51 373 Sebacic acid 0.030 1.31
17.59 103 FFA 4:0 0.038 1.44
18.14 189 (R,S)-3,4-Dihydroxybutanoate 0.006 1.41
20.31 232 L-Aspartate* 0.001 1.82
20.41 230 L-Proline* 0.027 1.75
21.11 246 L-Cysteine* 0.006 1.83
21.71 110 Unknown 1 0.002 1.56
22.71 246 L-Glutamate* 0.000 2.3
22.74 192 L-Phenylalanine* 0.049 1.34
23.47 257 FFA 12:0* 0.004 1.86
24.89 217 Arabitol* 0.048 1.37
24.99 217 Ribitol* 0.009 1.38
30.58 333 D-Gluconic acid* 0.048 1.57
30.95 173 Benzoate 0.044 0.49
31.03 353 Xanthine* 0.022 0.58
32.44 437 2-Keto-d-gluconic acid 0.013 0.67
32.58 456 Urate* 0.030 0.52
34.33 202 3-indolelactic acid 0.003 0.62
35.50 232 Unknown 2 0.046 1.24
36.83 70 2-Deoxy-D-ribose 0.022 0.68
38.46 98 N-alpha-acetyl-L-lysine* 0.001 0.56
38.73 98 FFA 18:0 0.037 0.67
40.26 91 FFA 22:6* 0.022 0.61
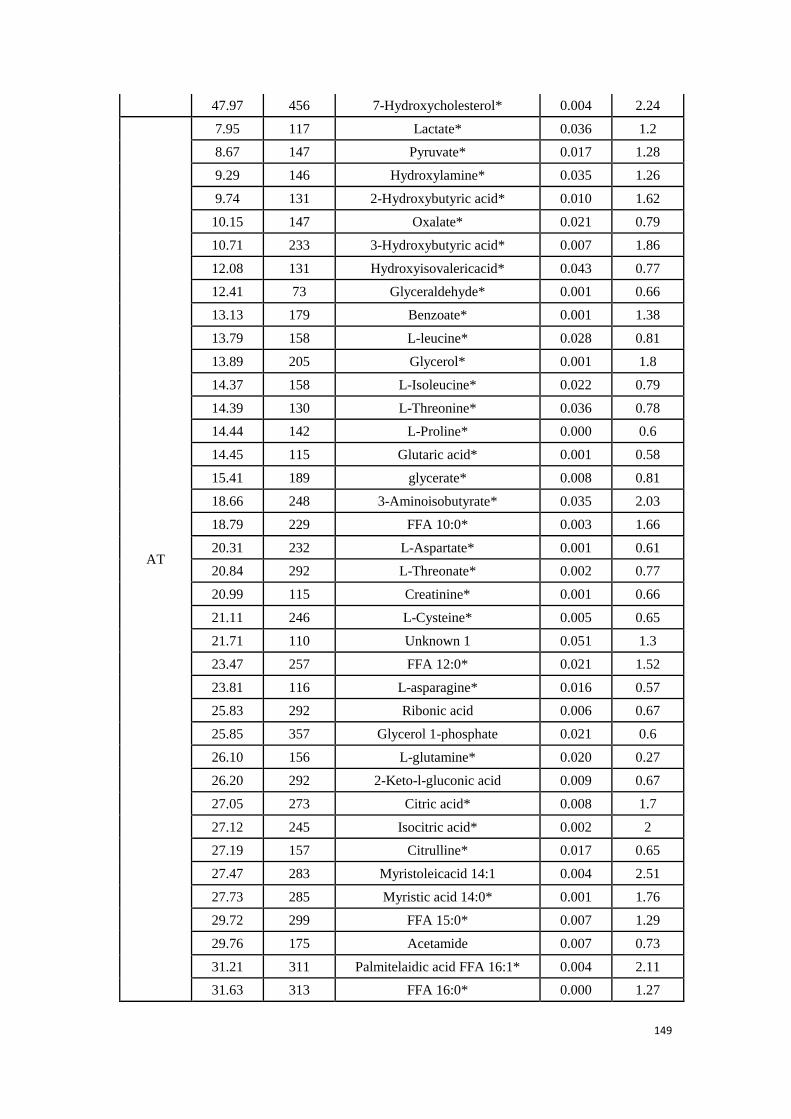
149
47.97 456 7-Hydroxycholesterol* 0.004 2.24
AT
7.95 117 Lactate* 0.036 1.2
8.67 147 Pyruvate* 0.017 1.28
9.29 146 Hydroxylamine* 0.035 1.26
9.74 131 2-Hydroxybutyric acid* 0.010 1.62
10.15 147 Oxalate* 0.021 0.79
10.71 233 3-Hydroxybutyric acid* 0.007 1.86
12.08 131 Hydroxyisovalericacid* 0.043 0.77
12.41 73 Glyceraldehyde* 0.001 0.66
13.13 179 Benzoate* 0.001 1.38
13.79 158 L-leucine* 0.028 0.81
13.89 205 Glycerol* 0.001 1.8
14.37 158 L-Isoleucine* 0.022 0.79
14.39 130 L-Threonine* 0.036 0.78
14.44 142 L-Proline* 0.000 0.6
14.45 115 Glutaric acid* 0.001 0.58
15.41 189 glycerate* 0.008 0.81
18.66 248 3-Aminoisobutyrate* 0.035 2.03
18.79 229 FFA 10:0* 0.003 1.66
20.31 232 L-Aspartate* 0.001 0.61
20.84 292 L-Threonate* 0.002 0.77
20.99 115 Creatinine* 0.001 0.66
21.11 246 L-Cysteine* 0.005 0.65
21.71 110 Unknown 1 0.051 1.3
23.47 257 FFA 12:0* 0.021 1.52
23.81 116 L-asparagine* 0.016 0.57
25.83 292 Ribonic acid 0.006 0.67
25.85 357 Glycerol 1-phosphate 0.021 0.6
26.10 156 L-glutamine* 0.020 0.27
26.20 292 2-Keto-l-gluconic acid 0.009 0.67
27.05 273 Citric acid* 0.008 1.7
27.12 245 Isocitric acid* 0.002 2
27.19 157 Citrulline* 0.017 0.65
27.47 283 Myristoleicacid 14:1 0.004 2.51
27.73 285 Myristic acid 14:0* 0.001 1.76
29.72 299 FFA 15:0* 0.007 1.29
29.76 175 Acetamide 0.007 0.73
31.21 311 Palmitelaidic acid FFA 16:1* 0.004 2.11
31.63 313 FFA 16:0* 0.000 1.27
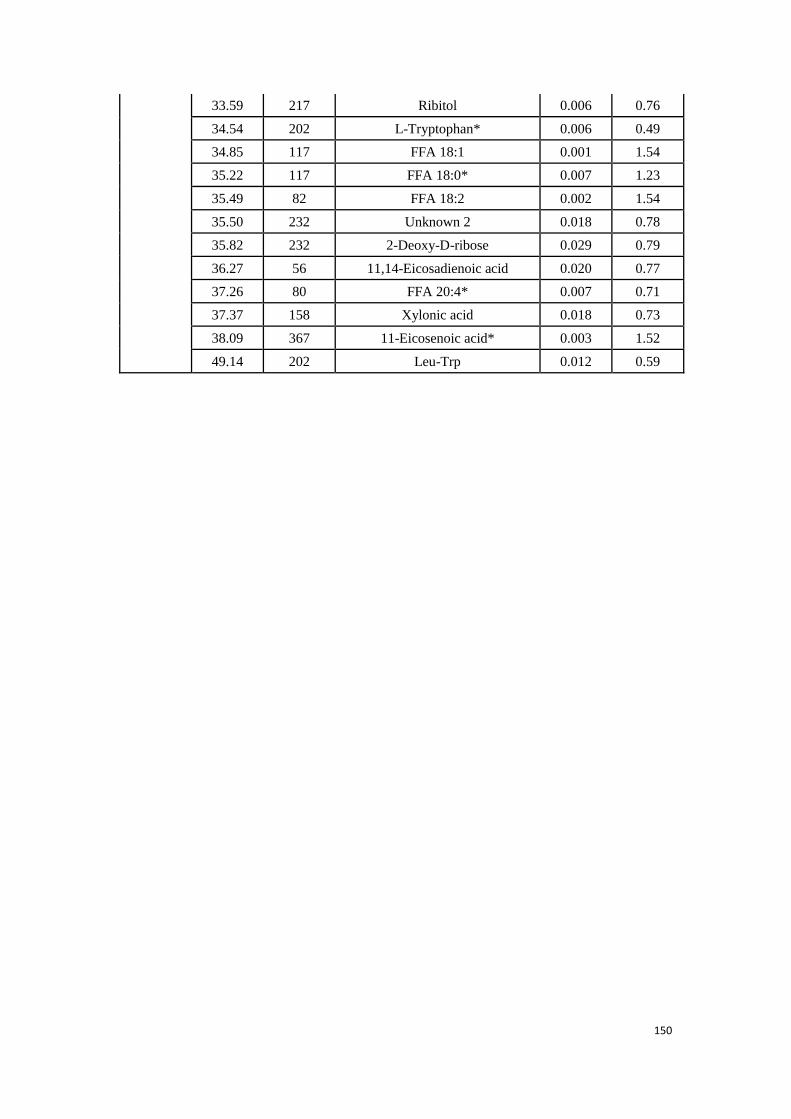
150
33.59 217 Ribitol 0.006 0.76
34.54 202 L-Tryptophan* 0.006 0.49
34.85 117 FFA 18:1 0.001 1.54
35.22 117 FFA 18:0* 0.007 1.23
35.49 82 FFA 18:2 0.002 1.54
35.50 232 Unknown 2 0.018 0.78
35.82 232 2-Deoxy-D-ribose 0.029 0.79
36.27 56 11,14-Eicosadienoic acid 0.020 0.77
37.26 80 FFA 20:4* 0.007 0.71
37.37 158 Xylonic acid 0.018 0.73
38.09 367 11-Eicosenoic acid* 0.003 1.52
49.14 202 Leu-Trp 0.012 0.59
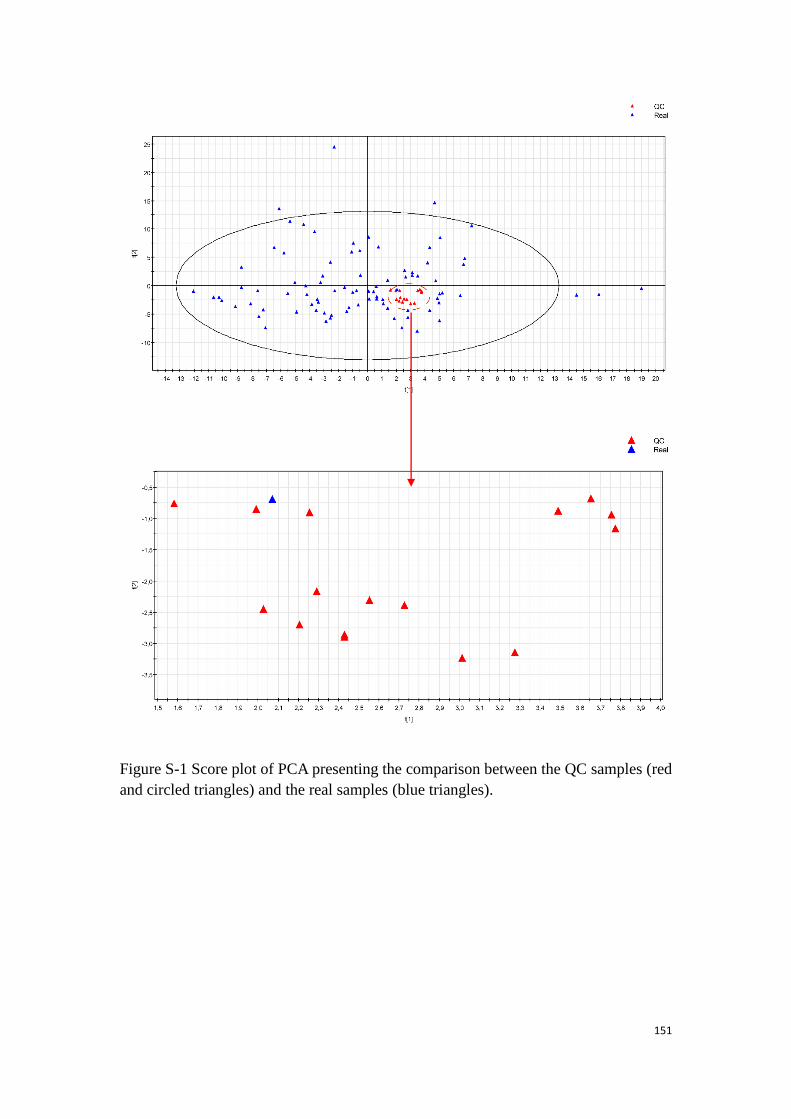
151
Figure S-1 Score plot of PCA presenting the comparison between the QC samples (red
and circled triangles) and the real samples (blue triangles).
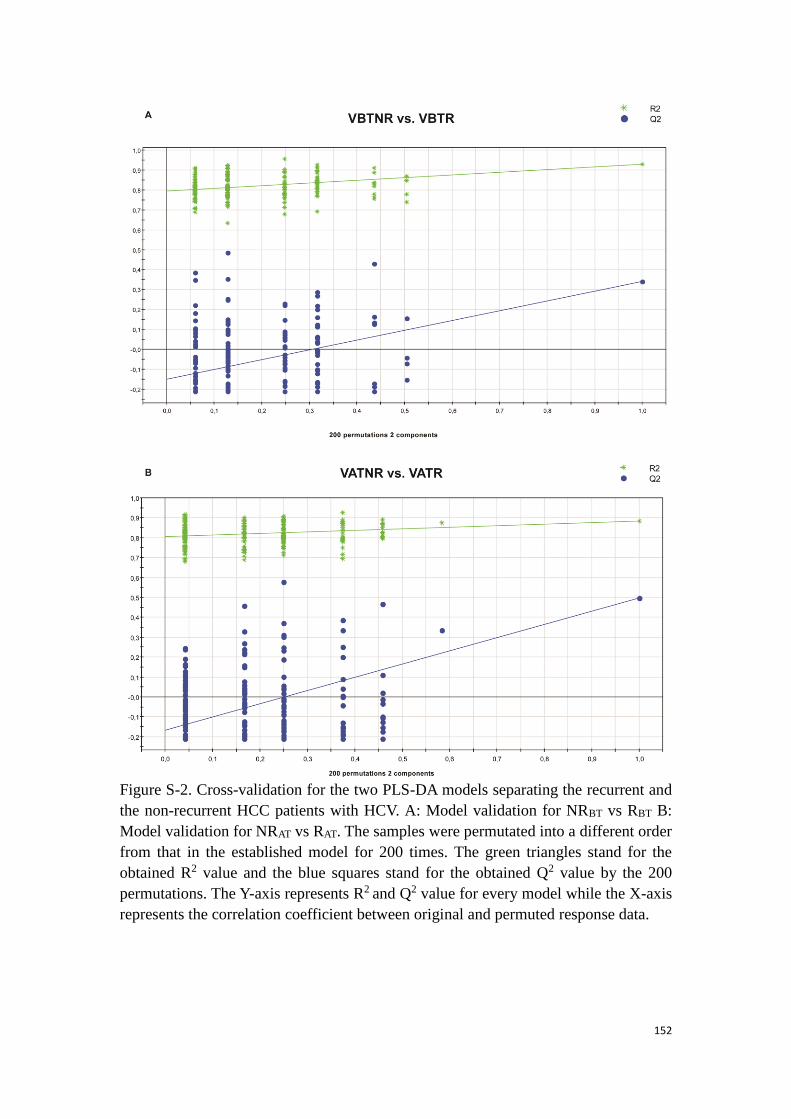
152
Figure S-2. Cross-validation for the two PLS-DA models separating the recurrent and
the non-recurrent HCC patients with HCV. A: Model validation for NRBT vs RBT B:
Model validation for NRAT vs RAT. The samples were permutated into a different order
from that in the established model for 200 times. The green triangles stand for the
obtained R2 value and the blue squares stand for the obtained Q2 value by the 200
permutations. The Y-axis represents R2 and Q2 value for every model while the X-axis
represents the correlation coefficient between original and permuted response data.
153
References
1. Nicholson JK, Lindon JC, Holmes E. 'Metabonomics': understanding the metabolic responses of living
systems to pathophysiological stimuli via multivariate statistical analysis of biological NMR
spectroscopic data. Xenobiotica. 1999;29(11):1181-9.
2. Fiehn O. Metabolomics–the link between genotypes and phenotypes. Plant Mol Biol. 2002;48(1-
2):155-71.
3. Nicholson JK, Lindon JC. Systems biology: metabonomics. Nature. 2008;455(7216):1054-6.
4. Rochfort S. Metabolomics reviewed: a new “omics” platform technology for systems biology and
implications for natural products research. J Nat Prod. 2005;68(12):1813-20.
5. Dettmer K, Aronov PA, Hammock BD. Mass spectrometry-based metabolomics. Mass Spectrom Rev.
2007;26(1):51-78.
6. Madsen R, Lundstedt T, Trygg J. Chemometrics in metabolomics—a review in human disease diagnosis.
Anal Chim Acta. 2010;659(1):23-33.
7. Mamas M, Dunn WB, Neyses L, Goodacre R. The role of metabolites and metabolomics in clinically
applicable biomarkers of disease. Arch Toxicol. 2011;85(1):5-17.
8. Gowda GN, Zhang S, Gu H, Asiago V, Shanaiah N, Raftery D. Metabolomics-based methods for early
disease diagnostics. Expert review of molecular diagnostics. 2008;8(5):617-33.
9. Gill SR, Pop M, DeBoy RT, Eckburg PB, Turnbaugh PJ, Samuel BS et al. Metagenomic analysis of the
human distal gut microbiome. Science. 2006;312(5778):1355-9.
10. Bundy JG, Davey MP, Viant MR. Environmental metabolomics: a critical review and future
perspectives. Metabolomics. 2009;5(1):3-21.
11. Sumner LW, Mendes P, Dixon RA. Plant metabolomics: large-scale phytochemistry in the functional
genomics era. Phytochemistry. 2003;62(6):817-36.
12. Shyur L-F, Yang N-S. Metabolomics for phytomedicine research and drug development. Curr Opin
Chem Biol. 2008;12(1):66-71.
13. Gibney MJ, Walsh M, Brennan L, Roche HM, German B, Van Ommen B. Metabolomics in human
nutrition: opportunities and challenges. The American journal of clinical nutrition. 2005;82(3):497-503.
14. Cevallos-Cevallos JM, Reyes-De-Corcuera JI, Etxeberria E, Danyluk MD, Rodrick GE. Metabolomic
analysis in food science: a review. Trends Food Sci Tech. 2009;20(11):557-66.
15. Cifuentes A. Food analysis and foodomics. J Chromatogr A. 2009;1216(43):7109.
16. Collins FS, Varmus H. A new initiative on precision medicine. N Engl J Med. 2015;372(9):793-5.
17. Biomedical F. NIH definition of biomarker. Clin Pharmacol Ther. 2001;69:89-95.
18. Epstein LH. The direct effects of compliance on health outcome. Health Psychology. 1984;3(4):385.
19. Dunn WB, Broadhurst D, Begley P, Zelena E, Francis-McIntyre S, Anderson N et al. Procedures for
large-scale metabolic profiling of serum and plasma using gas chromatography and liquid
chromatography coupled to mass spectrometry. Nat Protoc. 2011;6(7):1060-83.
20. Pan Z, Raftery D. Comparing and combining NMR spectroscopy and mass spectrometry in
metabolomics. Analytical and bioanalytical chemistry. 2007;387(2):525-7.
21. Nicholson JK, Lindon JC, Holmes E. 'Metabonomics': understanding the metabolic responses of living
systems to pathophysiological stimuli via multivariate statistical analysis of biological NMR
154
spectroscopic data. Xenobiotica. 1999;29(11):1181-9.
22. Fiehn O. Metabolomics--the link between genotypes and phenotypes. Plant Mol Biol. 2002;48(1-
2):155-71.
23. Dettmer K, Hammock BD. Metabolomics--a new exciting field within the" omics" sciences. Environ
Health Persp. 2004;112(7):A396.
24. Want EJ, Wilson ID, Gika H, Theodoridis G, Plumb RS, Shockcor J et al. Global metabolic profiling
procedures for urine using UPLC-MS. Nat Protoc. 2010;5(6):1005-18.
25. Beckonert O, Keun HC, Ebbels TM, Bundy J, Holmes E, Lindon JC et al. Metabolic profiling,
metabolomic and metabonomic procedures for NMR spectroscopy of urine, plasma, serum and tissue
extracts. Nat Protoc. 2007;2(11):2692-703.
26. Dunn WB, Wilson ID, Nicholls AW, Broadhurst D. The importance of experimental design and QC
samples in large-scale and MS-driven untargeted metabolomic studies of humans. Bioanalysis.
2012;4(18):2249-64.
27. Rocke DM, editor. Design and analysis of experiments with high throughput biological assay data.
Seminars in cell & developmental biology; 2004: Elsevier.
28. Metabolomics: Current analytical platforms and methodologies. TrAC Trends in Analytical Chemistry.
2005;24(4):285-94.
29. Sykes BD. Urine stability for metabolomic studies: effects of preparation and storage. Metabolomics.
2007;3(1):19-27.
30. Fernández-Peralbo MA, Luque de Castro MD. Preparation of urine samples prior to targeted or
untargeted metabolomics mass-spectrometry analysis. TrAC Trends in Analytical Chemistry. 2012;41:75-
85.
31. Yin P, Peter A, Franken H, Zhao X, Neukamm SS, Rosenbaum L et al. Preanalytical aspects and sample
quality assessment in metabolomics studies of human blood. Clin Chem. 2013;59(5):833-45.
32. Andrew ER. Nuclear magnetic resonance. Nuclear Magnetic Resonance, by ER Andrew, Cambridge,
UK: Cambridge University Press, 2009. 2009;1.
33. Koutcher JA, Burt CT. Principles of nuclear magnetic resonance. J Nucl Med. 1984;25(1):101-11.
34. Becker ED. High resolution NMR: theory and chemical applications. Academic Press; 1999.
35. Brewer RG, Shoemaker R. Optical free induction decay. Physical Review A. 1972;6(6):2001.
36. Yamamoto H, Saitoh K, Hasegawa H, Ochi H. NMR spectrometer and NMR probe. Google Patents;
2006.
37. Defernez M, Colquhoun IJ. Factors affecting the robustness of metabolite fingerprinting using 1H
NMR spectra. Phytochemistry. 2003;62(6):1009-17.
38. Shimizu A, Ikeguchi M, Sugai S. APPROPRIATENESS OF DSS AND TSP AS INTERNAL REFERENCES FOR
H-1-NMR STUDIES OF MOLTEN GLOBULE PROTEINS IN AQUEOUS-MEDIA. J Biomol NMR. 1994;4(6):859-
62.
39. Vandegans J, de Kersabiec A-M. Spectrométrie d'absorption atomique. Ed. Techniques Ingénieur;
1997.
40. Hoffmann E. Mass spectrometry. Wiley Online Library; 1996.
41. Munson MS, Field F-H. Chemical ionization mass spectrometry. I. General introduction. J Am Chem
Soc. 1966;88(12):2621-30.
42. Barber M, Bordoli RS, Sedgwick RD, Tyler AN. Fast atom bombardment of solids (FAB): A new ion
source for mass spectrometry. Journal of the Chemical Society, Chemical Communications. 1981(7):325-
7.
155
43. Andrade FJ, Shelley JT, Wetzel WC, Webb MR, Gamez G, Ray SJ et al. Atmospheric pressure chemical
ionization source. 1. Ionization of compounds in the gas phase. Anal Chem. 2008;80(8):2646-53.
44. Hillenkamp F, Karas M, Beavis RC, Chait BT. Matrix-assisted laser desorption/ionization mass
spectrometry of biopolymers. Anal Chem. 1991;63(24):1193A-203A.
45. Dawson P. Quadrupole mass analyzers: performance, design and some recent applications. Mass
Spectrom Rev. 1986;5(1):1-37.
46. Balcerzak M. An overview of analytical applications of time of flight-mass spectrometric (TOF-MS)
analyzers and an inductively coupled plasma-TOF-MS technique. Anal Sci. 2003;19(7):979-89.
47. Makarov A, Denisov E, Kholomeev A, Balschun W, Lange O, Strupat K et al. Performance evaluation
of a hybrid linear ion trap/orbitrap mass spectrometer. Anal Chem. 2006;78(7):2113-20.
48. Hu Q, Noll RJ, Li H, Makarov A, Hardman M, Graham Cooks R. The Orbitrap: a new mass spectrometer.
J Mass Spectrom. 2005;40(4):430-43.
49. Marshall AG, Hendrickson CL, Jackson GS. Fourier transform ion cyclotron resonance mass
spectrometry: a primer. Mass Spectrom Rev. 1998;17(1):1-35.
50. McLuckey SA, Glish GL, Van Berkel GJ. Charge determination of product ions formed from collision-
induced dissociation of multiply protonated molecules via ion/molecule reactions. Anal Chem.
1991;63(18):1971-8.
51. Hu Q, Noll RJ, Li H, Makarov A, Hardman M, Graham Cooks R. The Orbitrap: a new mass spectrometer.
J Mass Spectrom. 2005;40(4):430-43.
52. Bachmann S, Bressan A, Ropelewski L, Sauli F, Sharma A, Mörmann D. Charge amplification and
transfer processes in the gas electron multiplier. Nuclear Instruments and Methods in Physics Research
Section A: Accelerators, Spectrometers, Detectors and Associated Equipment. 1999;438(2):376-408.
53. Patel R, Roy M, Dutta G. Mass spectrometry-A review. Veterinary World. 2012;5(3):185-92.
54. McLafferty FW. Tandem mass spectrometry. Science. 1981;214(4518):280-7.
55. Giddings JC. Dynamics of chromatography: principles and theory. CRC Press; 2002.
56. Smith R, Haken J, Wainwright M. Evaluation of mathematical procedures for the calculation of dead-
time. J Chromatogr A. 1978;147:65-73.
57. Christie WW. Gas chromatography and lipids. Oily Press Ayr; 1989.
58. Cooper JR, Bowater IC, Wilkins CL. Gas chromatography/Fourier transform infrared/mass
spectrometry using a mass selective detector. Anal Chem. 1986;58(13):2791-6.
59. Knapp DR. Handbook of analytical derivatization reactions. John Wiley & Sons; 1979.
60. Petrovic M, Barcelo D. Liquid chromatography-tandem mass spectrometry. Analytical and
bioanalytical chemistry. 2013;405(18):5857-8.
61. Majors RE, Przybyciel M. Columns for reversed-phase LC separations in highly aqueous mobile
phases. Lc Gc N Am. 2002;20(7):584-93.
62. Cubbon S, Antonio C, Wilson J, Thomas‐Oates J. Metabolomic applications of hilic–lc–ms. Mass
Spectrom Rev. 2010;29(5):671-84.
63. Swartz ME. UPLC™: an introduction and review. J Liq Chromatogr R T. 2005;28(7-8):1253-63.
64. Ramautar R, Somsen GW, de Jong GJ. CE‐MS in metabolomics. Electrophoresis. 2009;30(1):276-
91.
65. Ramautar R, Mayboroda OA, Somsen GW, de Jong GJ. CE‐MS for metabolomics: Developments
and applications in the period 2008–2010. Electrophoresis. 2011;32(1):52-65.
66. Shevchenko A, Simons K. Lipidomics: coming to grips with lipid diversity. Nat Rev Mol Cell Bio.
2010;11(8):593-8.
156
67. Hochrein J, Zacharias HU, Taruttis F, Samol C, Engelmann JC, Spang R et al. Data Normalization of
(1)H NMR Metabolite Fingerprinting Data Sets in the Presence of Unbalanced Metabolite Regulation. J
Proteome Res. 2015;14(8):3217-28.
68. Dieterle F, Ross A, Schlotterbeck G, Senn H. Probabilistic quotient normalization as robust method
to account for dilution of complex biological mixtures. Application in H-1 NMR metabonomics. Anal
Chem. 2006;78(13):4281-90.
69. Lee J, Park J, Lim MS, Seong SJ, Seo JJ, Park SM et al. Quantile Normalization Approach for Liquid
Chromatography-Mass Spectrometry-based Metabolomic Data from Healthy Human Volunteers. Anal
Sci. 2012;28(8):801-5.
70. Gallon S, Loubes JM, Maza E. Statistical properties of the quantile normalization method for density
curve alignment. Math Biosci. 2013;242(2):129-42.
71. van den Berg RA, Hoefsloot HC, Westerhuis JA, Smilde AK, van der Werf MJ. Centering, scaling, and
transformations: improving the biological information content of metabolomics data. BMC genomics.
2006;7:142.
72. De Meyer T, Sinnaeve D, Van Gasse B, Rietzschel ER, De Buyzere ML, Langlois MR et al. Evaluation of
standard and advanced preprocessing methods for the univariate analysis of blood serum H-1-NMR
spectra. Analytical and Bioanalytical Chemistry. 2010;398(4):1781-90.
73. Gibbons JD, Chakraborti S. Nonparametric statistical inference. Springer; 2011.
74. Kaempf U. The binomial test: a simple tool to identify process problems. IEEE T Semiconduct M.
1995;8(2):160-6.
75. Norusis MJ. SPSS: Statistical data analysis. SPSS; 1990.
76. Miller Jr RG. Beyond ANOVA: basics of applied statistics. CRC Press; 1997.
77. Estivill-Castro V. Why so many clustering algorithms: a position paper. ACM SIGKDD explorations
newsletter. 2002;4(1):65-75.
78. Bridges CC. Hierarchical cluster analysis. Psychological reports. 1966;18(3):851-4.
79. Saghatelian A, Trauger SA, Want EJ, Hawkins EG, Siuzdak G, Cravatt BF. Assignment of endogenous
substrates to enzymes by global metabolite profiling. Biochemistry. 2004;43(45):14332-9.
80. Jolliffe I. Principal component analysis. Wiley Online Library; 2002.
81. Wold S, Esbensen K, Geladi P. Principal component analysis. Chemometr Intell Lab. 1987;2(1-3):37-
52.
82. Abdi H, Williams LJ. Principal component analysis. Wiley Interdisciplinary Reviews: Computational
Statistics. 2010;2(4):433-59.
83. Wold S, Sjöström M, Eriksson L. PLS-regression: a basic tool of chemometrics. Chemometr Intell Lab.
2001;58(2):109-30.
84. Bylesjö M, Rantalainen M, Cloarec O, Nicholson JK, Holmes E, Trygg J. OPLS discriminant analysis:
combining the strengths of PLS‐DA and SIMCA classification. J Chemometr. 2006;20(8‐10):341-51.
85. Worley B, Powers R. Multivariate analysis in metabolomics. Current Metabolomics. 2013;1(1):92-
107.
86. Lu B, Castillo I, Chiang L, Edgar TF. Industrial PLS model variable selection using moving window
variable importance in projection. Chemometr Intell Lab. 2014;135:90-109.
87. Bewick V, Cheek L, Ball J. Statistics review 13: Receiver operating characteristic curves. Critical Care.
2004;8(6):508.
88. Westerhuis JA, van Velzen EJ, Hoefsloot HC, Smilde AK. Multivariate paired data analysis: multilevel
PLSDA versus OPLSDA. Metabolomics. 2010;6(1):119-28.
157
89. Bijlsma S, Bobeldijk I, Verheij ER, Ramaker R, Kochhar S, Macdonald IA et al. Large-scale human
metabolomics studies: a strategy for data (pre-) processing and validation. Anal Chem. 2006;78(2):567-
74.
90. Serkova NJ, Niemann CU. Pattern recognition and biomarker validation using quantitative 1H-NMR-
based metabolomics. Expert review of molecular diagnostics. 2006;6(5):717-31.
91. Triba MN, Le Moyec L, Amathieu R, Goossens C, Bouchemal N, Nahon P et al. PLS/OPLS models in
metabolomics: the impact of permutation of dataset rows on the K-fold cross-validation quality
parameters. Molecular bioSystems. 2015;11(1):13-9.
92. Westerhuis JA, Hoefsloot HCJ, Smit S, Vis DJ, Smilde AK, van Velzen EJJ et al. Assessment of PLSDA
cross validation. Metabolomics. 2008;4(1):81-9.
93. Lindgren F, Hansen B, Karcher W, Sjöström M, Eriksson L. Model validation by permutation tests:
Applications to variable selection. J Chemometr. 1996;10(5‐6):521-32.
94. Ke C, Li A, Hou Y, Sun M, Yang K, Cheng J et al. Metabolic phenotyping for monitoring ovarian cancer
patients. Scientific reports. 2016;6.
95. Hanley JA, McNeil BJ. The meaning and use of the area under a receiver operating characteristic
(ROC) curve. Radiology. 1982;143(1):29-36.
96. Kanehisa M, Araki M, Goto S, Hattori M, Hirakawa M, Itoh M et al. KEGG for linking genomes to life
and the environment. Nucleic Acids Res. 2008;36(suppl 1):D480-D4.
97. Kanehisa M, Goto S, Hattori M, Aoki-Kinoshita KF, Itoh M, Kawashima S et al. From genomics to
chemical genomics: new developments in KEGG. Nucleic Acids Res. 2006;34(suppl 1):D354-D7.
98. Wishart DS, Tzur D, Knox C, Eisner R, Guo AC, Young N et al. HMDB: the human metabolome database.
Nucleic Acids Res. 2007;35(suppl 1):D521-D6.
99. Xia J, Sinelnikov IV, Han B, Wishart DS. MetaboAnalyst 3.0—making metabolomics more meaningful.
Nucleic Acids Res. 2015;43(W1):W251-W7.
100. Karp PD, Ouzounis CA, Moore-Kochlacs C, Goldovsky L, Kaipa P, Ahrén D et al. Expansion of the
BioCyc collection of pathway/genome databases to 160 genomes. Nucleic Acids Res. 2005;33(19):6083-
9.
101. Puchades-Carrasco L, Palomino-Schatzlein M, Perez-Rambla C, Pineda-Lucena A. Bioinformatics
tools for the analysis of NMR metabolomics studies focused on the identification of clinically relevant
biomarkers. Briefings in bioinformatics. 2016;17(3):541-52.
102. Pan Z, Raftery D. Comparing and combining NMR spectroscopy and mass spectrometry in
metabolomics. Analytical and bioanalytical chemistry. 2007;387(2):525-7.
103. Foxall PJ, Spraul M, Farrant RD, Lindon LC, Neild GH, Nicholson JK. 750 MHz 1H-NMR spectroscopy
of human blood plasma. J Pharm Biomed Anal. 1993;11(4-5):267-76.
104. Schauer N, Steinhauser D, Strelkov S, Schomburg D, Allison G, Moritz T et al. GC-MS libraries for
the rapid identification of metabolites in complex biological samples. Febs Lett. 2005;579(6):1332-7.
105. Theodoridis G, Gika HG, Wilson ID. LC-MS-based methodology for global metabolite profiling in
metabonomics/metabolomics. TrAC Trends in Analytical Chemistry. 2008;27(3):251-60.
106. Crockford DJ, Holmes E, Lindon JC, Plumb RS, Zirah S, Bruce SJ et al. Statistical heterospectroscopy,
an approach to the integrated analysis of NMR and UPLC-MS data sets: application in metabonomic
toxicology studies. Anal Chem. 2006;78(2):363-71.
107. Crockford DJ, Maher AD, Ahmadi KR, Barrett A, Plumb RS, Wilson ID et al. 1H NMR and UPLC-MSE
statistical heterospectroscopy: characterization of drug metabolites (xenometabolome) in
epidemiological studies. Anal Chem. 2008;80(18):6835-44.
158
108. Wu H, Southam AD, Hines A, Viant MR. High-throughput tissue extraction protocol for NMR- and
MS-based metabolomics. Anal Biochem. 2008;372(2):204-12.
109. Bingol K, Bruschweiler-Li L, Yu C, Somogyi A, Zhang F, Bruschweiler R. Metabolomics beyond
spectroscopic databases: a combined MS/NMR strategy for the rapid identification of new metabolites
in complex mixtures. Anal Chem. 2015;87(7):3864-70.
110. Bone RC, Balk RA, Cerra FB, Dellinger RP, Fein AM, Knaus WA et al. Definitions for sepsis and organ
failure and guidelines for the use of innovative therapies in sepsis. Chest. 1992;101(6):1644-55.
111. Dellinger RP, Levy MM, Rhodes A, Annane D, Gerlach H, Opal SM et al. Surviving Sepsis Campaign:
international guidelines for management of severe sepsis and septic shock, 2012. Intens Care Med.
2013;39(2):165-228.
112. Dellinger RL, MM ; Carlet, JM ; Bion, J; Parker, MM ; Jaeschke, R; Reinhart, K ; Angus, DC; Brun-
Buisson, C; Beale, R Surviving Sepsis Campaign: International guidelines for management of severe
sepsis and septic shock: 2008. CRITICAL CARE MEDICINE. 2008;36: 296-327.
113. Balk RA. Systemic inflammatory response syndrome (SIRS): where did it come from and is it still
relevant today? Virulence. 2014;5(1):20-6.
114. Martin-Loeches I, Levy MM, Artigas A. Management of severe sepsis: advances, challenges, and
current status. Drug design, development and therapy. 2015;9:2079-88.
115. Singer M, De Santis V, Vitale D, Jeffcoate W. Multiorgan failure is an adaptive, endocrine-mediated,
metabolic response to overwhelming systemic inflammation. The Lancet. 2004;364(9433):545-8.
116. Angus DC, van der Poll T. Severe sepsis and septic shock. N Engl J Med. 2013;369(9):840-51.
117. Cao Z, Robinson RA. The role of proteomics in understanding biological mechanisms of sepsis.
Proteomics Clin Appl. 2014;8(1-2):35-52.
118. Haase N, Wetterslev J, Winkel P, Perner A. Bleeding and risk of death with hydroxyethyl starch in
severe sepsis: post hoc analyses of a randomized clinical trial. Intensive care medicine.
2013;39(12):2126-34.
119. Semeraro N, Ammollo CT, Semeraro F, Colucci M. Sepsis, thrombosis and organ dysfunction.
Thromb Res. 2012;129(3):290-5.
120. Tsao CM, Ho ST, Wu CC. Coagulation abnormalities in sepsis. Acta anaesthesiologica Taiwanica :
official journal of the Taiwan Society of Anesthesiologists. 2015;53(1):16-22.
121. Janigan DT, Morris J, Hirsch D. ACUTE SKIN AND FAT NECROSIS DURING SEPSIS IN A PATIENT WITH
CHRONIC-RENAL-FAILURE AND SUBCUTANEOUS ARTERIAL CALCIFICATION. Am J Kidney Dis.
1992;20(6):643-6.
122. Jean-Baptiste E. Cellular mechanisms in sepsis. J Intensive Care Med. 2007;22(2):63-72.
123. Ramachandran G. Gram-positive and gram-negative bacterial toxins in sepsis: a brief review.
Virulence. 2014;5(1):213-8.
124. Ferrer R, Martin-Loeches I, Phillips G, Osborn TM, Townsend S, Dellinger RP et al. Empiric antibiotic
treatment reduces mortality in severe sepsis and septic shock from the first hour: results from a
guideline-based performance improvement program. Critical care medicine. 2014;42(8):1749-55.
125. EMANUEL RIVERS MD, M.P.H., BRYANT NGUYEN, M.D., SUZANNEH,AVSTAD, M.A., J ULIERSSLER,
B.S.,A LEXANDRIA MUZZIN, B.S., BERNHARD. EARLY GOAL-DIRECTED THERAPY IN THE TREATMENT OF
SEVERE SEPSIS AND SEPTIC SHOCK. The New England Journal of Medicine. 2001;345:1368-77.
126. Shane AL, Stoll BJ. Neonatal sepsis: progress towards improved outcomes. J Infect. 2014;68 Suppl
1:S24-32.
127. Wichterman KA, Baue AE, Chaudry IH. SEPSIS AND SEPTIC SHOCK - A REVIEW OF LABORATORY
159
MODELS AND A PROPOSAL. J Surg Res. 1980;29(2):189-201.
128. Zhao X, Chen YX, Li CS. Predictive value of the complement system for sepsis-induced disseminated
intravascular coagulation in septic patients in emergency department. J Crit Care. 2015;30(2):290-5.
129. Cho SY, Choi JH. Biomarkers of sepsis. Infect Chemother. 2014;46(1):1-12.
130. Henriquez-Camacho C, Losa J. Biomarkers for sepsis. Biomed Res Int. 2014;2014:547818.
131. Sweet MJ, Hume DA. Endotoxin signal transduction in macrophages. J Leukocyte Biol. 1996;60(1):8-
26.
132. Yu DH, Nho DH, Song RH, Kim SH, Lee MJ, Nemzek JA et al. High-mobility group box 1 as a surrogate
prognostic marker in dogs with systemic inflammatory response syndrome. J Vet Emerg Crit Care (San
Antonio). 2010;20(3):298-302.
133. Kitchens RL, Thompson PA. Impact of sepsis-induced changes in plasma on LPS interactions with
monocytes and plasma lipoproteins: roles of soluble CD14, LBP, and acute phase lipoproteins. J
Endotoxin Res. 2003;9(2):113-8.
134. Frevert CW, Matute-Bello G, Skerrett SJ, Goodman RB, Kajikawa O, Sittipunt C et al. Effect of CD14
Blockade in Rabbits with Escherichia coli Pneumonia and Sepsis. The Journal of Immunology.
2000;164(10):5439-45.
135. Clyne B, Olshaker JS. The C-reactive protein. J Emerg Med. 1999;17(6):1019-25.
136. Louis E, Franchimont D, Piron A, Gevaert Y, Schaaf-Lafontaine N, Roland S et al. Tumour necrosis
factor (TNF) gene polymorphism influences TNF-alpha production in lipopolysaccharide (LPS)-
stimulated whole blood cell culture in healthy humans. Clin Exp Immunol. 1998;113(3):401-6.
137. Yoshimura T, Matsushima K, Oppenheim JJ, Leonard EJ. NEUTROPHIL CHEMOTACTIC FACTOR
PRODUCED BY LIPOPOLYSACCHARIDE (LPS)-STIMULATED HUMAN-BLOOD MONONUCLEAR LEUKOCYTES
- PARTIAL CHARACTERIZATION AND SEPARATION FROM INTERLEUKIN-1 (IL-1). J Immunol.
1987;139(3):788-93.
138. Berg DJ, Kuhn R, Rajewsky K, Muller W, Menon S, Davidson N et al. INTERLEUKIN-10 IS A CENTRAL
REGULATOR OF THE RESPONSE TO LPS IN MURINE MODELS OF ENDOTOXIC-SHOCK AND THE
SHWARTZMAN REACTION BUT NOT ENDOTOXIN TOLERANCE. J Clin Invest. 1995;96(5):2339-47.
139. Hoerr V, Zbytnuik L, Leger C, Tam PP, Kubes P, Vogel HJ. Gram-negative and Gram-positive bacterial
infections give rise to a different metabolic response in a mouse model. Journal of proteome research.
2012;11(6):3231-45.
140. Su L, Huang Y, Zhu Y, Xia L, Wang R, Xiao K et al. Discrimination of sepsis stage metabolic profiles
with an LC/MS-MS-based metabolomics approach. BMJ open respiratory research. 2014;1(1):e000056.
141. Izquierdo-Garcia JL, Nin N, Ruiz-Cabello J, Rojas Y, de Paula M, Lopez-Cuenca S et al. A metabolomic
approach for diagnosis of experimental sepsis. Intensive Care Med. 2011;37(12):2023-32.
142. Mickiewicz B, Vogel HJ, Wong HR, Winston BW. Metabolomics as a novel approach for early
diagnosis of pediatric septic shock and its mortality. Am J Respir Crit Care Med. 2013;187(9):967-76.
143. Fanos V, Caboni P, Corsello G, Stronati M, Gazzolo D, Noto A et al. Urinary 1 H-NMR and GC-MS
metabolomics predicts early and late onset neonatal sepsis. Early human development. 2014;90:S78-
S83.
144. Schmerler D, Neugebauer S, Ludewig K, Bremer-Streck S, Brunkhorst FM, Kiehntopf M. Targeted
metabolomics for discrimination of systemic inflammatory disorders in critically ill patients. Journal of
lipid research. 2012:jlr. P023309.
145. Hubbard WJ, Choudhry M, Schwacha MG, Kerby JD, Rue III LW, Bland KI et al. Cecal ligation and
puncture. Shock. 2005;24:52-7.
160
146. Lin ZY, Xu PB, Yan SK, Meng HB, Yang GJ, Dai WX et al. A metabonomic approach to early prognostic
evaluation of experimental sepsis by (1)H NMR and pattern recognition. Nmr Biomed. 2009;22(6):601-
8.
147. Xu PB, Lin ZY, Meng HB, Yan SK, Yang Y, Liu XR et al. A metabonomic approach to early prognostic
evaluation of experimental sepsis. J Infect. 2008;56(6):474-81.
148. Garcia-Simon M, Morales JM, Modesto-Alapont V, Gonzalez-Marrachelli V, Vento-Rehues R, Jorda-
Miñana A et al. Prognosis Biomarkers of Severe Sepsis and Septic Shock by 1 H NMR Urine Metabolomics
in the Intensive Care Unit. PloS one. 2015;10(11):e0140993.
149. Mickiewicz B, Tam P, Jenne CN, Leger C, Wong J, Winston BW et al. Integration of metabolic and
inflammatory mediator profiles as a potential prognostic approach for septic shock in the intensive care
unit. Crit Care. 2015;19:11.
150. Langley RJ, Tsalik EL, van Velkinburgh JC, Glickman SW, Rice BJ, Wang C et al. An integrated clinico-
metabolomic model improves prediction of death in sepsis. Science translational medicine.
2013;5(195):195ra95.
151. Wasmuth HE, Kunz D, Yagmur E, Timmer-Stranghoner A, Vidacek D, Siewert E et al. Patients with
acute on chronic liver failure display "sepsis-like" immune paralysis. J Hepatol. 2005;42(2):195-201.
152. Abraham E, Singer M. Mechanisms of sepsis-induced organ dysfunction. Critical care medicine.
2007;35(10):2408-16.
153. Schrier RW, Wang W. Acute renal failure and sepsis. New Engl J Med. 2004;351(2):159-69.
154. Vincent M. Consensus conference definitions for sepsis, septic shock, acute lung injury, and acute
respiratory distress syndrome: time for a reevaluation. Critical care medicine. 2000;28(1):232-5.
155. Hasper D, Hummel M, Kleber F, Reindl I, Volk H-D. Systemic inflammation in patients with heart
failure. Eur Heart J. 1998;19(5):761-5.
156. Marquardt DJ, Knatz NL, Wetterau LA, Wewers MD, Hall MW. Failure to recover somatotropic axis
function is associated with mortality from pediatric sepsis-induced multiple organ dysfunction
syndrome. Pediatric critical care medicine : a journal of the Society of Critical Care Medicine and the
World Federation of Pediatric Intensive and Critical Care Societies. 2010;11(1):18-25.
157. Kathleen A. Stringer NJS, 2,3,4* Alla Karnovsky,5 Kenneth Guire,6 Robert Paine III and Theodore J.
Standiford. Metabolic consequences of sepsis-induced acute lung injury revealed by plasma 1H-nuclear
magnetic resonance quantitative metabolomics and computational analysis. AJP-Lung Cell Mol Physiol.
2011;300:L4-L11.
158. Recknagel P, Gonnert FA, Westermann M, Lambeck S, Lupp A, Rudiger A et al. Liver dysfunction
and phosphatidylinositol-3-kinase signalling in early sepsis: experimental studies in rodent models of
peritonitis. PLoS medicine. 2012;9(11):e1001338.
159. Liu Y, Yan S, Ji C, Dai W, Hu W, Zhang W et al. Metabolomic changes and protective effect of (L)-
carnitine in rat kidney ischemia/reperfusion injury. Kidney Blood Press Res. 2012;35(5):373-81.
160. Hinkelbein J, Kalenka A, Schubert C, Peterka A, Feldmann J, Robert E. Proteome and metabolome
alterations in heart and liver indicate compromised energy production during sepsis. Protein Peptide
Lett. 2010;17(1):18-31.
161. Stringer KA, Younger JG, McHugh C, Yeomans L, Finkel MA, Puskarich MA et al. Whole Blood Reveals
More Metabolic Detail of the Human Metabolome Than Serum as Measured by 1H-NMR Spectroscopy:
Implications for Sepsis Metabolomics. Shock. 2015.
162. Cao Z, Yende S, Kellum JA, Angus DC, Robinson RA. Proteomics reveals age-related differences in
the host immune response to sepsis. Journal of proteome research. 2014;13(2):422-32.
161
163. Wu W, Zhao S. Metabolic changes in cancer: beyond the Warburg effect. Acta Bioch Bioph Sin.
2013;45(1):18-26.
164. Leithead JA, Hayes PC, Ferguson JW. Review article: advances in the management of patients with
cirrhosis and portal hypertension-related renal dysfunction. Aliment Pharmacol Ther. 2014;39(7):699-
711.
165. Sauneuf B, Champigneulle B, Soummer A, Mongardon N, Charpentier J, Cariou A et al. Increased
survival of cirrhotic patients with septic shock. Crit Care. 2013;17(2):10.
166. Go AS, Chertow GM, Fan D, McCulloch CE, Hsu C-y. Chronic kidney disease and the risks of death,
cardiovascular events, and hospitalization. New Engl J Med. 2004;351(13):1296-305.
167. Zhang A, Sun H, Wang X. Serum metabolomics as a novel diagnostic approach for disease: a
systematic review. Analytical and bioanalytical chemistry. 2012;404(4):1239-45.
168. Llovet JM, Burroughs A, Bruix J. Hepatocellular carcinoma. The Lancet. 2003;362(9399):1907-17.
169. O'Connor S, Ward J, Watson M, Momin B, Richardson L. Hepatocellular carcinoma-United States,
2001-2006. Morbidity and Mortality Weekly Report. 2010;59(17):517-20.
170. El-Serag HB. Epidemiology of viral hepatitis and hepatocellular carcinoma. Gastroenterology.
2012;142(6):1264-73 e1.
171. Donato F, Tagger A, Gelatti U, Parrinello G, Boffetta P, Albertini A et al. Alcohol and hepatocellular
carcinoma: the effect of lifetime intake and hepatitis virus infections in men and women. American
journal of epidemiology. 2002;155(4):323-31.
172. Kew MC. Aflatoxins as a cause of hepatocellular carcinoma. J Gastrointestin Liver Dis.
2013;22(3):305-10.
173. Page JM, Harrison SA. Nash and HCC. Clinics in liver disease. 2009;13(4):631-47.
174. Younossi ZM, Otgonsuren M, Henry L, Venkatesan C, Mishra A, Erario M et al. Association of
nonalcoholic fatty liver disease (NAFLD) with hepatocellular carcinoma (HCC) in the United States from
2004 to 2009. Hepatology. 2015;62(6):1723-30.
175. Bialecki ES, Di Bisceglie AM. Diagnosis of hepatocellular carcinoma. HPB : the official journal of the
International Hepato Pancreato Biliary Association. 2005;7(1):26-34.
176. Pons F, Varela M, Llovet JM. Staging systems in hepatocellular carcinoma. HPB : the official journal
of the International Hepato Pancreato Biliary Association. 2005;7(1):35-41.
177. Wiesner RH, Freeman RB, Mulligan DC. Liver transplantation for hepatocellular cancer: the impact
of the MELD allocation policy. Gastroenterology. 2004;127(5):S261-S7.
178. Hu R-H, Lee P-H, Yu S-C, Dai H-C, Sheu J-C, Lai M-Y et al. Surgical resection for recurrent
hepatocellular carcinoma: prognosis and analysis of risk factors. Surgery. 1996;120(1):23-9.
179. Lin S, Lin C, Lin C, Hsu C, Chen Y. Randomised controlled trial comparing percutaneous
radiofrequency thermal ablation, percutaneous ethanol injection, and percutaneous acetic acid
injection to treat hepatocellular carcinoma of 3 cm or less. Gut. 2005;54(8):1151-6.
180. Livraghi T, Solbiati L, Meloni MF, Gazelle GS, Halpern EF, Goldberg SN. Treatment of focal liver
tumors with percutaneous radio-frequency ablation: Complications encountered in a multicenter study
1. Radiology. 2003;226(2):441-51.
181. Livraghi T, Goldberg SN, Lazzaroni S, Meloni F, Solbiati L, Gazelle GS. Small hepatocellular carcinoma:
treatment with radio-frequency ablation versus ethanol injection. Radiology. 1999;210(3):655-61.
182. Johnstone RW, Ruefli AA, Lowe SW. Apoptosis: a link between cancer genetics and chemotherapy.
Cell. 2002;108(2):153-64.
183. Altekruse SF, McGlynn KA, Reichman ME. Hepatocellular Carcinoma Incidence, Mortality, and
162
Survival Trends in the United States From 1975 to 2005. J Clin Oncol. 2009;27(9):1485-91.
184. Forner A, Vilana R, Ayuso C, Bianchi L, Solé M, Ayuso JR et al. Diagnosis of hepatic nodules 20 mm
or smaller in cirrhosis: prospective validation of the noninvasive diagnostic criteria for hepatocellular
carcinoma. Hepatology. 2008;47(1):97-104.
185. Tan Y, Yin P, Tang L, Xing W, Huang Q, Cao D et al. Metabolomics study of stepwise
hepatocarcinogenesis from the model rats to patients: potential biomarkers effective for small
hepatocellular carcinoma diagnosis. Molecular & cellular proteomics : MCP. 2012;11(2):M111 010694.
186. Liu Y, Hong Z, Tan G, Dong X, Yang G, Zhao L et al. NMR and LC/MS-based global metabolomics to
identify serum biomarkers differentiating hepatocellular carcinoma from liver cirrhosis. Int J Cancer.
2014;135(3):658-68.
187. Fages A, Duarte-Salles T, Stepien M, Ferrari P, Fedirko V, Pontoizeau C et al. Metabolomic profiles
of hepatocellular carcinoma in a European prospective cohort. BMC medicine. 2015;13:242.
188. Zhou L, Wang Q, Yin P, Xing W, Wu Z, Chen S et al. Serum metabolomics reveals the deregulation
of fatty acids metabolism in hepatocellular carcinoma and chronic liver diseases. Analytical and
bioanalytical chemistry. 2012;403(1):203-13.
189. Nahon P, Amathieu R, Triba MN, Bouchemal N, Nault JC, Ziol M et al. Identification of serum proton
NMR metabolomic fingerprints associated with hepatocellular carcinoma in patients with alcoholic
cirrhosis. Clin Cancer Res. 2012;18(24):6714-22.
190. Chen T, Xie G, Wang X, Fan J, Qiu Y, Zheng X et al. Serum and Urine Metabolite Profiling Reveals
Potential Biomarkers of Human Hepatocellular Carcinoma. Molecular & Cellular Proteomics. 2011;10(7).
191. Huang Q, Tan Y, Yin P, Ye G, Gao P, Lu X et al. Metabolic characterization of hepatocellular carcinoma
using nontargeted tissue metabolomics. Cancer Res. 2013;73(16):4992-5002.
192. Ye G, Zhu B, Yao Z, Yin P, Lu X, Kong H et al. Analysis of urinary metabolic signatures of early
hepatocellular carcinoma recurrence after surgical removal using gas chromatography-mass
spectrometry. Journal of proteome research. 2012;11(8):4361-72.
193. Zhou L, Liao Y, Yin P, Zeng Z, Li J, Lu X et al. Metabolic profiling study of early and late recurrence of
hepatocellular carcinoma based on liquid chromatography-mass spectrometry. J Chromatogr B Analyt
Technol Biomed Life Sci. 2014;966:163-70.
194. Wang J, Zhang S, Li Z, Yang J, Huang C, Liang R et al. (1)H-NMR-based metabolomics of tumor tissue
for the metabolic characterization of rat hepatocellular carcinoma formation and metastasis. Tumour
biology : the journal of the International Society for Oncodevelopmental Biology and Medicine.
2011;32(1):223-31.
195. Takano S, Yokosuka O, Imazeki F, Tagawa M, Omata M. INCIDENCE OF HEPATOCELLULAR-
CARCINOMA IN CHRONIC HEPATITIS-B AND HEPATITIS-C - A PROSPECTIVE-STUDY OF 251 PATIENTS.
Hepatology. 1995;21(3):650-5.
196. Perz JF, Armstrong GL, Farrington LA, Hutin YJ, Bell BP. The contributions of hepatitis B virus and
hepatitis C virus infections to cirrhosis and primary liver cancer worldwide. J Hepatol. 2006;45(4):529-
38.
197. Morgan TR, Mandayam S, Jamal MM. Alcohol and hepatocellular carcinoma. Gastroenterology.
2004;127(5):S87-S96.
198. Caldwell SH, Crespo DM, Kang HS, Al-Osaimi AMS. Obesity and hepatocellular carcinoma.
Gastroenterology. 2004;127(5):S97-S103.
199. Goossens C, Nahon P, Le Moyec L, Triba MN, Bouchemal N, Amathieu R et al. Sequential Serum
Metabolomic Profiling after Radiofrequency Ablation of Hepatocellular Carcinoma Reveals Different
163
Response Patterns According to Etiology. Journal of proteome research. 2016;15(5):1446-54.
200. Gao R, Cheng J, Fan C, Shi X, Cao Y, Sun B et al. Serum Metabolomics to Identify the Liver Disease-
Specific Biomarkers for the Progression of Hepatitis to Hepatocellular Carcinoma. Sci Rep. 2015;5:18175.
201. Lu Y, Huang C, Gao L, Xu Y-J, Chia SE, Chen S et al. Identification of serum biomarkers associated
with hepatitis B virus-related hepatocellular carcinoma and liver cirrhosis using mass-spectrometry-
based metabolomics. Metabolomics. 2015;11(6):1526-38.
202. Fitian AI, Nelson DR, Liu C, Xu Y, Ararat M, Cabrera R. Integrated metabolomic profiling of
hepatocellular carcinoma in hepatitis C cirrhosis through GC/MS and UPLC/MS-MS. Liver international :
official journal of the International Association for the Study of the Liver. 2014;34(9):1428-44.
203. Li S, Liu H, Jin Y, Lin S, Cai Z, Jiang Y. Metabolomics study of alcohol-induced liver injury and
hepatocellular carcinoma xenografts in mice. J Chromatogr B. 2011;879(24):2369-75.
204. Clarke JD, Novak P, Lake AD, Shipkova P, Aranibar N, Robertson D et al. Characterization of
hepatocellular carcinoma related genes and metabolites in human nonalcoholic fatty liver disease. Dig
Dis Sci. 2014;59(2):365-74.
205. Safaei A, Oskouie AA, Mohebbi SR, Rezaei-Tavirani M, Mahboubi M, Peyvandi M et al. Metabolomic
analysis of human cirrhosis, hepatocellular carcinoma, non-alcoholic fatty liver disease and non-
alcoholic steatohepatitis diseases. Gastroenterology and Hepatology from bed to bench. 2016;9(3):158.
206. Ryder SD. Guidelines for the diagnosis and treatment of hepatocellular carcinoma (HCC) in adults.
Gut. 2003;52(suppl 3):iii1-iii8.
207. Ikeda K, Saitoh S, Tsubota A, Arase Y, Chayama K, Kumada H et al. Risk factors for tumor recurrence
and prognosis after curative resection of hepatocellular carcinoma. Cancer. 1993;71(1):19-25.
208. Imamura H, Matsuyama Y, Tanaka E, Ohkubo T, Hasegawa K, Miyagawa S et al. Risk factors
contributing to early and date phase intrahepatic recurrence of hepatocellular carcinoma after
hepatectomy. J Hepatol. 2003;38(2):200-7.
209. Qin LX, Tang ZY. Recent progress in predictive biomarkers for metastatic recurrence of human
hepatocellular carcinoma: a review of the literature. J Cancer Res Clin Oncol. 2004;130(9):497-513.
164
Abstract
A cascade of metabolomic studies have been developed in the recent decade. The application of
metabolomics in the clinical field has been shown to be promising since even subtle physiological
changes can be revealed by a metabolomic study which determines variations in the metabolome.
Personalized clinical care is currently proposed for almost all the diseases, however, it is still difficult
to be executed for the scarce of clinical biomarkers. This thesis work concerns the applications of
both 1H NMR-based and MS-based metabolomics in the determination of potential serum
biomarkers which help to improve personalized diagnosis and prognosis. It is composed by two
principal parts. The first part of the work aims to find out metabolite biomarkers predicting the
mortality of septic shock before clinical intervention and first 12 hours after hospitalization using
NMR-based and LC-MS-based metabolomic methods respectively. The goal of the second part of
the work is to seek potential biomarkers predicting the recurrence of HCC before and after RFA
treatment. Our findings not only show that both the two applied techniques were useful for the
discovery of novel clinical biomarkers, but also show that the two techniques are complementary.
Key words: Metabolomics, 1H NMR spectroscopy, Mass spectrometry, biomarkers, septic shock,
Hepatocellular carcinoma.
Résumé
De nombreuses études métabolomiques a été développée au cours de la dernière dizaine année.
L'application de la métabolomique dans le traitement clinique s'est révélée prometteuse puisque
même des faibles modifications physiologiques peuvent être révélées par une étude
métabolomique. Des soins cliniques personnalisés sont actuellement proposés pour presque
toutes les maladies, mais il est encore difficile de les réaliser à cause du manque de biomarqueurs
cliniques. Ce travail de thèse a pour le but de la détermination de biomarqueurs cliniques par la
spectroscopie RMN et par la spectrométrie de masse. Il est composé de deux parties : la première
partie du travail vise à déterminer les biomarqueurs des métabolites prédisant la mortalité du choc
septique avant l'intervention clinique et les 12 premières heures après l'hospitalisation en utilisant
respectivement des méthodes métaboliques basées sur la RMN et la LC-MS. L'objectif de la
deuxième partie du travail est de rechercher des biomarqueurs potentiels prédisant la récidive du
CHC avant et après le traitement RFA. Nos résultats montrent non seulement que les deux
techniques appliquées ont été utiles pour la découverte de nouveaux biomarqueurs cliniques, mais
montrent également que les deux techniques sont complémentaires.
Mots clés : Métabolomique, 1H résonance magnétique nucléaire, spectrométrie de masse,
biomarqueur, choc septique, carcinome hépatocellulaire