Embed Size (px)
Citation preview
Application of Micro Gas Turbine in Range-Extended Electric Vehicles
Apostolos Karvountzis-Kontakiotisa,b, Amin Mahmoudzadeh Andwaria,d*Apostolos Pesiridisa,
Salvatore Russoc, Raffaele Tuccilloc and Vahid Esfahaniand
a Centre for Advanced Powertrain and Fuels Research (CAPF), Department of Mechanical,
Aerospace and Civil Engineering, Brunel University London, London UB8 3PH, UK
b Department of Mechanical Engineering & Aeronautics, City University of London,
Northampton Square, London EC1V 0HB, UK
c Department of Industrial Engineering, University of Naples Federico II, Via Claudio 21,
Napoli, Italy
d Vehicle, Fuel and Environment Research Institute, School of Mechanical Engineering, College
of Engineering, University of Tehran, Tehran 1439956191, Iran
*Corresponding author E-mail: [email protected]
Abstract
The increasing number of passenger cars worldwide and the consequent increasing rate of global
oil consumption have raised the attention on fuel prices and have caused serious problems to the
environment. Nowadays, the demand for reducing fuel consumption and pollutant emissions has
paved the way to the development of more efficient power generation systems for the
transportation sector. The lower fuel burning and pollutant emissions of hybrid electric vehicles
give a strong motivation and encourage further investigations in this field. This research aims to
investigate novel configurations, which could achieve further performance benefits for vehicle
powertrain. Automakers claim that the employment of a gas turbine operating as range extender
in a series hybrid configuration is the most efficiency solution in the coming years. In particular,
a Micro Gas Turbine (MGT) can be considered as an alternative to the internal combustion
engine (ICE) as a range extender for electric vehicles. The MGT produces less raw exhaust
gaseous emissions such as HC and CO and static applications compared to the ICE. In addition,
the MGT weight is lower than an equivalent ICE and potentially can reduce the level of CO2
especially in a vehicle application. This study presents a parametric study of MGT applications
for Range-Extended Electric Vehicle (REEV). The main objective is to examine the MGT
performance to meet the requirements for a REEV that could become competitive, in terms of
fuel consumption and pollutant emissions, to equivalent diesel or gasoline hybrid propulsion
units or to conventional diesel vehicle.
Keywords: Micro Gas Turbine; Range-Extended Electric Vehicle; Auxiliary Power Unit;
Specific Fuel Consumption; Exhaust Emissions
1 Introduction
The reduction of fuel consumption of passenger cars is a challenging goal. Many approaches that
promise to reduce the fuel consumption and the emissions of passenger cars have been presented
so far, and new ideas emerge on a regular basis [1, 2]. One technology currently available is the
electric vehicle, but their mass production is inhibited by a source of barriers. Range-Extended
Electric Vehicle (REEV) is a solution to the limited range and exorbitant cost of Battery Electric
Vehicles (BEVs). They operate essentially as a BEV until their batteries become depleted; at this
point they utilize an Auxiliary Power Unit (APU) that draws energy from liquid or gaseous fuel
and provides electricity, allowing the vehicle to continue operating [3-8]. The APU generally
only provides the average power demanded by the vehicle, so it can be downsized compared to
the power unit of a conventional vehicle. In addition, because the APU is decoupled from the
road load, its operation can be optimized to produce high efficiency and low exhaust emissions
[9-14]. Furthermore the main requirements of APU are compactness, lightweight to minimize the
vehicle efficiency penalty of carrying dead weight, low noise and vibration, inexpensive and
little maintenance. So the Micro Gas Turbines have the potential source to be an alternative APU
in the REEVs [15-21].
This work presents an assessment of a novel hybrid configuration comprising a MGT, a battery
pack, and a traction electric motor, focusing on its potential contribution to the reduction in fuel
burn and pollutant emissions. The main purpose of this study is to evaluate the MGT
performance through appropriate software to meet the requirements for a REEV that becomes
competitive in terms of performance to equivalent diesel or gasoline hybrid propulsion units or to
conventional diesel vehicle. The power required for the propulsion of the vehicle is provided by
the electric motor. The electric power is stored by the batteries, which are charged by a periodic
function of the MGT. The MGT starts up when the battery state of charge becomes lower than
20%, and its function continues until the battery reaches a state of charge of 80%. The
performance of the vehicle is investigated using a specific REEV model built in MATLAB®
software. The simulations are carried out using a quasi-static approach. The calculated
performances, in terms of fuel consumption and pollutant emissions, are compared with those of
an equivalent hybrid vehicle having a diesel engine (at the same power of the MGT) as APU, and
with the performances of a conventional diesel vehicle. The simulations are carried out also for
different fuels supplying the MGT and at different ambient temperatures, to show the MGT’s
operation limits at high ambient temperatures. The sensitivity of the results to the variation in the
vehicle parameters such as mass, and battery type is calculated to identify the conditions under
which the application of this hybrid technology offers potential benefits.
2 Modeling Approach
2.1 Vehicle and Powertrain Modeling
A generic in-house vehicle model was developed in this study, based on MATLAB®, to
predict the performance characteristics of various powertrain types of passenger vehicles. The
theoretical background of this model has been presented in previous studies [1, 12, 14]. Briefly,
the simulated vehicle is discretized on a number of sub-models (components) including vehicle
(body), electric motor/generator, battery, gearbox and thermal engine. Proper selection of the
components can result in the simulation of a conventional vehicle or a REEV. Inputs of the
model are the geometrical characteristics of the components as well as the driving conditions,
such as velocity and road slope angle versus time. At each time step, calculations of the vehicle
energy flow are performed on both ways, forward and backwards. Initially, calculations are
performed at a forward flow from wheel to tank, to calculate the required energy, while
backward calculations are performed to ensure that each component would never require higher
torque or power than that being able to be delivered by the respective component placed
upstream. The comparison between the conventional diesel vehicle and the MGT REEV is
performed by utilizing New European Driving Cycle (NEDC).
2.1.1 Powertrain Modeling
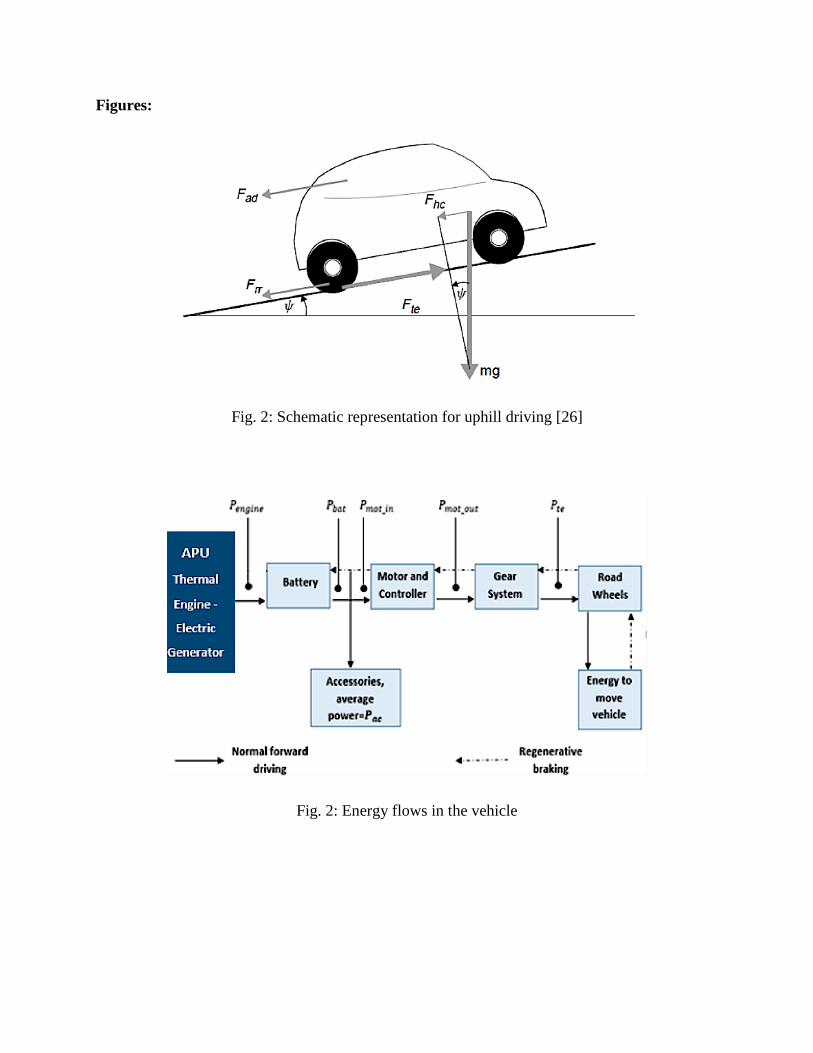
The first step to model vehicle performance is to calculate the tractive forces of the
vehicle for a given velocity and slope of angle driving profile. The forces which are applied on
the vehicle are rooted on rolling resistance, aerodynamic drag, road inclination and vehicle’s
acceleration, when velocity is changed. The sum of rolling resistance force (Eq. 1), aerodynamic
drag force (Eq. 2), gradeability driving force (Eq. 3), the acceleration force (Eq. 4) and the
angular acceleration force results the tractive effort at each time step (Eq. 5) [22-25].
𝐹𝑟𝑟 = 𝜇𝑟𝑟 ∙ 𝑚 ∙ 𝑔 (1)
𝐹𝑎𝑑 = (1 2)⁄ ∙ 𝜌 ∙ 𝐴 ∙ 𝐶𝑑 ∙ 𝑣2 (2)
𝐹ℎ𝑐 = 𝑚 ∙ 𝑔 ∙ sin(𝜓) (3)
𝐹𝑙𝑎 = 𝑚 ∙ 𝑎 (4)
𝐹𝑡𝑒 = 𝐹𝑟𝑟 + 𝐹𝑎𝑑 + 𝐹ℎ𝑐 + 𝐹𝑙𝑎 + 𝐹𝜔𝑎 (5)
The angular acceleration force 𝐹𝜔𝑎 is considered in this study as a 5% increase of the
acceleration force 𝐹𝑙𝑎 value. Fig. 1 schematically presents the forces acting on vehicle’s motion.
Fig. 1: Schematic representation for uphill driving [26]
The tractive effort power as well as the required power and angular speed (ω) of the
motor or engine are described in equations Eq. 6, Eq. 7 and Eq. 8 respectively. Finally, the mean
brake effective torque is calculated by Eq. 9:
𝑃𝑡𝑒 = 𝐹𝑡𝑒 ∙ 𝑣(𝑡) (6)
𝜔 = 𝐺 ∙𝑣(𝑡)
𝑟 (7)
𝑃𝑚𝑜𝑡_𝑜𝑢𝑡 =𝑃𝑡𝑒
𝜂𝐺 (8)
𝑇 =𝑃𝑚𝑜𝑡_𝑜𝑢𝑡
𝜔 (9)
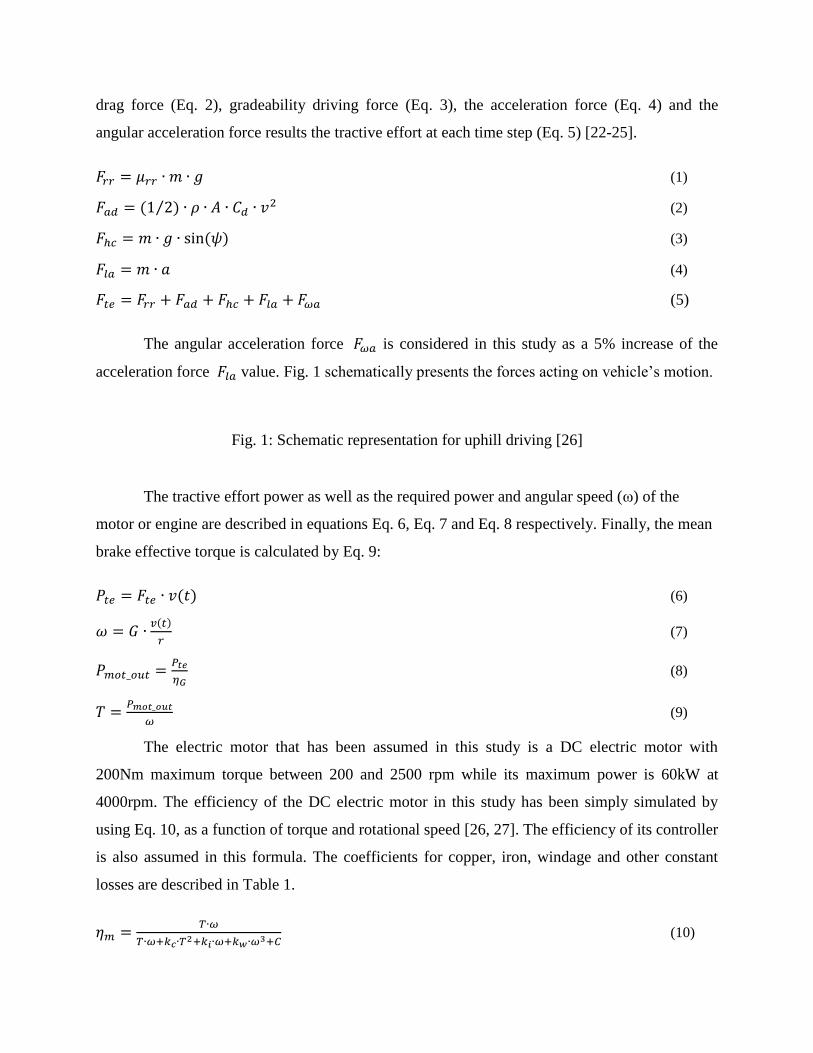
The electric motor that has been assumed in this study is a DC electric motor with
200Nm maximum torque between 200 and 2500 rpm while its maximum power is 60kW at
4000rpm. The efficiency of the DC electric motor in this study has been simply simulated by
using Eq. 10, as a function of torque and rotational speed [26, 27]. The efficiency of its controller
is also assumed in this formula. The coefficients for copper, iron, windage and other constant
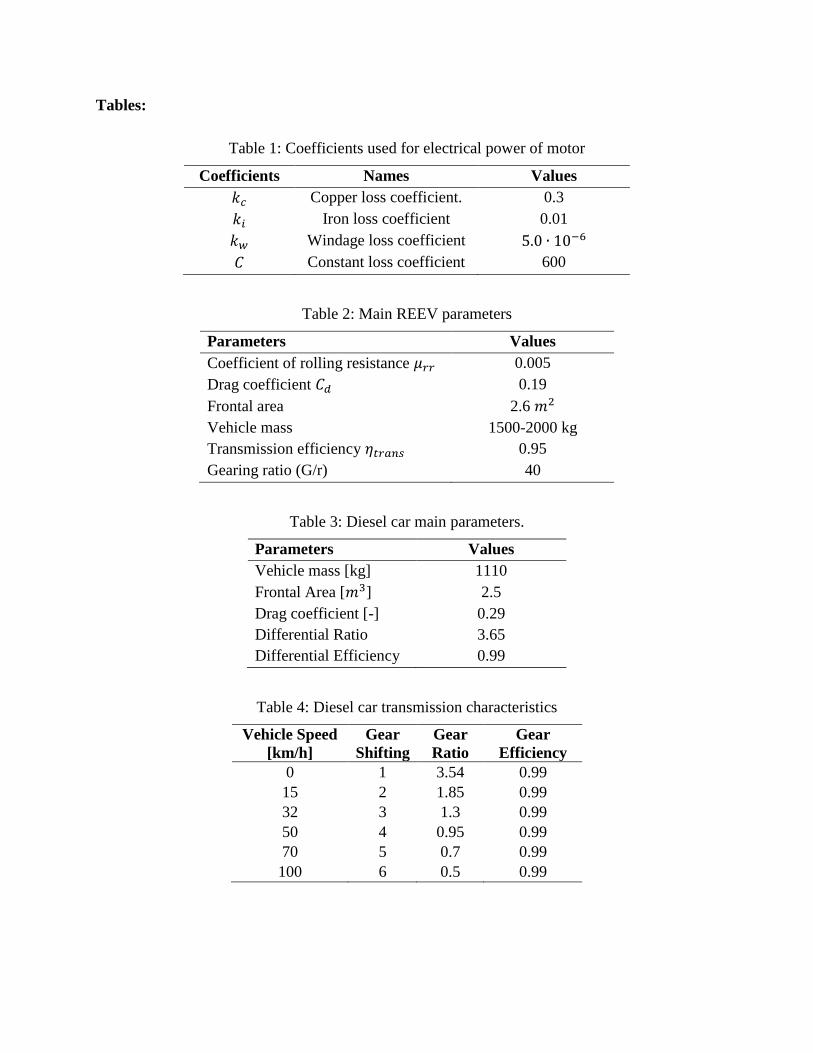
losses are described in Table 1.
𝜂𝑚 =𝑇∙𝜔
𝑇∙𝜔+𝑘𝑐∙𝑇2+𝑘𝑖∙𝜔+𝑘𝑤∙𝜔3+𝐶
(10)
Table 1: Coefficients used for electrical power of motor
During acceleration or breaking the electric machine operates either as an electric motor or a
generator (in the case of regenerative breaking) respectively. At each case, the required power is
described by Eq. 11 and Eq. 12 respectively.
𝑃𝑚𝑜𝑡_𝑖𝑛 =𝑃𝑚𝑜𝑡_𝑜𝑢𝑡
𝜂𝑚 (11)
𝑃𝑚𝑜𝑡_𝑖𝑛 = 𝑃𝑚𝑜𝑡_𝑜𝑢𝑡 ∙ 𝜂𝑚 (12)
The battery pack unit has been modeled by utilizing the well-established “equivalent
circuit model” [18, 28], while in this work the work a Nickel-Cadmium battery has been chosen.
The state of charge of a NiCad battery is described by some former researches [31, 32]. The
instantaneous current through the battery pack is calculated from the battery power [27]. The
latter is a sum of power consumption and generation by the motor, the vehicle auxiliaries and the
thermal engine as explained by Eq. 13. In this work, the vehicle auxiliaries were selected to be
equal 250 Watt.
𝑃𝑏𝑎𝑡 = 𝑃𝑚𝑜𝑡_𝑖𝑛 + 𝑃𝑎𝑐 − 𝑃𝑒𝑛𝑔𝑖𝑛𝑒 (13)
2.1.2 Range Extender Electric Vehicle
The mathematical vehicle model presented in the previous section has been employed to
simulate an indicative REEV. The model consists of a thermal engine, a battery pack, an electric
motor and a transmission gearbox, while the energy flow is schematically presented in Fig. 2.
The studied REEV was configured to be representative to already existing commercial range
extender vehicles and its respective model parameters as summarized in Table 2. The vehicle has
a single gear and its weight is higher to conventional vehicles, mainly due to the battery pack and
the complex powertrain system.
Table 2: Main REEV parameters
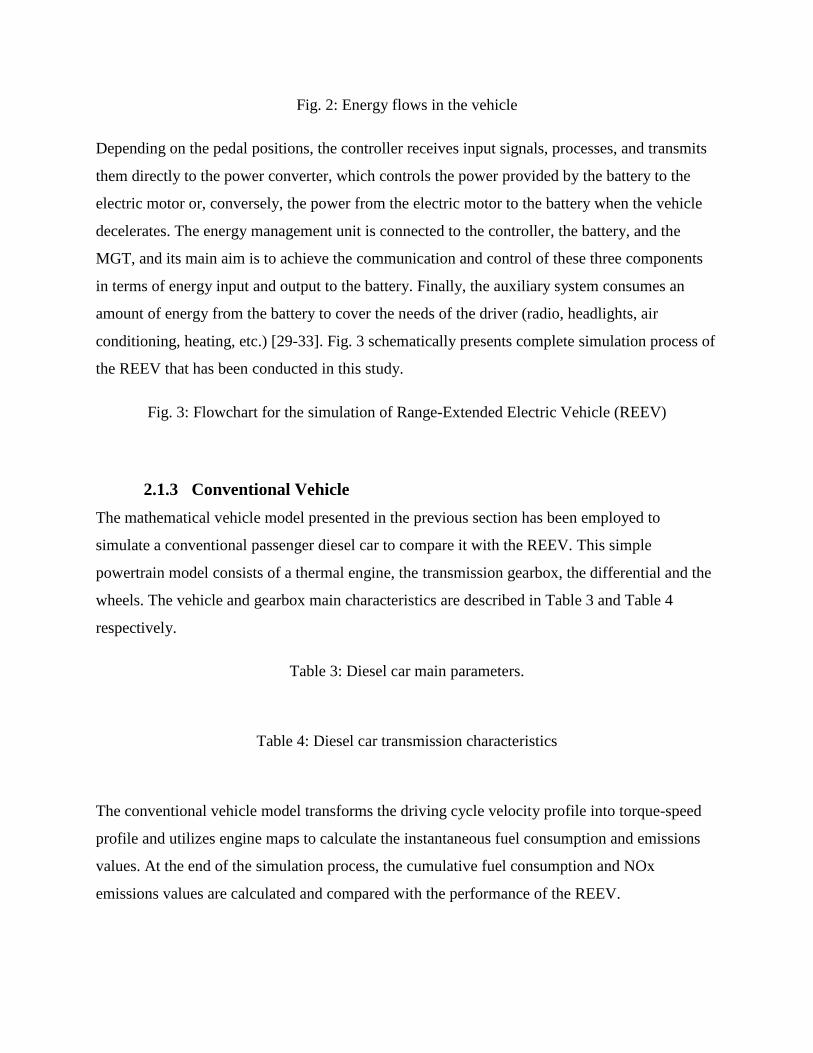
Fig. 2: Energy flows in the vehicle
Depending on the pedal positions, the controller receives input signals, processes, and transmits
them directly to the power converter, which controls the power provided by the battery to the
electric motor or, conversely, the power from the electric motor to the battery when the vehicle
decelerates. The energy management unit is connected to the controller, the battery, and the
MGT, and its main aim is to achieve the communication and control of these three components
in terms of energy input and output to the battery. Finally, the auxiliary system consumes an
amount of energy from the battery to cover the needs of the driver (radio, headlights, air
conditioning, heating, etc.) [29-33]. Fig. 3 schematically presents complete simulation process of
the REEV that has been conducted in this study.
Fig. 3: Flowchart for the simulation of Range-Extended Electric Vehicle (REEV)
2.1.3 Conventional Vehicle
The mathematical vehicle model presented in the previous section has been employed to
simulate a conventional passenger diesel car to compare it with the REEV. This simple
powertrain model consists of a thermal engine, the transmission gearbox, the differential and the
wheels. The vehicle and gearbox main characteristics are described in Table 3 and Table 4
respectively.
Table 3: Diesel car main parameters.
Table 4: Diesel car transmission characteristics
The conventional vehicle model transforms the driving cycle velocity profile into torque-speed
profile and utilizes engine maps to calculate the instantaneous fuel consumption and emissions
values. At the end of the simulation process, the cumulative fuel consumption and NOx
emissions values are calculated and compared with the performance of the REEV.
2.2 Micro Gas Turbine Modelling
Initially, it is required to build a model of Capstone C30 micro gas turbine, to simulate its
performances both in design point and in all its others operating points. The purpose is to build
the complete maps of MicroTurbine in order to predict its performances in all operating
conditions. Capstone C30 can be operated both with gaseous fuels and with liquid fuels, and its
performances change depending on the kind of fuel used. Firstly it is assumed to supply the
MicroTurbine by a gaseous fuel, in particular natural gas, which has the Low Heating Value
(LHV) = 46280 kJ/kg. After, the same procedure is performed by a liquid fuel, and for this case
only the main results will be presented. Table 5 represents performance of Capstone Model C30
MicroTurbine operated by natural gas fuel at full load power and ISO conditions (as Capstone
Turbine Corporation declares), which defines the cycle design point of the MGT chosen [30, 34-
40].
Table 5: MGT cycle design point claimed from Capstone Turbine Corporation
Starting from these data, using the commercial software called GASTURB11 (GasTurb11), the
model of this MGT at the design point is built. So, after calibration of the model, it is validated
comparing the values of design cycle point obtained from the software with the values declared
by Capstone Company at nominal point of Model C30 as represented in Table 6.
Table 6: Performance parameters comparison between simulated MGT and base Capstone MGT
The next step is to define the performances of the MGT in all its operating conditions. In other
terms, the complete operating maps of main parameters of MicroTurbine are built through an
Off-Design analysis of MicroTurbine using GASTURB11 software. Accordingly, the compressor
and turbine maps of the Capstone C30 are built by computerizing data existing in literature,
using the tools Smooth C and Smooth T. Once the design and the calculation of the maps are
implemented, it is possible to make the Off-Design analysis of MicroTurbine. The Off-Design is
followed by choosing only two parameters of MicroTurbine and making these two parameters
modified in a specific range of values, in accordance with the right operation of machine. Having
fixed all other parameters (in particular the ambient temperature), the performances of Capstone
C30 can be calculated varying the Turbine Inlet Temperature (T.I.T.) and the Relative Rotational
Speed (ratio between rotational speed and rotational speed at design point) into specific ranges
and with specific Step sizes, as shown in Table 7.
Table 7: Off-Design parameters analysis of MicroTurbine
The maximum of T.I.T. has been imposed in accordance with the materials resistance used for
the turbine, and this value of 1200 K is a good value for the common materials used. The results
of this Off-Design analysis are the performances of the MicroTurbine in all operating points
defined by the variation of the two parameters T.I.T. and relative rotational speed. Thanks to this
analysis, the complete operating maps of main operating parameters of C30 are plotted as
presented in Fig. 4 and Fig. 5.
Fig. 4: MGT C30 Thermal Efficiency Map
Fig. 5: MGT C30 Brake Specific Fuel Consumption (BSFC) Map
The calculation of the NOx emissions is not performed by GASTURB11, but by a more precious
and specific calculation code (MGTOFFDES Code). This code is created specifically for
simulating the combustion process of Capstone C30, so it takes account of the real main aspects
of the combustor of this MicroTurbine (geometry, air flow distribution) and the way in which the
combustion process evolves in time (the injection strategies). Fig. 6 and Fig. 7 illustrate the real
C30 combustion chamber for gaseous fuel, and the fuel injectors. The calculation code used for
the NOx emissions takes account of these real characteristics of the MGT.
Fig. 6: MGT C30 combustion chamber for gaseous fuel
Fig. 7: MGT C30 Fuel Injectors
The Model C30 MicroTurbine utilizes three pilot injector solenoids, and a single premix solenoid
to control fuel flow to the engine. Injector operation changes at different power levels:
Below 7 kW, the MicroTurbine operates with a single pilot injector.
From 7 kW to 22 kW, all three pilot injectors are switched on.
Above 22 kW, all three pilot solenoids are turned off, and the premix solenoid is
switched on.
So, starting from these real data, the calculation code enables us to calculate the NOx emissions,
both at design point and in all other operating points of the MGT, through an Off-Design
analysis, followed the theoretical approach as explained in Table 8.
Table 8: Theoretical approach developed through Off-Design procedure
The code is based on a Thermo-Kinetic model, linked to the extended Zel’dovich mechanism, for
the prediction of the thermal NO formation, whose development is briefly outlined bellows by
Eq. 14, Eq. 15, Eq. 16 and Eq. 17 [1, 13, 23]:
𝑂 +𝑁2 = 𝑁𝑂 + 𝑁 {𝑘𝑓1 = 7.6 ∗ 1013exp(−3800/𝑇)
𝑘𝑏1 = 1.6 ∗ 1013 (14)
𝑁 +𝑂2 = 𝑁𝑂 + 𝑂 {𝑘𝑓2 = 6.4 ∗ 109Texp(−3150/𝑇)
𝑘𝑏2 = 1.5 ∗ 109𝑇exp(−19500/𝑇) (15)
𝑁 + 𝑂𝐻 = 𝑁𝑂 + 𝐻 {𝑘𝑓3 = 4.1 ∗ 1013
𝑘𝑏3 = 2.0 ∗ 1014exp(−23650/𝑇) (16)
𝑑𝑥𝑖
𝑑𝑡= ∑ [𝑘𝑓𝑘∏ �̃�
𝑗
𝜁𝑓𝑘,𝑗 − 𝑘𝑏𝑘∏ �̃�𝑗
𝜁𝑏𝑘,𝑗7𝑗=1
7𝑗=1 ]3
𝑘=1 (𝑖 = 1,… . ,7) (17)
So, the results of this calculation procedure based on these models are illustrated in Fig. 8. It
should be noted that the code simulates correctly (as shown in Table 9) the combustion process
of the Capstone C30 for power levels above 22 kW, when all three pilot solenoids are turned off
and the premix solenoid is switched on.
Table 9: Prediction of dry NOx by simulation (MGTOFFDES Code)
Fig. 8: MGT C30 Emission Index NOx Map
The performances of Capstone C30 are investigated also varying the ambient temperature in a
specific range and it is focused on its influence on the main operating parameters of the MGT.
This analysis confirms that the MGT performance is greatly affected by its inlet air temperature,
tied to ambient temperature. In other terms it endorses a significant limitation on the application
of micro gas turbines, especially in hot climates (T = 303.15 K/313.15 K), is strongly dependent
of their performance, namely the power output and the thermal efficiency, on the ambient
conditions. This inherent disadvantage can be mitigated by the reduction of MGT compressor
inlet air temperature. This aspect is well represented in Fig.9 , obtained identifying, for each
ambient temperature, the performances (in terms of BSFC and NOx) of all operating points
which are on the lines of the maximum power obtainable from the MGT, at that specific ambient
temperature [41]. Increasing the ambient temperature, both the specific fuel consumption and the
NOx emissions move to higher values. Instead, for a specific ambient temperature, if the specific
fuel consumption increases, the NOx emissions decrease and vice versa. It is interesting to
analyze the vehicle performances at a higher ambient temperature, where the operating
conditions of the MGT are worse, in order to study this limit of the MGT in this application [42].
The operating point chosen for this analysis is shown in Fig. 9, and the MGT performances at
this point are listed in Table 10.
Fig. 9. Influence of ambient temperature and MGT operating point chosen
Table 10: MGT performance at the point chosen in Fig. 9
Certainly one of the most important aspects of the MGT is the “Fuel Flexibility”, so it is
interesting to study the performances of the Capstone C30, when it is fueled by another fuel, in
particular by Diesel fuel, using the same procedure followed for the case in which the MGT is
fueled by Natural gas. So, only the main results of this study are presented here as shown in Fig.
10 and Fig. 11.
Fig. 10. MGT C30 BSFC Map-Diesel
Fig. 11. MGT C30 NOx Emission Index Map-Diesel
2.3 Diesel Engine
The diesel engine used in this study is a 1.4L engine with maximum power 50kW at 3800 rpm
and maximum torque 180Nm at 2100 rpm while its fuel consumption and NOx operating maps
are presented at Fig. 12 and Fig. 13 respectively. It can be seen that there is a limited area where
BSFC is minimized at 230 g/kWh.
Fig 12. Diesel engine BSFC map
Fig 13. Diesel engine NOx map
3 Results & Discussion
3.1 Range-Extended Electric Vehicle with MGT Supplied by Natural Gas [MGT1]
Here the main simulation results of the REEV performances that have the Capstone Model C30
MicroTurbine as APU are presented. It is firstly analyzed the case in which the MGT is fueled by
natural gas working in its nominal point at full load power and ISO conditions. It is presumed to
calculate the CO emissions, and this information of Capstone C30 at operating conditions
described are taken from the technical reference by Capstone. Eq. 18, Eq. 19, Eq. 20, Eq. 21 and
Eq. 22 and used in order to have the NOx and CO cumulative emissions in [g], and the fuel mass
consumption in [kg], at the end of the whole process.
𝑁𝑂𝑥[𝑘𝑔 𝑠⁄ ] =𝑁𝑂𝑥[𝑝𝑝𝑚]∙𝑀𝑊𝑁𝑂𝑥∙𝐸𝑥ℎ𝑎𝑢𝑠𝑡𝑀𝑎𝑠𝑠𝐹𝑙𝑜𝑤[𝑘𝑔 𝑠⁄ ]
𝑀𝑊𝑒𝑥ℎ∙106 (18)
𝐶𝑂[𝑘𝑔 𝑠⁄ ] =𝐶𝑂[𝑝𝑝𝑚]∙𝑀𝑊𝐶𝑂∙𝐸𝑥ℎ𝑎𝑢𝑠𝑡𝑀𝑎𝑠𝑠𝐹𝑙𝑜𝑤[𝑘𝑔 𝑠⁄ ]
𝑀𝑊𝑒𝑥ℎ∙106
(19)
𝑁𝑂𝑥[𝑔] = (∫ 𝑁𝑂𝑥𝑡𝑒𝑛𝑔𝑖𝑛𝑒0
[𝑘𝑔 𝑠⁄ ] ∙ 𝑑𝑡) × 1000 (20)
𝐶𝑂[𝑔] = (∫ 𝐶𝑂𝑡𝑒𝑛𝑔𝑖𝑛𝑒0
[𝑘𝑔 𝑠⁄ ] ∙ 𝑑𝑡) × 1000 (21)
𝐹𝑢𝑒𝑙𝑚𝑎𝑠𝑠[𝑘𝑔] = ∫ 𝐹𝑢𝑒𝑙𝑐𝑜𝑛𝑠𝑢𝑚𝑝𝑡𝑖𝑜𝑛𝑡𝑒𝑛𝑔𝑖𝑛𝑒0
[𝑘𝑔 𝑠⁄ ] ∙ 𝑑𝑡 (22)
Where 𝑡𝑒𝑛𝑔𝑖𝑛𝑒 is the time for which the thermal engine is switched and MWNOx = 46 kg/kmol,
MWCO = 28 kg/kmol, MWexh = 29 kg/kmol. Fig. 14, Fig. 15, Fig. 16 and Fig. 17 represent the
main results of the whole simulation process (for 10 NEDCs).
Fig. 14: Power from/into Battery-Output Power of MGT vs. Time
Fig. 15: Power during a single NEDC in which the MGT is switched-off
Fig. 16: Power during a single NEDC in which the MGT is switched-on
Fig. 17: State of Charge (SOC) vs. Time
Fig. 17 shows that SOC decreases until it reaches the minimum value imposed equal to 0.2.
When this condition is reached, the MGT turns on and starts to charge the battery. In fact,
starting from this point, the battery SOC begins to increase almost linearly. The MGT is
switched on until the SOC of the battery reaches the maximum value imposed equal to 0.8.
When this condition is reached the battery is considered fully charged and the MGT turns off.
Table 11 shows the main vehicle performances at the end of the whole simulation process [20,
21, 40, 42-45].
Table 11: Major vehicle performances results from simulation of MGT1
4 Range-Extended Electric Vehicle with MGT Supplied by Natural Gas,
Operating at Higher Ambient Temperatures [MGT2]
Previously it was validated that the performances of the MicroTurbine become worse when the
ambient temperature increases, because the temperature of the compressor inlet air is higher.
This is an important limit of the potential of the MGT, so it is interesting to study the
disadvantages, the bad consequences, at which this limit can conduct in this specific application.
It assumed to simulate the vehicle performances at ambient temperature of 303.15 K, making the
MicroTurbine work at operating conditions defined from the point for which the BSFC has the
minimum value. The simulation results of this case are compared with the vehicle performances
in the case Ambient T = 288.15 K, in Table 12.
Table 12. Effect of different ambient temperature on performance of MGT2
As expected, the vehicle performances, in terms of fuel consumption and NOx emissions,
become worse when the ambient temperature increases.
5 Range-Extended Electric Vehicle with MGT Supplied by Diesel Oil [MGT3]
In this section the main simulation results of the REEV performance, with the MGT fueled by
diesel oil working in its nominal point at full load power and ISO conditions are presented in
Table 13. It can be clearly, in this case, seen that the nominal point of the MGT is different from
that seen for gaseous fuel. It is interesting to make the comparison between the vehicle
performances obtained with the MGT fueled by natural gas, and the vehicle performances
obtained with the MGT fueled by diesel.
Table 13. Major vehicle performances results from simulation; MGT2 vs. MGT3
6 Range-Extended Electric Vehicle with Diesel Engine (REVD)
In this section the simulation results of the REEV in which the APU is a diesel engine, instead of
the MGT, are presented in Table 14. Obviously it is necessary to choose a specific point on the
engine operating maps to define the operating conditions of the engine inside the vehicle. So, in
order to compare correctly the several proposed solutions, the operating point of the diesel
engine must be chosen in such a way as to have an output power close to the power of the MGT
that is around 30 kW.
Table 14. Major vehicle performances results; compression between MGT3 and REEV with
diesel engine
In particular an operating point on the power line of 30 kW for the best value of BSFC is
selected. The simulation procedure for studying the vehicle performances is the same used for
the case with MGT, so the simulation results, in terms of diagrams that show the trend of the
vehicle speed, covered distance, SOC, fuel consumption etc., during the time are very similar to
those ones previously seen. Here it is interesting to make the comparison between the vehicle
performances obtained coupling the battery pack to a diesel engine and the vehicle performances
when the APU is the MGT (fueled by diesel, so the fuel used for the two configurations is the
same) [28, 41, 42, 46].
7 Conventional Diesel Vehicle (CD)
In this section the simulation results for the conventional diesel vehicle, in terms of fuel
consumption and NOx cumulative emissions are shown and compared with the performances of
the range extender hybrid vehicle with diesel engine as seen in Table 15.
Table 15. Major vehicle performances results; compression between REEV with diesel engine
and conventional diesel vehicle
It is worth to mention that the simulation results of the conventional vehicle have to be
considered as indexes of the magnitude order of these parameters. In fact it can be expected that
the real values are higher than these ones obtained with the calculation seen, because of two
main approximations of the simulation process: the engine transient conditions and the cold-start
of the engine. So it can be expected that the real values of the vehicle performances are grater of
20-30 % than those ones shown in the table above.
8 Sensitivity Analysis
The main goal of this analysis is to study what impact the variation of the vehicle mass or the
battery capacity has on the performances of the REEV in terms of fuel consumption. The
analysis is made for the REEV with MGT fueled by natural gas. The results are shown in Fig. 18
and Fig. 19.
Fig. 18: Sensitivity analysis for the vehicle mass
Fig. 19: Sensitivity analysis for the battery capacity (Matlab)
Fig. 18 confirms what expected as the fuel consumption of the vehicle increases with the vehicle
mass. Fig. 19 shows that in the area of low values of the battery capacity, a small increase of this
one causes a significant decrease of the fuel consumption. Instead, going to high values of the
battery capacity, the fuel consumption is almost constant with it.
9 Conclusions
The main purpose of this work was to analyze the potential of Micro Gas Turbines (MGT) to be
used as Auxiliary Power Unit (APU) for Range-Extended Electric Vehicles (REEV). The work
presented an assessment of a novel hybrid configuration comprising a MGT, a battery pack, and
a traction electric motor, by mainly focusing the attention on its potential contribution to the
reduction in fuel consumption and pollutant emissions, respect to equivalent diesel or gasoline
hybrid propulsion units or to conventional diesel vehicle. Several cases study were defined and
simulated, so that a complete comparison among them can be outlined in Table 16.
Table 16. Overall comparable results of vehicle performances in different cases
If making reference to an average cost of the two fuels used, a short analysis of the costs can also
be made, as shown in Table 19. Fuel Cost-Natural gas: 0.981 €/kg and Fuel Cost-Diesel oil:
1.238 €/l.
Table 17. Average cost of Natural Gas and Diesel Oil fuels used in different cases
Both Tables 16 and Table 17 imply that the use of the MGT for REEV applications suggests
important and attractive results in terms of NOx and CO emissions. Instead, in terms of fuel
consumption, the competitiveness of this solution respect to the REEV with diesel engine and to
the conventional diesel vehicle, much depends on the operating conditions of the MGT and on
the fuel supplied. The sensitivity analysis outlines that the fuel consumption of the hybrid vehicle
with MGT is much influenced also by the vehicle mass and the battery capacity. It has been also
showed the strong influence of the ambient temperature on the MGT performances, and the case
study MGT2 outlines the impact of this limit of the MGT on the performances of the whole
vehicle. At last, it is interesting to present possible and attractive future developments of the
technology proposed and of the research work:
The sensitivity of the results, in terms of fuel consumption and NOx emissions, to the
battery capacity means that improvements of this characteristic will lead better
performances of the technology proposed and analyzed.
The approach and the method used for calculating the vehicle performances can be
improved, attempting to simulate the transient conditions of the engine in the
conventional vehicle and also to include Worldwide Harmonized Light Vehicle Test
Procedure (WLTP) beside of NEDC test procedure.
As already said, it could be interesting to analyze the influence of the ambient
temperature also on the performances of the MGT supplied with diesel oil.
The REEV technology with MGT is certainly an interesting solution, in the transition to
the “fully electric vehicle”, which will be a real alternative to the conventional diesel or
gasoline vehicles only when it will be possible to charge the battery on the board in a
suitable way at electric charging stations.
References
[1] Guzzella L, Sciarretta A, Springer-Verlag Gmb H. Vehicle Propulsion Systems Introduction
to Modeling and Optimization. Berlin: Springer Berlin, 2015.
[2] Tuccillo R. Performance and transient behaviour of MTG based energy systems. VKI/LS on
“Micro Gas Turbines,” RTO-MP-AVT-131. 2005.
[3] Arav B, Shulman R, Dooun V. Basic Concepts for Forcing of Low-Power Micro Turbine
Generators. Procedia Engineering. 2016;150:1384-90.
[4] Arav BL, Shulman R, Kozminykh VA. Refinement of Hybrid Motor-transmission Set Using
Micro Turbine Generator. Procedia Engineering. 2015;129:166-70.
[5] Christodoulou F, Giannakakis P, Kalfas AI. Performance Benefits of a Portable Hybrid
Micro-Gas Turbine Power System for Automotive Applications. Journal of Engineering for Gas
Turbines and Power. 2010;133(2):022301--8.
[6] Feneley AJ, Pesiridis A, Mahmoudzadeh Andwari A. Variable Geometry Turbocharger
Technologies for Exhaust Energy Recovery and Boosting‐ A Review. Renewable and
Sustainable Energy Reviews. 2017;71:959-75.
[7] Ghanaati A, Mat Darus IZ, Farid M, Said M, Mahmoudzadeh Andwari A. A Mean Value
Model For Estimation Of Laminar And Turbulent Flame Speed In Spark-Ignition Engine.
International Journal of Automotive and Mechanical EngineeringOnline. 2015;11:2229-8649.
[8] Mahmoudzadeh Andwari A, Pesiridis A, Karvountzis-Kontakiotis A, Esfahanian V. Hybrid
electric vehicle performance with organic rankine cycle waste heat recovery system. Appl Sci.
2017;7(5).
[9] Mahmoudzadeh Andwari A, Pesiridis A, Esfahanian V, Salavati-Zadeh A, Karvountzis-
Kontakiotis A, Muralidharan V. A Comparative Study of the Effect of Turbocompounding and
ORC Waste Heat Recovery Systems on the Performance of a Turbocharged Heavy-Duty Diesel
Engine. Energies. 2017;10(8):1087.
[10] Mahmoudzadeh Andwari A, Pesiridis A, Rajoo S, Martinez-Botas R, Esfahanian V. A
review of Battery Electric Vehicle technology and readiness levels. Renewable and Sustainable
Energy Reviews. 2017;78:414-30.
[11] Spentzas SN. Benefits and Applications of Small-scale and Micro-CHP Systems.
Cogeneration & Distributed Generation Journal. 2008;23(2):6-34.
[12] Tuccillo R, Cameretti MC. Combustion and Combustors for MGT Applications. Micro Gas
Turbines. 2005:1-56.
[13] Turkeli-Ramadan Z, Sharma RN, Raine RR. Experimental Study on Flat Flame Combustion
for Ultra Micro Gas Turbine Applications. Combustion Science and Technology.
2017;189(8):1307-25.
[14] Yamada T, Asako Y. Scale Effect on Gaseous Flow around a Micro-Scaled Gas Turbine
Blade. Heat Transfer Engineering. 2007;28(8-9):696-703.
[15] Abagnale C, Cameretti MC, De Robbio R, Tuccillo R. CFD Study of a MGT Combustor
Supplied with Syngas. Energy Procedia. 2016;101:933-40.
[16] Almasi A. Bright future of micro-turbines: Nuclear emergency cooling and miniature
generator. Australian Journal of Mechanical Engineering. 2013;11(2):169-75.
[17] Bakalis DP, Stamatis AG. Performance Simulation of a Hybrid Micro Gas Turbine Fuel
Cell System Based on Existing Components. 2011(54648):171-9.
[18] Chen L, Zhang W, Sun F. Thermodynamic optimization for an open cycle of an externally
fired micro gas turbine (EFmGT). Part 1: Thermodynamic modelling. International Journal of
Sustainable Energy. 2011;30(4):246-56.
[19] Mahmoudzadeh Andwari A, Aziz AA, Muhamad Said MF, Abdul Latiff Z. Controlled
Auto-Ignition Combustion in a Two-Stroke Cycle Engine Using Hot Burned Gases. Applied
Mechanics and Materials. 2013;388:201-5.
[20] Mahmoudzadeh Andwari A, Aziz AA, Said MFM, Latiff ZA. A Converted Two-Stroke
Cycle Engine for Compression Ignition Combustion. Applied Mechanics and Materials.
2014;663:331-5.
[21] Mahmoudzadeh Andwari A, Aziz AA, Said MFM, Latiff ZA. Experimental investigation of
the influence of internal and external EGR on the combustion characteristics of a controlled auto-
ignition two-stroke cycle engine. Applied Energy. 2014;134:1-10.
[22] Harrison J. Micro combined heat and power (CHP) systems for residential and small
commercial buildings A2 - Beith, Robert. Small and Micro Combined Heat and Power (CHP)
Systems: Woodhead Publishing; 2011. p. 325-46.
[23] Judge AW. Small Gas Turbines And Free Piston Engines: Springer US, 1960.
[24] Jurado F, Ortega M, Cano A. Predictive Control of Matrix Converter-based Micro-turbine.
Electric Power Components and Systems. 2008;36(4):409-31.
[25] Lee YB, Kwak HD, Kim CH, Jang GH. Analysis of Gas-Lubricated Bearings with a
Coupled Boundary Effect for Micro Gas Turbine. Tribology Transactions. 2001;44(4):685-91.
[26] Larminie J, Lowry J. Electric Vehicle Technology Explained: John Wiley & Sons, Inc.,
2004.
[27] Larminie J, Lowry J. Electric Vehicle Technology Explained, Second Edition. Second
Edition ed: John Wiley & Sons, Inc. , 2012.
[28] Riffat SB, Zhao X, Doherty PS. Investigation of the flow in an impulse micro turbine using
numerical CFD predictions and laboratory testing. International Journal of Ambient Energy.
2002;23(4):171-8.
[29] Comodi G, Renzi M, Caresana F, Pelagalli L. Limiting the Effect of Ambient Temperature
on Micro Gas Turbines (MGTs) Performance Through Inlet Air Cooling (IAC) Techniques: An
Experimental Comparison between Fogging and Direct Expansion. Energy Procedia.
2015;75:1172-7.
[30] Corporation CT. Technical Reference Capstone Model C30 Performance. USA: Capstone
Turbine Corporation; 2006.
[31] De Paepe W, Sayad P, Bram S, Klingmann J, Contino F. Experimental Investigation of the
Effect of Steam Dilution on the Combustion of Methane for Humidified Micro Gas Turbine
Applications. Combustion Science and Technology. 2016;188(8):1199-219.
[32] Hu X, Li S, Peng H. A comparative study of equivalent circuit models for Li-ion batteries.
Journal of Power Sources. 2012;198(Supplement C):359-67.
[33] Huang WS, Tzeng KE, Cheng MC, Huang RS. A silicon mems micro power generator for
wearable micro devices. Journal of the Chinese Institute of Engineers. 2007;30(1):133-40.
[34] Giovannoni V, Sharma RN, Raine RR. Thermal Performances of a Small Scale
Regenerative Combustion Chamber for Ultra Micro Gas Turbine. Combustion Science and
Technology. 2017:null-null.
[35] Gopisetty S, Treffinger P. Generic Combined Heat and Power (CHP) Model for the Concept
Phase of Energy Planning Process. Energies. 2017;10(1):11.
[36] Mahmoudzadeh Andwari A, Abdul Aziz A, Muhamad Said MF, Abdul Latiff Z. An
experimental study on the influence of EGR rate and fuel octane number on the combustion
characteristics of a CAI two-stroke cycle engine. Applied Thermal Engineering. 2014;71(1):248-
58.
[37] Mahmoudzadeh Andwari A, Aziz AA, Said MFM, Latiff ZA, Ghanaati A. Influence Of Hot
Burned Gas Utilization On The Exhaust Emission Characteristics Of A Controlled Auto-Ignition
Two-Stroke Cycle Engine. International Journal of Automotive and Mechanical
EngineeringOnline. 2015;11:2229-8649.
[38] Said MFM, Aziz ABA, Latiff ZA, Mahmoudzadeh Andwari A, Soid SNM. Investigation of
Cylinder Deactivation (CDA) Strategies on Part Load Conditions. SAE Technical Paper 2014-
01-2549. 2014.
[39] Sim K, Koo B, Kim CH, Kim TH. Development and performance measurement of micro-
power pack using micro-gas turbine driven automotive alternators. Applied Energy.
2013;102:309-19.
[40] Sogut MZ. Exergetic Irreversibility and Sustainability Performances for Alternative Fuels in
the Micro-Turbojet Engine. International Journal of Green Energy. 2017:1-12.
[41] Mozafari A, Ehyaei MA. Effects of Regeneration Heat Exchanger on Entropy, Electricity
Cost, and Environmental Pollution Produced by Micro Gas Turbine System. International
Journal of Green Energy. 2012;9(1):51-70.
[42] Rahman MM, Ibrahim TK, Kadirgama K, Mamat R, Bakar RA. Influence of Operation
Conditions and Ambient Temperature on Performance of Gas Turbine Power Plant. Advanced
Materials Research. 2011;189-193:3007-13.
[43] Jiang L, Zhao D, Yamashita H. Study on a Lower Heat Loss Micro Gas Turbine Combustor
with Porous Inlet. Combustion Science and Technology. 2015;187(9):1376-91.
[44] Kulshreshtha DB, Channiwala SA. Hydrogen Fuelled Micro Gas Turbine Combustion
Chamber. HKIE Transactions. 2011;18(2):19-25.
[45] Mahmoudzadeh Andwari A, Azhar AA. Homogenous Charge Compression Ignition (HCCI)
Technique: A Review for Application in Two-Stroke Gasoline Engines. Applied Mechanics and
Materials. 2012;165:53-7.
[46] Ribau J, Silva C, Brito FP, Martins J. Analysis of four-stroke, Wankel, and microturbine
based range extenders for electric vehicles. Energy Conversion and Management. 2012;58:120-
33.
Tables:
Table 1: Coefficients used for electrical power of motor
Coefficients Names Values
𝑘𝑐 Copper loss coefficient. 0.3
𝑘𝑖 Iron loss coefficient 0.01
𝑘𝑤 Windage loss coefficient 5.0 ∙ 10−6
𝐶 Constant loss coefficient 600
Table 2: Main REEV parameters
Parameters Values
Coefficient of rolling resistance 𝜇𝑟𝑟 0.005
Drag coefficient 𝐶𝑑 0.19
Frontal area 2.6 𝑚2
Vehicle mass 1500-2000 kg
Transmission efficiency 𝜂𝑡𝑟𝑎𝑛𝑠 0.95
Gearing ratio (G/r) 40
Table 3: Diesel car main parameters.
Parameters Values
Vehicle mass [kg] 1110
Frontal Area [𝑚3] 2.5
Drag coefficient [-] 0.29
Differential Ratio 3.65
Differential Efficiency 0.99
Table 4: Diesel car transmission characteristics
Vehicle Speed
[km/h]
Gear
Shifting
Gear
Ratio
Gear
Efficiency
0 1 3.54 0.99
15 2 1.85 0.99
32 3 1.3 0.99
50 4 0.95 0.99
70 5 0.7 0.99
100 6 0.5 0.99
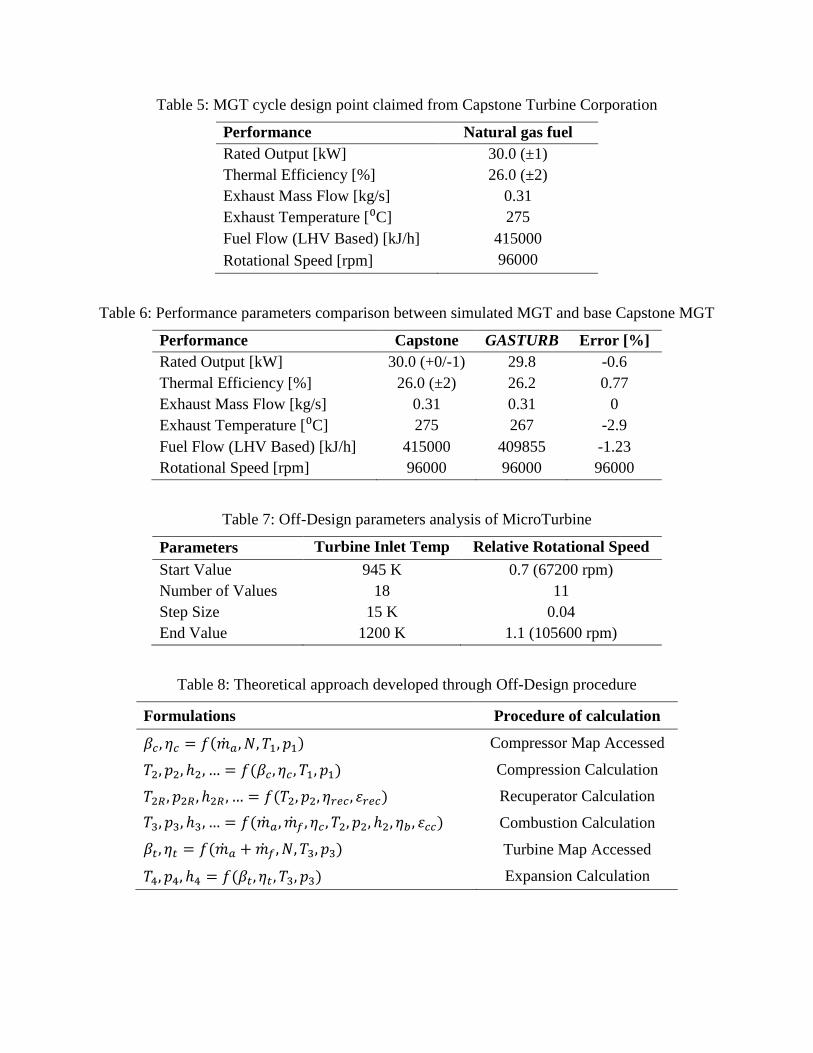
Table 5: MGT cycle design point claimed from Capstone Turbine Corporation
Performance Natural gas fuel
Rated Output [kW] 30.0 (±1)
Thermal Efficiency [%] 26.0 (±2)
Exhaust Mass Flow [kg/s] 0.31
Exhaust Temperature [⁰C] 275
Fuel Flow (LHV Based) [kJ/h] 415000
Rotational Speed [rpm] 96000
Table 6: Performance parameters comparison between simulated MGT and base Capstone MGT
Performance Capstone GASTURB Error [%]
Rated Output [kW] 30.0 (+0/-1) 29.8 -0.6
Thermal Efficiency [%] 26.0 (±2) 26.2 0.77
Exhaust Mass Flow [kg/s] 0.31 0.31 0
Exhaust Temperature [⁰C] 275 267 -2.9
Fuel Flow (LHV Based) [kJ/h] 415000 409855 -1.23
Rotational Speed [rpm] 96000 96000 96000
Table 7: Off-Design parameters analysis of MicroTurbine
Parameters Turbine Inlet Temp Relative Rotational Speed
Start Value 945 K 0.7 (67200 rpm)
Number of Values 18 11
Step Size 15 K 0.04
End Value 1200 K 1.1 (105600 rpm)
Table 8: Theoretical approach developed through Off-Design procedure
Formulations Procedure of calculation
𝛽𝑐, 𝜂𝑐 = 𝑓(�̇�𝑎, 𝑁, 𝑇1, 𝑝1) Compressor Map Accessed
𝑇2, 𝑝2, ℎ2, … = 𝑓(𝛽𝑐, 𝜂𝑐 , 𝑇1, 𝑝1) Compression Calculation
𝑇2𝑅 , 𝑝2𝑅 , ℎ2𝑅 , … = 𝑓(𝑇2, 𝑝2, 𝜂𝑟𝑒𝑐 , 𝜀𝑟𝑒𝑐) Recuperator Calculation
𝑇3, 𝑝3, ℎ3, … = 𝑓(�̇�𝑎, �̇�𝑓 , 𝜂𝑐 , 𝑇2, 𝑝2, ℎ2, 𝜂𝑏 , 𝜀𝑐𝑐) Combustion Calculation
𝛽𝑡, 𝜂𝑡 = 𝑓(�̇�𝑎 + �̇�𝑓 , 𝑁, 𝑇3, 𝑝3) Turbine Map Accessed
𝑇4, 𝑝4, ℎ4 = 𝑓(𝛽𝑡, 𝜂𝑡 , 𝑇3, 𝑝3) Expansion Calculation
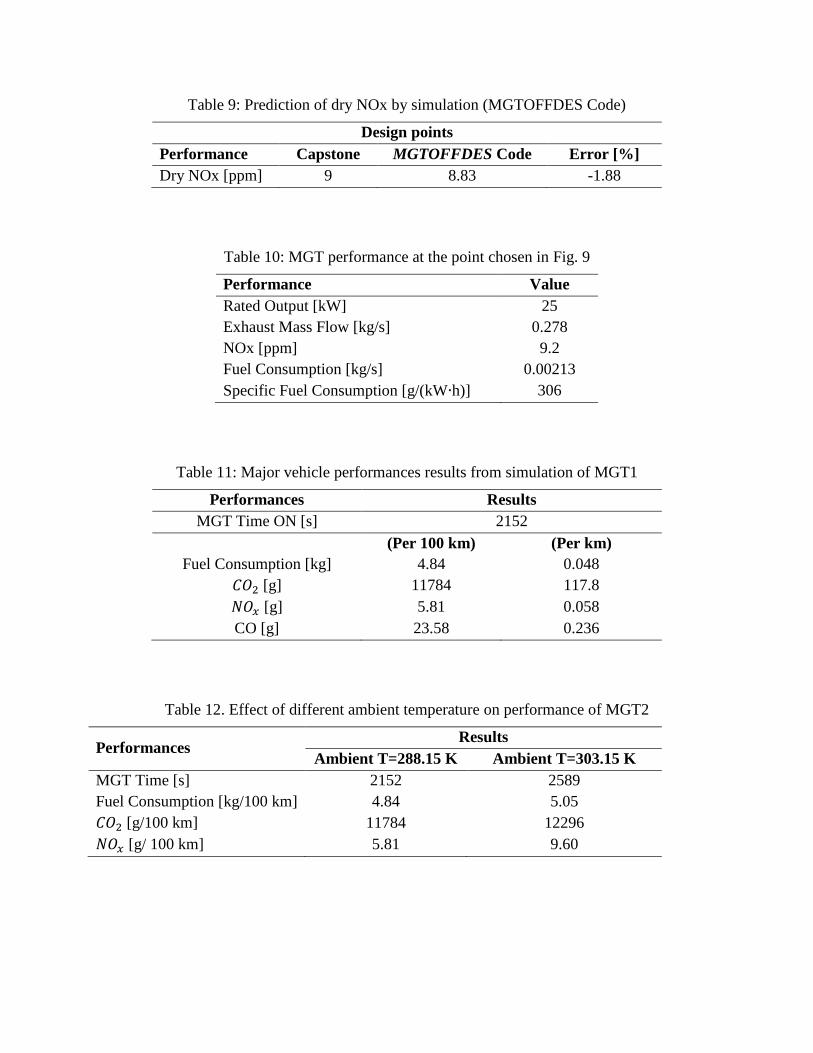
Table 9: Prediction of dry NOx by simulation (MGTOFFDES Code)
Design points
Performance Capstone MGTOFFDES Code Error [%]
Dry NOx [ppm] 9 8.83 -1.88
Table 10: MGT performance at the point chosen in Fig. 9
Performance Value
Rated Output [kW] 25
Exhaust Mass Flow [kg/s] 0.278
NOx [ppm] 9.2
Fuel Consumption [kg/s] 0.00213
Specific Fuel Consumption [g/(kW∙h)] 306
Table 11: Major vehicle performances results from simulation of MGT1
Performances Results
MGT Time ON [s] 2152
(Per 100 km) (Per km)
Fuel Consumption [kg] 4.84 0.048
𝐶𝑂2 [g] 11784 117.8
𝑁𝑂𝑥 [g] 5.81 0.058
CO [g] 23.58 0.236
Table 12. Effect of different ambient temperature on performance of MGT2
Performances Results
Ambient T=288.15 K Ambient T=303.15 K
MGT Time [s] 2152 2589
Fuel Consumption [kg/100 km] 4.84 5.05
𝐶𝑂2 [g/100 km] 11784 12296
𝑁𝑂𝑥 [g/ 100 km] 5.81 9.60
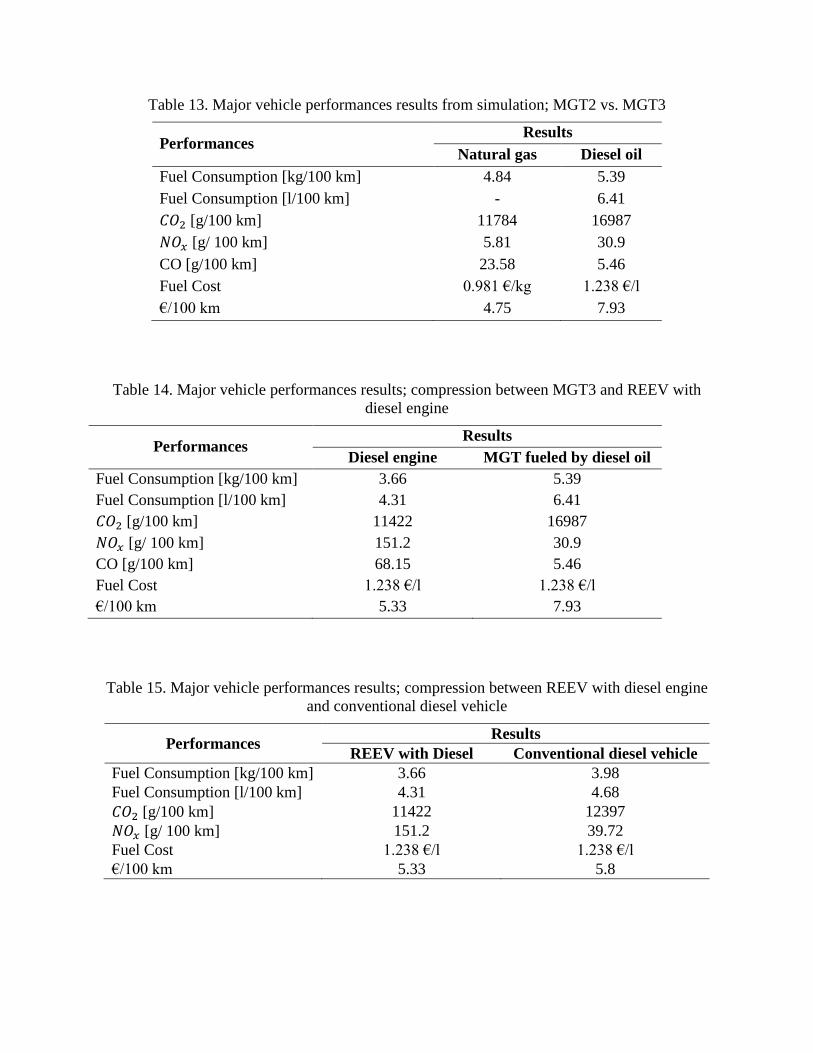
Table 13. Major vehicle performances results from simulation; MGT2 vs. MGT3
Performances Results
Natural gas Diesel oil
Fuel Consumption [kg/100 km] 4.84 5.39
Fuel Consumption [l/100 km] - 6.41
𝐶𝑂2 [g/100 km] 11784 16987
𝑁𝑂𝑥 [g/ 100 km] 5.81 30.9
CO [g/100 km] 23.58 5.46
Fuel Cost 0.981 €/kg 1.238 €/l
€/100 km 4.75 7.93
Table 14. Major vehicle performances results; compression between MGT3 and REEV with
diesel engine
Performances Results
Diesel engine MGT fueled by diesel oil
Fuel Consumption [kg/100 km] 3.66 5.39
Fuel Consumption [l/100 km] 4.31 6.41
𝐶𝑂2 [g/100 km] 11422 16987
𝑁𝑂𝑥 [g/ 100 km] 151.2 30.9
CO [g/100 km] 68.15 5.46
Fuel Cost 1.238 €/l 1.238 €/l
€/100 km 5.33 7.93
Table 15. Major vehicle performances results; compression between REEV with diesel engine
and conventional diesel vehicle
Performances Results
REEV with Diesel Conventional diesel vehicle
Fuel Consumption [kg/100 km] 3.66 3.98
Fuel Consumption [l/100 km] 4.31 4.68
𝐶𝑂2 [g/100 km] 11422 12397
𝑁𝑂𝑥 [g/ 100 km] 151.2 39.72
Fuel Cost 1.238 €/l 1.238 €/l
€/100 km 5.33 5.8
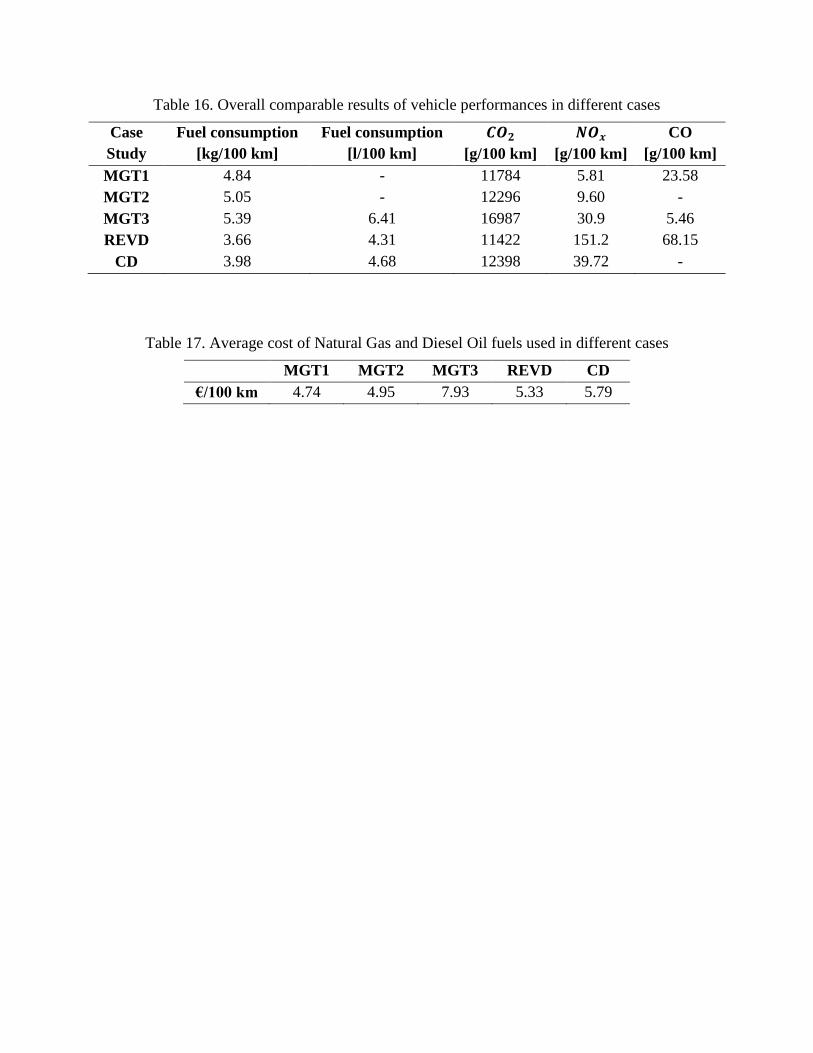
Table 16. Overall comparable results of vehicle performances in different cases
Case
Study
Fuel consumption
[kg/100 km]
Fuel consumption
[l/100 km]
𝑪𝑶𝟐
[g/100 km]
𝑵𝑶𝒙
[g/100 km]
CO
[g/100 km]
MGT1 4.84 - 11784 5.81 23.58
MGT2 5.05 - 12296 9.60 -
MGT3 5.39 6.41 16987 30.9 5.46
REVD 3.66 4.31 11422 151.2 68.15
CD 3.98 4.68 12398 39.72 -
Table 17. Average cost of Natural Gas and Diesel Oil fuels used in different cases
MGT1 MGT2 MGT3 REVD CD
€/100 km 4.74 4.95 7.93 5.33 5.79
Figures:
Fig. 2: Schematic representation for uphill driving [26]
Fig. 2: Energy flows in the vehicle

Fig. 3: Flowchart for the simulation of Range-Extended Electric Vehicle (REEV)
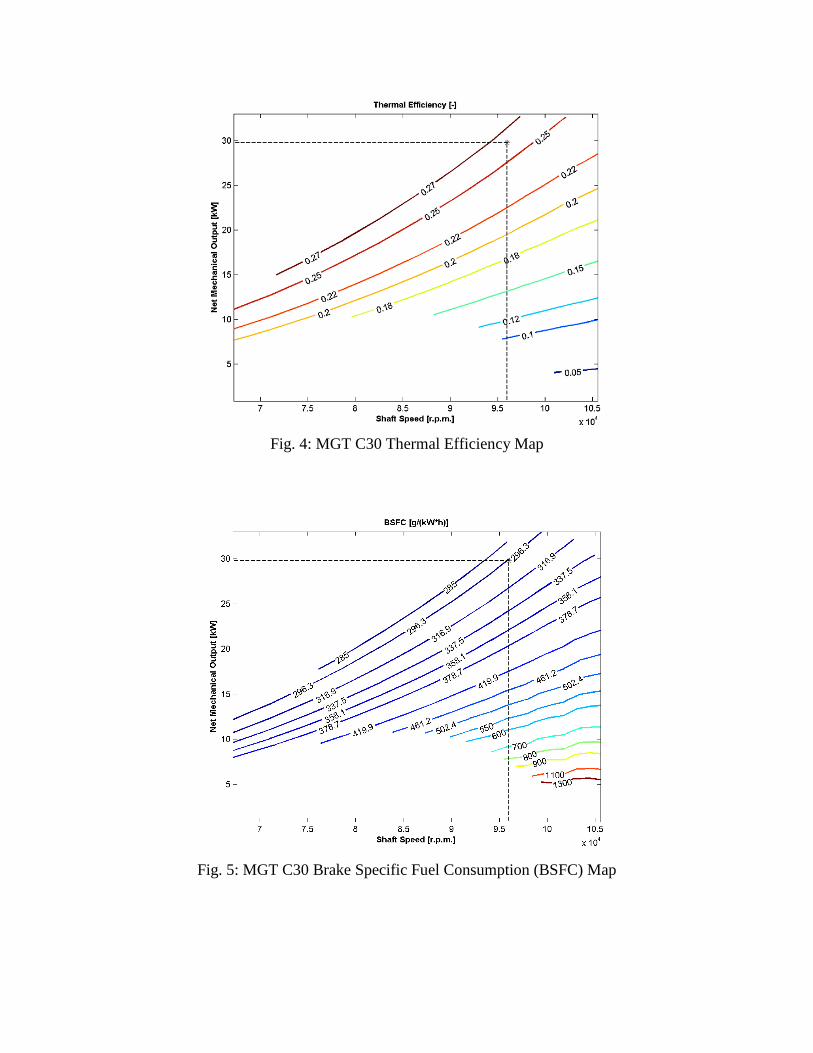
Fig. 4: MGT C30 Thermal Efficiency Map
Fig. 5: MGT C30 Brake Specific Fuel Consumption (BSFC) Map
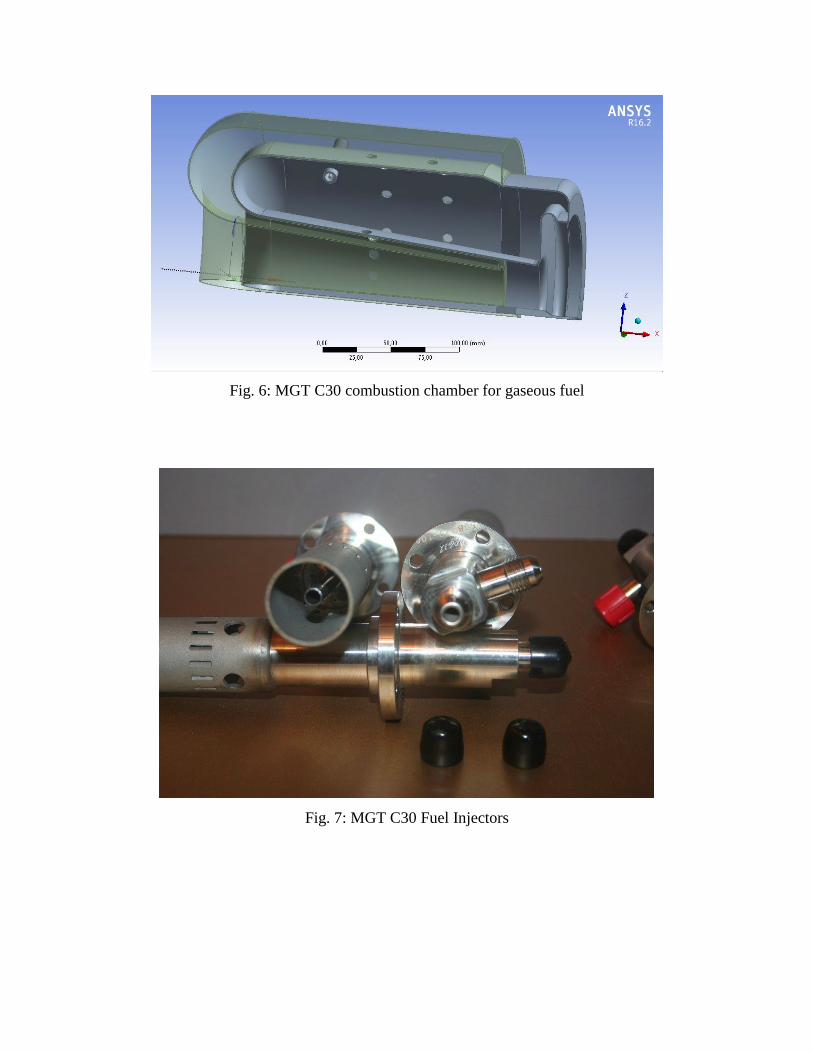
Fig. 6: MGT C30 combustion chamber for gaseous fuel
Fig. 7: MGT C30 Fuel Injectors
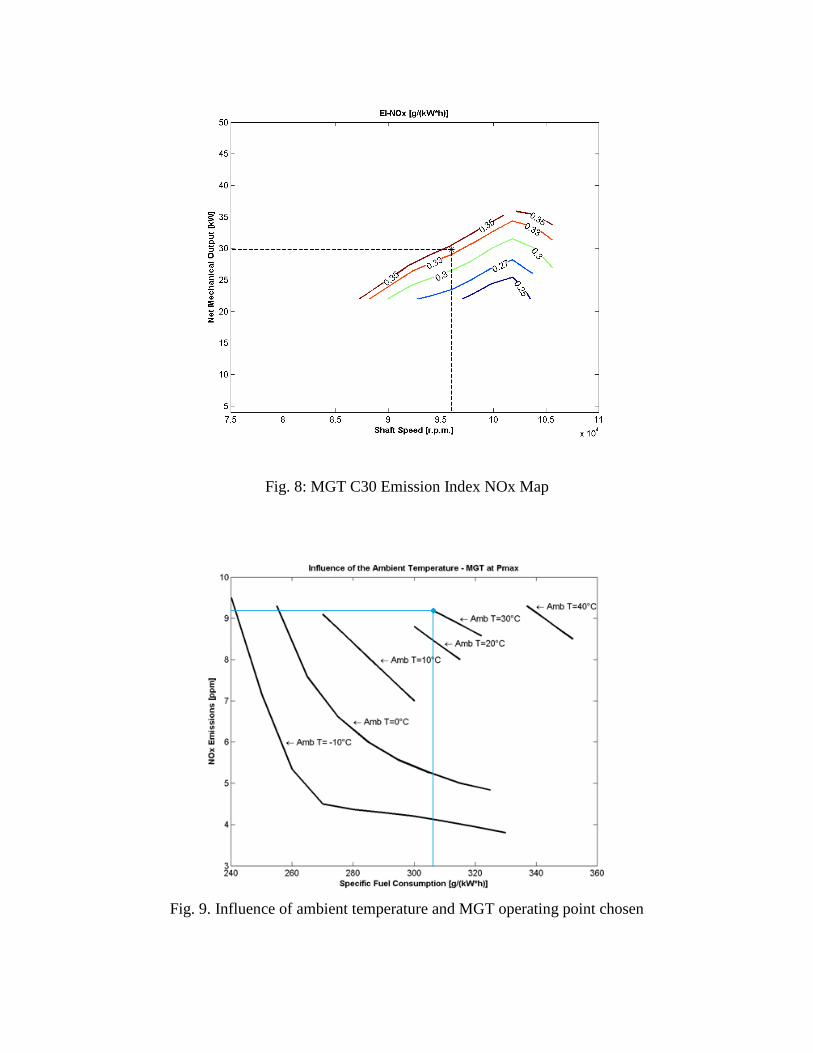
Fig. 8: MGT C30 Emission Index NOx Map
Fig. 9. Influence of ambient temperature and MGT operating point chosen
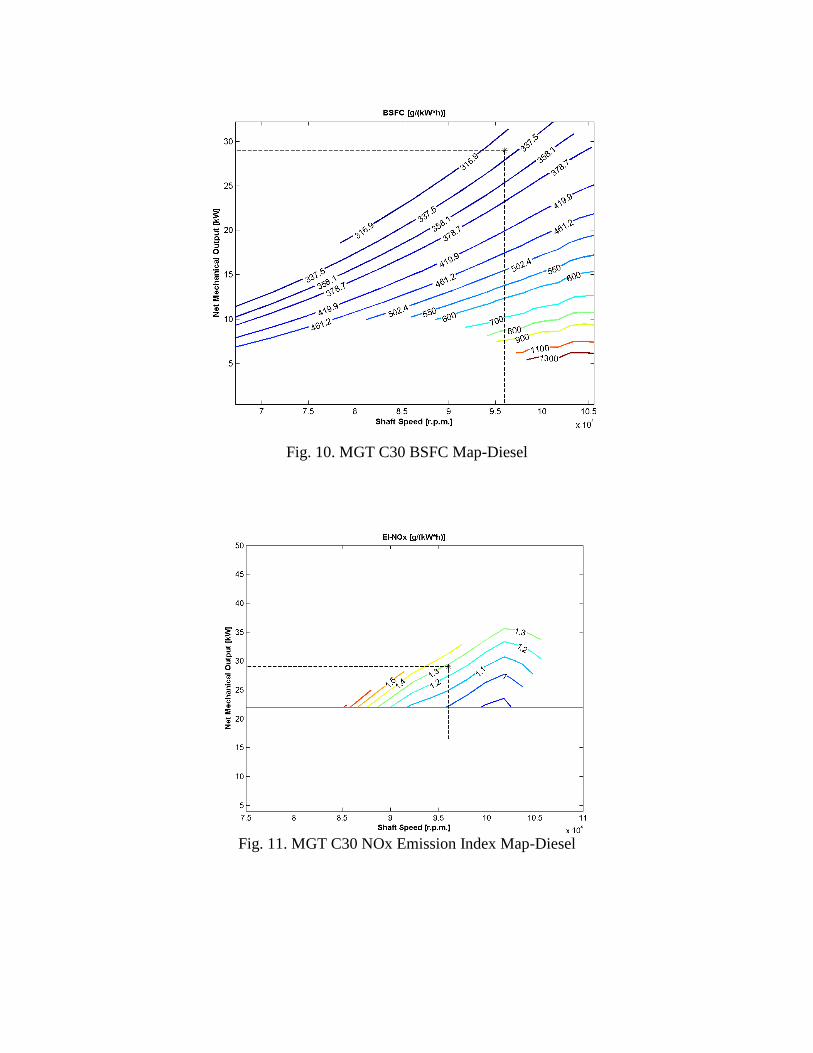
Fig. 10. MGT C30 BSFC Map-Diesel
Fig. 11. MGT C30 NOx Emission Index Map-Diesel
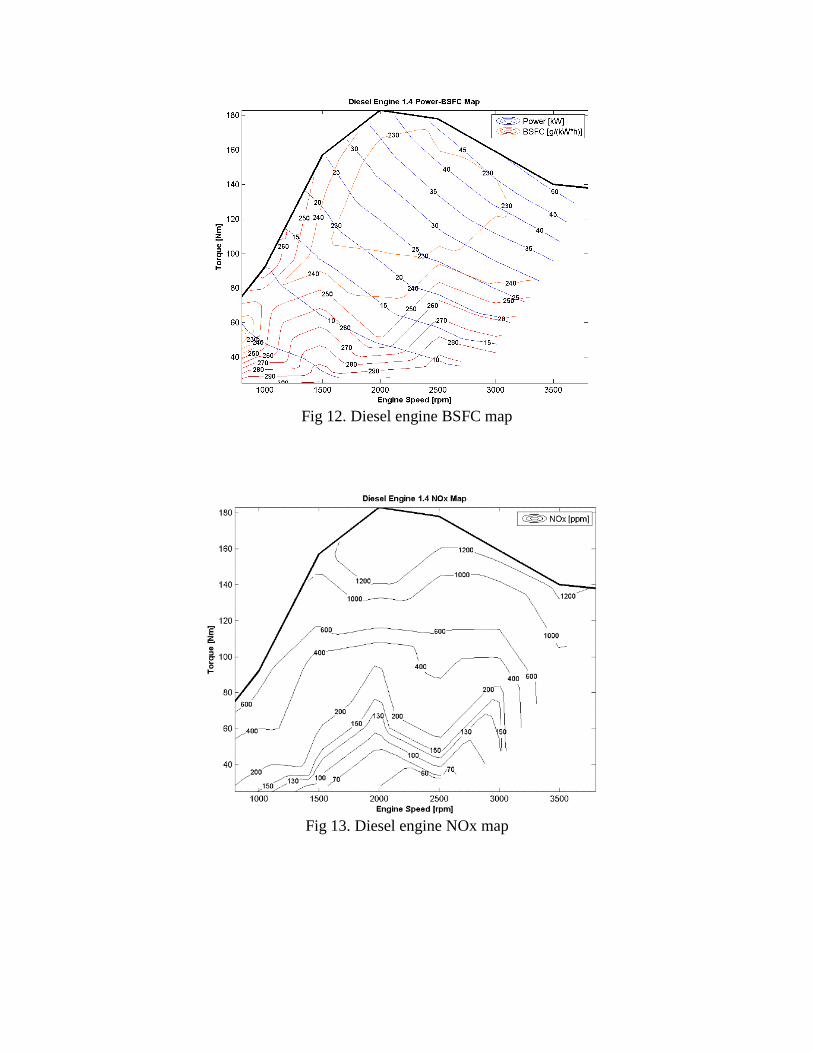
Fig 12. Diesel engine BSFC map
Fig 13. Diesel engine NOx map
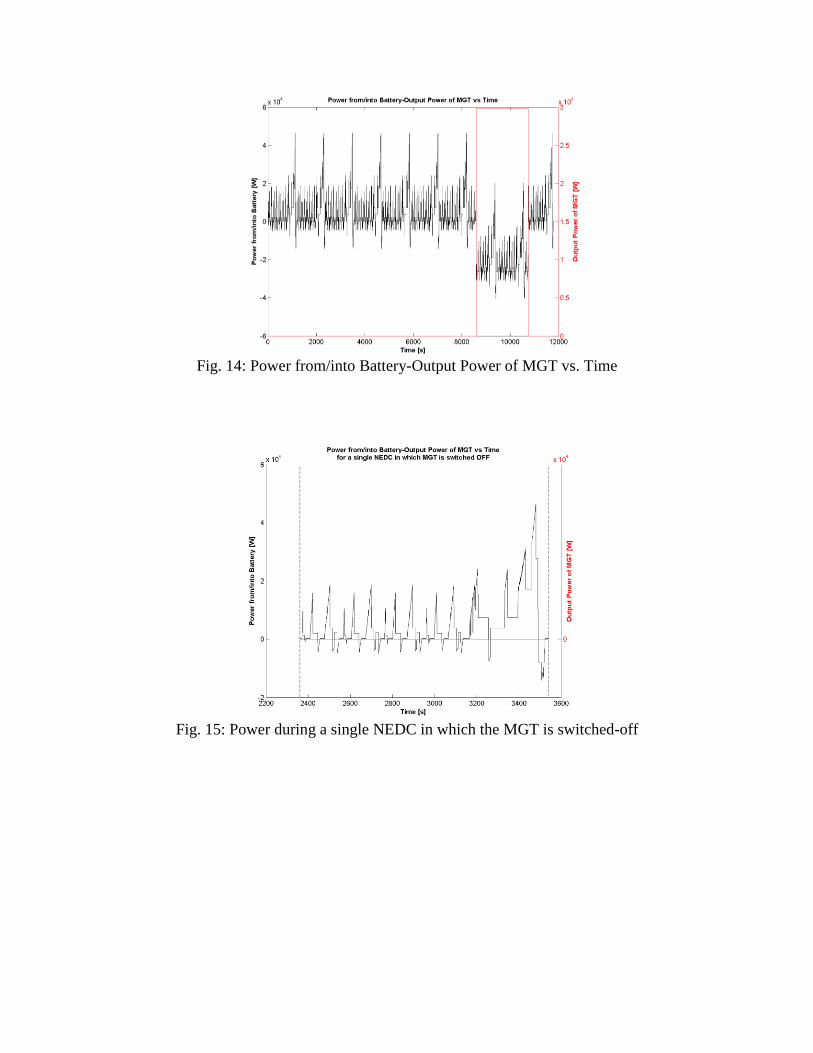
Fig. 14: Power from/into Battery-Output Power of MGT vs. Time
Fig. 15: Power during a single NEDC in which the MGT is switched-off
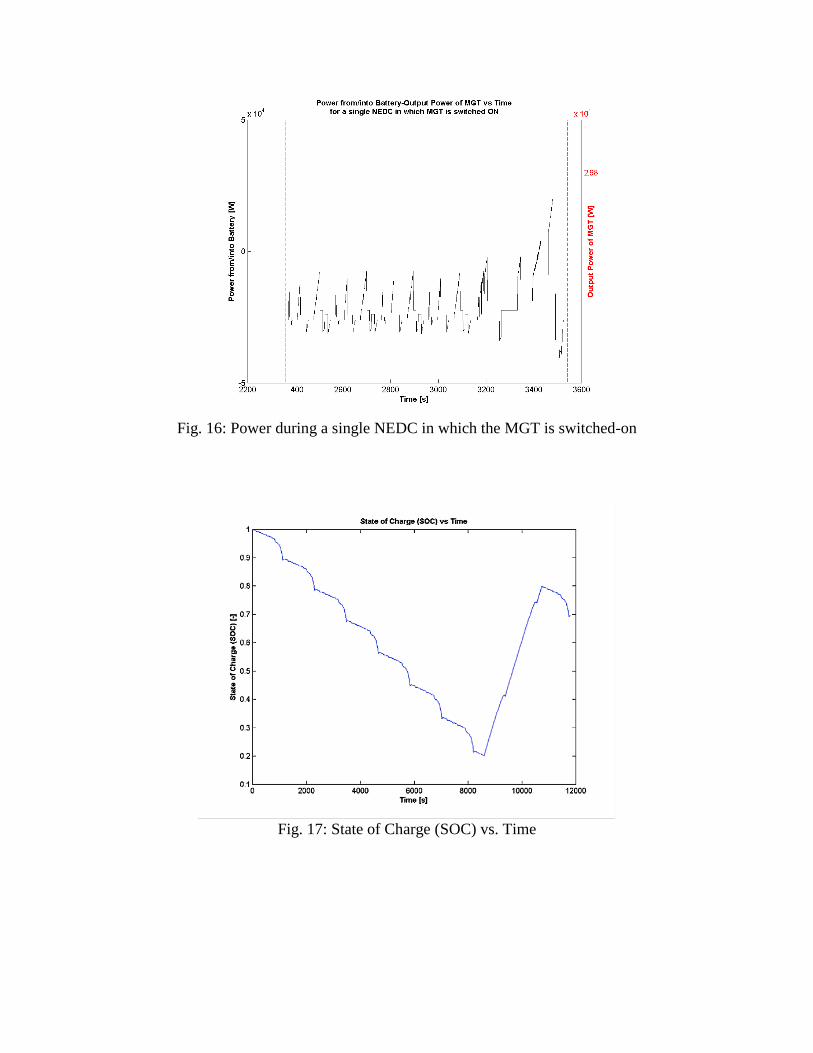
Fig. 16: Power during a single NEDC in which the MGT is switched-on
Fig. 17: State of Charge (SOC) vs. Time
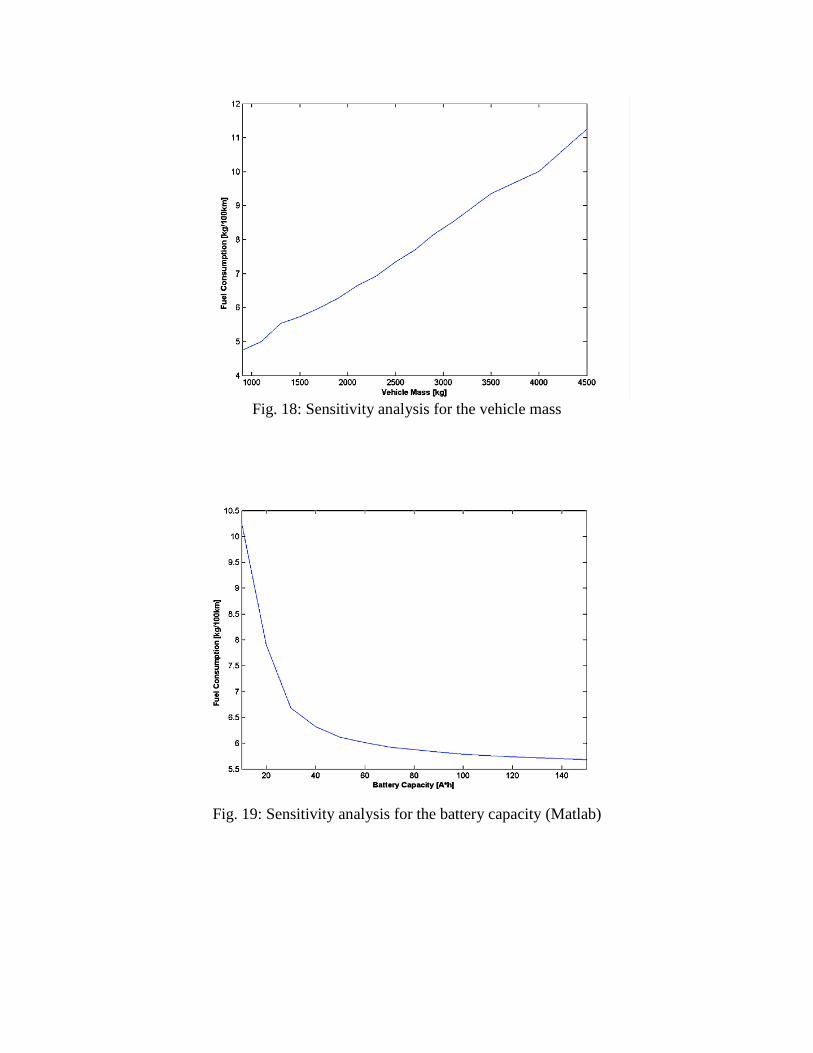
Fig. 18: Sensitivity analysis for the vehicle mass
Fig. 19: Sensitivity analysis for the battery capacity (Matlab)