Embed Size (px)
Citation preview

University of Nebraska - LincolnDigitalCommons@University of Nebraska - LincolnDissertations and Theses from the College ofBusiness Administration Business Administration, College of
Summer 7-20-2010
APPLICATION OF OPEN-SOURCEENTERPRISE INFORMATION SYSTEMMODULES: AN EMPIRICAL STUDYSang-Heui LeeUniversity of Nebraska-Lincoln
Follow this and additional works at: http://digitalcommons.unl.edu/businessdiss
Part of the Management Information Systems Commons, Other Business Commons, and theTechnology and Innovation Commons
This Article is brought to you for free and open access by the Business Administration, College of at DigitalCommons@University of Nebraska -Lincoln. It has been accepted for inclusion in Dissertations and Theses from the College of Business Administration by an authorized administrator ofDigitalCommons@University of Nebraska - Lincoln.
Lee, Sang-Heui, "APPLICATION OF OPEN-SOURCE ENTERPRISE INFORMATION SYSTEM MODULES: AN EMPIRICALSTUDY" (2010). Dissertations and Theses from the College of Business Administration. Paper 13.http://digitalcommons.unl.edu/businessdiss/13

APPLICATION OF OPEN-SOURCE ENTERPRISE INFORMATION
SYSTEM MODULES: AN EMPIRICAL STUDY
by
Sang-Heui Lee
A DISSERTATION
Presented to the Faculty of
The Graduate College at the University of Nebraska
In Partial Fulfillment of Requirements
For the Degree of Doctor of Philosophy
Major: Interdepartmental Area of Business
(Management)
Under the Supervision of Professor Sang M. Lee
Lincoln, Nebraska
July 2010
APPLICATION OF OPEN-SOURCE ENTERPRISE INFORMATION
SYSTEM MODULES: AN EMPIRICAL STUDY
Sang-Heui Lee, Ph.D.
University of Nebraska, 2010
Advisor: Sang M. Lee Although there have been a number of studies on large scale implementation of
proprietary enterprise information systems (EIS), open-source software (OSS) for EIS
has received limited attention in spite of its potential as a disruptive innovation. Cost
saving is the main driver for adopting OSS among the other possible benefits including
security and reliability, transparency of development process, etc. Due to the costly
implementation of proprietary EIS, small- and medium-sized organizations have given
attention to OSS as an alternative. OSS EIS can also help create a competitive advantage
by enabling organizations to customize their information systems by modifying the open-
source software codes without the dependency on vendors.
Prior OSS related studies focused mostly on the desktop software, database
management systems (DBMS), web server software, and operating systems (OS) to
exploit the motivation of OSS developers, social structures, collaborations in OSS
development communities, etc. The present research project conducted a confirmatory
analysis on enterprise application built by open-source communities by adopting an

information system success model that primarily relies on constructs that consists of user
perspectives on OSS EIS that organizations have adopted.
This research consists of a two-phase qualitative/quantitative mixed method. The
first phase investigates the frequencies of EIS modules that have been developed in OSS
communities to find the most widely applied functions of OSS EIS. The second phase of
the research examined the success factors of OSS EIS based on an IS success model. The
study used a sample of OSS EIS users. Users of popular OSS EIS were surveyed about
the quality of the system, the information from the system, the community service, the
user satisfaction, individual net benefits, and the organizational net benefits. The results
suggest removing several constructs entirely from the model proposed by this research
and building a new simplified OSS EIS success model.

ACKNOWLEDGEMENT
I owe a tremendous debt of gratitude to Dr. Sang M. Lee for his wisdom and
guidance of my path through this work and my entire doctoral program, during which I
have strived and grown academically and personally. Dr. Lee always waits for me until I
do better.
Dr. David L. Olson deserves special recognition for his valuable input and
guidance on my research activities during the program. I am grateful to Dr. Marc J.
Schniederjans for his precious advice and support. I also thank to Dr. Alvin J. Surkan for
his willingness to serve on my committee.
I wish to thank Pastors Jeoungchil Jo and Joseph Kim for their spiritual guidance
during the journey and Dr. Sungbae Lim for introducing me to the world of academia.
I also wish to thank my parents, Choon Woo Lee and Sunhwa Lee for their
unfailing support and prayers from my birth to this moment. I should give thanks to my
five Js - Joshua, Joseph, Joy, John, and Junghee for their sacrifices during my study. This
study could not be completed without the dedication of my precious wife and friend,
Junghee.
My last but most gratefulness is to the Lord who built me.
Sang-Heui Lee
Lincoln, Nebraska
July 2010

i
TABLE OF CONTENTS
CHAPTER ONE ................................................................................................................. 1
1.1 OVERVIEW .................................................................................................................... 1
1.2 RESEARCH OBJECTIVE .............................................................................................. 7
1.3 SIGNIFICANCE OF THE STUDY ............................................................................... 12
1.4 STRUCTURE OF THE DISSERTATION .................................................................... 13
CHAPTER TWO .............................................................................................................. 14
2.1 OPEN-SOURCE SOFTWARE ..................................................................................... 14
2.1.1 OPEN-SOURCE SOFTWARE DEFINED ........................................................... 14
2.1.2 OSS AND PROPRIETARY SOFTWARE ............................................................ 17
2.2 ENTERPRISE INFORMATION SYSTEMS AND MODULES .................................. 19
2.2.1 ERP SYSTEM MODULES ................................................................................... 19
2.2.2 SCM SYSTEM MODULES .................................................................................. 23
2.2.3 CRM SYSTEM MODULES .................................................................................. 26
2.2.4 KM SYSTEM AND BI SYSTEM MODULES ..................................................... 27
2.3 OSS EIS ......................................................................................................................... 29
2.4 OSS EIS MODULES ..................................................................................................... 32
2.5 IS SUCCESS MODEL .................................................................................................. 34
2.5.1 SYSTEM QUALITY ............................................................................................. 36
2.5.2 INFORMATION QUALITY ................................................................................. 37
2.5.3 SERVICE QUALITY ............................................................................................ 38
2.5.4 SYSTEM USE ....................................................................................................... 40
2.5.5 USER SATISFACTION ........................................................................................ 40
2.5.6 INDIVIDUAL IMPACT ........................................................................................ 40
2.5.7 ORGANIZATIONAL IMPACT ............................................................................ 41
CHAPTER THREE .......................................................................................................... 42
3.1 PHASE ONE .................................................................................................................. 42
3.1.1 DATA SELECTION .............................................................................................. 43
3.1.2 UNITS OF CONTENT ANALYSIS ..................................................................... 43

ii
3.1.3 SAMPLE ................................................................................................................ 44
3.1.4 MODULES ............................................................................................................ 45
3.1.5 INTER-CODER TRAINING AND RELIABILITY ............................................. 45
3.2 PHASE TWO ................................................................................................................. 48
3.2.1 RESEARCH FRAMEWORK ................................................................................ 48
3.2.2 HYPOTHESES ...................................................................................................... 49
3.2.3 MEASURES OF ENDOGENOUS VARIABLES................................................. 56
3.2.4 MEASURES OF EXOGENOUS VARIBALBES ................................................. 58
3.2.5 QUESTIONNAIRE DEVELOPMENT ................................................................. 61
3.2.6 DATA COLLECTION .......................................................................................... 65
3.2.7 STATISTICAL TECHNIQUE .............................................................................. 66
3.3 SUMMARY ................................................................................................................... 66
CHAPTER FOUR ............................................................................................................. 69
4.1 DEMOGRAPHIC CHARACTERISTICS OF RESPONDENTS .................................. 69
4.2 GENERAL CHARACTERISTICS OF OSS EIS .......................................................... 71
4.2.1 DURATION OF OSS EIS USE ............................................................................. 71
4.2.2 OSS EIS MODULES IN USE ............................................................................... 72
4.2.3 CUSTOMIZATION OF OSS EIS ......................................................................... 73
4.2.4 CONFIGURATION OF OSS EIS ......................................................................... 74
4.2.5 IMPLEMENTATION OF OSS EIS ...................................................................... 76
4.2.6 TECHNICAL SUPPORT FOR OSS EIS .............................................................. 77
4.2.7 VARIOUS T-TESTS ............................................................................................. 78
4.3 MODEL ANALYSES ................................................................................................... 82
4.3.1 ANALYSIS OF THE MEASUREMENT MODEL .............................................. 83
4.3.2 RELIABILITY AND VALIDITY TEST .............................................................. 87
4.4 ANALYSIS OF STRUCTURAL MODEL ................................................................... 90
4.4.1 MODEL FITNESS OF STRUCTURAL (FULL) MODEL ................................... 90
4.4.2 HYPOTHESES TESTING .................................................................................... 90
4.5 DISCUSSION ................................................................................................................ 95
4.5.1 COMPARISON ON TWO RESULTS .................................................................. 95
4.5.2 RESULTS OF STATISTICAL ANALYSIS ......................................................... 97
4.6 SUMMARY OF ANALYSES ..................................................................................... 101

iii
CHAPTER FIVE ............................................................................................................ 105
5.1 SUMMARY ................................................................................................................. 105
5.2 IMPLICATIONS AND LIMITATIONS OF THE STUDY ........................................ 106
5.3 FUTURE STUDY ........................................................................................................ 108
REFERENCES ............................................................................................................... 110
APPENDICES ................................................................................................................ 126

iv
LIST OF TABLES
Table 1.1 Top 10 On‐line OSS Communities .................................................................................. 8 Table 2.1 Business Functions Supported by ERP (Davenport, 1998) .......................................... 20 Table 2.2 Modules Offered by Leading Vendors (Brady et al. 2001) .......................................... 22 Table 2.3 Use of ERP Modules (Mabert et al., 2000; Olhager and Selldin, 2003; Katerattanakul et al., 2006) .................................................................................................................................... 23 Table 2.4 Proprietary ERP Implementations and OSS ERP Projects ............................................ 30 Table 2.5 EIS Modules ................................................................................................................. 33 Table 3.1 Cohen’s Kappa of Each Pair of Three Coders with p<.001 .......................................... 47 Table 3.2 Definition of Endogenous Variables and Measurement Methods .............................. 63 Table 3.3 Definition of Exogenous Variables and Measurement Methods ................................ 64 Table 4.1 Demographic Characteristics ....................................................................................... 70 Table 4.2 Duration of OSS EIS Use ............................................................................................... 72 Table 4.3 OSS EIS Module Experience ......................................................................................... 75 Table 4.4 Percentage of OSS EIS Customized .............................................................................. 76 Table 4.5 OSS EIS Configuration .................................................................................................. 76 Table 4.6 Implementation of OSS EIS .......................................................................................... 77 Table 4.7 Provider of technical support for OSS EIS ................................................................... 78 Table 4.8 Module Use Based on Duration of OSS EIS use ........................................................... 79 Table 4.9 Module Use Based on Number of Employees ............................................................. 80 Table 4.10 Duration of Use Comparison for Customization ....................................................... 81 Table 4.11 Number of Employee Comparisons for Customization/Duration of Use .................. 82 Table 4.12 Measurement Model Fitness .................................................................................... 86 Table 4.13 New Measurement Model Fitness ............................................................................ 86 Table 4.14 Items, Factor‐loadings, and Construct Reliability ...................................................... 88 Table 4.15 Means (Standard Deviation) and Correlation Matrix ................................................ 89 Table 4.16 Overall Model Fitness ................................................................................................ 90 Table 4.17 Path Coefficient and Significance Test of Structural Model ...................................... 92 Table 4.18 A Summary of Path Analysis Results ......................................................................... 94 Table 4.19 OSS EIS Modules Developed in On‐Line Communities .............................................. 95 Table 4.20 A Comparison of Survey and Content Analysis ......................................................... 98

v
LIST OF FIGURES Figure 1.1 OSS Success Model for Enterprise Information Systems ............................................. 6 Figure 1.2 Waterfall Software Development Model (Royce, 1970) ............................................ 11 Figure 3.1 Research Model with Hypotheses .............................................................................. 55 Figure 3.3 Research Model Drawn in AMOS ............................................................................... 68 Figure 4.1 Suggested OSS EIS Success Model ............................................................................ 104

1
CHAPTER ONE
INTRODUCTION
“Once openness is adopted as a business strategy then participation and collaboration
naturally follow (Lee and Olson 2010).”
1.1 OVERVIEW
The advanced technology of the Internet that continuous to expand, the cheaper
costs of hardware and telecommunication, and active participation of users through Web
2.0 are just some of the factors that contribute to the flood of information inundating
society today. It has become increasingly important for firms to collect raw data,
transform it into valuable information, and analyze the information for better decision
making in the competitive global market. Firms continuously create transaction data 24/7
globally, where environmental resources and constrains including governments,
competitors, customers, and cultures are constantly changing. Lee and Olson (2010)
defined globalization as “… the development of connected world, that is much more open
and interdependent.” In the fast-moving business environments open to global
competition, sustainable advantage requires unique and difficult-to-replicate dynamic
capabilities (Teece, 2007).
These capabilities are necessary to sustain superior enterprise performance in an
open economy with rapid innovation and globally dispersed sources of invention,
innovation, and manufacturing capability. Firms not only adapt to business ecosystems,

2
but also shape them through innovation and through collaboration with other enterprises,
entities, and institutions. Iansiti and Clark (1994) found that integration capability was
associated with positive enterprise performance, which demonstrates the importance of
knowledge integration skills. In fast-paced environments, firms must have considerable
autonomy (to make decisions rapidly) but remain connected to activities that must be
coordinated (Porter, 1996). As a result, firms need to find the best industry practices to
manage the growing volume of information in a manner that is valuable to their
businesses. For example, the firm’s strategies can be kept congruent with environmental
changes by developing considerable knowledge management (KM) systems through
information systems (IS) support.
The development of enterprise-level IS has enhanced such dynamic capabilities of
firms. The functionalities of such IS include enterprise resource management, customer
and supply chain management, knowledge management, business intelligence, etc.
(Laudon and Laudon, 2010). The enterprise information systems (EIS) have been an
emerging trend of implementation to meet the needs of businesses in the 21st Century.
However, as Olson (2004) explained, implementing EIS software is typically too
complex for in-house capability and very expensive, involving millions of dollars for
vendor purchasing price, consultant expertise, in-house development, and user education.
The large size of financial investment and its inherent risk make firms hesitate to invest
in the system, especially for small- and medium-sized businesses (SMBs). Additionally,
since EIS are widely applied by organizations, it is hard to gain competitive advantage
through EIS implementation (Karimi et al., 2007). Organizations can customize EIS

3
through open-source codes to fit their processes and gain competitive advantage (Jaisingh
et al., 2008).
Recently, EIS vendors have realized that open-source software (OSS) offer
capabilities, both as a source of content for vendors as well as a threat to the proprietary
enterprise system market share from competitors based on OSS development or delivery
(Grewal et al., 2006). Porter (1996) stated, “… new market entrants, unencumbered by a
long history in the industry, can often more easily perceive the potential for a new way of
competing. Unlike, incumbents, newcomers can be more flexible because they face no
trade-offs with their existing activities.”
OSS development involves voluntary participation of individuals in on-line
communities to develop computer software codes. The underlying philosophy of OSS is
to enhance software reliability and quality through independent peer reviews and rapid
evolution of applications. With OSS, developers and users are free to utilize and modify
OSS by accessing open codes. The zero-cost licensing structure of most open-source
projects has opened up the acceptance of these products into a number of previously
untapped markets. According to Serrano and Sarriegi (2006), three major reasons why
OSS is advantageous to implement and maintain EIS are: (1) increased adaptability to
match the business processes and local regulations; (2) decreased reliance on a single
supplier; and (3) reduced costs to implement and maintain the system. Johansson and
Sudzina (2008) also claimed that OSS EIS enable SMBs to implement EIS at a minimal
cost which often is an impediment for EIS implementation in SMBs. Thus far, though,
OSS EIS are not yet the main stream since few trustworthy organizations have shown
success in implementing them.

4
The motivation for this research can be summarized as follows:
Although implementing OSS EIS can result in competitive advantage for SMBs,
there have been few empirical studies on the topic.
Success factors of information systems and general OSS have been discovered in
prior studies. A confirmatory analysis of enterprise-level OSS based on the
existing IS success research frames can discover success factors of OSS EIS.
The significance of this research resides in confirming the success factors of OSS
EIS implementation that may help SMBs to adopt appropriate EIS modules. Although
there have been several studies on large scale implementations of proprietary enterprise
software, OSS EIS development has received limited attention in spite of its potential as a
disruptive innovation (Brydon and Vining, 2008).
Reviews of prior studies and the motivations described above resulted in the
following research question: How does OSS development penetrate the proprietary EIS
market?
To answer this research question the following questions shall be examined:
1. Which EIS modules/functions are appropriate to be initiated and sustained for
OSS development? (Development phase)
2. What are the major drivers of enterprise OSS modules for developing niche
markets and reaching a critical mass of adopters? (Diffusion phase)
While there has been an abundance of literature on OSS, most studies on OSS
success are qualitative or exploratory. An empirical study that measures OSS success
would improve OSS use by delineating the success factors. This study develops an OSS
EIS success model by expanding on a prior information systems success model by

5
incorporating the characteristics of EIS and OSS.
An IS success model developed by DeLone and McLean (1992, 2003) has been
applied to OSS in general to measure OSS success (Lee et al., 2009). The research model
for this study is shown in Figure 1.1, which is distinguished from prior research due to
the addition of two constructs, community service quality and organizational net benefits
in accordance with the nature of enterprise-level information systems. This dissertation
extends the application of the IS success model even further to enterprise software.
To evaluate the relationships shown in the model, end users of OSS EIS were
surveyed about their perspectives on the use of OSS EIS based on their work experiences.
The measurement instrument (survey of OSS EIS users) was developed by adopting
existing validated instruments wherever possible. Summated scales for each variable
were calculated from the survey item responses. The hypothesized relationships between
variables were analyzed using structural equation modeling to assess the direction and
strength of the relationships. The methodology used in this study is discussed in Chapter
Three.

6
A modified model based on the studies by
DeLone and McLean (2003) and Lee et al. (2009)
Figure 1.1 OSS Success Model for Enterprise Information Systems
Results of this analysis are expected to confirm those from general IS success
studies and find the relationships with the two additional variables of Community Service
Quality and Organizational Net Benefits, which were intended to capture the properties
of OSS and EIS. More specifically, the relative importance of each user perspective in
relation to OSS EIS and the resulting impact on organization benefit will be shown. A
comparison of the model and the typical IS success model by incorporating the two
additional variables and by considering OSS EIS Use as a mediating variable will be
discussed. Quantifying the strength and direction of these relationships has both
theoretical and practical significance. From a research standpoint, this study will enrich
the body of knowledge of OSS EIS development and provides a model that can

7
potentially be applied to other OSS information systems development. For OSS
developers and other practitioners including consulting firms, partners, and large firms
who practice in-house OSS development, understanding the strength of various success
factors aids in the decision-making processes in adapting OSS EIS for organizations. In
addition, the study provides insight to the relationships between success factors and
individual and organizational benefit. It may also help organizations who are pursuing the
advantages of OSS select appropriate modules/functions of OSS EIS for their needs.
1.2 RESEARCH OBJECTIVE
The overall objective of this study is to examine the relationships between success
factors identified in the literature as critical to open-source enterprise application and the
net benefits of individuals and organizations that adopt OSS EIS for business purposes.
Thus, the research purposes are: “What functions/modules of EIS are successful in OSS
practice?” and “What are the success factors that influence the adaptation of OSS EIS?”
There are a number of on-line OSS development communities as shown in Table
1.1. Each community provides software development platforms for various types of OSS
projects. OSS project has expanded the boundary from operating systems (OS) to
database management systems (DBMS) to enterprise-level business software.

8
Rank Name Users Projects Bug Reports
1 SourceForge 2,600,000+ 161,992 2,872,958
2 Google Code Unknown 250,000+ Unknown
3 GitHub 205,000 90,000 Unknown
4 CodePlex 151,782 9,274 Unknown
5 Tigris.org 137,324 1,547 143,800
6 Assembla 170,000 60,000+ Unknown
7 Launchpad 1,061,601 17,140 498,464
8 BerliOS 43,062 5,367 Unknown
9 Bitbucket 35,000 19,100 Unknown
10 TuxFamily 2,381 1,844 Unknown
Table 1.1 Top 10 On-line OSS Communities
Enterprise applications include document management, office automation,
network management, portal frame work, and so on, in addition to EIS that is the focal
subject of this study. The study only examines the five major OSS enterprise applications.
Laudon and Laudon (2010) defined EIS into five categories: enterprise resource planning
(ERP) systems, supply chain management (SCM) systems, customer relationship
management (CRM) systems, knowledge management (KM) systems, and business
intelligence (BI) systems. Identification of such information system modules helps
organizations, especially SMBs, find alternative ways to adopt EIS.

9
For software development, systems development life cycle (SDLC) or the
waterfall model shown in Figure 1.2, which is the oldest form of SDLC suggested by
Royce (1970), is the most widely applied process. According to Royce (1970), the
waterfall model involves five steps: requirements specification, design, implementation,
verification, and maintenance. To properly apply this model to software development,
each step must be followed in sequential manner. Output from each step serves as input
to the next step.
The requirements specification phase involves gathering information about
customer’s needs and defining the problem that the product is expected to solve. The
design process involves defining the hardware and software architecture, designing data
storage, choosing programming language, and designing user interface. The
implementation step consists of constructing the product as per the design specification(s)
developed in the previous step (Royce, 1970). Typically, this step is performed by a
development team consisting of programmers, interface designers and other specialists,
using tools such as compilers, debuggers, interpreters and media editors. In
test/verification stage, both the individual components and the integrated whole are
methodically verified to ensure that they are error-free and fully meet the requirements
outlined in the first step (TechRepublic, 2006).
Lastly, the installation/maintenance stage involves preparing the system or
product for installation and use at the customers’ site. The maintenance stage occurs after
installation, and involves making modifications to the system or an individual component
to alter attributes or improve performance. These modifications arise either due to change

10
requests initiated by the customer, or defects uncovered during live use of the system
(TechRepublic, 2006).
These five steps can be viewed from the perspectives of the status of OSS project.
The present study identified two distinct steps of the OSS project based on the proprietary
Software (or System) Development Life Cycle (SDLC)/Waterfall model for research
purpose as shown in Figure 1.2. The two phases that a typical OSS project goes through
are: development and diffusion. Unlike in the proprietary software development process,
in OSS users are not usually involved in the early stages, such as design and
implementation. This lack of user involvement has noted as an issue in a prior study
(Hughes and Cotterell, 1999).
In comparison to proprietary software, more OSS projects are ending their SDLC
in the development phase. Not all OSS projects can be sustained in on-line community
and diffused to fields, where users become actively involved. Lee et al. (2009) said, “…
While there have been successful OSS projects, mostly with backend servers and
Internet-related software, the number of failed or dormant OSS projects is also notable. In
fact, according to the popular open source portal, SourceForge.net, most OSS projects
have ended in failure: 58% do not move beyond the alpha developmental stage, 22%
remain in the planning phase, 17% remain in the pre-alpha phase, and some become
inactive.”
The three milestones of the two phases, development and diffusion are: project
initiative, project sustaining, and project adoption. Project initiative involves the first four
stages of the Waterfall model: requirements specification, design, implementation, and
verification, which are done in the development phase. Project adoption involves the last

11
two steps of the Waterfall model: verification, and maintenance, which are done in
diffusion phase. Project sustaining involves overlapped area between development and
diffusion phases, including implementation, verification, and maintenance steps.
Toward this end, this study involves two research phases: (1) Identification of the
most popular applications of OSS EIS modules by exploring on-line OSS communities
shown in Table 1.1 to assess the proportion of EIS development among the various
projects; and (2) A confirmatory analysis on the modified IS success model based on the
user survey to analyze user perspectives on OSS EIS. The overview of this research is
shown in Figure 1.3.
Figure 1.2 Waterfall Software Development Model (Royce, 1970)

12
Figure 1.3 Research Overview
1.3 SIGNIFICANCE OF THE STUDY
The research published to date has developed the theoretical and conceptual
relationships between success factors and individual or organizational net benefits for
information systems. This study in the context of OSS EIS is an empirical extension that
tests the relationships between user perspectives on the system and individual net benefits
to assess their strength, direction, and impact on organizational net benefits. The results
from the survey of end users are investigated to further the understanding of success
factors of OSS EIS projects. Additionally, the evidence from this research may help

13
practitioners make more informed decisions regarding employment of OSS EIS for their
business.
1.4 STRUCTURE OF THE DISSERTATION
The dissertation is structured with five chapters; Introduction, Literature Review,
Research Design and Methodology, Results and Discussion, and Summary and
Conclusion.
Chapter One has introduced the topic of the study and discussed the general
research objectives and research questions. Chapter Two presents a literature review on
OSS EIS and information system success measures for OSS. Chapter Three outlines the
research design and methodology employed in this study. It describes a research
framework developed based on literature review. Hypotheses are developed and the
variables used in the study are presented. Details of research design, the sample, and the
survey instrument are also discussed. Chapter Four presents the results of statistical
analyses and discussion. Chapter Five concludes the study by presenting the summary,
limitations, and practical and academic contributions of the study.

14
CHAPTER TWO
LITERATURE REVIEW
“Information has no intrinsic value; any value comes only through the
influence it may have on physical events. Such influence is typically
exerted through human decision makers (Emery 1971, p.1).”
This chapter presents the literature review on OSS, EIS, and user perspectives on
information systems. It consists of four sections. The first section presents a literature
review on OSS in general. The second section reviews literature on EIS modules,
describing the functions of EIS and the modules that vendors develop for firms. The
section concludes by presenting a comprehensive set of EIS modules derived from prior
studies. In the third section, a discussion of OSS EIS and its module development is
presented. The fourth section presents the success factors of information systems. The
existing literature in each of these areas, including their respective findings and
implications are summarized in this chapter.
2.1 OPEN-SOURCE SOFTWARE
2.1.1 OPEN-SOURCE SOFTWARE DEFINED
OSS is computer software that is available in the source code form for which the
source code and certain other rights normally reserved for copyright holders are provided
under a software license that permits users to study, change, and improve upon it. OSS

15
development projects are initiated by an individual or a small group with an interesting
software idea that they themselves want for an intellectual or business reason
(Subramanian and Soh, 2008). Raymond (1999) argued in his essay, The Cathedral and
the Bazaar, the more widely available the source code is for public testing, scrutiny, and
experimentation, the more rapidly all forms of bugs will be discovered. Raymond (1999)
also claimed that an inordinate amount of time and energy must be spent hunting for bugs
in the Cathedral model, since the working version of the code is available only to a few
developers. On the other hand, OSS is a platform for the wisdom of the crowd. Sunstein
(2006) suggested in his book about collective intelligence, “… a diverse collection of
independently-deciding individuals is likely to make certain types of decisions and
predictions better than individuals or even experts, draws many parallels with statistical
sampling …” Boer et al. (1999) supports the arguments by suggesting that knowledge
integration is the fusion and combination of knowledge from sources that are multiple,
distributed and heterogeneous.
Lee and Olson (2010) argued the ability to access millions or potentially billions
over the internet makes it far more valuable than a local area network. OSS development
involves the voluntary participation of individuals on on-line communities that have no
physical boundary. OSS is developed through open-source projects which are developed
through group participation to modify and utilize the open software code for their own
needs (Krogh and Hippel, 2006). OSS also works for the public interests by allowing
developers and users utilize and modify OSS by accessing open code (O’Mahony, 2003;
Roberts et al., 2006; Jaisingh et al., 2008).

16
Weber (2005) reviewed industry surveys seeking to identify why participants
gave their time to such endeavors. One might naturally think of altruism, but that does
not seem to be the explanation, as participants care a great deal about the credit for their
work. They seem to emphasize feeling part of the technical community, using open-
source participation to improve their programming skills as well as having fun. Software
creators participate due to enjoyment, learning, reputation, and community membership
(Lakhani and Wolf, 2005).
The underlying philosophy of OSS is to enhance software reliability and quality
through independent peer review and rapid evolution of source code. Low cost is also a
main driver of OSS implementation. OSS ERP’s average implementation costs are at
between one- sixth and one- third of the costs for typical proprietary ERPs (Lee and
Olson, 2010). OSS has provided a number of successes. The most commonly understood
open-source success is the Linux operating system, used by Dell, Compaq, and IBM, as
well as many other firms. MySQL is an open-source database server. Apache web
server leads over Microsoft IIS by a substantial margin. Sun Microsystems have long
viewed OSS as a means to develop long-range market strength (Babcock, 2009). Other
firms have been able to make OSS work, including Dell computers (Conry-Murray,
2009). According to Iansiti and Richards (2006), OSS is created by two clusters, the
money-driven cluster and the community-driven cluster. IT vendors, such as Oracle and
IBM, mainly focus on money-driven cluster and actively promote a proprietary product
over an open source equivalent.
Open-source licenses often meet the requirements of the Open Source Definition
suggested by Open Source Initiative (Open Source Initiative, 2010). OSI, an organization

17
dedicated to promoting OSS, defines OSS in the following 10 criteria: (1) Free
Redistribution – the license shall not restrict any party from selling or giving away the
software. The license shall not require a royalty or other fees for such sale; (2) Source
Code - the program must include source code in the preferred form in which a
programmer would modify the program; (3) Derived Works - the license must allow
modifications and derived works; (4) Integrity of The Author's Source Code - the license
may restrict source-code from being distributed in a modified form only if the license
allows the distribution of "patch files" with the source code for the purpose of modifying
the program at build time; (5) No Discrimination Against Persons or Groups - the license
must not discriminate against any person or group of persons; (6) No Discrimination
Against Fields of Endeavor - the license must not restrict anyone from making use of the
program in a specific field of endeavor; (7) Distribution of License - the rights attached to
the program must apply to all to whom the program is redistributed without the need for
execution of an additional license by those parties; (8) License Must Not Be Specific to a
Product - The rights attached to the program must not depend on the program's being part
of a particular software distribution; (9) License Must Not Restrict Other Software - the
license must not place restrictions on other software that is distributed along with the
licensed software; (10) License Must Be Technology-Neutral - No provision of the
license may be predicated on any individual technology or style of interface.
2.1.2 OSS AND PROPRIETARY SOFTWARE
Davis (2009) surveyed 656 business technology professionals, 557 of whom used
OSS. OSS was reported as pervasive in 17 percent of these firms, but was reported to
18
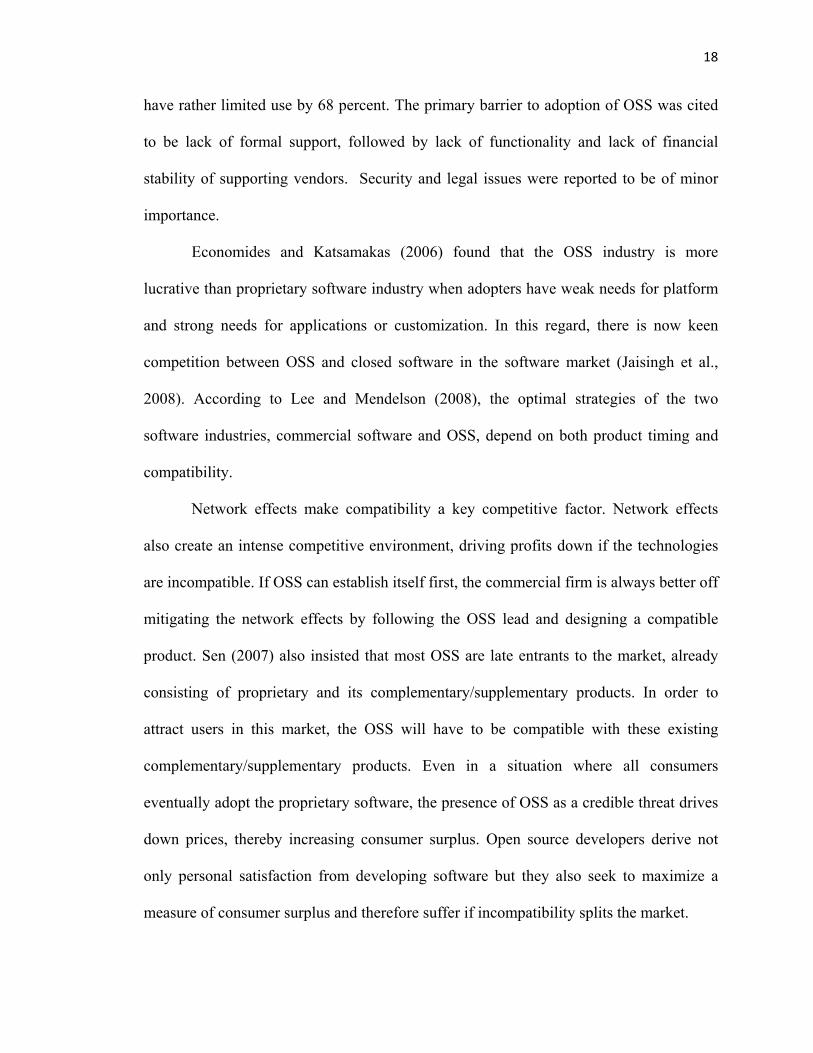
have rather limited use by 68 percent. The primary barrier to adoption of OSS was cited
to be lack of formal support, followed by lack of functionality and lack of financial
stability of supporting vendors. Security and legal issues were reported to be of minor
importance.
Economides and Katsamakas (2006) found that the OSS industry is more
lucrative than proprietary software industry when adopters have weak needs for platform
and strong needs for applications or customization. In this regard, there is now keen
competition between OSS and closed software in the software market (Jaisingh et al.,
2008). According to Lee and Mendelson (2008), the optimal strategies of the two
software industries, commercial software and OSS, depend on both product timing and
compatibility.
Network effects make compatibility a key competitive factor. Network effects
also create an intense competitive environment, driving profits down if the technologies
are incompatible. If OSS can establish itself first, the commercial firm is always better off
mitigating the network effects by following the OSS lead and designing a compatible
product. Sen (2007) also insisted that most OSS are late entrants to the market, already
consisting of proprietary and its complementary/supplementary products. In order to
attract users in this market, the OSS will have to be compatible with these existing
complementary/supplementary products. Even in a situation where all consumers
eventually adopt the proprietary software, the presence of OSS as a credible threat drives
down prices, thereby increasing consumer surplus. Open source developers derive not
only personal satisfaction from developing software but they also seek to maximize a
measure of consumer surplus and therefore suffer if incompatibility splits the market.

19
Lee and Mendelson (2008) argued that with zero switching cost, open-source
software does not gain a market-share advantage by being available first. However, the
presence of OSS pushes the proprietary software firm to improve its product features and
launch their products early. A firm considering open source development as an
alternative to closed source development would need to carefully review the relationship
between the software in question and the firm’s other products. If the software is found to
enhance the usefulness or quality of complementary products and/or if the users of the
software and the users of the complementary product belong to the same network, the
complementary software can be exploited (Haruvy et al., 2008).
2.2 ENTERPRISE INFORMATION SYSTEMS AND MODULES
The organizational benefits of an information system often depend on how they
are implemented and utilized in addition to what functional attributes they possess
(Markus, 1983; Robey and Boudreau, 1999). EIS are applications that focus on
managing and integrating whole business processes including accounting, finance,
manufacturing, human resources, and inventory management (Davenport and Brooks,
2004). The following sections describe functions/modules of each five major enterprise
applications, ERP, SCM, CRM, KM, BI systems.
2.2.1 ERP SYSTEM MODULES
Business computing systems were initially applied to those functions that were
easiest to automate and that called for the greatest levels of consistency and accuracy.

20
Davenport (1998) defined business functions potentially supported by ERP as shown in
Table 2.1. The top five categories defined by Davenport (1998) include: financial
function, human resources function, operations and logistics function, and sales and
marketing function. Each function includes several modules. Financial function may
include financial and accounting modules, such as accounts receivable and payable, cash
forecasting, and cost accounting. Human resource function may include time accounting
and payroll modules. Operations and logistics function includes inventory management,
materials requirement planning, and purchasing modules. Sales and marketing function
may include order management and sales planning. Olson (2004) argued that ERP
systems in concept cover all computing for an organization to centralize data and
computation and to remove the redundancy and inconsistency of data. However,
proprietary ERP vendors sell their software in modules as shown in Table 2.2.
Financial Human Resource Operations and Logistics
Sales and Marketing
Accounts receivable and payable Asset accounting
Time accounting Payroll
Inventory management Materials Requirement Planning (MRP)
Order management Pricing
Cash forecasting Cost accounting
Personnel planning Travel expenses
Plant maintenance Production planning
Sales management Sales planning
Executive information systems
Project management
Financial consolidation General ledger Profitability analysis Standard costing
Purchasing Quality management Shipping Vendor evaluation
Table 2.1 Business Functions Supported by ERP (Davenport, 1998)

21
Mabert et al. (2000) reported the extent of ERP module use by surveying 479
ERP users from the American Inventory and Inventory Control Society. Olhager and
Selldin (2003) conducted a similar study by surveying 190 Swedish manufacturing firms.
Another study by Katerattanakul et al. (2006) was done by surveying 306 Korean
manufacturing firms. The results from the three studies are listed in Table 2.3. These
studies found that the most frequently used module of ERP in the United States was
financial and accounting (Mabert et al., 2000); materials management, production
planning, and order entry in Sweden (Olhager and Selldin, 2003); and the modules
related to the time-to-customer process in Korea (Katerattanakul et al., 2006).
The results from the similar studies show different ERP implementation practices
in the three countries. Olhager and Selldin (2003) explained that Swedish firms are
keener on using European, and in particular Swedish, ERP systems while the US study
rank SAP, Baan and PeopleSoft as the most popular systems. (PeopleSoft acquired JD
Edwards in 2003 and Oracle acquired PeopleSoft in 2005) Swedish firms typically
implement more modules; all individual modules have a higher implementation
frequency in the Sweden research except financial accounting, which is the most widely
implemented module in the US. The study found that information speed, quality and
availability improved but the information technology costs were not decreased, which
were quite similar to those experienced in the US.

22
Functional Description
SAP Oracle People Soft JD Edwards
Records sales orders and scheduled deliveries, customer information
Sales and Distribution
Marketing Sales Supply Chain
Supply Chain Management
Order Management
Purchasing and raw materials inventory, work- in-process. customer information
Materials Management
Procurement Supplier Relationship Management
Inventory Management Procurement
Production Planning and scheduling actual production
Production Planning
Manufacturing Manufacturing Management
Product inspections, material certifications ,quality control
Quality Management
Enterprise Performance Management
Technical Foundation
Preventive maintenance, resource management
Plant Maintenance
Service Enterprise Service Automation
Recruiting, hiring training ,payroll ,benefits
Human Resources
Human Resources
Human Capital Management
Workforce Management
Table 2.2 Modules Offered by Leading Vendors (Brady et al. 2001)

23
Module Midwest US Sweden Korea Mean
Financial & Accounting (Fa) 91.5% 87.3% 92.5% 91.7%
Materials Management (Mm) 89.2% 91.8% 94.1% 91%
Production Planning (Pr) 88.5% 90.5% 91.5% 90.4%
Order Entry (Or) 87.7% 92.4% 90.5% 90.2%
Purchasing (Pu) 86.9% 93.0% 93.1% 90.2%
Financial Control (Fc) 81.5% 82.3% 85.0% 82.9%
Distribution/Logistics (Di) 75.4% 84.8% 85.9% 82.0%
Asset Management (Am) 57.7% 63.3% 81.4% 67.5%
Quality Management (Qm) 44.6% 47.5% 77.6% 60.2%
Personnel/Human Resources (Hr) 44.6% 57.6% 78.4% 56.6%
Maintenance (Ma) 40.8% 44.3% 72.2% 52.4%
R&D Management (Rd) 30.8% 34.2% 69.5% 44.8%
Table 2.3 Use of ERP Modules (Mabert et al., 2000; Olhager and Selldin, 2003; Katerattanakul et al., 2006)
2.2.2 SCM SYSTEM MODULES
SCM information systems (IS) are distinguished from other EIS in that they focus
primarily on supply chain planning and execution rather than other functions such as
human resources or accounting. The main idea of ERP was to centralize data and
computation, so that data can be entered once in a clean form, and then be used by
everyone in the organization (and even by supply-chain partners outside the organization)
(Olson, 2004). According to the ERP study in Sweden done by Olhager and Selldin
(2003), the set of modules requiring customization is similar to those in the US. Order
entry was singled out as number one in the US study followed by distribution/logistics,

24
production planning, and materials management. Thus, it seems that the supply chain
process from suppliers through manufacturing to customer generally is important and
needs some tailoring to support the needs of the individual enterprise and its relationship
with supply chain partners.
Motivations for developing a hierarchical taxonomy for SCM IS include: there is
no comprehensive classification of SCM IS modules due to the overlapping functionality
in most SCM IS and due to their tendency to be configured differently for each
implementation (Helo and Szekely, 2005); the ‘best-of-breed’ approach for EIS
implementation complicates the process of matching organizational requirements to
software functionality (Light et al. 2001); and overlaps in functionality among different
SCM IS prevent the development of useful taxonomies using the traditional approach of
grouping products into different categories. In the following sections, various SCM
classifications are discussed.
2.2.2.1 GENOMIC CLASSIFICATION SCHEME
McLaren and Vuong (2008) developed a hierarchical classification scheme, which
is the scheme utilized in this study for SCM classification. The taxonomy developed by
McLaren and Vuong (2008) describes 83 major functional attributes that form five top-
level categories: primary supply chain processes, data management, decision support,
relationship management, and performance improvement as shown in Appendix A. A
modified grounded theory approach was followed to help ensure the model constructs.
The categories were derived from empirical descriptions of commercial SCM IS
packages, rather than from purely theoretical constructs.

25
Using the hierarchical taxonomy, researchers and practitioners will be able to
more accurately classify and describe SCM IS while providing greater detail on the
functionality provided by specific SCM IS. The use of the qualitative analysis software
facilitated the analysis of the approximately 1,800 pages of text. The study was limited to
the seven most popular SCM IS packages. Although this ignores some specialized
functionality in other niche SCM IS, limiting the scope to the "Big Seven" facilitated
comparison and theoretical replication between the packages while reducing extraneous
differences (Yin, 2003).
At the highest level, the attributes were organized into five categories as indicated
before. These functional attributes should be viewed as the attributes that were prominent
in the most commonly used SCM IS applications. Future research could include
investigating more niche functionalities as appropriate.
2.2.2.2 OTHER CLASSIFICATIONS
AMR Research, Inc., a company providing supply chain and supporting
technologies, classified SCM technologies by application segment in 2007 into 10
categories, including Warehouse Management (16%), Order Fulfillment (15%), Supply
Chain Management Performance (14%), Production and Distribution Planning (12%),
Demand Planning (11%), Transportation Management (11%), Inventory Optimization
(7%), Service Parts Management and Planning (6%), Sales and Operation Planning (5%),
and Global Trade Management (3%) (Kerr, 2009).
Most of these categories are inclusive in the top level of the genomic
classification or the successive levels. Fawcett, Ellram, and Ogden (2007) suggested that

26
operations processes must manage the same core set of decisions, which can be classified
into two groups: design decisions and control decisions. The design decisions including
Product Design, Process Design, Facility Layout and Facility Location are under the
primary SCM of the genomic classification. The control decisions are also a subset of the
genomic classification since they fit well under the rest of the categories. In comparison
to the described categories, the study of genomic classification was based on the quite
collective data and provides sufficient information to identify SCM IS modules for this
study. Defining a comprehensive set of EIS modules is a necessary step that must be done
prior to the present research for consistency. Both the content analysis in phase one and
the confirmatory factor analysis in phase two of the research are performed based on the
same EIS categories.
2.2.3 CRM SYSTEM MODULES
Porter’s (1979) five competitive forces model provides a general view of the
organization, its competitors, and the environment. The five competitive forces include
traditional competitors, new market entrants, substitute products and services, suppliers,
and customers. A profitable company depends in large measure on its ability to attract
and retain customers (Laudon and Laudon, 2010). In a survey of 506 global CEOs, CEOs
ranked customer loyalty and retention as their No. 1 management challenge (Rosenbleeth
et al., 2002). Advanced information technologies, such as CRM systems, have forced
firms to focus on managing customer relationships through meeting customer satisfaction
to maximize revenues. Mass customization and personalization have been discussed in
many studies as instruments of customer loyalty and retention. Mass customization and

27
the corresponding approach of personalization have the potential to address competitive
market requirements while improving a firm’s profitability (Tseng and Pillar, 2003).
Prior studies developed the instrument of customer-centric knowledge management
(Stefanou et al., 2003; Alvert et al., 2004).
Colombo et al. (2004) defined eight CRM system modules. They classified CRM
system modules into three main categories and then each main category has multiple sub-
modules. The three main classifications are collaborative CRM system, analytical CRM
system, and operational CRM system. The collaborative CRM system includes two sub-
modules, channel management and call center/help desk. The analytical CRM system
also includes two sub-modules data integration and data warehousing and knowledge
management. Lastly, the operational CRM system includes four sub-modules, field, sales,
marketing, and product management.
2.2.4 KM SYSTEM AND BI SYSTEM MODULES
Knowledge management systems facilitate the efficient and effective sharing of a
firm’s intellectual resources (Poston and Speier, 2005). KM systems refer to (generally IT
based) systems for managing knowledge in organizations for supporting creation, capture,
storage, and dissemination of information. KM systems are positively related to
administrative and technical innovation performance (Huang and Li, 2009; Thornhill,
2006). Sher and Lee (2002) presented that KM systems contribute to the enhancement of
dynamic capabilities and thus to the enhancement of business excellence and competitive
advantages.

28
Laudon and Laudon (2010) defined KM systems as enterprise-wide systems for
managing and distributing documents, graphics, and other digital knowledge objects;
systems for creating corporate knowledge directories of employees with special areas of
expertise; office systems for distributing knowledge and information; and knowledge
work systems to facilitate knowledge creation. Other knowledge management
applications use intelligent techniques that codify knowledge for use by other members of
the organization and tools for knowledge discovery that recognize patterns and important
relationships in large pools of data.
The last entity that the study considers as EIS is business intelligence systems. BI
systems are designed to help individual users grapple with vast quantities of data as they
make decisions about organizational processes (Watson et al., 2004). Once data have
been captured and organized in data warehouses and data marts, they are available for
further analysis. BI systems encompass a set of tools, techniques, and processes to help
harness this wide array of data and allow decision makers to convert them to useful
information and knowledge (Negesh, 2004). A series of tools enables users to analyze
data in search of new patterns, relationships, and insights that are useful for guiding
decision making. BI systems are tools for consolidating, analyzing, and providing access
to vast amounts of data to help users make better business decisions. Principle tools for
business intelligence include software for database query and reporting, tools for
multidimensional data analysis (online analytical processing, OLAP), and data mining.

29
2.3 OSS EIS
Implementation of enterprise systems, such as EIS, requires a large amount of
investment and its inherent risk makes firms hesitate to implement the system, especially
for SMBs. Recently, as open-source projects became more popular, there have been some
studies on OSS EIS. Lee et al. (2010) conducted a comparative study of proprietary and
OSS ERP modules. They investigated Sourceforge.net, a community-driven OSS
developing site that has 348,000 open source projects including EIS, business intelligence,
and database management systems, among others. The study shows that OSS ERP
projects are being developed more in supportive modules than value chain modules,
which are opposite to the results from the proprietary studies as shown in Table 2.4.
The rankings of proprietary ERP modules were calculated based on the results
from the three studies by Mabert et al. (2000), Olhager and Selldin (2003), and
Katerattanakul et al. (2006). The rankings of ERP modules in proprietary market are
almost opposite of the ranking of OSS modules. Even though OSS is disruptively
innovative, it is the commercial vendors of enterprise systems that are still dominating the
market for ERP main activities modules.

30
Rank Proprietary EIS OSS EIS
1 Materials Management Maintenance
2 Purchasing N/A
3 Financial & Accounting Disagree
4 Order Entry Complete ERP
5 Production Planning Distribution/Logistics
6 Financial Control Financial & Accounting
7 Distribution/Logistics Personnel/Human Resource
8 Asset Management Material Management
9 Personnel/Human Resources Production Planning
10 Quality Management R & D Management
11 Maintenance Asset Management
12 R&D Management Purchasing
13 -- Quality Management
14 -- Order Entry
15 -- Financial Control
Table 2.4 Proprietary ERP Implementations and OSS ERP Projects
Explanation can be that because large firms already have large financial
investments and implemented the main-activities modules, they are reluctant to
experiment and install new OSS modules. Large firms do not want to take high risk for
such main modules of the value chain. They would rather like to get their toes in and
experiment with OSS for the supportive modules of ERP and may want to see if there is a
compatibility issue between the existing main-activities modules and OSS modules.
According to the work done by Park et al. (2002), manufacturing was the highest
regarding proprietary ERP implementation with 71.7% among the industries of the

31
respondents’ organization. Damanpour (1992) studied about the relationship between
organizational size and innovation. The size of firm is more positively related to
innovation in manufacturing and profit-making organizations than in service and non-
profit-making organizations. They also found that size is more strongly related to the
implementation of proprietary system than to the initiation of innovation (OSS system) in
organizations. These findings are consistent with the results of the comparison by Lee et
al. (2010) and also induce a conclusion that large organizations are reluctant to adopt
OSS EIS.
On the other hand, since OSS ERP is more affordable, SMBs are the ones which
are more likely to try out the free software as an alternative of expensive proprietary ERP.
There are, however, an increasing number of large firms using OSS EIS, such as Home
Depot, Toyota, and Fidelity (Weber, 2005). This indicates that OSS EIS receives more
focus than before. In recent years, the general OSS development model has gained
significant momentum and is now generally considered a viable approach also in
commercial settings (Ågerfalk and Fitzgerald, 2008). Because of its nature of virtuality
and since anyone can joint any OSS project, the development of on-line community can
be assumed to be global (Millar et al. 2005). Agerfalk and Fitzgerald (2008) in their study
collected numerous instances of research that confirm the global nature of contributions
to open source projects (Lakhani and Wolf, 2001; Ghosh et al., 2002; Dempsey et al.,
2002; Robles-Martinez et al., 2001).

32
2.4 OSS EIS MODULES
This dissertation first identifies the extent of OSS EIS module use. To identify the
OSS EIS modules that are frequently downloaded by users, the study investigated the top
10 on-line OSS communities shown in Table 1.1. A total of 1,240 OSS EIS projects were
collected: 1,199 projects from SourceForge.net; 5 from GitHub; 35 from Launchpad; 1
from TuxFamily. Several items that describe each project were collected: title,
description, number of download, and recommendation rate by users. Appendix C has a
table that contains the entire lists of OSS projects collected for this research.
Based on the literature review presented in 2.2, this study develops a
comprehensive set of EIS modules as shown in Table 2.5 that were used in the content
analysis and the confirmatory analysis consistently. It consists of the following primary
categories: ERP, CRM, and SCM, each category has sub categories. KM systems and BI
systems are not shown in the top level because in many cases, they match with one of the
subcategories of ERP, CRM, or SCM. The 1,240 OSS EIS projects collected from top 10
on-line OSS communities are categorized based on this set of modules and gives the
extent of use. The survey on users reveals the actual use of OSS EIS modules. The two
results are compared and discussed in Chapter 4.

33
Enterprise Information Systems (ERP) 1. Financial & Accounting 2. Materials Management 3. Production Planning 4. Order Entry 5. Purchasing 6. Financial Control 7. Distribution/Logistics 8. Asset Management 9. Personnel/Human Resources 10. Quality Management 11. Maintenance 12. R&D Management
Customer Relationship Management (CRM)
1. Channel Management 2. Call Center/Help Desk 3. Data Integration/Data Warehousing 4. Knowledge Management 5. Field 6. Sales 7. Marketing 8. Product Management
Supply Chain Management (SCM)
1. Delivery (transportation execution, invoicing) 2. Make (to order, to stock, process manufacturing, discrete manufacturing,
sales order processing, bill of materials, production control, inventory replenishment, order promising)
3. Return 4. Plan (demand planning, supply planning, service parts planning, supply
and demand matching, optimize inventory, network design, production planning, transportation planning)
5. Source (procurement, purchase order processing) 6. Data Management (XML, RFID, EDI) 7. Decision Support (optimization, reporting, modeling, forecasting, product
lifecycle management, scenario analysis, simulations) 8. Relationship Management (distributor, competitor, retailer, manufacturer,
supplier) 9. Performance Improvement (lean supply chain, performance analysis,
collaboration, quality management)
Table 2.5 EIS Modules

34
2.5 IS SUCCESS MODEL
A large number of studies have been conducted to identify success factors of
information systems. Prior studies have focused on various aspects of IS success for three
decades (Matlin, 1979; Melone, 1990; DeLone and McLean, 1992; Bonner, 1995;
Ballantine et al., 1996; Gable, 1996; Kapalan and Norton, 1996; Myers et al. 1998;
Seddon et al, 1999; Irani and Love, 2000; Lin and Shao, 2000; Thatcher and Oliver, 2001;
DeLone and McLean, 2002; Rai et al., 2002; Shin, 2003; DeLone and McLean, 2003;
Gable et al., 2003; Sedera and Gable, 2004; Sabherwal et al., 2006; Gable et al., 2008;
Lee et al., 2009).
Rai et al. (2002) assessed two main IS success models: DeLone and McLean
(1992) and Seddon (1997). Their findings support DeLone and McLean’s argument that
IS success models need to be carefully specified in a given context. Shin (2003)
investigated the effectiveness of the four IS success constructs, system quality,
information quality, and service quality on user satisfaction in the context of data
warehouse by employing a survey and interview. Sabherwal et al. (2006) developed a
theoretical model combining four IS success constructs developed in prior studies. They
added four user-related constructs: user experience with IS, user training in IS, user
attitude toward IS, and user participation in the development of IS.
Irani and Love (2000) conducted a case study at a leading manufacturing
organization during its adoption of a vendor-supplied MRPII. They developed technology
management taxonomies that contributed to the successful MRP implementation. Seddon
et al. (1999) developed an IS effectiveness matrix for conceptualizing IS success
measurements in the two dimensions, the type of system and the type of stakeholder.

35
Thatcher and Oliver (2001) examined the impact of technology investment on various
measures of performance, such as product quality, production efficiency, and firm
productivity. Thatcher and Olivers’s study (2001) evaluated IS investments post-
implementation. Myers (1998) suggested a comprehensive IS success model by
combining prior studies and adding a service quality dimension.
Gable et al. (2003) developed four measurement models and 27 instruments for
assessing enterprise system success by employing an exploratory inventory survey
followed by a confirmatory weights survey. The four measurement models are
information quality, system quality, individual impact, and organizational impact. Sedera
and Gable (2004) found the four distinct dimensions of IS success in the context of
enterprise information systems – individual impact, organizational impact, system quality,
and information quality.
Prior studies discussed here have heavily referred to DeLone and McLean’s
works (1992, 2002, 2003). The DeLone and McLean (1992) IS success model is most
widely cited and has provided valuable contributions to the literature of IS success.
DeLone and McLean (1992) introduced their first edition of a comprehensive taxonomy
with six major dimensions – system quality, information quality, use, user satisfaction,
individual impact, and organizational impact. Their study on IS success model was based
on the review of 180 conceptual and empirical studies.
As the output of an information system or the message in a communication
system, information can be measured at different levels, including the technical level, the
semantic level, and the effectiveness level (Shannon and Weaver, 1949). For Shannon
and Weaver (1949), these were defined as accuracy and efficiency of the system, the

36
success of the information in conveying the intended meaning, and the effect of the
information on the receiver, respectively. Based on this concept, DeLone and McLean
argued that information flows through a series of states from its production through its
use or consumption to its influence on individual and/or organizational performance. The
six distinct dimensions of IS success developed by DeLone and McLean (1992) matching
with Shannon and Weaver’s (1949) three dimensions are: system quality at technical
level; information quality at semantic level; and use, user satisfaction, individual impact,
and organizational impact at effectiveness level.
The present study built, as an expansion of the general IS success model, an OSS
EIS success model employing seven constructs: Information Quality, OSS EIS Quality,
Community Service Quality, OSS Use, User Satisfaction, Individual Net Benefit, and
Organizational Net Benefit.
2.5.1 SYSTEM QUALITY
System quality construct has been represented in some of prior research as ease of
use to measure the quality of an information system itself. Some IS researchers have
studied the processing system itself to evaluate the contribution of information systems to
the organization. Rai et al. (2002) utilized user friendliness and ease of use as the two
instruments to measure system quality. For his IS success study in the context of data
warehouse, Shin (2003) included system throughput, ease of use, ability to locate data,
access authorization, and data quality (currency, level of detail, accuracy, consistency).
Wixom and Todd (2005) defined reliability, flexibility, integration, accessibility, and

37
timeliness as the measures of system quality in their combined model of user satisfaction
and technology acceptance.
Sabherwal et al. (2006) defined system quality as the quality of the system in
terms of reliability, ease of use, and response time. Their work separated user-related
constructs and context-related constructs from prior IS success models. They used
systems quality as a construct representing IS success. Gable et al. (2003) used system
quality as a construct of success for enterprise information systems. Sedera and Gable
(2004) found nine validated items to measure system quality for enterprise system
success. The nine items include: ease of use, ease of learning, user requirements, system
fearues, system accuracy, flexibility, sophistication, integration, and customization.
2.5.2 INFORMATION QUALITY
Information quality is to measure outputs of an information system. Wixom and
Todd (2005) developed an integrated research model based on two research stream, user
satisfaction literature and technology acceptance literature. They defined completeness,
accuracy, format, and currency as four information quality antecedents. Rai et al. (2002)
developed seven items to measure information quality, which has the attributes of content,
accuracy, and format required by the user. Shin (2003) investigated information quality
dimension by measuring the utility (usefulness) of information acquired from a data
warehouse. Some IS researchers have preferred to measure the quality of the information
that the system produces, primarily in the form of reports. Gable et al. (2003) used
information quality as an IS success factor of enterprise systems.

38
Ahituv (1980) developed five information characteristics: accuracy, timeliness,
relevance, aggregation, and formatting. Swanson (1974) developed measurements, such
as uniqueness, conciseness, clarity, and readability to measure IS appreciation among
user managers. King and Epstein (1983) proposed multiple information attributes
including sufficiency, understandability, freedom from bias, reliability, decision
relevance, comparability, and quantitativeness to yield a composite measure of
information value. Iivari and Koskela (1987) included three information quality
constructs: informativeness, which consists of relevance, comprehensiveness, recentness,
accuracy, and credibility; accessibility which consists of convenience, timeliness, and
interpretability; and adaptability.
2.5.3 SERVICE QUALITY
Service quality is to measure the extent of service that IS users experience from
communities. Communities, in our context of OSS EIS, include on-line communities or
partners who provide OSS EIS and/or supports to organizations. Researchers who argue
to include service quality as a measure of IS success apply the 22-item SERVQUAL
measurement instrument. SERVQUAL measurement includes five dimensions: tangible,
reliability, responsiveness, assurance, and empathy. Examples of the instruments are: “IS
has up-to-date hardware and software” (tangible); “IS is dependable” (reliability); “IS
employees give prompt service to users” (responsiveness); “IS employees have the
knowledge to do their job well” (assurance); “IS has users’ best interests at heart”
(empathy) (DeLone and McLean, 2003).

39
Parasuraman et al. (1988) originally developed the 22-item SERVQUAL
instrument for assessing customer perceptions of service quality in service and retailing
organizations. There were some controversies between Parasuraman et al.’s (1988) work
and other studies regarding the discrepancy between expectations and perceptions
(Cronin and Taylor, 1992; Teas, 1993) and difference score conceptualization (Brown et
al., 1993). Asubonteng et al. (1996) compared Parasuraman et al.’s work (1988) with
other studies in terms of the scale’s psychometric properties. Lee et al. (2000) confirmed
that perceived service quality is an antecedent of satisfaction.
Yang et al. (2004) claimed the difficulty of defining and interpreting the meaning
of service quality in Web sites. Service quality dimensions differ according to the context.
It is hard to develop a global measure of service quality for IS. DeLone and McLean
(2003) defined service quality in e-commerce context as “the overall support delivered by
the service provider, applies regardless of whether this support is delivered by the IS
department, a new organizational unit, or outsourced to an Internet service provider (ISP).
Its importance is most likely greater than previously since the users are now our
customers and poor user support will translate into lost customers and lost sales (p.25).”
Shin (2003) included user training as construct for service quality for a IS success model.
Yang et al. (2005) validated five instruments to measure service quality on a Web portal.
The instruments include: usability, usefulness of content, adequacy of information,
accessibility, and interaction. Pitt et al. (1995) insisted to include service quality in
assessment package of IS success.
40
2.5.4 SYSTEM USE
System use use is an indicator that shows the extent of OSS EIS use by individual
users. Rai et al. (2002) measured ‘utilization’ for IS use through an instrument.
Utilization is the degree to which the user is dependent on the IS for the execution of
their tasks. Sabherwal et al. (2006) used system use as a construct to measure the
individual’s behavior of, or effort put into, using the system.
2.5.5 USER SATISFACTION
User satisfaction is to measure recipients’ response to the use of the output of an
information system. Sabherwal et al. (2006) used user satisfaction as a construct for IS.
Chen et al. (2000) and Ginzberg (1981a, b) chose user satisfaction as his dependent
variable. Some IS researchers have suggested user satisfaction as a success measure for
their empirical IS research (Ein-Dor and Segev, 1978; Hamilton and Chervany, 1981).
Rai et al. (2002) defined user satisfaction as perceptual measures of net benefits from IS
use for their study in assessing the validity of IS success models.
2.5.6 INDIVIDUAL IMPACT
Individual impact is to measure the effect of information on the behavior of the
recipient. Impact is probably the most difficult measure to define in a non-ambiguous
fashion. It is closely related to performance, and so "improving my - or my department's -
performance" is certainly evidence that the information system has had a positive impact.
Sabherwal et al. (2006) defined individual impact as perceived usefulness in their work of

41
IS success on individual and organizational impact. Their definition of individual impact
is the degree to which an individual believes that using the system enhances his or her
productivity and job performance. IS success research on enterprise system (Gable et al.,
2003; Sedera and Gable, 2004) defined individual impact as an IS success measure.
Sedera and Gable (2004) measured individual impact for their enterprise systems success
measurement model by using four items: learning, awareness/recall, decision
effectiveness, and individual productivity.
2.5.7 ORGANIZATIONAL IMPACT
Organizational Impact is a construct intended to measure the effect of information
on organizational performance. Gable et al. (2003) included enterprise system-related
measures for their IS success model. They insisted that the measure of system quality for
EIS must be the extent to which functionality and data have been integrated. The four
measures they added were customization (system quality), increased capacity, e-
government, and business process change. Sedra and Gable (2004) identified 8 items to
measure organizational impact, including organizational costs, staff requirements, cost
reduction, overall productivity, improved outcomes/outputs, increased capacity, e-
Government, and business process change.

42
CHAPTER THREE
RESEARCH DESIGN AND METHODS
“In devising any methodological strategy, it is prudent to take into
consideration the subjects’ perceptions (Rosnow and Rosenthal 1996, p.5).”
This chapter outlines the research framework and methodology employed in this
study. The research is based on a two-phase qualitative/quantitative mixed method as
shown in Figure 1.2. The first phase of the study is a descriptive research employing a
qualitative method, which is to describe what is happening and to map out a situation
(Rosnow and Rosenthal, 1996). It investigates online OSS communities to identify the
most downloaded OSS EIS modules. The second phase is considered a relational research
design that seeks to understand how the variables are related. It extends the IS success
model by including OSS and EIS properties. This section discusses the research model,
hypotheses, variables, survey instrument, data sources, sample selection, and statistical
techniques employed in the study.
3.1 PHASE ONE
This chapter describes a method to categorize OSS EIS projects into major EIS
modules defined in Chapter 2.2 and Table 2.5. The study conducts content analysis,
which has been widely used for Web based data analysis (Finney and Corbett, 2007). The
five steps of content analysis suggested by McMillan (2000) are: formulate research

43
questions/hypotheses, select samples, define categories, train coders/coding, and
analyze/interpret data.
3.1.1 DATA SELECTION
Investigating the top 10 OSS communities as shown in Table 1.1 found EIS
projects from only four communities: SourceForge.net, GitHub, Launchpad, and
TuxFamily. As of March 2010, SourceForge.net, the largest on-line OSS community
nurtures more than 3,300 enterprise software projects. The projects were first sorted by
the number of downloads and projects that have user comments. The projects that do not
have user comments were ignored since in the second phase of this study uses the
constructs of user perspectives and the results from the two phases are compared. The
descriptions of the most downloaded 1,199 projects were retrieved from SourceForge.net.
Other communities either have a small number of EIS projects or are impossible to
categorize projects. Five EIS projects from GitHub, 35 from Launchpad, and 1 from
TuxFamily are added and a total of 1,240 OSS EIS projects are collected and analyzed.
3.1.2 UNITS OF CONTENT ANALYSIS
Two general types of units relevant to content analysis are study units and
information units. Study units are the elements of content that are defined by the content
analyst in the process of reducing and selecting the material to be studied. Information
units are specifically related to the meaning and production of content, and selected by

44
the content analyst, but they are defined independently of study, usually by the creator of
the content.
Among the various types of units used in content analysis, the study adopts coding
units and context units as study units that provide a sufficient condition in classifying
OSS EIS projects into appropriate categories developed in Chapter 2.2 and Table 2.5.
Coding units are the smallest segment of content counted and scored in the content
analysis. The context unit is the body of material surrounding the coding unit.
The coding/recording unit of this study is the description of each project provided in
on-line community Web sites. The description provides detailed information of projects,
such as functions, update dates, compatibilities, etc. The context unit is of textual matter
that sets limits on the information to be considered in the description of recording units.
Krippendorf (2004) suggested that the best content analysis defines context units as large
as meaningful (adding to their validity) and as small as feasible (adding to their
reliability). Combining the two attributes, project name and description, help create a
unique category for each project and, therefore, is used as the context unit.
3.1.3 SAMPLE
To have the effect of reducing the standard error and giving a more precise
estimate of reliability, the suggested sample size is 20% or more of the population (Riffe
et al., 2005). From the total of approximately 3,400 existing OSS EIS projects in the on-
line OSS communities, the collected data size of 1,240 is well over the suggested sample
size, 680. If the suggested sample size is simply followed, twenty nine categories in
Table 2.5 is rather a large number and that may lead to too small a number of content in

45
each category. Thus, the study used the 1,240 projects that are large enough to avoid this
issue by having at least 40 contents in each category. The majority of the data for coding
were collected from the on-line OSS communities by using a web crawler, Web Content
Extractor, Version 4.0. An example of project title and description that were captured for
the analysis is shown in Appendix D.
3.1.4 MODULES
For content analysis, the categories of the nominal scale must be independent,
mutually exclusive, and exhaustive. The 29 EIS modules, identified based on literature
review and shown in Table 2.5, provide the necessary conditions.
An N/A is added to the categories. The N/A category includes projects with a
description written in a foreign language, no relation to any of EIS modules, insufficient
information to categorize, ambiguous information, etc. EIS projects that have several
functions are categorized into multiple modules.
3.1.5 INTER-CODER TRAINING AND RELIABILITY
Project descriptions are classified based on the coding scheme discussed in the
previous section. The study follows the classification process used by Vessey et al.
(2002). Having the same set of projects, the study could avoid the inter-coder reliability
for changing content that McMillan (2000) referred. Knowing the sample size enabled
the study to check the inter-coder reliability.

46
To achieve a minimum of 85% reliability agreement, the estimate agreement in
the population (P) would be 90%. The confidence level of 95% with one-tailed z score,
which is 1.64, yields the standard error (SE) of .03(.05 = 1.64 * SE). Using these numbers
to achieve a minimum of 85% reliability agreement and assuming P equals 90% (5%
above our minimum), the test sample size based on the formula that Riffe, Lacy, and Fico
(2005) suggested is:
PQSEN
PQNSENn+−+−
= 2
2
))(1())(1(
1.9.)03)(.11239(12391.9.)03)(.11239(
2
2
×+−××+−
=
= 93.457 in which N = the population size (number of content units in the study) P = the population level of agreement Q = (1 – P) n = the sample size for the reliability check
Only 94 projects out of the 1,240 projects are selected by using a random number
generator. Random sampling is used for the inter-coder reliability test for two reasons: (1)
it controls for the inevitable human biases in selection, and (2) it produces, with a known
possibility of error, a sample that reflects the appropriate proportions of the
characteristics of the overall population of content being studied.
The study employed three coders who are all doctoral students majoring in
management. During the early stages of the classification process, the researchers coded
19 projects in each sitting. Each coding session was followed by a resolution session

47
where disagreements in the coded data were resolved and recorded. After classifying and
resolving the coding for the first 94 randomly selected projects, another set of 94 projects
were randomly selected. The researchers coded 34 projects in each sitting followed by a
resolution session again.
Inter-coder reliabilities were assessed for each of the categories using Cohen’s
kappa to determine whether the rules for coding were applied consistently across each
coder. Cohen’s kappa reliabilities for each pair of coders are listed in Table 3.1.
Coder 1 Coder 2 Coder 3Coder 1 -- .489 .478 Coder 2 -- -- .482 Coder 3 -- -- --
Table 3.1 Cohen’s Kappa of Each Pair of Three Coders with p<.001
After the training sessions, coding process was implemented by a set of 100
projects at a time. The four sets of 100 projects showed similar distributions of OSS EIS
modules. Because the projects were sorted by the number of downloads, the low-ranked
projects were irrelevant projects or/and have ambiguous descriptions, which confused the
coders. Since the accumulated inter-coder reliability was decreasing as more projects
were coded, coding process was stopped. The average inter-coder reliability was .483 for
the most downloaded 400 projects. According to Landis and Koch (1997), kappa values
between .41 and .60 are regarded as “moderate.” The reliability measures of agreement
between three coders were quite satisfactory.

48
3.2 PHASE TWO
In this section, a design of the confirmatory study, based on prior IS success
models and its extension, is discussed. Sub-sections include the details of the research
design, research model, hypotheses, survey instrument, etc.
3.2.1 RESEARCH FRAMEWORK
To identify the factors that influence OSS EIS success, this study developed an
OSS EIS success model based on a previous IS success model of DeLone and McLean
(1992, 2003) and extends it by incorporating characteristics of OSS and EIS. DeLone and
McLean proposed their original IS success model in 1992 and they presented a new
framework in 2003.
In the first model, they identified six dimensions of success: system quality,
information quality, use, user satisfaction, individual impact, and organizational impact,
as discussed in Chapter Two. After a decade, this model was updated by adding another
dimension, service quality. Pitt et al. (1995) suggested IS service quality as a factor of IS
effectiveness in their assessment package.
Additionally, the new model simplified the “impacts” of individuals and the
organization. Because of the ambiguity of the impact level suggested by many studies,
such as work group impact, inter-organizational and industry impact, consumer impact,
and societal impact, all the impact measures were grouped into a single category called
“net benefits.” Recent works also show a wide range of contexts in the impact subject,
such as organizational impact (Bayraktar et al., 2009; Hahn et al., 2009), cost impact
(Borzekowski, 2009), operational impact (Kauremaa et al., 2009; Haigh and Griffiths,

49
2009), project management impact (Raymond and Bergeron, 2008), and human resource
impact (Hussain et al., 2007).
Lee et al. (2009) investigated DeLone and McLean’s (1992, 2003) model in OSS
context. They dropped system quality from the model since their study focused on the
success of OSS (e.g., Linux operating system), not on OSS-based application systems
(e.g., Linux-based sales system). They claimed that OSS itself is not an application
system and does not produce or process information as an output.
Based on observations of these previous studies, the present study used 7
dimensions to investigate the success factors of OSS EIS: information quality, OSS EIS
quality, community service quality, OSS EIS use, user satisfaction, individual net
benefits, and organizational net benefits as shown in Figure 1.1.
3.2.2 HYPOTHESES
Based on the reviews of IS success models in prior literature, the present research
proposes the research model and hypotheses in this section. Ten hypotheses are proposed
for this research as shown in Figures 3.1.
3.2.2.1 EFFECT OF INFORMATION QUALITY ON SYSTEM USE AND USER
SATISFACTION
DeLone and McLean (1992) argued that the information quality and system
quality singularly and jointly affect both use and user Satisfaction. Unlike other IS, such
as operating systems that do not have outputs to users, EIS produce formal system
outputs such as reports, documents, etc. To incorporate this EIS characteristic of the

50
research, Information Quality must be measured and its relationship with system use
(OSS EIS Use in this study) and User Satisfaction.
Rai et al. (2002) performed confirmatory factor analyses on DeLone and
McLean’s model (2003) and Seddon’s model (1997). They found information quality has
significant effects on both system use and user satisfaction in Seddon’s model.
Information quality has significant effects on system use in DeLone and McLean’s model.
Since these relationship may also be applicable within the OSS EIS context, following
hypotheses are made:
H1. Information Quality has a direct positive effect on OSS Use.
H2. Information Quality has a direct positive effect on User Satisfaction.
3.2.2.2 EFFECT OF SYSTEM QUALITY ON SYSTEM USE AND USER SATISFACTION
Sabherwal et al. (2006) suggested that system quality has significant effects on
user satisfaction. DeLone and McLean (2003) hypothesized that the system quality (OSS
EIS Quality in this research) is positively related to IS use. The Technology Acceptance
Model (TAM) and related empirical studies show that perceived ease of use and
usefulness, the two key aspects of system quality, have significant effects on attitude
toward using IS (Davis, 1989). Seddon and Kiew (1994) found the relationship between
system quality and user satisfaction to be statistically significant.
Later, Rai et al. (2002) confirmed the significant effects of ease of use, which is
equivalent to system quality, on user satisfaction by exploiting Seddon’s (1997) model.

51
They also confirmed that ease of use has significant effects on user satisfaction in
DeLone and McLean’s (2003) model. Since these relationships may also be applicable
within the OSS EIS context, following hypotheses are made:
H3. OSS EIS Quality has a direct positive effect on OSS EIS Use.
H4. OSS EIS Quality has a direct positive effect on User Satisfaction.
3.2.2.3 EFFECT OF SERVICE QUALITY ON SYSTEM USE AND USER SATISFACTION
Pitt et al. (1995) suggested that service quality (Community Service Quality in
this study) influence IS use (OSS EIS Use in this study). DeLone and McLean (2003)
also suggested that service quality is positively related to IS use. In many prior studies,
service quality is regarded as an antecedent to satisfaction (Bitner et al., 1990; Lee and
Yoo, 2000). Since these relationships may also be applicable within the OSS EIS context,
following hypotheses are made:
H5. Community Service Quality has a direct positive effect on OSS EIS Use.
H6. Community Service Quality has a direct positive effect on User
Satisfaction.
3.2.2.4 EFFECT OF USER SATISFACTION ON SYSTEM USE
The relationship between user satisfaction and system use are widely supported
by prior studies (D’Ambra and Rice, 2001; Gelderman, 1998; Grover et al., 1998). An
empirical study by Bolton and Lemon (1999) found that those users who are satisfied

52
with an IS continue to use the IS. Since the relationship may also be applicable within the
OSS EIS context, following hypothesis is made:
H7. User Satisfaction has a direct positive effect on OSS EIS Use.
3.2.2.5 EFFECT OF SYSTEM USE ON INDIVIDUAL NET BENEFIT
A number of previous studies support the positive relationship between system
use and individual net benefit (Sabherwal et al., 2006; D’Ambra, 2001; Doll and
Torkzadeh, 1998; Guimaraes and Igbaria, 1997; Grover et al., 1996; Hitt and
Brynjolfsson, 1994; Clemons et al., 1993; Bailey and Pearson, 1983;). Srinivasan (1985)
also found that the indicators of system use are significantly related to the problem
solving capabilities of the user. Since this relationship may also be applicable within the
OSS EIS context, following hypothesis is made:
H8. OSS EIS Use has a direct positive effect on Individual Net Benefit.
3.2.2.6 EFFECT OF USER SATISFACTION ON INDIVIDUAL NET BENEFIT
Lee et al. (2009) argued that the relationship between user satisfaction and
individual net benefits can be explained by the affect-as-information model. According to
the affect-as-information model, people rely on their actual feelings (satisfaction or
emotional response) to form overall judgments (net benefits). This is because feelings are
influential not just in determining valuable judgmental information, but also are regarded
as representatives of the target. Gatian (1994) also supported this relationship, which can
be applicable for the OSS EIS context.

53
Rai et al’s (2002) confirmatory factor analyses on DeLone and McLean’s (2003)
and Seddon’s (1997) IS success model revealed that user satisfaction has significant
effects on perceived usefulness, which can be translated to individual impact. Since the
relationship may also be applicable within the OSS EIS context, following hypothesis is
made:
H9. User Satisfaction has a direct positive effect on Individual Net Benefits.
DeLone and McLean (2003) argued in their updated model that no system use is
totally voluntary. At some level of organization, executives or managers required
employees to use a certain type of information systems. Hence, the continued adoption
and use of the system itself may not be voluntary. In the context of EIS of the present
study, use of system has to be assumed as mandatory.
The study is interested in investigating the path where the effect of user
satisfaction on individual net benefit is mediated by OSS EIS use. Direct effect, indirect
effect, and total effect are calculated and compared.
3.2.2.7 EFFECT OF INDIVIDUAL NET BENEFIT ON ORGANIZATIONAL NET
BENEFIT
DeLone and McLean (2003) argued that net benefits are measured in terms of job
and decision-making performance. As the impact of IS evolves beyond the immediate
user, prior studies suggested additional IS impact measures. The choice of where the
impacts should be measured depends on the system or systems being evaluated and their
purposes (DeLone and McLean, 2003). DeLone and McLean simplified their original IS
success model by removing the organizational net benefits.

54
The present research separates organizational net benefits from individual net
benefits to incorporating the characteristic of EIS that are utilized at the organizational
level. The relationship between individual net benefit and organizational net benefit is
supported by prior studies of Chan (2000) and Etezadi-Amoli and Farhoomand (1996),
and it may also be applicable within the OSS EIS context. Hence, the study hypothesizes:
H10. Individual Net Benefit has a direct positive effect on Organizational Net
Benefit.

INFORMATIONQUALITY
OSS EISQUALITY
COMMUNITYSERVICEQUALITY
OSS EIS USE
USERSATISFACTION
INDIVISUAL NET BENEFITS
ORGANIZATIONALNET BENEFITS
H1
H2
H3
H4
H5
H6
H7
H8
H9
H10
Figure 3.1 Research Model with Hypotheses
55

56
3.2.3 MEASURES OF ENDOGENOUS VARIABLES
The model has four endogenous variables: OSS EIS Use, User Satisfaction,
Individual Net Benefits, and Organizational Net Benefits. The study developed the
survey instrument by employing existing validated instruments wherever possible.
OSS EIS Use is equivalent to the system use construct in the prior studies of IS
success in general discussed in 2.5.4. OSS EIS Use is to measure the level of OSS EIS use
by a user. Prior studies on IS success used system use as a construct in IS success models
(Kim and Lee, 1986; Rai et al., 2002; Sabherwal et al., 2006; Lee et al., 2009). Seddon
(1997) argued for the removal of the ‘system use’ construct in DeLone and McLean’s
first model because of its ambiguity. This issue was further investigated by later studies
and considered unjustifiable, considering the nature of the construct of various research
purposes. Lee et al. (2009) adopted the instruments for their study of OSS success from
the work of Cheung et al. (2000). Measurement items for OSS EIS Use of this study were
also adopted from Cheung et al. (2000)
User Satisfaction is a construct to measure users’ feelings about OSS EIS and
their response to the outputs of OSS EIS. User satisfaction has been employed as an IS
success factor in prior studies of various contexts (Sabherwal et al., 2006; Chen et al.,
2000; Rai et al., 2002; Shin, 2003). Bailey and Pearson (1983)’s study, which has been a
foundation of many IS success research, developed 39 items to measure and analyze
computer user satisfaction. Their study was based on a review of 22 studies of the
computer/user interface. Many items they identified were related to the 80’s electronic
data processing system, called the EDP system. Computer systems have been changed
during past decades in terms of architecture, hardware, software, network, and interface.

57
It may not be appropriate to use the same instruments for OSS EIS. For this reason the
present research excluded all the items related to EDP from Bailey and Pearson’s (1983)
items, such as: organizational position of the EDP function and the hierarchical
relationship of the EDP function to the overall organizational structure. Any items
measured by the precedent constructs of the study, which are the exogenous variables, are
also excluded from the present research.
Individual Net Benefit is to measure how OSS EIS has influenced users’
individual capabilities and effectiveness on behalf of the organization. This construct is
equivalent to individual impact described in 2.5.6. Some researchers (Gable et al., 2003;
Sedera and Gable, 2004) used individual net benefit as success factor in IS success
research on enterprise system. Sabherwal et al. (2006) measured perceived usefulness for
individual impact in their work of IS success.
This construct was excluded from DeLone and McLean’s (2003) updated IS
success model due to its ambiguity as described in Chapter Two. However, the present
research uses this construct because it concerns enterprise level software and, therefore,
has to incorporate organizational characteristics. The present research adopts four items
of Gable et al.’s measurements (2003) for Individual Net Benefit.
Organizational Net Benefit is a measure of the extent to which OSS EIS has
promoted improvement in organizational results and capabilities. This construct is
equivalent to organizational impact in traditional IS success models. Three items of
organization-impact measurements developed by Gable et al. (2003) were adapted for
Organizational Net Benefit in this study. Gable et al. (2003) proposed an IS impact
measurement model that explains the stream of net benefits from an IS as perceived by

58
key user groups. The model includes four dimensions in two halves. The “impact” half
measures individual and organizational benefits/impacts; the other half, “quality”, uses
system quality and information quality as proxies for probable future impacts. The
present research used system quality (OSS EIS Quality) and information quality as
exogenous variables, which are explained in the following section. The endogenous
variables and the measurement methods are defined in Table 3.2.
3.2.4 MEASURES OF EXOGENOUS VARIBALBES
The model of this study has three exogenous variables: Information Quality, OSS
EIS Quality, and Community Service Quality. The study developed the survey instrument
for exogenous variables by adopting existing validated instruments wherever possible as
well.
Information Quality is to measure the quality of OSS EIS outputs: namely, the quality of
the information the system produces in reports and on-screen. Many recent studies
indicated information quality as a success factor of IS (Rai et al., 2002; Shin, 2003; Gable
et al., 2003; Wixom and Todd, 2005). Wixom and Todd (2005) defined completeness,
accuracy, format, and currency as four information quality antecedents. Rai et al. (2002)
measured information quality of IS by using seven items: accuracy, relevance,
sufficiency, correctness, satisfaction, quality of output, and value of output. Shin (2003)
investigated information quality dimension by measuring the utility (usefulness) of
information acquired from a data warehouse. Some IS researchers have preferred to
measure the quality of the information that the system produces, primarily in the form of
reports.

59
Gable et al. (2003) used information quality as an IS success factor of enterprise
systems. Bailey and Pearson (1983) identified 9 items to measure information quality:
accuracy, precision, currency, timeliness, reliability, completeness, format, and relevance.
King and Epstein (1983) also identified 9 similar items. Mahmood (1987) identified
report accuracy and report timeliness as information quality measurements. Miller and
Doyle (1987) found 4 items to measure information quality: completeness of information,
accuracy of information, relevance of reports, and timeliness of report. Srinivasan (1985)
identified report accuracy, report relevance, understandability, and report timeliness as
measurements for information quality. Based on the literature, the present research adopts
the three most frequently used items: timeliness, accuracy, and relevancy.
OSS EIS Quality is utilized to measure the performance of OSS EIS. This
construct is equivalent to the system quality construct described in 2.5.1. Prior studies
used system quality as a IS success factor (Rai et al., 2002; Shin, 2003; Gable et al., 2003;
Sedera and Gable, 2004; Wixom and Todd, 2005; Sabherwal et al., 2006).
DeLone and McLean (2003) developed this construct to measure the quality of
information system itself. It is based on Bailey and Pearson (1983)’s study that identified
convenience of access (ease of use), flexibility of system, integration of systems, and
response time. Wixom and Todd (2005) defined reliability, flexibility, integration,
accessibility, and timeliness as the instruments to measure system quality. Rai et al. (2002)
identified user friendliness and ease of use to measure system quality. Shin (2003)
identified system throughput, ease of use, ability to locate data, access authorization, and
data quality (currency, level of detail, accuracy, consistency) to measure system quality.
Sabherwal et al. (2006) defined reliability, ease of use, and response time to measure

60
system quality. Their work separated user-related constructs and context-related
constructs from the prior IS success model. They used system quality as a construct
representing IS success.
Gable et al. (2003) found 10 items of system quality measurement from prior
studies and used system quality as a construct in a study of EIS success. Sedera and
Gable’s (2004) nine validated items to measure system quality for enterprise system
success include: ease of use, ease of learning, user requirements, system fearues, system
accuracy, flexibility, sophistication, integration, and customization. Belardo et al. (1982)
identified reliability, response time, ease of use, and ease of learning; Srinivasan (1985)
identified response time, reliability, and accessibility; Franz and Robey (1979) identified
perceived usefulness of IS; Hiltz and Turoff (1981) and Goslar (1986) identified
usefulness as measurements for system quality. Larcker and Lessig (1980) proved the
validity and reliability of the perceived usefulness measure. The present research adopts
the most frequently used items from the prior studies: response time, ease of use, and
perceived usefulness.
Community Service Quality is to measure quality of community services that a
user experiences. This construct is equivalent to service quality described in 2.5.3. OSS
EIS communities include on-line communities or partners who provide OSS EIS and/or
supports to organization. Shin (2003) defined user training to measure service quality.
Yang et al. (2005) measured service quality by validating and using five validated
instruments: usability, usefulness of content, adequacy of information, accessibility, and
interaction.

61
The original model DeLone and McLean (1992) developed did not include
service quality as an IS success factor. Pitt et al. (1995) argued that an IS success model
should include a service component and they identified 5 items to measure service quality
for IS effectiveness. Later, DeLone and McLean (2003) added service quality as a
success measure in their IS success model. The present research adopts 5 measurement
items from the studies done by Pitt et al. (1995) and DeLone and McLean (2003) based
on SERVQUAL measurement instrument. Lee et al. (2009) adopted the same
measurements for their study.
Since the present research concerns success factors of OSS EIS, it is necessary to
incorporate OSS characteristics. OSS is developed in on-line communities by voluntary
developers who may also provide maintenance and support, such as bug fixes. Because
interactions between developers and users in on-line communities are observed, this
study includes service quality as a construct for the OSS EIS success model.
Questionnaire items suggested by DeLone and McLean (2003) are employed for
Community Service Quality. The exogenous variables and the measurement methods are
summarized in Table 3.3.
3.2.5 QUESTIONNAIRE DEVELOPMENT
As indicated in previous chapters, relatively few studies have empirically
examined OSS from the users’ perspective. However, previous studies that focus on user
perception in the IS discipline provide a rich set of literature as a basis of questionnaire
development for the present research. The measurement instrument, a survey of OSS EIS
users, is developed by adapting existing validated instruments wherever possible.

62
The instrument used in this research consists of three parts. The first part collects
basic demographic data on respondents and their organizations. The second part consists
of general questions about OSS EIS that a user has experienced. In the second phase,
users’ actual use of OSS EIS in different fields is sought to compare the data with the
results from the popularity analysis that is done in the first phase of the research. Part
three of the survey is designed to identify a user’s perspectives on OSS EIS. This part
provides the data for confirmatory analysis of phase two of this study. The research
model has seven constructs for which 30 questions are used based on previous studies.

63
Variable Definition of Variable Measurement Method OSS EIS Use (OEU)
Level of OSS EIS use by a user. 1. I use OSS EIS very frequently (many times per month).
2. I use OSS EIS very intensively (many hours per day). 3. Overall, I use OSS EIS a lot.
User Satisfaction (USF)
Users’ feelings about OSS EIS and response to the use of the output of OSS EIS.
1. The OSS EIS output information is complete. 2. I am satisfied with the material design of the layout
and display of the output contents from OSS EIS. 3. I have strong feeling of control over OSS EIS. 4. Overall, I am satisfied with OSS EIS.
Individual Net Benefit (INB)
Influences of OSS EIS on user’s individual capabilities and effectiveness on behalf of the organization.
1. I have learnt much through the presence of OSS EIS. 2. OSS EIS enhances my awareness and recall of job
related information. 3. OSS EIS enhances my effectiveness in the job. 4. OSS EIS increases my productivity. 5. Overall, the impact of OSS EIS on me has been
positive.
Organizational Net Benefit (ONB)
Improvements by OSS EIS in organizational results and capabilities.
1. OSS reduces cost. 2. OSS requires less number of staff then proprietary
software does. 3. OSS improves outcomes/outputs. 4. Overall, OSS increases organizational productivity.
Table 3.2 Definition of Endogenous Variables and Measurement Methods

64
Variable Definition of Variable Measurement Method Information Quality (IFQ)
Quality of OSS outputs: namely, the quality of the information the system produces in reports and on-screen.
1. Information from OSS is always timely. 2. Information from OSS is always accurate. 3. Information from OSS is always relevant to my
tasks. 4. Overall, OSS information quality is satisfactory.
OSS EIS Quality (system quality) (OEQ)
Performance of OSS EIS. 1. OSS EIS response is always quick. 2. OSS EIS is easy to use. 3. OSS EIS has useful functions. 4. Overall, OSS EIS system quality is satisfactory.
Community Service Quality (CSQ)
Quality of community services that a user experiences.
1. OSS EIS community has up-to-date hardware and software.
2. OSS EIS community is dependable. 3. OSS EIS community gives prompt service to
users. 4. OSS EIS community has the knowledge to do
its job sell. 5. OSS EIS community has users’ best interests at
heart. 6. Overall, OSS EIS service quality is satisfactory.
Table 3.3 Definition of Exogenous Variables and Measurement Methods

65
3.2.6 DATA COLLECTION
The population of interest of this research is end users of OSS EIS. To recruit this
population to collect an appropriate size of sample, the study first identified OSS EIS
users from popular on-line OSS communities. The study found a total of 1,240 OSS EIS
projects from on-line OSS communities by analyzing the title and description of OSS EIS
projects. Approximately 1,200 OSS EIS projects were identified from SourceForge.net;
35 projects from Launchpad; 5 from GitHub; and 1 from TuxFamily.
Investigating users’ comments on bulletin boards and blogs of the 1,240 OSS EIS
projects yielded: 196 unique OSS EIS users from OSS EIS projects in SourceForge.net;
102 users from 35 projects in Launchpad.com; 2 users from 1 project in TuxFamily; and
10 users from 5 projects in GitHub. A total of 310 unique users and their e-mails were
identified from on-line OSS communities.
The questionnaire was administered for a pretest by sending it to a subset of the
310 users. An invitation e-mail was sent to 103 users who participate in popular projects
of SourceForge.net. Kaplowitz et al. (2004) observed a 20 percent response rate
guideline for web surveys in their study. However, from 90 users except 13 bounced e-
mails, a total of 9 valid responses was received, for a response rate of 8.73 percent. A
soliciting letter for the survey was also posted in OSI (Open Source Initiative) website
and only 3 valid responses were collected. On-line bulletin boards of OSS were randomly
selected but no response was received.
Based on this dismal response rate experience, a survey agent who has over
25,000 panel members working in the software industry was solicited for the research

66
cooperation. The agent contacted panels by e-mail and received a total of 157 responses.
Seven incomplete responses were excluded from data analysis.
3.2.7 STATISTICAL TECHNIQUE
In the second phase of this research, a Structural Equation Model (SEM) was used.
SEM is a statistical methodology that takes a confirmatory, rather than an exploratory,
approach to data analysis (Byrne, 2010). Due to the confirmatory nature of present
research, SEM is appropriate to test the causal relationships among the variables and test
the hypotheses based on prior studies conducted in different context. Other advantages of
SEM when compared to multiple regression include: 1) testing models with multiple
dependent variables is conductible, 2) testing models with mediating variables is possible,
and 3) analyzing multi-group samples is possible (Lee and Lim, 2009). Hence, SEM was
chosen for modeling and investigating the relationships among variables because the
present research involves analyses with multiple dependent variables, multiple groups of
samples, and a mediating variable. To analyze the model of the research, AMOS 16.0
was used. The research model developed in AMOS is shown in Figure 3.3.
3.3 SUMMARY
The details of the research framework and methodology employed in this study
were discussed in this chapter. For content analyses on on-line OSS communities, three
coders were trained and achieved an acceptable rate of inter-coder reliability.

67
Based on the literature review discussed in 2.5, an OSS EIS success model was suggested.
The model consists of: three exogenous variables - Information Quality, OSS EIS
Quality, and Community Service Quality; four endogenous variables – OSS EIS Use,
User Satisfaction, Individual Net Benefit, and Organizational Net Benefit. Eleven
hypotheses were developed based on the paths between the variables.
Eleven constructs and their measurements were also discussed based on the prior
studies. The details of data collection procedure of the study were presented. The issue
with sample size is elaborated in 4.6 and 5.2.

68
Figure 3.2 Research Model Drawn in AMOS

69
CHAPTER FOUR
RESULTS, ANALYSIS, AND DISCUSSION
“A mediator accounts for the relation between the predictor and the
criterion (Baron and Kenny 1986, p.1176).”
Chapter Four presents the result of statistical analysis performed on the data
collected from the survey. The analysis measures the relationships among the success
factors of OSS EIS. This chapter is organized in four sections: (1) general characteristics
of survey respondents, (2) general questions about OSS EIS, (3) validity and reliability of
measurement tools, (4) validation of research model, and (5) discussion about the results
of a content analysis and a confirmatory analysis on the proposed OSS EIS success model.
4.1 DEMOGRAPHIC CHARACTERISTICS OF RESPONDENTS
The demographic characteristics of the 150 respondents within organizations
using OSS EIS are as shown in Table 4.1. Respondents, mostly young professionals, aged
30~39 were highest (46.00%), followed by 19~29 (25.33%), 40~49 (20.00%), over 60
(4.67%), and 50~59 (4.00%).
For the industry of the respondents’ organizations, IT/Communication was
highest (34.00%), followed by Service (26.67%), Manufacturing (11.33%), Distribution
(9.33%), and Financial (4.00%). For proprietary ERP implementation, as Park et al.
(2002) showed, Manufacturing was highest (71.70%), which is quite different from the
result of this study in which IT/communication and service take over 60%. For annual

70
revenue of organization, less than 0.5M was highest (26.67%), followed by $1M ~ less
than $10M (24.67%), $0.5M ~ $1.0M (19.33%), $10M ~ less than $50M (18.00%),
$50M ~ less than $500M (7.33%), and over $500M (4.00%).
Category Frequency Percent
Gender Male 78 52.00%
Female 72 48.00%
Age
19~29 38 25.33%
30~39 69 46.00%
40~49 30 20.00%
50~59 6 4.00%
Over 60 7 4.67%
Industry list
IT/Communication 51 34.00%
Service 40 26.67%
Manufacturing 17 11.33%
Distribution 14 9.33%
Financial 6 4.00%
Other 22 14.67%
Annual revenue
0 ~ $0.5 M 40 26.67%
$0.5 M ~ Less than $1 M 29 19.33%
$1 M ~ Less than $10 M 37 24.67%
$10 M ~ Less than $50 M 27 18.00%
$50 M ~ Less than $500 M 11 7.33%
Over $500 M 6 4.00%
Number of employees
Less than 100 62 41.33%
101~300 49 32.67%
301~1,000 22 14.67%
1,001~9,999 13 8.67%
Over 10000 4 2.67%
Total 150 100.00%
Table 4.1 Demographic Characteristics
71
Lastly, for the question asking for the number of employees in the organization,
less than 100 was highest (41.33%), followed by 101~300 (32.6 7%), 301~1,000
(14.67%), and 1,001~9,999 (8.67%), and over 10,000 (2.67%). The number of employees
is the most common way of classifying organizations. Ghobadian and O’Regan (2000)
suggested that firms employing fewer than 250 employees can be classified as SMBs. As
shown in the survey results, about 74% of the respondents are within the firms employing
less than 300 employees. This result confirms the results of Serrano and Sarriegi’s work
(2006) claiming that SMBs pursue to adopt OSS.
4.2 GENERAL CHARACTERISTICS OF OSS EIS
4.2.1 DURATION OF OSS EIS USE
The responses on the duration of OSS EIS use in organization are shown in Table
4.2. 1 year ~ 2 years was highest (34.00%), followed by 6 months ~ 1 year (28.00%), less
than six months (15.33%), 2 ~ 5 years (14.00%), and more than 5 years (8.67%). The
results indicate that most organizations are relatively new users of OSS EIS. Over 43% of
the organizations have used OSS EIS less than 1 year.
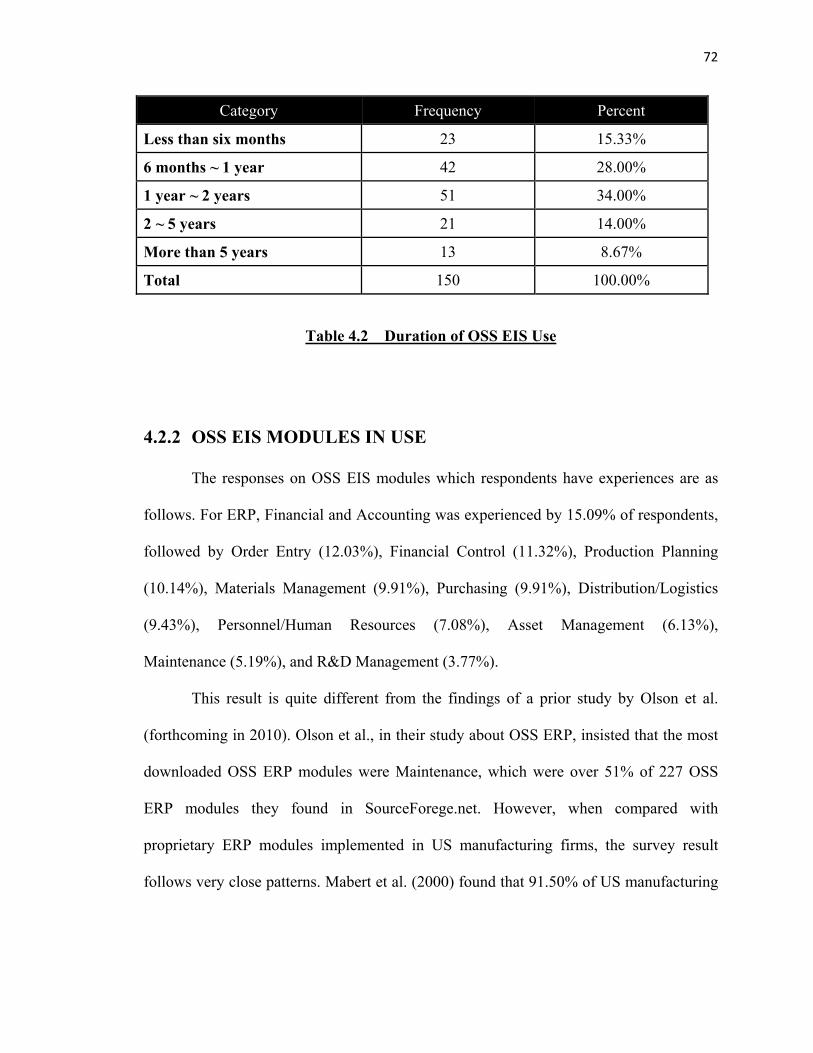
72
Category Frequency Percent
Less than six months 23 15.33%
6 months ~ 1 year 42 28.00%
1 year ~ 2 years 51 34.00%
2 ~ 5 years 21 14.00%
More than 5 years 13 8.67%
Total 150 100.00%
Table 4.2 Duration of OSS EIS Use
4.2.2 OSS EIS MODULES IN USE
The responses on OSS EIS modules which respondents have experiences are as
follows. For ERP, Financial and Accounting was experienced by 15.09% of respondents,
followed by Order Entry (12.03%), Financial Control (11.32%), Production Planning
(10.14%), Materials Management (9.91%), Purchasing (9.91%), Distribution/Logistics
(9.43%), Personnel/Human Resources (7.08%), Asset Management (6.13%),
Maintenance (5.19%), and R&D Management (3.77%).
This result is quite different from the findings of a prior study by Olson et al.
(forthcoming in 2010). Olson et al., in their study about OSS ERP, insisted that the most
downloaded OSS ERP modules were Maintenance, which were over 51% of 227 OSS
ERP modules they found in SourceForege.net. However, when compared with
proprietary ERP modules implemented in US manufacturing firms, the survey result
follows very close patterns. Mabert et al. (2000) found that 91.50% of US manufacturing

73
firms adopt proprietary Financial and Accounting module and other modules in a similar
pattern to the survey results of the present study.
For CRM, Data Integration/Data Warehousing was highest (19.49%), followed by
Knowledge Management (17.23%), Channel Management (14.97%), Sales (13.28%),
Product Management (11.02%), Call Center/Help Desk (9.60%), Marketing (9.32%), and
Field (5.08%). This result is closely consistent with the result of Olson et al.’s study
(forthcoming in 2010).
Lastly, for SCM, Data Management was highest at 15.03%, followed by Make
(13.99%), Delivery (13.73%), Decision Support (11.14%), Source (8.81%), Relationship
Management (8.55%), Return (8.29%), and Performance Improvement (5.44%). The
definition of the Data Management category that the present research adopted from
McLaren and Vuong’s work (2008) includes XML, RFID, and EDI. Hence, the reason
Data Management is the highest might be due to the increasing use of RFID in supply
chain. The summary of OSS EIS use is shown in Table 4.3.
4.2.3 CUSTOMIZATION OF OSS EIS
The responses on percentage of OSS EIS customization to fit organizational needs
are shown in Table 4.4. About 35% of respondents had to customize 10% ~ 20% of the
OSS EIS they adopted, 24.83% of respondents experienced 20%~50% of customization,
and only 10% of respondents experienced more than 50% of customization.
Park et al. (2002) studied the proprietary ERP implementations of 106 Korean
firms. They found that less than 21% ~ 50% of customization was highest at 56.4% of
respondents, followed by less than 10% (22.1%), 11% ~ 20% (14.7%), and more than 50%

74
(7.4%). Approximately 36.8% of proprietary ERP implementations had less than 20% of
customization and about 65% of OSS experienced less than 20% of customization. The
comparison of these two results confirms Serrano and Sarriegi’s (2006) study that one of
the three reasons why OSS is advantageous to implement and maintain ERPs: an
increased adaptability to match the business processes and local regulations.
4.2.4 CONFIGURATION OF OSS EIS
The responses pertaining to agreement/disagreement for OSS EIS configuration
are shown in Table 4.5. The following responses were based on a 5 point scale of
‘1=Strongly Disagree, 3=Neither Agree nor Disagree, 5=Strongly Agree’. The average
scale for the question ‘OSS EIS was configured by experts’ was 2.93, ‘We have
experienced system performance problems due to the customization of OSS EIS we
adopted’ was 2.82, ‘We have experienced software upgrade problems due to the
customization of OSS EIS we implemented’ was 2.74, while ‘System reengineering has
taken placed as OSS EIS implementation proceeds’ was 2.77 points. All 4 questions
scored less than the average median score of 3.0.

75
Category Module Frequency Percent ERP Financial & Accounting 64 15.09%
Financial Control 48 11.32% Production Planning 43 10.14% Purchasing 42 9.91% Materials Management 42 9.91% Distribution/Logistics 40 9.43% Personnel/Human Resources 30 7.08% Asset Management 26 6.13% Maintenance 22 5.19% R&D Management 16 3.77% Total 424 100.00%
CRM Data Integration/Data Warehousing 69 19.49% Knowledge Management 61 17.23% Channel Management 53 14.97% Sales 47 13.28% Product Management 39 11.02% Call Center/Help Desk 34 9.60% Marketing 33 9.32% Field 18 5.08% Total 354 100.00%
SCM Data Management 58 15.03% Plan 58 15.03% Make 54 13.99% Delivery 53 13.73% Decision Support 43 11.14% Source 34 8.81% Relationship Management 33 8.55% Return 32 8.29% Performance Improvement 21 5.44% Total 386 100.00%
Table 4.3 OSS EIS Module Experience

76
Category Frequency Percent
Less than 5% 16 10.74%
5%~10% 29 19.46%
10%~20% 52 34.90%
20%~50% 37 24.83%
More than 50% 15 10.07%
Total 149 100.00%
Table 4.4 Percentage of OSS EIS Customized
4.2.5 IMPLEMENTATION OF OSS EIS
The responses to the question on the implementation of OSS EIS in the
organization are as shown in Table 4.6. OSS EIS implementation by OSS EIS community
was highest at 28.99%, followed by third party OSS EIS distributor (23.67%), consulting
firm (18.84%), in-house implementation (15.94%), and proprietary vendor (12.56%).
Category MEAN S.D
OSS EIS was configured by experts 2.93 0.89
We have experienced system performance problems due to the customization of OSS EIS we adopted.
2.82 0.85
System reengineering has taken placed as OSS EIS implementation proceeds. 2.77 0.81
We have experienced software upgrade problems due to the customization of OSS EIS we implemented.
2.74 0.84
Table 4.5 OSS EIS Configuration

77
Category Frequency Percent
OSS EIS community 60 28.99% 3rd party OSS EIS
distributor 49 23.67%
Consulting firm 39 18.84%
In-house implementation 33 15.94%
Proprietary vendor 26 12.56%
Total 207 100.00%
Table 4.6 Implementation of OSS EIS
4.2.6 TECHNICAL SUPPORT FOR OSS EIS
The responses to the question asking about providers of technical support for OSS
EIS are as shown in Table 4.7. For the question, a 5-point Likert scale was used and users
were allowed to make multiple selections. OSS EIS community was highest at 31.33%,
followed by consulting firm (24.67%), third party OSS EIS distributor (22.67%), In-
house support (12.67%), and proprietary vendor (8.67%). This pattern is consistent with
the question on the implementation of OSS EIS. A comparison between the results from
implementation and technical supports indicates OSS communities provide most
implementation and technical supports.

78
Category Frequency Percent
OSS EIS community 47 31.33%
Consulting firm 37 24.67% 3rd party OSS EIS distributor 34 22.67%
In-house support 19 12.67%
Proprietary vendor 13 8.67%
Total 150 100.00%
Table 4.7 Provider of technical support for OSS EIS
4.2.7 VARIOUS T-TESTS
The study performed three t-tests on the survey results to draw valuable insights
from the observations of actual OSS EIS users’ characteristics. The t-tests were
performed on the multiple independent groups: (1) respondents with the duration of OSS
EIS use for less than 1 year (65 respondents) vs. equal to or more than one year (85
respondents); (2) respondents at companies with less than 100 employees (62 respondents)
vs. companies with 100 or more employees (88 respondents).
4.2.7.1 MODULE FREQUENCIES
Some basic comparisons between two groups were performed before
implementing t-tests. In terms of frequencies of OSS EIS module use, Table 4.8 shows
the list of modules that had significant differences between the two groups. In majority of
the cases, organizations with longer experiences with OSS EIS tend to adopt more

79
modules. Interestingly, Return was the only module that was adopted more frequently by
organizations with shorter durations of OSS EIS use.
Modules Years N % Sig.
HR >= 1 16 2.26
.025* < 1 16 3.50
Data Integration/ Data Warehousing
>= 1 48 6.79 .021*
< 1 21 4.60
Make >= 1 27 3.82 .006**
< 1 27 5.90
Return >= 1 13 1.84 .044*
< 1 19 4.16
Source >= 1 27 3.82 .007**
< 1 7 1.53 * P<.05; **p<.01; ***p<.001
Table 4.8 Module Use Based on Duration of OSS EIS use
When compared by the number of employees, organizations with more employees
adopted less OSS EIS modules than organizations with fewer employees. For some
modules, the organization with fewer employees adopted more modules
(Personnel/Human Resources and Marketing). The modules that had significant
differences between groups are shown in Table 4.9.

80
Modules Emp N % Sig. Data Integration/ Data Warehousing
>= 100 50 6.83 .004**
< 100 19 4.40
Marketing >= 100 15 2.05 .040*
< 100 18 4.17
Delivery >= 100 36 4.92 .039*
< 100 17 3.94
Return >= 100 16 2.19 .031*
< 100 16 3.70 * P<.05; **p<.01; ***p<.001
Table 4.9 Module Use Based on Number of Employees
4.2.7.2 DIFFERENCES WITH DURATION OF OSS EIS USE
Almost every organization adopting an ERP system must modify vendor software
to some degree (Olson, 2004). Customization of ERP systems is a parallel process with
implementation. To fit organizational needs, implementation of enterprise systems
involves intensive reengineering and customization of software. Arinze and Anandarajan
(2003) stated ERP software requires extensive customization in order to roll out
production systems. The findings of prior studies on proprietary ERP can be extended to
EIS in general and compared with OSS EIS. An independent samples t-test was
performed to compare the sub-sample of organizations that used OSS EIS for less than
one year and the sub-sample of organizations that used OSS EIS for one year or longer in
regard to the extent of OSS EIS customization to fit organizational needs. The result
showed that the organizations with longer OSS EIS had more customization as shown in
Table 4.10. Unlike proprietary EIS, of which customization starts in early stage of

81
implementation, OSS EIS can be tried out for a certain period and then customized to fit
organizational needs.
Question <1 M (SD)
≥1 M (SD)
t p
What percentage of OSS EIS had to be customized to fit your organization’s need? 1: less than 5% 2: 5% ~ 10% 3: 10% ~ 20% 4: 20% ~ 50% 5: More than 50%
2.56 (1.271)
3.40 (.862)
4.544 .000
Table 4.10 Duration of Use Comparison for Customization
4.2.7.3 DIFFERENCES WITH NUMBER OF EMPLOYEES
An independent samples t-test was performed to compare the sub-sample of
organizations with less than 100 employees and the sub-sample of organizations with 100
or more employees in regard to the extent of OSS EIS customization to fit organizational
needs. The result showed that the organizations with more employees perform more
customization of OSS EIS for organizational fit. Another t-test was performed to
compare the same sub-samples in regard to the duration of OSS EIS use. The result
showed that the organization with more employees used OSS EIS longer than
organizations with fewer employees. The results summarized are in Table 4.11.

82
Question <100 M (SD)
≥100 M (SD) t p
What percentage of OSS EIS had to be customized to fit your organization’s need? 1: less than 5% 2: 5% ~ 10% 3: 10% ~ 20% 4: 20% ~ 50% 5: More than 50%
2.74 (1.267)
3.25 (.979)
2.660 .009
How long has your organization used OSS EIS? 1: Less than six months 2: 6 months ~ 1 year 3: 1 ~ 2 years 4: 2 ~ 5 years 5: More than 5 years
2.37 (1.244)
2.98 (1.005)
3.175 .002
Table 4.11 Number of Employee Comparisons for Customization/Duration of Use
4.3 MODEL ANALYSES
One of the advantages of SEM is that the statistical methodology can reflects
measurement errors (Lee and Lim, 2009). Two types of measurement errors, random
errors and systematic errors can be involved in survey research. The first type, random
errors are statistical fluctuations in the measured data due to the accuracy limitations of
the measurement instrument. Random errors tend to push measurements up and down
around an exact value. Systematic errors (also called bias) are reproducible inaccuracies
due to any problems that occur consistently in the same direction. It tends to push
measurements in the same direction and causes the average or mean value to be too big or
too small. Random errors are likely to cancel out, on the average, over repeated
measurements. Systematic errors do not cancel out but affect all measurements in roughly
the same way (Rosnow and Rosenthal, 1996).

83
Reliability is the consistency of a set of measurements. It is the degree to which a
variable of concept is measured consistently. Validity is the degree to which the intended
variables are actually measured. This study used composite reliability to measure the
internal consistency and reliability of the 30 survey questionnaires in 7 variables. For
validity test, discriminant validity was examined through confirmatory factor analysis.
4.3.1 ANALYSIS OF THE MEASUREMENT MODEL
This research utilized AMOS software (version 16.0). After setting all
relationships between latent variables, the study analyzed the measurement model to
confirm model fitness. AMOS 16.0 presents three types of fit indices: absolute fit indices,
incremental fit indices, and parsimony fit indices. Absolute fit indices include χ2, GFI,
AGFI, RMR, RMSEA, and Normed χ2. They compare the hypothesized model with no
model at all. Incremental fit indices include CFI, NFI, and TLIP. These fit indices
compare the research model with the null model to test the model fit. The null model is
an independence model that assumes that there is no relationship among all the
measurement variables.
Parsimony fit indices include PGFI, PNFI, PCFI, and ACI, which compare
competing models. The next section gives brief descriptions on each fit index that was
used in this research followed by a discussion of model fitness of the present research.

84
4.3.1.1 MODEL FIT INDICES
χ2 (Chi-square) is an absolute fit index that represents how well the model reflects
the data. If the value is large, the model is a poor fit to the data. The larger the sample
size is, the larger is the value. Since it is very sensitive to the sample size and the number
of measurement variables, Chi-square must be considered with other indices when
determining model fitness (Lee and Lim, 2009). It is represented as CMIN in AMOS.
The higher P (probability value) associated with χ2 indicates a good fit of the model
(Byrne, 2010).
GFI (Goodness-of-Fit Index) is a measure of the relative amount of variance and
covariance. AGFI (Adjusted Goodness-of-Fit Index) differs from GFI only in the fact that
it adjusts for the number of degrees of freedom in the specified model. Both GFI and
AGFI are absolute indices and range from zero to 1.00, with values close to 1.0 being
indicative of good fit (Byrne, 2010).
RMR (Root Mean Square Residual) is an absolute index and represents the
average residual value derived from the fitting of the variance-covariance matrix for the
hypothesized model to the variance-covariance matrix of the sample data (Byrne, 2010).
The closer RMR is to zero, the better the model fit. A value less than .05 is widely
considered good fit and below .08 is considered adequate fit.
RMSEA (Root Mean Square Error of Approximation) is an absolute fit index.
Because Chi-square is too sensitive to sample size and the number of measurement
variables, RMSEA can provide an acceptable value. RMSEA ranges between zero and
1.0, with values less than .1 being indicative of good fit (Lee and Lim, 2010).
85
CFI (Comparative Fit Index) is an incremental fit index. It compares the
hypothesized model with null model. It ranges between zero and 1.0, with acceptable
values larger than .90 (Lee and Lim, 2010).
NFI (Normed Fit Index) is also an incremental fit index. This fit index deal with
Chi-square values of two models, hypothesized model and null model. It ranges between
zero and 1.0, with acceptable values larger than .90 (Lee and Lim, 2010).
PGFI (Parsimony Goodness-of-Fit Index) is a parsimony index that ranges
between zero and 1.0. It does not have any implications by itself and should be compared
with other PGFIs of competing models. The model has higher value of PGFI has a better
fitness (Lee and Lim, 2010). PNFI (Parsimony Normed Fit Index) is another parsimony
index that is most widely applied parsimony index. It ranges between zero and .10 (Lee
and Lim, 2010).
4.3.1.2 MODEL FITNESS OF MEASUREMENT MODEL
The results of fitness test are presented in Table 4.12. First, χ2 value was 787.845
(df=384, p=.000), suggesting a good fitness of the model ((χ2 /df) = 2.052 < 3) (Byrne,
2010). Most of other fit indices, such as RMSEA (.084), CFI (.865), GFI (.767), fell out
of the acceptable levels. Thereby, it was recommended to investigate item factor loadings.
After investigating item factor loadings, one item, “Overall, the impact of OSS
EIS on me has been positive” of Individual Net Benefit was deleted because the item
factor loading was lower than .50. After removing the two items, the results of new
fitness tests are presented in Table 4.13. Chi-square (χ2) value was 520.634 (df=329,
p=.000), suggesting a good fitness of the model ((χ2 /df) = 1.582 < 3) (Byrne, 2010).

86
Most of other fit indices, such as RMSEA (.063), CFI (.929) except GFI (.814), are in the
acceptable levels.
Fit Index Measurement Acceptance Criteria
Acceptance Level
Absolute Fit Measures
χ2 787.845 (df=384, p=.000)
p>.05 or (χ2 /df) <3
2.052 Accept
RMSEA .084 Under .08 Reject GFI .767 Over .9 Reject
Incremental Fit Measures CFI .865 Over .9 Reject
Table 4.12 Measurement Model Fitness
Fit Index Measurement Acceptance Criteria
Acceptance Level
Absolute Fit Measures
χ2 595.558 (df=356, p=.000)
p>.05 or (χ2 /df) <3
1.582 Accept
RMSEA .063 Under .08 Accpet GFI .814 Over .9 Reject
Incremental Fit Measures CFI .929 Over .9 Accept
Table 4.13 New Measurement Model Fitness

87
4.3.2 RELIABILITY AND VALIDITY TEST
Item factor loadings and squared multiple correlations from the confirmatory
factor analysis completed on the data collected in OSS EIS user perception is shown in
Table 4.14. To measure construct validity, factor analysis is employed. Because the
present study is based on a strong theoretical and/or empirical foundation, confirmatory
factor analysis (CFA) is a useful method for testing construct validity (Kline, 2004).
Testing of discriminant validity is conducted based on a standard where mean
variance (AVE) of latent variables are over .5 (Fornell and Lacker, 1981). Discriminant
validity was established using the procedures outlined by Fornell and Lacker (1981),
Table 4.15 shows the correlations between the latent variables and the average variance
extracted (AVE) of each construct is shown on the diagonal. Fornell and Lacker (1981)
prescribe that the squared correlation between constructs must be less than the average
variance extracted (AVE) of each underlying construct in order for the constructs to have
discriminant validity. In this research, there was no case was the square of a correlation
between constructs greater than average variance extracted of the constructs (see Table
4.15).
Fornell and Lacker (1981) also suggest that convergent validity exits when item
factor loadings are greater than .5 and item squared multiple correlations are greater
than .5. In this study, one item (“Overall, the impact of OSS EIS on me has been positive”
of Individual Net Benefit) were deleted because item factor loading was lower than .50.
After two items deleted, a confirmatory factor model was tested. The resulting statistics
was strong evidence of both discriminant (see Table 4.14) and convergent (see Table 4.15)
validity.

88
Constructs Variables Factor-loading SMC C.R.
Information Quality
Information from OSS EIS is always timely Information from OSS EIS is always accurate Information from OSS EIS is always relevant to my tasks Overall, OSS EIS information quality is satisfactory
.571
.833
.698
.825
.326
.695
.487
.680
0.903
OSS EIS Quality
OSS EIS response is always quick OSS EIS is easy to use OSS EIS has useful functions Overall, OSS EIS system quality is satisfactory
.610
.638
.809
.849
.372
.408
.654
.721
0.893
Community Service Quality
OSS EIS community has up-to-date hardware and software OSS EIS community is dependable OSS EIS community gives prompt service to users OSS EIS community has the knowledge to do its job sell OSS EIS community has users’ best interests at heart Overall, OSS EIS service quality is satisfactory
.713
.811
.782
.733
.809
.811
.508
.657
.612
.537
.655
.657
0.924
OSS EIS Use
I use OSS EIS very frequently (many times per month) I use OSS EIS very intensively (many hours per day) Overall, I use OSS EIS a lot
.712
.852
.784
.506
.726
.615
0.850
User Satisfaction
The output information of OSS EIS is complete I am satisfied with the material design of the layout and display of the output contents from OSS EIS I have strong feeling of control over OSS Overall, I am satisfied with OSS
.774
.849
.837
.873
.599
.721
.700
.762
0.838
Individual Net Benefits
I have learnt much through the presence of OSS EIS OSS EIS enhances my awareness and recall of job related information OSS EIS enhances my effectiveness in the job OSS EIS increases my productivity Overall, the impact of OSS EIS on me has been positive
.845
.855
.805
.781 Deleted
.714
.731
.648
.610 Deleted
0.909
Organizati-onal Net Benefits
OSS EIS reduces cost OSS EIS requires less number of staff then proprietary software does OSS EIS improves outcomes/outputs Overall, OSS EIS increases organizational productivity
.791
.800
.893
.896
626 640
.797 .802
0.929
Table 4.14 Items, Factor-loadings, and Construct Reliability
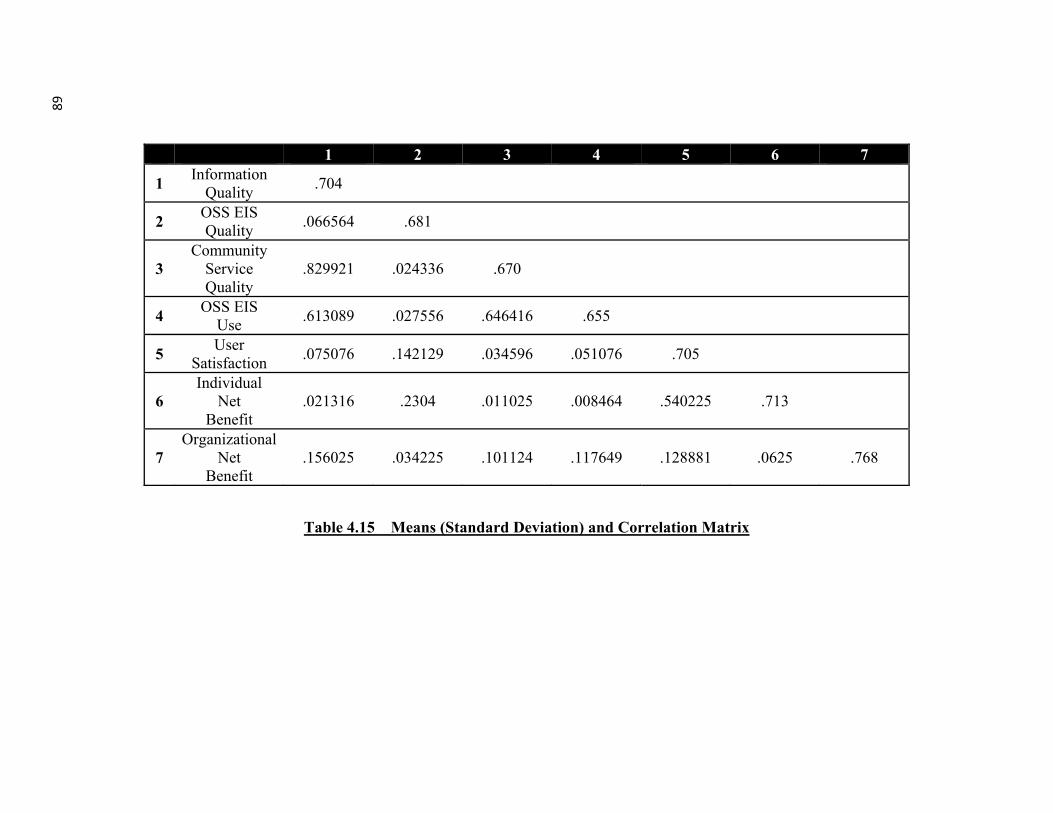
89
1 2 3 4 5 6 7
1 Information Quality .704
2 OSS EIS Quality .066564 .681
3 Community
Service Quality
.829921 .024336 .670
4 OSS EIS Use .613089 .027556 .646416 .655
5 User Satisfaction .075076 .142129 .034596 .051076 .705
6 Individual
Net Benefit
.021316 .2304 .011025 .008464 .540225 .713
7 Organizational
Net Benefit
.156025 .034225 .101124 .117649 .128881 .0625 .768
Table 4.15 Means (Standard Deviation) and Correlation Matrix

90
4.4 ANALYSIS OF STRUCTURAL MODEL
4.4.1 MODEL FITNESS OF STRUCTURAL (FULL) MODEL
The results of fitness test are presented in Table 4.16. First, χ2 value was 629.077
(df=364, p=.000), suggesting a good fitness of the model ((χ2 /df) = 1.728 < 3) (Byrne,
2010). Other fit indices, such as RMSEA (.070) and GFI (.658) except CFI (.906) are
within the acceptable levels. The adequacy of the structural equation models was
evaluated on the criteria of overall fit with the data.
Fit Index Measurement Acceptance Criteria
Acceptance Level
Absolute Fit Measures
χ2 629.077 (df=364, p=.000)
p>.05 or (χ2 /df) <3
1.728 Accept
RMSEA .070 Under .08 Accept GFI .658 Over .9 Reject
Incremental Fit Measures CFI .906 Over .9 Accept
Table 4.16 Overall Model Fitness
4.4.2 HYPOTHESES TESTING
Path coefficients between latent variables and path coefficients between latent
variables and measurement variables were measured to validate their significance levels.
The results of such analysis showed the OSS EIS Quality → User Satisfaction,
Community Service Quality → OSS EIS Use, User Satisfaction → Individual Net

91
Benefit, Individual Net Benefit → Organizational Net Benefit path to be statistically
significant (p<.05), while the Community Service Quality → User Satisfaction,
Information Quality → OSS EIS Use, User Satisfaction → OSS EIS Use, OSS EIS
Quality → OSS EIS Use, OSS EIS Use → Individual Net Benefit paths were not
statistically significant (p>.05). An organization of various paths focusing on the major
variables of interest within the study is shown in Tables 4.17.
4.4.2.1 EFFECTS ON OSS EIS USE
H1. Information Quality has a direct positive effect on OSS EIS Use.
H3. OSS EIS Quality has a direct positive effect on OSS EIS Use.
H5. Community Service Quality has a direct positive effect on OSS EIS Use.
H7. User Satisfaction has a direct positive effect on OSS EIS Use.
Paths 1, 3, 5, and 7 are shown to be paths where Information Quality, OSS EIS
Quality, Community Service Quality, User Satisfaction have direct effects on OSS EIS
Use. While the direct effect of Information Quality on OSS EIS Use was shown to be a
positive (+) effect of .240, it was not a statistically significant result (p=.279). While the
direct effect of OSS EIS Quality on OSS EIS Use was shown to be a negative (-) effect of
-.018, it was not statistically significant (p=.815). The direct effect of Community Service
Quality on OSS EIS Use was shown to be a positive (+) effect of .490 and was shown to
be a statistically significant result (p=.038). While the direct effect of User Satisfaction
on OSS EIS Use was shown to be a positive (+) effect of .038, it was not statistically
significant (p=.492).

92
Estimate S.E. C.R. PUser_Satisfaction <-- Information_Quality .435 .385 1.131 .258User_Satisfaction <-- OSS EIS_Quality .451 .132 3.419 ***User_Satisfaction <-- Community_Service_Quality -.264 .404 -.655 .513OSS EIS_Use <-- OSS EIS_Quality -.018 .076 -.234 .815OSS EIS_Use <-- Community_Service_Quality .490 .236 2.077 .038OSS EIS_Use <-- Information_Quality .240 .222 1.082 .279OSS EIS_Use <-- User_Satisfaction .038 .055 .687 .492Individual_Net Benefit
<-- OSS EIS_Use -.078 .087 -.896 .370
Individual_Net Benefit
<-- User_Satisfaction .682 .079 8.662 ***
Organizational_Net Benefit
<-- Individual_Net Benefit .289 .094 3.082 .002
OEQ4 <-- OSS EIS_Quality 1.000 OEQ3 <-- OSS EIS_Quality .994 .101 9.829 ***OEQ2 <-- OSS EIS_Quality .772 .098 7.876 ***OEQ1 <-- OSS EIS_Quality .650 .087 7.447 ***CSQ4 <-- Community_Service_Quality 1.000 CSQ3 <-- Community_Service_Quality .961 .101 9.538 ***CSQ2 <-- Community_Service_Quality 1.084 .110 9.900 ***CSQ1 <-- Community_Service_Quality .799 .093 8.629 ***IFQ4 <-- Information_Quality 1.000 IFQ3 <-- Information_Quality .889 .097 9.160 ***IFQ2 <-- Information_Quality .939 .081 11.616 ***IFQ1 <-- Information_Quality .739 .100 7.383 ***CSQ5 <-- Community_Service_Quality 1.085 .110 9.905 ***CSQ6 <-- Community_Service_Quality 1.104 .111 9.909 ***OEU1 <-- OSS EIS_Use 1.000 OEU2 <-- OSS EIS_Use 1.338 .146 9.173 ***OEU3 <-- OSS EIS_Use 1.211 .139 8.688 ***USF3 <-- User_Satisfaction 1.000 USF2 <-- User_Satisfaction 1.014 .081 12.508 ***USF1 <-- User_Satisfaction .831 .077 10.763 ***ONB3 <-- Organizational_Net Benefit 1.000 ONB2 <-- Organizational_Net Benefit .889 .071 12.552 ***ONB1 <-- Organizational_Net Benefit .832 .068 12.300 ***INB1 <-- Individual_Net Benefit 1.000 INB2 <-- Individual_Net Benefit 1.112 .089 12.433 ***INB3 <-- Individual_Net Benefit 1.038 .089 11.611 ***INB4 <-- Individual_Net Benefit .859 .079 10.911 ***ONB4 <-- Organizational_Net Benefit 1.023 .067 15.193 ***USF4 <-- User_Satisfaction 1.050 .080 13.107 ***
Table 4.17 Path Coefficient and Significance Test of Structural Model

93
4.4.2.2 EFFECTS ON USER SATISFACTION
H2. Information Quality has a direct effect on User Satisfaction.
H4. OSS EIS Quality has a direct effect on User Satisfaction.
H6. Community Service Quality has a direct effect on User Satisfaction.
Paths 2, 4, and 6 are shown to be paths where Information Quality, OSS EIS
Quality, Community Service Quality have direct effects on User Satisfaction. While the
direct effect of Information Quality on User Satisfaction was positive (+) (.435), it was
not shown to be statistically significant (p=.258). The direct effect of OSS EIS Quality on
User Satisfaction was positive (+) (.451) and was shown to be statistically significant
(p=.000). While the direct effect of Community Service Quality on User Satisfaction was
negative (-) (-.264), it was not statistically significant (p=.513).
4.4.2.3 EFFECTS ON INDIVIDUAL NET BENEFIT
H8. OSS EIS Use has a direct positive effect on Individual Net Benefit.
H9. User Satisfaction has a direct positive effect on Individual Net Benefit.
Paths 8 and 9 are shown to be paths where User Satisfaction has a direct effect on
Individual Net Benefit. While the direct effect of OSS EIS Use on Individual Net Benefit
was negative (-) (-.078), it was not statistically significant (p=.370). The direct effect of
User Satisfaction on Individual Net Benefit was positive (+) (.682) and was shown to be
a statistically significant (p=.000).

94
4.4.2.4 EFFECTS ON ORGANIZATIONAL NET BENEFIT
H10. Individual Net Benefit has a direct effect on Organizational Net Benefit.
Path 10 is shown to be a path where Individual Net Benefit has a direct effect on
Organizational Net Benefit. The direct effect of Individual Net Benefit on Organizational
Net Benefit was shown to be a positive (+) effect of .289 and was shown to be a
statistically significant result (p=.002). The results of hypotheses testing are summarized
in Table 4.18.
Research Hypothesis Hypothesis Use
H1 Information Quality has a direct effect on OSS EIS Use. Not Supported
H2 OSS EIS Quality has a direct effect on OSS EIS Use Not Supported
H3 Community Service Quality has a direct effect on OSS EIS Use. SUPPORTED
H4 User Satisfaction has a direct effect on OSS EIS Use. Not Supported
H5 Information Quality has a direct effect on User Satisfaction. Not Supported
H6 OSS EIS Quality has a direct effect on User Satisfaction. SUPPORTED
H7 Community Service Quality has a direct effect on User Satisfaction. Not Supported
H8 OSS EIS Use has a direct effect on Individual Net Benefit. Not Supported
H9 User Satisfaction has a direct effect on Individual Net Benefit. SUPPORTED
H10 Individual Net Benefit has a direct effect on Organizational Net Benefit. SUPPORTED
Table 4.18 A Summary of Path Analysis Results

95
4.5 DISCUSSION
4.5.1 COMPARISON ON TWO RESULTS
As discussed in 3.1.5, due to the nature of sample, 400 most frequently
downloaded OSS EIS projects were analyzed. The coders identified 273 distinguishable
OSS EIS projects that consist of 126 (46.15 %) CRM, 94 (34.43%) ERP, and 53 (19.41%)
SCM related projects. One hundred twenty seven projects were classified as N/A because
the description of the projects were ambiguous, written in foreign languages, or not
agreeable among coders.
ERP CRM SCM Production Planning 25 Data Integration/Data
Warehousing 38 Decision Support 37
Financial & Accounting
20 Knowledge Management 34 Data Management 13
Personnel/HR 12 Call Center/Help Desk 11 Make 11Materials
Management 3 Channel Management 8 Plan 9
Order Entry 6 Sales 8 Delivery 3 Distribution/Logistics 5 Marketing 4 Return 0
Purchasing 4 Field 1 Source 1 Financial Control 4 Product Management 0 Relationship
Management 0
Asset Management 4 Performance Improvement
0
Maintenance 2 Quality Management 1 R&D Management 1
Total 87 Total 104 Total 74
Table 4.19 OSS EIS Modules Developed in On-Line Communities

96
The number of CRM projects was unexpectedly high as shown in Table 4.19.
This was because: (1) Data Integration and Warehousing is one of the most frequently
downloaded OSS EIS modules and (2) the taxonomy the present study used to classify
OSS EIS for both content analysis and survey includes Data Integration and Warehousing
under CRM class.
In terms of the modules downloaded, the results showed the similar pattern to the
survey results. Among the ERP modules, Production Planning (25) was most frequently
downloaded, followed by Financial & Accounting (20) and Personnel/Human Resources
(12). For CRM modules, Data Integration/Data Warehousing (38) was most frequently
downloaded, followed by Knowledge Management (34) and Call Center/Help Desk (11).
For SCM modules, Decision Support was highest at 37, followed by Data Management
(13) and Make (11). A comparison of the two results from the survey and the content
analysis is shown in Table 4.20.
Although the study used the same taxonomy to classify OSS EIS modules for
both survey and content analysis for consistency, some parts of the two results are quite
different. Specifically, the top 8 modules of ERP are quite differently ranked. This may
be explained by the coding processes that the study performed. In the training sessions,
the coders agreed to classify the ERP projects related to project management into
Production Management and the large number of occurrences of project management
may help put the module in the highest rank. However, majority of CRM and SCM
modules showed very similar patterns in both classifications except the Decision Support
module of SCM.

97
In the training sessions, coders agreed to classify OLAP (On-Line Analytical
Processing), which is a data analysis tool providing multiple perspectives (Laudon and
Laoudon, 2009), into the Decision Support module instead of Data Integration/Data
Warehousing. The comparison showed that the comprehensive classification utilized in
this research needs more clear definition for certain modules, such as Production
Planning, Data Integration/Data Warehousing, and Decision Support.
4.5.2 RESULTS OF STATISTICAL ANALYSIS
Among the ten hypotheses, only four hypotheses were supported by statistical
analyses employed in the present research. Following sections include the details of
hypotheses analysis.
4.5.2.1 OSS EIS USE CONSTRUCT
Prior studies about IS success have frequently defined information quality, system
quality (OSS EIS Quality in this study), service quality (Community Service Quality),
and user satisfaction as precedents of system use (OSS EIS Use) (DeLone and McLean,
1992; Seddon and Kiew, 1994; Pitt et al., 1995; Seddon, 1997; Rai et al., 2002;
Sabherwal et al. 2006). However, the results of the study show that information quality,
OSS EIS Quality, and User Satisfaction have no effect on OSS EIS Use. Only
Community Service Quality has a direct positive effect on OSS EIS Use.

98
Rank Survey Downloaded ERP 1 Financial & Accounting Production Planning
2 Order Entry Financial & Accounting 3 Financial Control Personnel/ Human Resources 4 Production Planning Materials Management 5 Materials Management Order Entry 6 Purchasing Distribution/Logistics 7 Distribution/Logistics Purchasing 8 Personnel/Human Resources Financial Control 9 Asset Management Asset Management 10 Maintenance Maintenance 11 R&D Management Quality Management 12 Quality Management R&D Management
CRM 1 Data Integration/Data Warehousing
Data Integration/Data Warehousing
2 Knowledge Management Knowledge Management 3 Channel Management Call Center/Help Desk 4 Sales Channel Management 5 Product Management Sales 6 Call Center/Help Desk Marketing 7 Marketing Field 8 Field Product Management
SCM 1 Data Management Decision Support 2 Plan Data Management 3 Make Make 4 Delivery Plan 5 Decision Support Delivery 6 Source Return 7 Relationship Management Source 8 Return Relationship Management 9 Performance Improvement Performance Improvement
Table 4.20 A Comparison of Survey and Content Analysis

99
As discussed in 3.2.2.6, this result can be explained by the ‘mandatory’ issue with
system use argued by DeLone and McLean (2003). Unlike other software, EIS are
usually the only software package available in an organization for planned tasks. Once a
certain type of EIS is implemented, system use is required across the organization. Use of
EIS must be continued and cannot be voluntary by individual users.
As prior studies (Pitt et al., 1995; Shin, 2003; Yang et al., 2004) pointed out, the
present study employed Community Service Quality as a precedent construct of OSS EIS
use and the result shows it has a positive effect on OSS EIS. Upon reviewing the results,
the only precedent of OSS EIS Use is Community Service Quality. In previous sections,
it has been assumed that the OSS EIS use is mandatory. However, users can voluntarily
use OSS EIS for a test drive before an actual implementation. In such a situation, the
extent of Community Service Quality can be used as a decision factor of selecting an
appropriate EIS for the organization’s needs.
System use (OSS EIS Use) itself also has frequently been employed as a success
factor effecting individual impact (Individual Net Benefit) in prior studies (Bailey and
Pearson, 1983; Srinivasan, 1985; Clemons et al., 1993; Hitt and Brynjolfsson, 1994;
Grover et al., 1996; Guimaraes and Igbaria, 1997; Doll and Torkzadeh, 1998; D’Ambra,
2001; Sabherwal et al., 2006). However, the results of the present research do not support
the proposition. This is, again, can be explained by the ‘mandatory’ issue. If it is required
to use OSS EIS, OSS EIS Use cannot be a precedent of Individual Net Benefit.
As discussed earlier, Seddon (1997) argued for the removal of the system use
construct from DeLone and McLean’s first model because of its ambiguity. The
ambiguity issue was further investigated by later studies and considered unjustifiable

100
because of the nature of the construct in various research purposes. Based on the prior
studies on this issue, the context of OSS EIS, and the results from the analysis, the
present study suggests an OSS EIS success model without the EIS OSS Use construct.
4.5.2.2 OTHER CONSTRUCTS
System quality (OSS EIS Quality) have direct positive effects on user satisfaction
as described by the hypotheses developed based on prior studies (Seddon, 1997; Rai et al.,
2002; McLean, 2003). However, unlike Lee et al.’s (2009) OSS success model, the
present research found no significant direct positive effects of Community Service
Quality on user satisfaction. This may be explained by DeLone and McLean’s (2003)
arguments that the role of quality determinants varies from context to context. Lee et al.’s
(2009) study, about OSS in non-enterprise systems, found significant effects of
community service quality on user satisfaction. Unlike desktop software, users of
enterprise software, typically follow predefined routines to receive desired outputs from
IS. Similarly, when users experience technical difficulties, they follow formal processes
of problem solving through the organization. Hence, the quality of services from
communities to resolve issues may not be directly transferred to end users. Instead, users
may receive indirect effect of the service quality. Therefore, Community Service Quality
may have no direct effects on User Satisfaction in the OSS EIS context.
The hypothesis on the effect of user satisfaction on individual impact (Individual
Net Benefit) was supported as prior studies have found (Gatian, 1994; Rai et al, 2002;
DeLone and McLean, 2003; Lee et al., 2009).

101
A direct positive effect of individual impact (Individual Net Benefit) on organizational
impact (Organizational Net Benefit) was hypothesized and the result of analysis
supported it. Lastly, the study performed the mediation analysis for system use (OSS EIS
Use) between user satisfaction (User Satisfaction) and individual impact (Individual Net
Benefits). The result showed a direct positive effect of user satisfaction (User Satisfaction)
on individual impact (Individual Net Benefit) but the path was not mediated by system
use (OSS EIS Use). User Satisfaction has a direct positive effect on Individual Net
Benefit.
4.6 SUMMARY OF ANALYSES
In the first phase of the study, a content analysis was done on the on-going OSS
EIS projects in most OSS on-line communities. The results of content analysis by three
coders were discussed by various comparisons with the survey results in 4.5.1. In the
second phase of the study, a survey on OSS EIS users was conducted. Then, a
confirmatory analysis on the IS success model suggested by the present study was
performed. The survey results confirmed prior studies’ claim that OSS EIS enable SMBs
to implement EIS at a minimal cost (Sudzina, 2008; Serrano and Sarriegi, 2006).
Approximately 74% of the respondents were within the firms employing less than 300
employees, which can be classified as SMBs as suggested by Ghobadian and O’Regan
(2000).
The questions about the use of OSS EIS modules revealed an interesting result.
Especially for ERP modules, Financial and Accounting was the most widely experienced
OSS module, followed by Order Entry, Financial Control, Production Planning, Materials

102
Management, Purchasing, Distribution/Logistics, Personnel/Human Resources, Asset
Management, Maintenance, and R&D Management module. Interestingly, the result is
quite similar to the result of prior studies on proprietary ERP (Mabert et al., 2000;
Olhager and Selldin, 2003; Katerattanakul et al., 2006). However, it shows different
ranks of ERP use from the ranks of a prior study by Olson et al. (forthcoming in 2010). In
Olson et al.’s study the most downloaded OSS ERP module was the Maintenance module
(51.10%) and Financial and Accounting was ranked 6th (13.70%). Plausible justifications
on the results would be: (1) users download and try more supportive OSS ERP modules,
such as Maintenance; however, they actually implement and use value adding modules,
such as Financial and Accounting; (2) different locations of sample population – the
survey was done on mostly Korean OSS EIS users and the content analysis was done in
an on-line community of which most users are located in the US. The later justification
is discussed in the limitation section of the study.
For the use of SCM modules, Data Management was highest. This study adopted
the classification scheme built by McLaren and Vuong (2008). The definition of Data
Management defined in their work includes XML, RFID, and EDI. A possible
explanation of Data Management being the highest in rank would be the increasing use of
RFID in supply chain management. The usage of OSS SCM modules implicates the
increasing importance of RFID in supply chain.
Based on a vast amount of literature but essential reviews on EIS OSS, the model
of this research was developed with three exogenous variables and four endogenous
variables with 30 measured items. Then, the model was analyzed by SEM statistical
technique, which has such advantages as its goodness for confirmatory research with: (1)

103
multiple dependent variables; (2) mediating variables; and (3) multiple group analysis
(Lee and Lim, 2009). The software tool utilized for this research was AMOS 16.0.
The ambiguous definition of system use (OSS EIS Use) has been an issue in
developing the IS success model and the result of this study also has the same issue. The
study observed no significant relationships between OSS EIS Use and its two precedents,
Information Quality and OSS EIS Quality. Moreover, the hypothesis between OSS EIS
Use and Individual Net Benefit was not supported either. The results suggest removing
the OSS EIS Use construct entirely from the OSS EIS model proposed by this research.
Hence, a simplified model of OSS EIS success with only 4 construct can be rebuilt as
shown in Figure 4.3.

10
4
Figure 4.1 Suggested OSS EIS Success Model
OSS EISQUALITY
USERSATISFACTION
INDIVISUAL NET BENEFITS
ORGANIZATIONALNET BENEFITS
H6 H9 H10
.451*** .682*** .289**
* P<.05; **p<.01; ***p<.001

105
CHAPTER FIVE
CONCLUSION
“In the beginning God created the heavens and the earth. (Genesis, 1:1).”
This chapter presents conclusions of the research. It consists of summary,
limitations, implications, and future direction of the research.
5.1 SUMMARY
This study explored IS success models and factors in the OSS EIS context. The
majority of constructs used in prior studies of IS success in general was developed in the
70’s through 90’s (Matlin, 1979; Melone, 1990; DeLone and McLean, 1992; Bonner,
1995; Ballantine et al., 1996; Gable, 1996; Kapalan and Norton, 1996; Myers et al. 1998).
Examinations of IS success models in various context were conducted in the 90’s and
early 2000’s (Seddon et al, 1999; Irani and Love, 2000; Lin and Shao, 2000; DeLone and
McLean, 2002; Rai et al., 2002; Thatcher and Oliver, 2001; DeLone and McLean, 2003;
Gable et al., 2003; Shin, 2003; Sedera and Gable, 2004; Sabherwal et al., 2006; Gable et
al., 2008; Lee et al. 2009).
Typically, EIS are developed by proprietary vendors and OSS has been more
successful in the non-enterprise level software sector. However, Grewal et al. (2006)
claimed that proprietary vendors realize that OSS can be product lines for vendors as well
as a threat in the proprietary enterprise system market. OSS EIS enable SMBs to

106
implement EIS due to the minimal cost (Johansson and Sudzina, 2008) and provides the
potential as a disruptive innovation. Yet, few studies have explored OSS EIS.
The present research was designed to confirm the effectiveness of IS success
models and constructs that have been built by prior studies during the past three decades.
Specifically, the study was aiming to build an IS success model by modifying the widely
used models and factors, and investigate its validity and the effectiveness of its constructs
in the OSS EIS context.
5.2 IMPLICATIONS AND LIMITATIONS OF THE STUDY
The overall objective of this study was to examine the relationships between IS
success factors in the OSS EIS context. First of all, based on a comprehensive literature
review of EIS modules, overall summary of EIS classification was presented by this
study. EIS typically are implemented in modules. Analyzing the frequency of module use
enables OSS EIS developers as well as users to have a better understanding of the
maturity level of OSS EIS modules and, therefore, they know what to download. For
researchers, the present research has expanded the IS success model to the OSS EIS
context. For researchers, the present study has provided a comprehensive classification of
EIS modules. Such classification, even though it has limitations, as discussed in the next
section, is beneficial as a reference in studies of EIS.
Few empirical studies have been done for OSS EIS success. The present research
has provided the practical evidence of effective relationships in the OSS EIS model. The
developers in on-line OSS communities may take the success factor into account when
they develop OSS EIS. The software development cycle (e.g., SDLC or Waterfall model;

107
Royce, 1970) can be viewed from the perspectives of the status of the OSS project. The
present study also identified two distinct phases of the OSS project: development and
diffusion. Not all OSS projects can be sustained in the on-line community and diffused to
fields. More OSS projects end their SDLC in the development phase (Lee et al., 2009).
The three milestones associated with the two phases are: project initiative, project
sustaining, and project adoption.
Like all studies, the present research has some limitations. OSS is different from
proprietary software in terms of its motivation, development process, social dynamics in
the development group, and diffusion process, such as licensing issues. The present study
of OSS EIS success has been mainly focused on only the user’s perspectives, which are
not the only potential considerations when adopting OSS EIS. Other limitations of the
research include the process of data collection. Even though the study was consistent in
both phases in terms of using the OSS EIS classification, the sample populations may
potentially be different. The prior studies on proprietary ERP showed different results in
three different countries (Mabert et al., 2000; Olhager and Selldin, 2003; Katerattanakul
et al., 2006). Having a comprehensive EIS classification is both beneficial and limited,
since the classification has not been validated using traditional research methods. This
condition of study may result in a biased research design and consequences.
The small sample size could also be a limitation of the study. Due to the difficulty
of collecting data from very rare population (OSS EIS users), only a minimal size of
sample (N=150) was used in the study. A longitudinal study may supplement this
weakness.

108
5.3 FUTURE STUDY
The present study of OSS EIS success has been mainly focused on only user’s
perspectives, which are not the only potential considerations that firms take when
adopting OSS EIS. Future studies could expand the present research by being more
inclusive and cover a broader scope of OSS EIS aspect to be more applicable in practice.
As Brydon and Vining (2008) pointed out, OSSs are causing disruption in many wide-
level systems, such as those in the ERP software market. In the OSS paradigm, multiple
entities (individuals, organisations, academic institutions, and others) come together to
develop a software product. OSS is not confined in the category of software products for
only “low-level-system-oriented”, as conventionally recognized.
A multiple group analysis is interesting when considering the context-sensitive
character of OSS EIS. For group test and comparative analysis, SEM requires an
adequate sample size. The present research collected 150 valid survey results, which is a
minimal number of data when considering the number of constructs. Typically, SEM
requires about 5 ~ 10 times the number of measured constructs (Kim et al., 2009). The
model has 30 measured constructs. To execute a valid analysis, each group must have a
data set of 150 at least. Two evenly divided the group (n=75) does not give the number of
data recommended for SEM analysis. Hence, the present research was not appropriate to
perform a multiple group analysis.
The present study performed some t-tests for multiple independent groups. The
sample size was also a limitation for t-tests. For example, a t-test was intended to
compare the mean value of the duration of OSS EIS use between large organizations with
more than 300 employees and small organizations of less than 300 employees. As

109
Ghobadian and O’Regan (2000) suggested that firms employing less than 300 employees
can be classified as SMBs, the respondents were grouped based on the number, which did
not yield a balanced number of data in the two groups. The study had to adjust the cut
point defining groups to 100, which is the next lower level in the questionnaire.
As discussed in the limitation section, a longitudinal study in different countries
with the varying development states of IT and economic development can be a potential
research topic in the future and also an answer for the limitation of sample size.

110
REFERENCES Ågerfalk, P. J. and Fitzgerald, B. (2008) "Outsourcing to an unknown workforce," MIS Quarterly, Vol. 32, No. 2, pp.385-409. Ahituv, N. (1980) "A systematic approach toward assessing the value of an information system," MIS Quarterly, Vol. 4, No. 4, pp.61-75. Albert, T. C., Goes, P. B., and Gupta, A. (2004) "GIST: a model for design and management of content and interactivity of customer-centric web sites," MIS Quarterly, Vol. 28, No. 2, pp.161-182. Alloway, R. M. (1980) "Defining success for data processing: A practical approach to strategic planning for the DP department," CISR Working Paper No. 52, Center for Information Systems Research, Massachusetts Institute of Technology. Arinze, B. and Anandarajan, M. (2003) "A framework for using OO mapping methods to rapidly configure ERP systems," Communications of The ACM, Vo. 46, No. 2, pp.61-65. Asubonteng, P., McCleary, K. J., and Swan, J. E. (1996) "SERVQUAL revisited: a critical review of service quality," The Journal of Services Marketing, Vol. 10, No. 6, pp.62-81. Babcock, C. (2009) "Open source will pay dividends in the cloud," informationweek.com, March 30, p18. Bailey, J. E. and Pearson, S. W. (1983) "Development of a tool for measuring and analyzing computer user satisfaction," Management Science, Vol. 29, No. 5, pp.530-545. Ballantine, J., Bonner, M., Levy, M., and Martin, A. (1996) "The 3-D model of information systems success: the search for the dependent variable continues," Information Resources Management Journal, Vol. 9, No. 4, pp.5-14. Baron, R. M. and Kenny, D. A. (1986) "The moderator-mediator variable distinction in social psychological research: conceptual, strategic, and statistical considerations," Journal of Personality and Social Psychology, Vol. 52, No. 6, pp.1173-1182. Bayraktar, E., Demirbag, M., Koh, S. C. L., Tatoglu, E., and Zaim, H. (2009) "A causal analysis of the impact of information systems and supply chain management practices on operational performance: evidence from manufacturing SMEs in Turkey," International Journal of Production Economics, Vol. 122, No. 1, p133-149.

111
Belardo, S., Karwan, K. R., and Wallace, W. A. (1982) "DSS component design through field experimentation: an application to emergency management," Proceedings of the Third International Conference on Information Systems, pp.93-100. Bitner M. J., Booms, B. H., and Tetreault M. S. (1990) "The service encounter: diagnosing favorable and unfavorable incidents," Journal of Marketing, Vol. 54, No. 1, pp.71-84. Bolton, R. N. and Lemon, K. N. (1999) "A dynamic model of customers' usage of services: usage as an antecedent and consequence of satisfaction," Journal of Marketing Research, Vol. 36, No. 2, pp.171-186. Bonner, M. (1995) “Delone and Mclean's model for judging information systems success - a retrospective application in manufacturing,” Proceedings of the European Conference on IT Investment Evaluation, Henley Management College, UK, pp.218-227. Borzekowski, R. (2009) "Measuring the cost impact of hospital information systems: 1987–1994," Journal of Health Economics, Vol. 28, No. 5, pp.938-949. Brady, J. A., Monk, E. F., and Wagner, B. J. (2001) "Concepts in enterprise resource planning," Boston: Course Technology. Brancheau, J. C. and Wetherbe, J. C. (1987) "Key Issues in information systems management," MIS Quarterly, Vol. 11. No. 1, pp.23-45. Brown, T. J., Churcill, Jr. G. A., and Peter, J. P. (1993) "Improving the measurement of service quality," Journal of Retailing, Vol. 69, No. 1, pp.127-139. Brydon, M. and Vining, A. R. (2008) "Adoption, improvement, and disruption: predicting the impact of open source applications in enterprise software markets," Journal of Database Management, Vol. 19, No. 2, pp.73-94. Byrne, B. M. (2010) Structural Equation Modeling with AMOS: Basic Concepts, Applications, and Programming, Routledge, Taylor & Francis Group: New York, London. Chan, Y. E. (2000) "IT value: The great divide between qualitative and quantitative and individual and organizational measures," Journal of Management Information Systems, Vol. 16, No. 4, pp.225-261. Chen, L., Soliman, K. S., Mao, E., and Frolick, M. N. (2000) "Measuring user satisfaction with data warehouses: an exploratory study," Information & Management, Vol. 37, No. 3, pp.103-110.

112
Chervany, N. L. and Dickson, G. W. (1974) "An experimental evaluation of information overload in a production environment," Management Science, Vol. 20, No. 10, pp.1335-1349. Chervany. N. L., Dickson, G. W., and Kozar, K. (1972) "An experimental gaming framework for investigating the influence of management information systems on decision effectiveness," MISRC Working Paper, No.71-12, Management Information Systems Research Center, University of Minnesota, Minneapolis, MN. Cheung, W., Chang, M. K., and Lau, V. S. (2000) "Prediction of Internet and World Wide Web usage at work: a test of an extended Triandis model," Decision Support Systems, Vol. 30, pp.83-100. Clemons, E. K., Reddi, S. P., and Row, M. C. (1993) "The impact of information technology on the organization of economic activity: The "move to middle" hypothesis," Journal of Management Information Systems, Vol. 10, No. 1, pp.9-35. Colombo, E., Francalanci, C., and Pernici, B. (2004) "Modeling cooperation in virtual districts: a methodology for e-service design," International Journal of Cooperative Information Systems, Vol. 13, No. 4, pp.369-411. Conry-Murray, A. (2009) "Can enterprise social networking pay off?" informationweek.com, March 23, pp.23-29. Cronin, Jr. J. J. and Taylor, S. A. (1992) "Measuring service quality: a reexamination and extension," Journal of Marketing, Vol. 56, No. 3, pp.55-68. D'Ambra, J. and Rice, R. E. (2001) "Emerging factors in user evaluation of the World Wide Web," Information & Management, Vol. 38, No. 6, pp.373-384. Damanpour, F. (1992) "Organizational size and innovation," Organization Studies, Vol. 13, No. 3, pp.375-402. Danziger, J. N. (1987) "Politics, productivity and computers: a contingency analysis in local governments," Proceedings of the Ninth Annual Society for Management Information Systems Conference, pp.213-221. Davenport, T. H. (1998) "Putting the enterprise into the enterprise system," Harvard Business Review, Vol. 76, No. 4, pp.121-131. Davenport, T. H. and Brooks, J. D. (2004) “Enterprise systems and the supply chain,” Journal of Enterprise Information Management, Vol. 17, No. 1, pp.8-19. Davis, F. D. (1989) "Perceived usefulness, perceived ease of use, and user acceptance of information technology," MIS Quarterly, Vol. 13, No. 3, pp.319-339.

113
Davis, M.A. (2009) "State of open source adoption," informationWeek.com, Feb 2009. De Boer, M., Van den Bosch, F., and Volberda, H. (1999) "Managing organizational knowledge integration in the emerging multimedia complex," Journal of Management Studies, Vol. 36, No. 3, pp379-398. DeBrabander. B. and Thiers, G. (1984) "Successful information systems development in relation to situational factors which affect effective communication between mis-users and edp-specialists," Management Science, Vol. 30, No. 2, pp.137-155. DeLone, W. H. (1988) "Determinants of success for computer usage in small business," MIS Quarterly, Vol. 12, No. 1, pp.51-61. DeLone, W. H. and McLean, E. R. (1992) "Information systems success: the quest for the dependent variable," Information Systems Research, Vol. 3, No. 1, pp.60-95. DeLone, W. H. and McLean, E. R. (2002) “Information systems success revisited,” Proceedings of the 35th Hawaii International Conference on System Sciences, Big Island, Hawaii, pp.238-249. DeLone, W. H. and McLean, E. R. (2003) "The DeLone and McLean model of information systems success: a ten-year update," Journal of Management Information Systems, Vol. 19, No. 4, pp.9-30. Dempsey, B., Weiss, D., Jones, P., and Greenberg, J. (2002) “Who is an open source software developer?” Communications of the ACM, Vol. 45, No. 2, pp.67-72. DeSanctis, G. and Gallupe, R. B. (1987) "A foundation for the study of group decision support systems," Management Science, Vol. 33, No. 5, pp.589-609. Dickson, G., Leitheiser, R. L., Wetherbe, J. C., and Nechis, M. (1984) "Key information systems issues for the 1980's," MIS Quarterly, Vol. 8, No. 3, pp.135-159. Doll, W. J. and Torkzadeh, G. (1998) "Developing a multidimensional measure of systems use in an organizational context," Information & Management, Vol. 33, No. 4, pp.171-185. Economides, N. and Katsamakas, E. (2006) "Two-sided competition of proprietary vs. open source technology platforms and the implications for the software industry," Management Science, Vol. 52, No. 7, pp.1057-1071. Ein-Dor, P. and Segev, E. (1978) "Organizational context and the success of management information systems," Management Science, Vol. 24, No. 10, pp.1064-1077.

114
Emery, J. C. (1971) Cost/Benefit Analysis of Information Systems, SMIS Workshop Report Number 1, The Society for Management Information Ststems: Chicago, IL. Etezadi-Amoli, J. and Farhoomand, A. F. (1996) "A structural model of end user computing satisfaction and user performance," Information & Management, Vol. 30, No. 2, pp.65-73. Fawcett, S. E., Ellram, L. M., and Ogden, J. A. (2007) Supply Chain Management from Vision to Implementation, Pearson Prentice Hall: Upper Saddle River, NJ, p.144. Finney, S. and Corbett, M. (2007) "ERP implementation: a compilation and analysis of critical success factors," Business Process Management Journal, Vol. 13, No. 3, pp.329-347. Fornell, C. and Larcker, D. F. (1981) "Structural equation models with unobservable variables and measurement error: algebra and statistics," Journal of Marketing Research, Vol. 18, No. 3, pp.382-388. Franz, C. R. and Robey, D. (1986) "Organizational context, user involvement and the usefulness of information systems," Decision Sciences, Vol. 17, No. 3, pp. 329-356. Fuerst, W. L. and Cheney, P. H. (1982) "Factors affecting the perceived utilization of computer-based decision support systems," Decision Sciences, Vol. 13, No. 4, pp.554-569. Gable, G. G. (1996) "A multidimensional model of client success when engaging external consultants," Management Science, Vol. 42, No. 8, pp.1175-1198. Gable, G. G., Sedera, D., and Chan, T. (2003) "Enterprise systems success: a measurement model," International Conference on Information Systems, Seattle, WA. Gable, G. G., Sedera, D., and Chan, T. (2008) "Re-conceptualizing information system success: the IS-impact measurement model," Journal of the Association for Information Systems, Vol. 9, No. 7, pp.377-408. Gallagher, C. A. (1974) "Perceptions of the value of a management information system," Academy of Management Journal, Vol. 17, No. 1, pp.46-55. Gatian, A. W. (1994) "Is user satisfaction a valid measure of system effectiveness," Information & Management, Vol. 26, No. 3, pp.119-131. Gelderman, M. (1998) "The relation between user satisfaction, usage of information systems, and performance," Information & Management, Vol. 34, No. 1, pp.11-18.

115
Ghobadian, A. and O'Regan, N. (2000) "Time to reassess the size criterion for SME classification? An empirical investigation," International Journal of Manufacturing Techonology and Management, Vol. 2, No. 1/2/3/4/5/6/7, pp.879-890. Ghosh, R., Glott, R., Kreiger, B., and Robles-Martinez, G. (2002) "The free/libre/open source software developers survey,” http://www.infonomics.nl/FLOSS/report/. Ginzberg, M. J. (1978) "Finding an adequate measure of OR/MS effectiveness," Interfaces, Vol. 8, No. 4, pp.59-62. Ginzberg, M. J. (1981a) "Early diagnosis of MIS implementation failure," Management Science, Vol. 27, No. 4, pp.459-478. Ginzberg, M. J. (1981b) "Key recurrent issues in the MIS implementation process," MIS Quarterly, Vol. 5, No. 2, pp.47-60. Goslar, M. D. (1986) "Capability criteria for marketing decision support systems," Journal of MIS, Vol. 3, No. 1, pp.81-95. Gremillion, L. L. (1984) "Organization size and information system use," Journal of Management Information Systems, Vol. 1, No. 2, pp.4-17. Grewal, R., Lilien, G. L., and Mallaparagada, G. (2006) "Location, location, location: Howe network embeddedness affects project success in open source systems," Management Science, Vol. 52, No. 7, pp.1043-1056. Grover, G., Jeong, S. R., and Segars, A. H. (1996) "Information systems effectiveness: The construct space and patterns of application," Information & Management, Vol. 31, No. 4, pp.177-191. Guimaraes, T. and Igbaria, M. (1997) "Client/server system success: Exploring the human side," Decision Sciences, Vol. 28, No. 4, pp.851-875. Hahn, E. D., Doh, J. P., and Bunyaratavej, K. (2009) "The evolution of risk in information systems offshoring: the impact of home country risk, firm learning, and competitive dynamics," MIS Quarterly, Vol. 33, No. 3, pp.597-616. Haigh, N. and Griffiths, A. (2008) "The environmental sustainability of information systems: considering the impact of operational strategies and practices,” International Journal of Technology Management, Vol. 43, No. 1-3, pp.48-63. Hamilton, S. and Chervany, N. L. (1981) "Evaluating information system effectiveness. part i. comparing evaluation approaches," MIS Quarterly, Vol. 5, No. 3, pp.55-69.
116
Haruvy, E., Sethi, S. P., and Zhou, J. (2008) "Open source development with a commercial complementary product or service," Production and Operations Management, Vol. 17, No. 1, pp.29-43. Helo, P. and Szekely, R. (2005) "Logistics information systems: an analysis of software solutions for supply chain co-ordination," Industrial Management & Data Systems, Vol. 105, No. 1/2, p.5. Hiltz, S. R. and Turoff, M. (1981) "The evolution of user behavior in a computerized conferencing system," Communications of the ACM, Vol. 24, No. 11, pp.739-751. Hitt, L. and Brynjolfsson, E. (1994) "The three faces of IT value: Teory and evidence," in DeGross, J. I., Huff, S. L., and Munro, M. C. (eds.), Proceedings of the International Conference on Information Systems, Association for Information Systems: Atlanta, GA, pp.263-278. Holsti, R. (1969) Content Analysis for the Social Sciences and Humanities, Addison-Wesley: Reading, MA. Huang, J. and Li, Y. (2009) "The mediating effect of knowledge management on social interaction and innovation performance," International Journal of Manpower, Vol. 30, No. 3, pp.285-301. Hughes, B. and Cotterell, M. (1999) Software Project Management, 2nd ed., McGraw-Hill: Berkshire, United Kingdom. Hussain, Z. and Wallace, J. (2007) "The use and impact of human resource information systems on human resource management professionals," Information & Management, Vol. 44, No. 1, pp.74-89. Iansiti, M. and Clark, K. B. (1994) "Integration and dynamic capability: evidence from product development in automobiles and mainframe computers," Industrial and Corporate Change, Vol. 3, No. 3, pp.557–605. Iansiti, M. and Richards, G. L. (2006) “The business of free software: enterprise incentives, investment, and motivation in the open source community,” Harvard Business School Working Paper Series, No. 07-028. Iivari, J. and Koskela, E. (1987) "The PIOCO model for information systems design," MIS Quarterly, Vol. 11, No. 3, pp.401-419. Irani, Z. and Love, P. E. D. (2000) "The propagation of technology management taxonomies for evaluating investments in information systems," Journal of Management Information Systems, Vol. 17, No. 3, pp. 61-177.

117
Ives, B., Hamilton, S., and Davis, G. B. (1980) "A framework for research in computer-based management informalion systems," Management Science, Vol. 26, No. 9, pp.910-934. Jaisingh, J., See-To, E. and Tam, K. (2008) "The impact of opensource software on the strategic choices of firms developing proprietary software," Journal of Management Information Systems, Vol. 25, No. 3, pp.241-275. Jarvenpaa, S. L., Dickson, D. W., and DeSanctis, G. (1985) "Methodoiogicai issues in experimental i/s research: experiences and recommendations," MIS Quarterly, Vol. 9, No. 2, pp.141-156. Jenster, P. V. (1987) "Firm performance and monitoring of critical success factors in different strategic contexts," Journal of Management Information Systems, Vol. 3, No. 3, pp.17-33. Johansson, B. and Sudzina, F. (2008) "ERP systems and open source: an initial review and some implications for SMEs," Journal of Enterprise Information Management, Vo. 21, No. 6, pp. 649-658. Jöreskog, K. and Sörbom, D. (1993) LISREL 8: Structural Equation Modeling with the SIMPLIS Command Language, Scientific Software International, Erlbaum. Kaplowitz, M. D., Hadlock, T. D., and Levine, R. (2004) "A comparison of web and mail survey response rates," Public Opinion Quarterly, Vol. 68, pp.94-101. Kaplan, R. S. and Norton, D. P. (1996) The Balanced Scorecard: Translating Strategy Into Action, Harvard Business School Press: Boston, Mass. Karimi, J., Somers, T. M., and Bhattacherjee, A. (2007) "The impact of ERP implementation on business process outcomes: A factor-based study," Journal of Management Information Systems, Vol. 24, No. 1, pp.101-134. Katerattanakul, P., Hong, S., and Lee, J. (2006) "Enterprise resource planning survey of Korean manufacturing firms", Management Research News, Vol. 29, No. 12, pp.820-837. Kauremaa, J., Kärkkäinen, M., and Ala-Risku, T. (2009) "Customer initiated interorganizational information systems: the operational impacts and obstacles for small and medium sized suppliers," International Journal of Production Economics, Vol. 119, No. 2, pp.228-239. Kerr, J. (2009) “Technology outlook: getting by without the big guys,” Supply Chain Management Review, Vol. 13, No. 1, pp. 14-19.

118
Kim, E. and Lee, J. (1986) "An exploratory contingency model of user participation and MIS use," Information & Management, Vol. 11, No. 2, pp.87-97. Kim, J. H., Kim, M. K., and Hong, S. H. (2009) Writing Theses with SEM, Communicationsbooks: Seoul, Korea. King, W. R. and Epstein, B. J. (1983) "Assessing information system value," Decision Sciences, Vol. 4, No. 1, pp.34-45. King, W. R. and Rodriguez, J. I. (1978) "Evaluating management information systems," MIS Quarterly, Vol. 2, No. 3, pp.43-51. King, W. R. and Rodriguez, J. I. (1981) "Participative design of strategic decision support systems," Management Science, Vol. 27, No. 6, pp.717-726. Krippendorff, K. (2004) Content Analysis: An Introduction to its Methodology, Sage: Thousand Oaks, California. Krogh, G. V. and Hippel, E. V. (2006) "The promise of research on open source software," Management Science, Vol. 52, No. 7, pp.975-983. Lakhani, K. R. and Wolf, R. G. (2001) “Does free software mean free labor? Characteristics of participants in FOSS communities,” Boston Consulting Group Survey Report, Boston, MA. (available at http://web.sourceforge.com/) Lakhani, K. R. and Wolf, R. G. (2005) "Why hackers do what they do: understanding motivation and effort infree/open source software projects," Perspectives on Free and Open Source Software, MIT Press: Cambridge, MA, pp3-22. Landis, J. R. and Koch, G. (1997) "The measurement of observer agreement for categorical data," Biometrics, Vol. 33, No. 2, pp.159-174. Larcker, D. F. and Lessig, V. P. (1980) "Perceived usefulness of information: a psychometric examination," Decision Sciences, Vol. 11, No. 1, pp.121-134. Laudon, K. C. and Laudon, J. P. (2010) Management Information Systems: Managing the Digital Firms, Pearson Prentice Hall: Upper Saddle River, NJ, pp.52-59. Lee, D. and Mendelson, H. (2008) "Divide and conquer: Competing with free technology under network effects," Production and Operations Management, Vol. 17, No. 1, pp.12-28. Lee, H. Y. L. and Yoo, D. (2000) "The determinants of perceived service quality and its relationship with satisfaction," Journal of Services Marketing, Vol. 14, No. 3, pp.217-231.

119
Lee, H. S. and Lim, J. H. (2009) Structural Equation Modeling and AMOS 16.0, Pubmoon Sa: Seoul, Korea, pp.6-7. Lee, S. H., DeWester, D., Park, S. (2008) “Opportunities for small business in the Web 2.0 era,” Service Business, Vol. 2, No. 4, pp.335-345. Lee, S. H., Trimi, S., Choi, D. H., and Rha, J. S. (Forthcoming in 2010) “A comparative study of proprietary ERP and open source ERP modules on the value chain,” International Journal of Information and Decision Sciences. Lee, S. M. and Olson, D. L. (2010) Convergenomics: Strategic Innovation in the Convergence Era, Gower Publishing Limited: Burlington, VT. Lee, S. T., Kim, H. W., and Gupta, S. (2009) "Measuring open source software success," Omega, Vol. 37, No. 2, pp.426-438. Light, B., Holland, C. P., and Wills, K. (2001) "ERP and best of breed: a comparative analysis," Business Process Management, Vol. 7, No. 3, pp.216-224. Lin, W. T. and Shao, B. B. M. (2000) "Relative sizes of information technology investments and productive efficiency: their linkage and empirical evidence," Journal of the Association for Information Systems, Vol. 1, No 7. Lucas, H. C. (1973) "A Descriptive model of information systems in the context of the organization," Proceedings of the Wharton Conference on Research on Computers in Organizations. Data Base, pp.27-36. Lucas, H. C. (1975) "Performance and the use of information systems," Management Science, Vol. 21, No. 8, pp.908-919. Lucas, H. C. (1978) "Empirical evidence fora descriptive model of implementation," MIS Quarterly, Vol. 2, No. 2, pp.27-41. Lucas, H. C. (1981) "An Experimental investigation of the use of computer-based graphics in decision-making," Management Science, Vol. 27, No. 7, pp.757-768. Lucas, H. C. and Nielsen, N. R. (1980) "The Impact of the mode of information on learning and performance," Management Science, Vol 26, No. 10, pp.982-993. Mabert, V. A., Soni, A., and Venkataramanan, M. A. (2000) "Enterprise resource planning survey of U.S. manufacturing firms," Production & Inventory Management Journal, Vol. 41, No. 2, pp.52-58. Mahmood, M. A. (1987) "Systems development methods - a comparative investigation," MIS Quarterly, Vol. 11, No. 3, pp.293-311.
120
Maish, A. M. (1979) "A user's behavior toward his MIS," MIS Quarterly, Vol. 3, No. 1, pp.39-52. Markus, M.L. (1983) "Power, politics, and MIS implementation," Communications of the ACM, Vol. 26, No.6, pp.430-444. Mason, R. O. (1978) "Measuring information output: a communication systems approach," Information & Management, Vol. 1, No. 5, pp.219-234. Matlin, G. (1979) "What is the value of investment in information systems?" MIS Quarterly, Vol. 3, No. 3, pp.5-34. McFadden, F. R. (1977) "How to do cost/benefit analysis realistically," Proceedings of the Ninth Annual Society of Management Information Systems Conference, pp.331-338. McLaren, S. and Vuong, D. C. H. (2008) “A “genomic” classification scheme for supply chain management information systems,” Journal of Enterprise Information Management, Vol. 21, No. 4, pp.409-442. McMillan, S. J. (2000) "The microscope and the moving target: The challenge of applying content analysis to the World Wide Web," Journalism and Mass Communication Quarterly, Vol. 77, No. 1, pp.80-98. Meador, C. L., Guyote, M. J., and Keen, P. G. (1984) "Setting priorities for dss development," MIS Quarterly, Vol. 8, No. 2, pp.117-129. Melone, N. P. (1990) "A theoretical assessment of the user-satisfaction construct," Management Science, Vol. 36, No. 1, pp.76-91. Miller, J. and Doyle, B. A. (1987) "Measuring effectiveness of computer based information systems in the financial services sector," MIS Quarterly, Vol. 8, No. 2, pp.107-124. Mock, T. J. (1971) "Concepts of information value and accounting," The Accounting Review, Vol. 46, No. 4, pp.765-778. Myers, B. L., Kappelman, L. A., and Prybutok, V. R. (1998) “A comprehensive model for assessing the quality and productivity of the information systems function: toward a theory for information systems assessment,” in Garrity, E. J. and Sanders, G. L. (Eds.), Information Systems Success Measurement, Hershey: Idea Group, pp.94-121. Negesh, S. (2004) “Business intelligence,” Communications of the Association for Information Systems, Vol. 13, pp.177-195. Nunnally, J. C. and Berbstein, I. (1994) Psychometric Theory, McGraw-Hill: New York, NY, pp.248-651.

121
O’Mahony, S. (2003) "Guarding the commons: How community managed software projects protect their work," Research Policy, Vol. 32, No. 7, pp.1179-1198. Olhager, J. and Selldin, E. (2003) "Enterprise resource planning survey of Swedish manufacturing firms," European Journal of Operational Research, Vol. 146, No. 2, pp.365-373. Olson, D. L. (2004) Managerial Issues of Enterprise Resource Planning Systems, McGraw-Hill/Irwin, New York, NY. Olson, D. L., Lee, S. H., Choi, D. H., and Rha, J. S. (Forthcoming in 2010) "Open source development in enterprise information systems," Production and Inventory Management Journal. Olson, M. H. and Lucas, H. C. (1982) "The impact of office automation on the organization: some implications for research and practice," Communications of the ACM, Vol. 25, No. 11, pp.838-847. Open Source Initiative (2010) The open source definition, http://www.opensource.org/-docs/osd. Parasuraman, A., Zeithaml, V. A., and Berry, L. L. (1988) "SERVQUAL: a multiple-item scale for measuring consumer perceptions of service quality," Journal of Retailing, Vol. 64, No. 1, pp.12-40. Park, M. K., Lee, J. J., and Jeong, S. R. (2002) "An exploratory study of ERP system implementation: relationships between completeness of each phase and its impact on system performance," Information System Review, Vol. 4, No. 2, pp.237-255. Pitt, L. F., Watson, R. T., and Kavan, C. B. (1995) "Service quality: A measure of information systems effectiveness," MIS Quarterly, Vol. 19, No. 2, pp.173-188. Porter, M. E. (1979) "How competitive forces shape strategy," Harvard Business Review, Vol. 57, No. 2, pp.137-145. Poston, R. S. and Speier, C. (2005) "Effective use of knowledge management systems: a process model of content ratings and credibility indicators," MIS Quarterly, Vol. 29, No. 2, pp.221-244. Powers, R. F. and Dickson, G. W. (1973) "MIS project management: myths, opinions and reality," California Management Review, Vol. 15, No. 3, pp.147-156. Rai, A., Lang, S. S., and Welker, R. B. (2002) "Assessing the validity of IS success models: an empirical test and theoretical analysis," Information Systems Research, Vol. 13, Vo. 1, pp.50-56.

122
Raymond, E. (1999) "The cathedral and the bazaar," Knowledge, Technology & Policy, Vol. 12, No. 3. Raymond, L. (1985) "Organizational characteristics and mis success in the context of small business," MIS Quarterly, Vol. 9, No. 1, pp.37-52. Raymond, L. and Bergeron, F. (2008) "Project management information systems: an empirical study of their impact on project managers and project success," International Journal of Project Management, Vol. 26, No. 2, pp.213-220. Riffe, D., Lacy, S. and Fico, F. (2005). Analyzing Media Messages: Using Quantitative Content Analysis in Research, Lawrence Erlbaum Associates, Inc.: Mahwah, NJ. Rivard, S. and Huff, S. L. (1984) "User developed applications: evaluation of success from the dp department perspective," MIS Quarterly, Vol. 8, No. 1, pp.39-50. Roberts, J., Hann, I. and Slaughter, S. (2006) "Understanding the motivations, participation, and performance of open source software developers: a longitudinal study of the apache projects," Management Science, Vol. 52, No. 7, pp.984-999. Robey, D. (1979) "User attitudes and management information system use," Academy of Management Journal, Vol. 22, No. 3, pp.527-538. Robey, D. and Boudreau, M. (1999) "Accounting for the contradictory organizational consequences of information technology: theoretical directions and methodological implications," Information Systems Research, Vol. 10, No.2, pp.167-85. Robinson, J. P., Shaver, P. R., and Wrightsman, L. S. (1991) Criteria for Scale Selection and Evaluation, in Robinson, J. P., Shaver, P. R., Wrightwman, L. S. (Eds), Measure of Personality and Social Psychological Attitudes, San Diego: Academic Press, pp.25-400. Robles-Martinez, G., Scheider, G., Tretkowski, I., and Weber, N. (2001) “Who is doing it?” http://widi.berlios.de/paper/study.html. Rosenbleeth, M., Dallas-Feeney, C., Simmerman, S. S., and Casey, T. (2002) "Capturing value through customer strategy," Booz Allen & Hamilton Inc. Rosnow, R. L. and Rosenthal, R. (1996) Beginning Behavioral Research: A Conceptual Primer, Prentice-Hall: Upper Saddle River, NJ. Royce, W. (1970) "Managing the development of large software systems," Proceedings of IEEE WESCON 26 (August): 1-9.

123
Sabherwal, R., Jeyaraj, A., and Chowa, C. (2006) "Information system success: individual and organizational determinants," Management Science, Vol. 52, No. 12, pp. 1849-1864. Sanders. G. L. (1984) "MIS/DSS success measure," Systems, Objectives, Solutions, Vol. 4, pp.29-34. Sanders. G. L. and Courtney, J. F. (1985) "A field study of organizational factors influencing DSS success," MIS Quarterly, Vol. 9, No. 1, pp.77-93. Schultz, R. L. and Slevin D. P. (1975) "A program of research on implementation," Implementing Operations Research/Management Science, American Elsevier: New York, NY, pp.31-51. Seddon, P. B. (1997) "A respecification and extension of the DeLone and McLean model of IS success," Information Systems Research, Vol. 8, No. 3, pp.240-253. Seddon, P. B. and Kiew M. Y. (1994) "A partial test and development of DeLone and McLean's model of IS success," Australian Journal of Information Systems, pp.90-109. Seddon, P. B., Staples, S., Patnayakuni, R., and Bowtell, M. (1999) "Dimensions of 47 information systems Success," Communications of the Association for Information Systems, Vol. 2, No. 20. Sedera, D. and Gable, G. G. (2004) “A factor and structural equation analysis of the enterprise systems success measurement model.” Proceedings of the 25th International Conference on Information Systems, Washington DC, USA, 2004. Sen, R. (2007) "A strategic analysis of competition between open source and proprietary software," Journal of Management Information Systems, Vol. 24, No. 1, pp.233-257. Serrano, N.S. and Sarriegi, J.M. (2006) "Open source software ERPs: a new alternative for an old need," IEEE Software, Vol. 23, No. 3, pp.94-97. Shannon, C. E. and Weaver, W. (1949) The Mathematical Theory of Communication, University of Illinois Press: Urbana, IL. Sher, P. J. and Lee, V. C. (2002) "Information technology as a facilitator for enhancing dynamic capabilities through knowledge management," Information & Management, Vol. 41, No. 8, pp.933-945.
Shin, B. (2003) "An exploratory investigation of system success factors in data warehousing," Journal of the Association for Information Systems, Vol. 4, No. 6, pp.141-170.

124
Srinivasan, A. (1985) "Alternative measures of system effectiveness: associations and implications," MIS Quarterly, Vol. 9, No. 3, pp.243-253. Stefanou, C. J., Sarmaniotis, c., and Stafyla, A. (2003) "CRM and customer-centric knowledge management: an empirical research," Business Process Management Journal, Vol. 9, No. 5, pp.617 - 634. Subramanian, A. M. and Soh, P. (2008) "Knowledge integration and effectiveness of open source software development projects," IIMB Management Review (Indian Institute of Management Bangalore), Vol. 20, No. 2, pp139-148. Sunstein, C. R. (2006) Infotopia: How Many Minds Produce Knowledge, Oxford University Press, Inc.: New York, NY. Swanson, E. B. (1974) "Management information systems: appreciation and involvement," Management Science, Vol. 21, No. 2, pp.178-188. Teas, R. K. (1993) "Expectations, performance evaluation, and consumers' perceptions of quality," Journal of Marketing, Vol. 57, No. 4, pp.18-34. TechRepublic (2006) "Understanding the pros and cons of the Waterfall model of software development," http://articles.techrepublic.com.com/5100-10878_11-6118423.html. Teece, D. J. (2007) "Explicating dynamic capabilities: the nature and microfoundations of (sustainable) enterprise performance," Strategic Management Journal, Vol. 28, No. 13, pp.1319-1350. Thatcher, M. E. and Oliver, J. R. (2001) "The impact of technology investments on a firm's production efficiency, product quality, and productivity," Journal of Management Information Systems, Vol. 18, No. 2, pp.17-45. Thornhill, S. (2006) "Knowledge, innovation and firm performance in high- and low-technology regimes," Journal of Business Venturing, Vol. 21, No. 5, pp.687-703.
Tseng, M. M. and Pillar, F. T. (2003) The Customer Centric Enterprise: Advances in Mass Customization and Personalization, Springer: New York, NY. Vessey, I., Ramesh, V., and Glass, R. L. (2002) "Research in information systems: an empirical study of diversity in the discipline and its journals," Journal of Management Information Systems, Vol. 19, No. 2, pp.129-174. Watson, C. J. and Driver, R. W. (1983) "The influence of computer graphics on the recall of information," MIS Quarterly, Vol. 7, No. 1 (March 1983), pp.45-53.

125
Watson, H. J., Fuller, C., and Ariyachandra, T. (2004) “Data warehouse governance: best practices at blue cross and blue shield of North Carolina,” Decision Support Systems, Vol. 38, pp.435-450. Weber, S. (2005) The Success of Open Source, Harvard University Press: Cambridge, MA. Welke, R. J. and Konsynski, B. R. (1980) "An examination of the interaction between technology, methodology, and information systems: a tripartite view," Proceedings of the First International Conference on Information Systems, pp.32-48. Wixom, B. H. and Todd, P. A. (2005) "A theoretical integration of user satisfaction and technology accpetance," Information Systems Research, Vol. 16, No. 1, pp.85-102. Yin, R.K. (2003) Case StudyResearch: Design and Methods, Sage Publications: Beverly Hills, CA. Zmud, R. W. (1978) "An empirical investigation of the dimensionality of the concept of information," Decision Sciences, Vol. 9, No. 2, pp.187-195. Zmud, R. W. (1979) "Individual differences and MIS success: a review of the empirical literature," Management Science, Vol. 25, No. 10, pp.966-979.

126
APPENDICES
APPENDIX A: SCM IS Functional Attributes by McLaren and Vuong (2008)
(With primary supply chain processes collapsed)

127
(With plan process group collapsed)

128
(Plan process group expanded)

129
APPENDIX B: Survey Questionnaire for OSS EIS
PART I General Questions/Organizational Characteristic
1. Gender a. Male b. Female
2. Age
a. 19 ~ 29 b. 30 ~ 39 c. 40 ~ 49 d. 50 ~ 59 e. Over 60
3. What industry is your organization in?
a. Manufacturing b. Financial c. Distribution d. IT/Communication e. Service f. Other (Please specify. E-Commerce, Energy, Heath, Education, Government,
Individual, Student, etc.)
4. Approximate your organization’s annual revenue (M = Million) a. 0 ~ $0.5 M b. $0.5 M ~ Less than $1 M c. $1 M ~ Less than $10 M d. $10 M ~ Less than $50 M e. $50 M ~ Less than $500 M f. Over $500 M
5. How many employees does your organization have?
a. Less than 100 b. 101 ~ 300 c. 301 ~ 1000 d. 1001 ~ 9999 e. Over 10000
6. What country do you work at?

130
7. What is your job title? PART II General questions about Open Source Software (OSS) Enterprise
Information Systems (EIS) Please answer the following questions based on OSS EIS in your organization.
1. How long has your organization used OSS EIS? a. Less than six months b. 6 months ~ 1 year c. 1 year ~ 2 years d. 2 ~ 5 years e. More than 5 years
2. Indicate the OSS EIS modules you have experienced. (Choose multiple items, if
applicable.)
Enterprise Information Systems (ERP) a. Financial & Accounting b. Materials Management c. Production Planning d. Order Entry e. Purchasing f. Financial Control g. Distribution/Logistics h. Asset Management i. Personnel/Human Resources j. Quality Management k. Maintenance l. R&D Management
Customer Relationship Management (CRM)
m. Channel Management n. Call Center/Help Desk o. Data Integration/Data Warehousing p. Knowledge Management q. Field

131
r. Sales s. Marketing t. Product Management
Supply Chain Management (SCM)
u. Delivery (transportation execution, invoicing) v. Make (to order, to stock, process manufacturing, discrete
manufacturing, sales order processing, bill of materials, production control, inventory replenishment, order promising)
w. Return x. Plan (demand planning, supply planning, service parts planning,
supply and demand matching, optimize inventory, network design, production planning, transportation planning)
y. Source (procurement, purchase order processing) z. Data Management (XML, RFID, EDI) aa. Decision Support (optimization, reporting, modeling, forecasting,
product lifecycle management, scenario analysis, simulations) bb. Relationship Management (distributor, competitor, retailer,
manufacturer, supplier) cc. Performance Improvement (lean supply chain, performance analysis,
collaboration, quality management) 3. What percentage of OSS EIS had to be customized to fit your organization’s need?
a. Less than 5% b. 5% ~ 10% c. 10% ~ 20% d. 20% ~ 50% e. More than 50%
4. Please indicate the extent to which you agree with the following statements.
1=Strongly Disagree, 3=Neither Agree nor Disagree, 5=Strongly Agree a. OSS EIS was configured by experts.
1 2 3 4 5
b. We have experienced system performance problems due to the customization of OSS EIS we adopted.
1 2 3 4 5

132
c. We have experienced software upgrade problems due to the customization of OSS EIS we implemented.
1 2 3 4 5
d. System reengineering has taken placed as OSS EIS implementation proceeds. 1 2 3 4 5
5. Who is involved in OSS EIS implementation for your organization?
a. OSS EIS community b. Proprietary vendor c. 3rd party OSS EIS distributor d. Consulting firm e. In-house implementation
6. Who does provide the most technical support you need for OSS EIS? a. OSS EIS community b. Proprietary vendor c. 3rd party OSS EIS distributor d. Consulting firm e. In-house support
PART III OSS EIS User Perception Please answer the following questions based on your experiences with OSS EIS in your organization.
1=Strongly Disagree, 3=Neither Agree nor Disagree, 5=Strongly Agree
Information Quality
Information quality refers to the quality of the information OSS EIS produces in reports and on-screen. 1. Information from OSS EIS is always timely
1 2 3 4 5
2. Information from OSS EIS is always accurate 1 2 3 4 5
3. Information from OSS EIS is always relevant to my tasks

133
1 2 3 4 5
4. Overall, OSS EIS information quality is satisfactory 1 2 3 4 5
System Quality
System quality refers to the performance of OSS EIS. 1. OSS EIS response is always quick
1 2 3 4 5
2. OSS EIS is easy to use 1 2 3 4 5
3. OSS EIS has useful functions 1 2 3 4 5
4. Overall, OSS EIS system quality is satisfactory 1 2 3 4 5
Community Service Quality
The OSS EIS community services that you have experienced. Communities include on-line communities or partners who provide OSS EIS and/or supports to your organization. 1. OSS EIS community has up-to-date hardware and software
1 2 3 4 5
2. OSS EIS community is dependable 1 2 3 4 5
3. OSS EIS community gives prompt service to users 1 2 3 4 5
4. OSS EIS community has the knowledge to do its job sell 1 2 3 4 5
5. OSS EIS community has users’ best interests at heart 1 2 3 4 5
6. Overall, OSS EIS service quality is satisfactory 1 2 3 4 5

134
OSS EIS Use
OSS EIS use is an indicator that shows how much you use OSS EIS. 1. I use OSS EIS very frequently (many times per month)
1 2 3 4 5
2. I use OSS EIS very intensively (many hours per day) 1 2 3 4 5
3. Overall, I use OSS EIS a lot 1 2 3 4 5
User Satisfaction User Satisfaction is your feeling about and response to the use of the output of OSS EIS. 1. The output information of OSS EIS is complete
1 2 3 4 5 2. I am satisfied with the material design of the layout and display of the output contents
from OSS EIS 1 2 3 4 5
3. I have strong feeling of control over OSS
1 2 3 4 5 4. Overall, I am satisfied with OSS
1 2 3 4 5
Individual Net Benefits Individual Net Benefits are concerned with how OSS EIS has influenced your individual capabilities and effectiveness on behalf of the organization. 1. I have learnt much through the presence of OSS EIS
1 2 3 4 5
2. OSS EIS enhances my awareness and recall of job related information 1 2 3 4 5
3. OSS EIS enhances my effectiveness in the job 1 2 3 4 5

135
4. OSS EIS increases my productivity 1 2 3 4 5
5. Overall, the impact of OSS EIS on me has been positive 1 2 3 4 5
Organizational Net Benefits Organizational Net Benefits are measures of the extent to which OSS EIS has promoted improvement in organizational results and capabilities. 1. OSS EIS reduces cost
1 2 3 4 5
2. OSS EIS requires less number of staff then proprietary software does 1 2 3 4 5
3. OSS EIS improves outcomes/outputs 1 2 3 4 5
4. Overall, OSS EIS increases organizational productivity 1 2 3 4 5

136
APPENDIX C: OSS EIS Projects in On-line OSS Communities
[ID] [Title] [ID] [Title] [ID] [Title] [ID] [Title]
1 Nagios 41 openCRX 81 Open Eye 121 q4wine
2 Liferay 42 openXpertya 82 Rifidi 122 Active Sharedoc
3 vtiger 43 FrontAcc 83 Gazie 123 PhreeBooks 4 Oxygen 44 Bots 84 Yaoqiang 124 aster 5 Pentaho 45 Project.net 85 KH Coder 125 EBI 6 Openbravo 46 Maarch 86 WorldVistA 126 tellmatic 7 Zenoss 47 jBilling 87 TUTOS 127 uEngine 8 Jasper 48 Magnolia 88 Adempiere 128 Ooo 9 Openfiler 49 openQRM 89 Jitterbit 129 CloverETL
10 phplist 50 Joget 90 OpenI 130 The Daisy 11 MantisBT 51 VMukti 91 SuiteFlex 131 Real Estate 12 ZK 52 SOFA 92 hipergate 132 epesi 13 PostBooks 53 Plazma 93 eXo 133 yellow 14 LimeSurvey 54 NutWin 94 ControlTier 134 PalOOCa 15 Adempiere 55 PatientOS 95 OpenRPT 135 CK 16 Hyperic 56 OpenXava 96 MailArchiva 136 Rivulet 17 RapidMiner 57 XRMS 97 Activa 137 DaReManager 18 OrangeHRM 58 ASTRES 98 Adaptive 138 Precurio 19 webERP 59 Medical 99 ATA 139 SolidState 20 JasperServer 60 Epiware 100 PHD 140 Coupa 21 Feng Office 61 OpenReports 101 FreeCRM 141 ERP.NET 22 ProcessMaker 62 EGG crm 102 JAMWiki 142 BlueERP 23 CiviCRM 63 MindTouch 103 SIDU 143 Stock 24 Mondrian 64 Webacula 104 SymmetricDS 144 LedgerSMB 25 OpenEMM 65 SugarCRM 105 web2Project 145 DocumentB 26 HOSxP 66 nagstamon 106 LeanPM 146 h-inventory 27 ]project 67 YAWL 107 Portaneo 147 DataCleaner 28 ISP Control 68 WeBid 108 Evaristo 148 Ganesha 29 Compiere 69 Jfire 109 FacturLinEx 149 Bill Maker 30 OpenKM 70 Executive 110 Support 150 th 31 Mibew 71 ManyDesigns 111 RunaWFE 151 RapidNet 32 Group-Office 72 Lokad 112 Kablink 152 WaypointHR 33 Talend 73 NConf 113 itop 153 cult 34 opentaps 74 Foswiki 114 Osmius 154 FreeAnalysis 35 TWiki 75 Palo Suite 115 queXF 155 MYIT 36 Dolibarr 76 LetoDMS 116 Limbas 156 Zimbra 37 SpringSide 77 Apatar 117 Tustena 157 The Naked 38 Sparklines 78 Neogia 118 OBPM 158 TinyERP 39 Turquaz 79 OneCMDB 119 TNT 159 Tribix 40 OpenEMR 80 PHP 120 Orange 160 jAllinOne

137
[ID] [Title] [ID] [Title] [ID] [Title] [ID] [Title] 161 OTRS 201 StoryTestIQ 241 JClaim 281 JBoss
162 logicAlloy 202 Huru 242 BMC 282 Eastwood Charts
163 T-dah 203 NPS 243 bxModeller 283 Web Law
164 ProM 204 Tockit 244 NMail 284 ComUnion ERP
165 osCommerce 205 iPFaces 245 CottageMed 285 Sales Po 166 nature 206 MyErp 246 HELIOS 286 ADaMSoft 167 DataSync 207 Sinergia 247 Felix 287 Meta Clinic 168 Maximo 208 QDataMatrix 248 Contabilidad 288 OAJ 169 bflow 209 pERP 249 OpenPetra.org 289 FormFlow 170 faceCart 210 OpenSTA 250 i-doit 290 Zoapiere 171 Cream 211 Web Auction 251 jdbc4olap 291 Open 172 JPEd 212 IntarS 252 olap4j 292 Yaoqiang 173 Sistema 213 JTL 253 IDCMS 293 pyARS 174 Alchemi 214 frePPLe 254 BulkMailer 294 Freedom 175 Biwoo 215 ThinWire 255 Falt4 CMS 295 Item Invent 176 IntChat 216 C# ECG 256 SaberNet DCS 296 VtigerCRM 177 Oscar 217 DCM4CHEE 257 Legal Case 297 Zorkif 178 CRMFacil 218 GlobalSight 258 B2Stok 298 Cyn.in 179 Tender 219 ICeHrm 259 TAU 299 Systems Osiris 180 Bias 220 ConcourseC 260 Jmagallanes 300 KETL 181 FGMP 221 Free 261 Covide 301 Active Direc 182 Hospital 222 Ranchbe 262 AML 302 InfiniDB 183 Ubuntu 223 chellow 263 Main//Pyrus 303 ADHelper 184 Mantaray 224 Projectivity 264 GeoKettle 304 SpagoBI
185 Inforama 225 vtiger Brazilian 265 PyLiveResponse 305 TobFlow
186 IGSuite 226 OSGi 266 tinyManager 306 OrgCharter 187 FlashRecruit 227 ProM 267 AgilPro 307 OpenLSD 188 mendelson 228 time-o 268 Integria 308 VistA-Edge 189 Unified 229 Gardenia 269 OpenCustomer 309 Enterprise 190 OpenDataBag 230 Illunus Data 270 Palo 310 VOIP 191 CalemEAM 231 CiviSync 271 SourceTap 311 nanowawi 192 DB Browser 232 Payroll 272 Retailer.org 312 FNDLOADER 193 openMDX 233 openwms.org 273 OpenSource 313 Overactive 194 OpenIT 234 LucidDB 274 Medscribble 314 bitfarm 195 Millennium 235 jBeacon 275 RepairsLab 315 Abstract 196 myWMS 236 Commander4j 276 Organizers 316 Elexis 197 Open ERP 237 Rubik 277 Citrus Database 317 Ofbiz 198 Excel Bill 238 CentraView 278 jNFe 318 SimplePDF 199 WPMU 239 Ohioedge 279 PMbyAS 319 DCTM 200 Zksample2 240 xProcess 280 Open PI 320 1BizCom

138
[ID] [Title] [ID] [Title] [ID] [Title] [ID] [Title] 321 Sheetster 361 Rental 401 WPF 441 Prometheus 322 Toutateam 362 Education 402 Innovati 442 LATRIX 323 Ajexa 363 OpenBlue 403 Pretty Da 443 Teamcenter 324 OpenERP 364 Pentaho 404 cPanel 444 ADbNews 325 BarCode Ge 365 SAP BAPI 405 NEXUS 445 openAlerts 326 SAFMQ 366 XScheduler 406 Atricore 446 CoreMan 327 Barcode 367 OpenInfo3W 407 EMC 447 ITAnyplace 328 nexusbpm 368 Compiere 408 OpenXDAS 448 personal doc 329 QuickTicket 369 OpenEMR M 409 Starprise 449 OpenEphyra 330 Artikel23 370 bpmscript 410 CapitalReS 450 Encrypted 331 MyHook 371 APbyAS 411 TherapyDoc 451 Info Pool 332 IT Project 372 Projeto 412 eCTD 452 Rally 333 Simple Inven 373 Document M 413 Booking 453 MugShots 334 IiM 374 Socr3 414 cinnamon 454 Fisterra 335 OpenPCL 375 JoomCivi 415 Samooha 455 JELEN 336 Collabry 376 CiMe 416 iPoint 456 Olap Na 337 ]project-op 377 Invoice 417 EVPO 457 Eberom 338 Monju 378 RUNick 418 Residential 458 Help Desk 339 Humano2 379 Web Tim 419 EHRflex 459 Olap 340 BizDiag 380 openMEDIS 420 OGSA-DAI 460 erpFram 341 ResCarta 381 Cisco IP 421 openCollab 461 Adempiere Pro 342 allocPSA 382 Symbolic 422 Ubuntu-B 462 Gerenciamento 343 PHPBo 383 mSeller 423 Suniant 463 OpenAppF 344 The Address 384 xsltcms.org 424 Popsicle 464 Datacleaning 345 BPMspace 385 EdgeERP 425 Flisys 465 taskcal 346 Cite 386 S.A.F.E. 426 MFbyAS 466 SBVR 347 Dove 387 Open Enter 427 koosseryADe 467 Prime 348 Auto, Car 388 Ramsetcube 428 Velo 468 Atabaque 349 Daffodil 389 SHINE 429 SONIVIS: 469 Workflow 350 OpenOLAP 390 GNUmed 430 Gateway An 470 Zanzi Info 351 X-RIME 391 JGuiGen 431 Information P 471 webems 352 SSLBridge 392 Communicati 432 Financial P 472 abanq.source 353 Data Qualit 393 OpenOffice 433 uOffice 473 Vtiger 354 Yonix DS 394 Cubulus 434 GWT 474 iglobalgest ERP 355 Xendra 395 ToilManager 435 RoosterIT 475 Password T 356 German 396 IPCC 436 OpenL 476 AGENCY 357 NewTranspo 397 once:radix 437 Active Ag 477 Racksmith 358 GenerateData 398 Hiitch 438 PhpVitae 478 SimplecoreLogic 359 Software Qua 399 Amix 439 OpenTT 479 KPInator 360 Teknologiap 400 OpenFakt 440 FIDAL 480 myCMMS

139
[ID] [Title] [ID] [Title] [ID] [Title] [ID] [Title] 481 OpenEngage 521 ICT-Alive 561 Plomino 601 CentricWar 482 Metron 522 Store M 562 SpaceBo 602 OPENSUITE 483 SimpleCRM 523 Compiere Jas 563 OLAP Spend 603 FitNet 484 Electris 524 Deep Email 564 Elyazalée 604 jRivet 485 bugTrack 525 OpenEAS 565 Mamook 605 JeNiFEr 486 WingS 526 CRM-Com 566 IRADIA 606 csv2odf 487 Open-MQ 527 Sistema 567 The Obix 607 Skrub 488 GAL 528 Openbravo P 568 Polo 608 BusinessWi 489 mydbaccess 529 3dVrmlStudio 569 Nmwerp 609 Mountain M 490 seta 530 MetaShare 570 Change M 610 ZFPPreno 491 C.A.T. 531 Recruit 571 Tariff Eye 611 ifriqiya 492 opendias 532 Physhun 572 Bookmarks 612 Plumber 493 KTiny 533 tyl-project 573 Biztalk X 613 Sfeb 494 Opalo 534 BMC 574 uEngine 614 Quick T 495 DocUpd 535 Java Busi 575 TracG 615 ERPJewels 496 Compiere Fix 536 DosIS 576 StarMX 616 BEXPSD 497 ER/Box 537 Yaoqiang 577 dmtxscan 617 Customer Su 498 TagCentric 538 Compiere 578 jointar 618 TraSer 499 Jataka 539 Proyecto 579 CloudI 619 The XE 500 e-NVISION 540 EnterTrack 580 Camaroes 620 HTMLT 501 Materio 541 Enterprise Ene 581 ChainBuilder 621 Monte Carlo 502 scan2pdf 542 FreeRetail 582 Jethro 622 Hibersap 503 ProMan 543 Passage .NET 583 Qualinnove 623 Helix PHP 504 taxi dispatcher 544 IOM 584 ETL 624 webMethods 505 OFBiz 545 ISO Con 585 jPersist 625 AbelCRM 506 SureInvoice 546 LAMP 586 AUCAS 626 CMS 507 GASwerk 547 Order Ent 587 IdMUnit 627 Tevere 508 Network Co 548 Data Migrat 588 Importal 628 OSBI 509 ERPLibero 549 infoERP 589 simtrain 629 ArgKit 510 Hotel Se 550 PSFGeneric 590 NobleCRM 630 Appointment 511 Tofu Sn 551 Open Leav 591 Easy Luce 631 Gestion de 512 myApps 552 ETL 592 Advanced 632 AnJelica 513 Knowledge B 553 Silverlight 593 Res 633 weka 514 Web Pu 554 Inventory Ma 594 Winds 634 Coral8 515 Oberon 555 MobileUS 595 Pequel 635 Boxi 516 flowchartwiki 556 jWebApp 596 Work T 636 HydraCube 517 APEX 557 Intrannuity iBi 597 Asterisk 637 VENSSO 518 web2proje 558 CMS 598 Open Proc 638 coffeeadmin 519 Coadunation 559 EEG 599 Ajuby 639 Structs And 520 Curl Lib 560 phpDHCP 600 SmartGRAPE 640 Remedy

140
[ID] [Title] [ID] [Title] [ID] [Title] [ID] [Title] 641 GLEAM 681 Moomis 721 Norfello 761 PROGRESS2 642 Modus 682 PeKaVau 722 DDELin 762 SCUTUM 643 EasyVZ 683 PHP Bu 723 Agenda 763 FreeERP 644 Postna 684 Pet 724 Compiere 764 Computer Ser 645 Picket 685 CRP 725 WSDL2XForms 765 Migration M 646 OO jDREW 686 ERPel 726 CLIGRAPH 766 Architect 647 OPEN S 687 Fuzzy Wors 727 Controle Int 767 jedi 648 RTK 688 TestCase4j 728 Compiere Ga 768 JRFramework 649 Webanizer 689 vTiger 729 SWAG 769 Open-Coman 650 Magento 690 H Plus 730 Procentro 770 MiniETL 651 DeciGen® 691 Sporkforge 731 DevEnhancer 771 OpenOps 652 Electronic 692 DACAD 732 JasperTags 772 2pack 653 Candidates 693 Jasper 733 Innovation L 773 FormatCh 654 Warehouse 694 eZimDMS 734 OpenCompiere 774 Business Proc 655 State Mach 695 Gdarim 735 Project Ar 775 wxQueries 656 Business Pr 696 Enterprise 736 GEStione 776 eSupportCenter 657 JQBridge 697 La_Azada 737 a web base hrm 777 Hotel de Java 658 TRAK 698 Gnome 738 Team Ele 778 Studienportal 659 OrangeGears 699 MvxLib 739 Gestión 779 Checklist 660 Dentax 700 henglian 740 Check Up 780 Metadata 661 AMB 701 PhpGdStock 741 Sarman 781 Jibe Frame 662 OAC 702 Open S 742 Pathfinder 782 B2B by P 663 openDigger 703 iCognition 743 TRAK 783 jOpenIT 664 Hireway 704 wizard4j 744 SPASE 784 ServiceMa 665 PICI 705 FreeDEM 745 EFF 785 Zeppelin 666 Amped Repo 706 OSSUITE 746 NetOffice 786 Smart 667 Breadboard 707 Multi Pass 747 HailStorm 787 OpenMigrate 668 J2easy 708 OpenURP 748 eBrigade 788 Top Store 669 OpenOMS 709 COBOL Da 749 Workbench 789 Chomoko 670 X Se 710 SalesLeader 750 O3-XDS 790 Protoforge 671 NARC 711 ctl-dispatch 751 Quicklogs 791 Umax 672 B.Sync 712 AnnualLeave 752 MixDEM 792 ZappWeb 673 Open Blackb 713 SBeaVeR 753 XBR 793 DropboxMQ 674 FleaIM 714 HSC 754 qnetwork 794 Toolkit e-f 675 Gestor 715 Java Da 755 Hillmaker 795 ODBIS 676 nbpm 716 tux_oracle 756 TSMtape 796 OTRS 677 Jetfire 717 Util Abanq 757 FreeOlap 797 CSTracker 678 Killtrojan 718 IRMA 758 Web Ser 798 dotii 679 car repair 719 NVBase 759 Svarog 799 MiningMart 680 ekkes-corner 720 Yelo 760 ACMS 800 Rails

141
[ID] [Title] [ID] [Title] [ID] [Title] [ID] [Title] 801 Adaptable HR 841 PDMWorksBat 881 bilin 921 W2g 802 ContactsDB 842 Mazeme inv 882 easyDE 922 Easy SOA 803 IPD&apo 843 gesmon 883 MeMo 923 SYMBOL 804 OpenAviation 844 Opacus 884 activeinsight 924 Vtiger Turk 805 MARVELit 845 Localization A 885 tbvs 925 CRMmart 806 Light W 846 CapaQuini 886 Gingkgo 926 OWB 807 Sistema 847 OpenDental 887 IT-Dep 927 AlchemySOAP 808 COS-HMS 848 Jlue 888 filofant 928 JOD S 809 EasyBI 849 Auxrames 889 OpenADM 929 Key-med 810 Gestion de 850 ZigBee 890 Merlin 930 smBackup 811 Web Li 851 Yoxel Sy 891 XMLToa 931 PyPcrm 812 PDF spli 852 FideliGes 892 BondsPric 932 Lucidium 813 TRAK 853 Business Co 893 Partystic S 933 JBELT 814 OpenTender 854 Portal Em 894 TinyERP 934 Meet#Web 815 onBI 855 MQ 895 BLAX! 935 Automated p 816 Business C 856 iceB 896 exby 936 small scale 817 RouteMe 857 NMTools 897 KS2D 937 WaterSnake 818 phpEWS 858 Userbase 898 Sure 938 SAP XI 819 Avalanche 859 SMARTDataB 899 WyattERP 939 NSIS 820 PUDI 860 QueWeb 900 BEE 940 eMarket 821 P2P sw 861 java issue 901 obsched 941 SprinxCRM 822 PlanningRH 862 Simple Statio 902 Compiere 942 ESM 823 guNa 863 TimeTrix 903 Whitebag 943 Maximo de 824 openDMS 864 Talend 904 ht 944 Cibet 825 ISP-Su 865 Postgres 8.1 905 Mambo 945 Zyuras 826 Arbeitsgruppe 866 JMrTools 906 Compiere 946 e-school 827 phpFreeLog 867 Spy 007 907 Gnu Intern 947 Kinabalu 828 Interna 868 red2 908 GOLEM 948 ScutMonkey 829 WeQuest 869 semantichrm 909 Pegasus 949 FUN 830 WFRecfgA 870 SnapLogic 910 Midas EDS 950 safety manage 831 CentraView 871 Ortro 911 Data Atlas 951 siages 832 HSC Cha 872 qb4j 912 SAFET 952 ALiVE 833 FOXOpen 873 ALTER 913 Compiere 953 adamo 834 candy 874 xanders:one 914 FeedRadar 954 monket 835 The Linux C 875 Aedilis 915 The ISSU 955 HBLA 836 Open Web 876 MyMixedPro 916 LA/OpenBP 956 GoogleCal 837 SameDesk 877 IST-Contract 917 ECONZ 957 Shared OFBiz 838 backup 878 TreeData 918 ObjeGts 958 PentahoLooker 839 Conception 879 fantastic 919 GabaSys 959 Lite Outbo 840 BPM Suite 880 pypes 920 MIND 960 GlobalCli

142
[ID] [Title] [ID] [Title] [ID] [Title] [ID] [Title] 961 B-Flow 1001 Catnip 1041 JS4J 1081 Workflow 962 AxcotoCart 1002 datablender 1042 Commius 1082 DOCS 963 DB2RDF 1003 IS Manager 1043 SQL 1083 Right F 964 OpenCSP 1004 Simulation 1044 The Hotwire 1084 Mule C 965 LSG 1005 ZuckerDocs 1045 SimpleWFS 1085 trauma-registry 966 GSi 1006 ERPBr 1046 WEB SE 1086 Main/ 967 OpenMoka 1007 Raistlin 1047 Galicia 1087 pyter 968 Sharedlog 1008 License 1048 MSQueue 1088 Lyna 969 WSRP 1009 dvrmodel 1049 FUSION 1089 OFBiz 970 ci4free 1010 UPS P 1050 uMonitor 1090 Exclusive A 971 russian-na 1011 GO 1051 Variable D 1091 XMLBridge 972 AWStats 1012 wekatransform 1052 Simpledoc 1092 911 Cal 973 Phreebooks 1013 Etailer 1053 OCF 1093 XMyStats 974 Spatial Kn 1014 Silicon F 1054 TextLine 1094 Mystic 975 Softntic 1015 Check 1055 zbierania 1095 KOSBI 976 KeoFleX 1016 The Patchy 1056 SMEG 1096 Werkplaner 977 .NET survey 1017 OpenXL 1057 {IBA} 1097 CDP&NETSEC 978 SQuirreL 1018 office ad 1058 Tibco JMS 1098 Graphical 979 JGenesis 1019 BW 1059 MyRx 1099 Sustainable 980 useGA 1020 AIRPort 1060 NEXUSe2e 1100 ActiveHealth 981 Scout Tra 1021 Webswell 1061 Jather 1101 SugarDbLib 982 dotCMS 1022 Datapture 1062 Magellan 1102 Provision 983 Le fil 1023 BlueOxygen 1063 HELIOS 1103 OpenBizMap 984 Ra Survey 1024 OWL 1064 Fat Free 1104 Valid tiny-erp 985 FreeQuery 1025 Gentoo 1065 Health I 1105 Alloc 986 DRFOX 1026 Jasper Rep 1066 Info-Gest 1106 jSemanticS 987 Wood 1027 Fastaddr 1067 Imixs 1107 ShifTracker 988 Hermine 1028 Tornado 1068 PerMoTo 1108 BMC 989 webETB 1029 Goshawk 1069 PanBI 1109 SDG 990 NextGRID 1030 smblaunch 1070 Kukki 1110 LightSpeed 991 vTiger 1031 Topic Map 1071 Bizplizit 1111 SYR<=>SPR 992 työvuorolista 1032 Ocomon 1072 red-open 1112 SPASE 993 mopore-togo 1033 Artifact 1073 sWIB 1113 SPASE 994 flexmonitor 1034 Java Serv 1074 tbvs-hr 1114 Ikasan 995 FUSION 1035 OPENCITI 1075 Cgest 1115 CrossDef 996 METAjour 1036 Gemma 1076 Spire 1116 The Collective I 997 webstat 1037 Corinis 1077 Jipes 1117 EASD@Linux 998 LDS 1038 Work2Go 1078 pose 1118 setCampaignV 999 MAX 1039 Forth Vall 1079 SunshinePHP 1119 Shine ISP 1000 VMstato 1040 facturaSCR 1080 Productor 1120 Planning Star
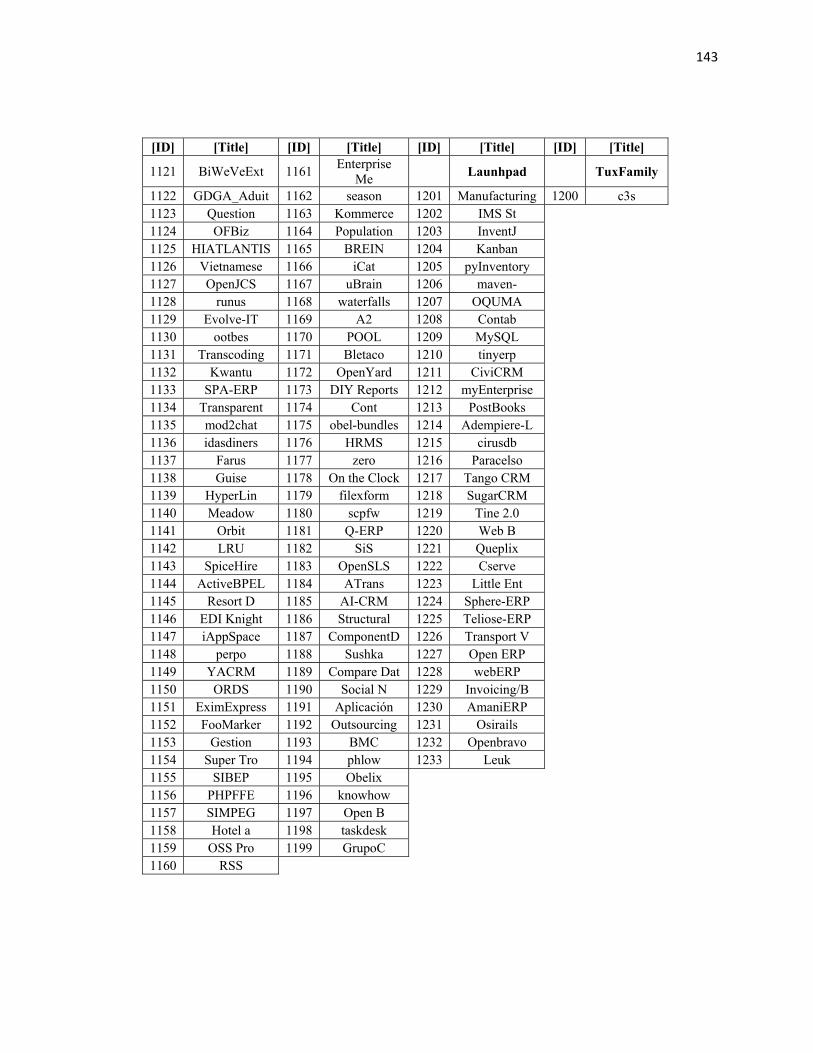
143
[ID] [Title] [ID] [Title] [ID] [Title] [ID] [Title]
1121 BiWeVeExt 1161 Enterprise Me Launhpad TuxFamily
1122 GDGA_Aduit 1162 season 1201 Manufacturing 1200 c3s 1123 Question 1163 Kommerce 1202 IMS St 1124 OFBiz 1164 Population 1203 InventJ 1125 HIATLANTIS 1165 BREIN 1204 Kanban 1126 Vietnamese 1166 iCat 1205 pyInventory 1127 OpenJCS 1167 uBrain 1206 maven- 1128 runus 1168 waterfalls 1207 OQUMA 1129 Evolve-IT 1169 A2 1208 Contab 1130 ootbes 1170 POOL 1209 MySQL 1131 Transcoding 1171 Bletaco 1210 tinyerp 1132 Kwantu 1172 OpenYard 1211 CiviCRM 1133 SPA-ERP 1173 DIY Reports 1212 myEnterprise 1134 Transparent 1174 Cont 1213 PostBooks 1135 mod2chat 1175 obel-bundles 1214 Adempiere-L 1136 idasdiners 1176 HRMS 1215 cirusdb 1137 Farus 1177 zero 1216 Paracelso 1138 Guise 1178 On the Clock 1217 Tango CRM 1139 HyperLin 1179 filexform 1218 SugarCRM 1140 Meadow 1180 scpfw 1219 Tine 2.0 1141 Orbit 1181 Q-ERP 1220 Web B 1142 LRU 1182 SiS 1221 Queplix 1143 SpiceHire 1183 OpenSLS 1222 Cserve 1144 ActiveBPEL 1184 ATrans 1223 Little Ent 1145 Resort D 1185 AI-CRM 1224 Sphere-ERP 1146 EDI Knight 1186 Structural 1225 Teliose-ERP 1147 iAppSpace 1187 ComponentD 1226 Transport V 1148 perpo 1188 Sushka 1227 Open ERP 1149 YACRM 1189 Compare Dat 1228 webERP 1150 ORDS 1190 Social N 1229 Invoicing/B 1151 EximExpress 1191 Aplicación 1230 AmaniERP 1152 FooMarker 1192 Outsourcing 1231 Osirails 1153 Gestion 1193 BMC 1232 Openbravo 1154 Super Tro 1194 phlow 1233 Leuk 1155 SIBEP 1195 Obelix 1156 PHPFFE 1196 knowhow 1157 SIMPEG 1197 Open B 1158 Hotel a 1198 taskdesk 1159 OSS Pro 1199 GrupoC 1160 RSS

144
APPENDIX D: Project Title and Description in On-line Community