Embed Size (px)
Citation preview
JOURNAL OF CLINICAL MICROBIOLOGY, Sept. 1989, p. 2008-20130095-1137/89/092008-06$02.00/0Copyright C 1989, American Society for Microbiology
Application of Quantitative Immunofluorescence to ClinicalSerology: Antibody Levels of Toxoplasma gondii
DAVID S. KAPLAN* AND GRACE L. PICCIOLO
Center for Devices and Radiological Health, Food and Drug Administration, 12200 Wilkins Avenue,Rockville, Maryland 20852
Received 18 January 1989/Accepted 30 May 1989
Methods currently used for immunofluorescent reagent standardization require subjective visual comparisonof reagents with control materials. Reactivities of reagents in immunofluorescence test kits vary frommanufacturer to manufacturer. To solve these problems, a quantitative immunofluorescence (QIF) methodwhich uses a calibrated photometric system and incorporates reducing agents into the mounting medium toreduce fading was developed to replace the visual method of endpoint determination. A uranyl glass slide wasused to calibrate the instrument's voltage measurements, permitting daily comparisons and measurement ofthe instrument reading fluctuations. The QIF method was initially tailored to the determination of serum
antibodies to Toxoplasma gondii by measuring the fluorescence intensity of individual tagged organisms. Thenonspecific fluorescence intensity resulting from the counterstain was eliminated by use of a red-suppressingfilter. The dilution-correlated polar fluorescence component was removed by subtraction of the intensity for thematching negative control dilution from each sample dilution intensity. The QIF method showed a 94%correlation with the visual comparison method for 62 clinical specimens.
Methods currently used for immunofluorescent (IF) re-
agent standardization require subjective comparison of re-
agents with control materials. Although this is a widespreadand satisfactory use in IF reagent testing, certain problemsarise that can be solved by the use of a quantitative mea-
surement system for endpoint determination. Drifting reac-
tivities of the fluorochrome-conjugated antibody could resultin conjugates with diminished abilities to distinguish positivespecimens from negative specimens. Reliance of a reader onmemory causes the endpoint to be based on a recollection ofthe brightness of the reading standard, resulting in thegrouping of intensities classified as negative or positive (1 +to 4+) rather than the assignment of a certain value. Thevariability associated with a subjective, visually determinedendpoint results from factors such as retinal sensitivity,personal biases, and variability due to the instrument andmicroscope system (i.e., filter quality, the exciting lamp, andits focusing, age, and alignment).
In an effort to improve the quality of diagnostic reagents,the Centers for Disease Control offered a voluntary reagentsevaluation program. This program, which has been abol-ished, allowed manufacturers to submit some of their prod-ucts for testing before marketing them. The current lack ofsuch a voluntary program again stresses the importance ofdeveloping a quantitative measurement system for endpointdetermination. Durham and Colvin (2) tested 112 productsfrom seven manufacturers of commercial toxoplasmosisindirect fluorescent-antibody reagents. Among the severalproblems with the kits were over- or undersensitivity of theanti-human fluorescein isothiocyanate (FITC) conjugate andover- or underreactivity of positive control sera.
In order to remove subjectivity from these tests, we
developed a microphotometric system for the quantificationof IF from tagged cells-bacterial, protozoan, and mamma-lian-by using a microscope-photometer capable of measur-
* Corresponding author.
ing the fluorescence intensity of individual organisms (6).This quantitative immunofluorescence (QIF) method is ap-plicable to both direct- and indirect-IF systems. The fluores-cence intensity is proportional to the amount of taggedantigen-antibody complex on the IF microscopy slide,which, in turn, is proportional to the antibody concentrationin the test serum (i.e., the patient's serum). For antibodies totoxoplasmosis, the endpoint or titer is defined as the highestdilution in which most of the organisms show weakly visiblefluorescence around the entire periphery of the cell. Sincethe reaction on the IF slide occurs in the dilution range inwhich proportionality between constituents occurs, thequantitative fluorescence intensity can be used as an indica-tor of the titer and the consistency of the constituents, whichare important in quality control. Thus, dependence on
subjective estimates of reactivity (reported as negative to4+) will be eliminated.Lesko et al. (8) quantified thymidine dimers in Syrian
hamster embryo cells by using fluorescently labeled mono-clonal antibodies and the QIF method. The QIF techniqueuses calibrators for daily comparisons of intensity and chem-ical additives to reduce fading (6, 9). We have used the QIFtechnique to determine serum antibody levels to Toxo-plasma gondii and Treponema pallidum and have made a
preliminary validation by using clinical specimens. Resultsrelative to T. gondii are presented here; those for Treponemapallidum, obtained by using the fluorescent treponemalantibody-absorption kit, will be presented elsewhere (G. L.Picciolo and D. S. Kaplan, manuscript in preparation).We have not attempted to develop a performance testing
method for regulatory use. However, our work does repre-sent the development of a system which can be used forendpoint determinations in performance and quality controltesting.
(This research was conducted by David S. Kaplan inpartial fulfillment of Ph.D. requirements of the Departmentof Microbiology, George Washington University, Washing-ton, D.C., 1985.)
2008
Vol. 27, No. 9
Dow
nloa
ded
from
http
s://j
ourn
als.
asm
.org
/jour
nal/j
cm o
n 31
Dec
embe
r 20
21 b
y 20
01:f
90:4
0b0:
c8d:
f44e
:680
b:ff
52:e
985.
TOXOPLASMA QUANTITATIVE IMMUNOFLUORESCENCE 2009
1.0
.75
c.5
.25
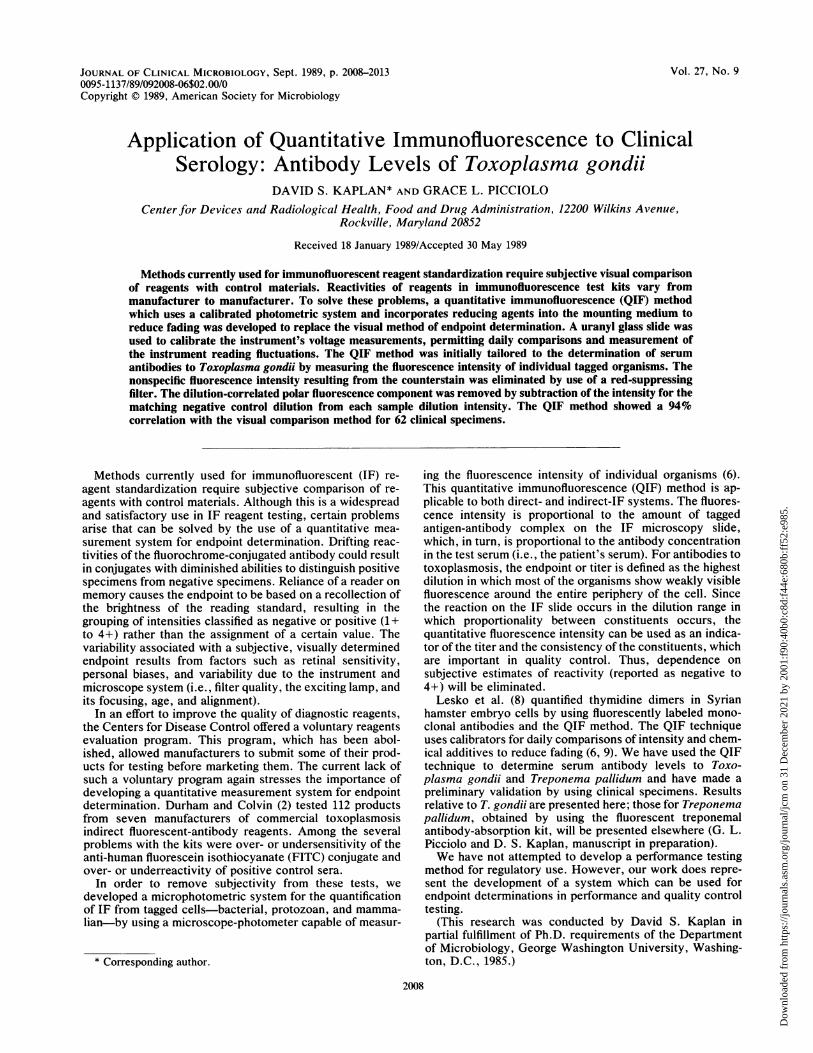
FIG. 1. Emission spiand without ( ) a KI
MATE
Instrumentation. Aeter in the emitted-lil(incident excitation)with a stabilized Dmicroprocessor, the
Excitation, barrierbinations were selecfilter had a band passplitter was FT510,bandpass LP520. Inby the counterstaininto the red region),filter was inserted iFigure 1 shows thegondii with and withThe uranyl glass
acridine orange filterof 400 to 440 nm. Th<the barrier filter wasThe photometer c(
multiplier tube (PMIface; it was powersupply. An amplifielinear interference v
tween the diaphragrpath. The emitted flua voltage displayedcathode ray tube scranging from 0.05 todown the area of thexciting light. Theprojected image of tllabeled organisms. Aarea being measureSoftware programs plight and PMT shutscanning stage.
Spectral analysis g
using the Zeiss Flulength spectrum wasknown color tempethen be used to corrlength scans taken o
Reagents. The cheiexcitation was dithiopany, St. Louis, Mo
solution in 0.5 M Tris buffer, pH 8.2 (Trizma base, catalogno. T-1503; Sigma). One part concentrated reducing agentwas added to nine parts buffered-glycerol mounting mediumsupplied with the IF kits to obtain the previously determinedoptimal final concentration (0.03 M) at pH 8.2 (9).Methods. (i) Instrument calibration. Uranyl glass, which
we had specially made into the shape of a microscope slide(catalog no. 3718; Corning Glass Works, Corning, N.Y.),was used to calibrate the microscope-photometer (6).
(ii) Preparation and measurement of T. gondii IF slides. TheIF microscopy slides from commercial kits manufactured byElectronucleonics, Inc., Columbia, Md. (ENI slides) and
440 480 520 560 600 640 680 Microbiological Research, Inc., Bountiful, Utah (MBRWavelength (nm) slides) were prepared according to each manufacturer's
directions, except that 0.03 M DTE was incorporated intoectra of FITC-labeled T. gondii with (----) the buffered-glycerol mounting medium provided with theP-560 bandpass emission filter. kit. Whenever possible, the cells were located under trans-
mitted visible light in order to prevent fading of the speci-:RIALS AND METHODS men. The high voltage and the amplifier gain to the PMT
were adjusted such that the initial intensity would be 100.Zeiss photomicroscope with a photom- The fluorescence intensities were corrected to a selectedght path was set up for epifluorescence standard high voltage of 517 V and an amplifier gain of 1,by using an HBO 100-W mercury lamp based on the statistical regression parameters of the uranyl)C power supply. Zeiss interfaced a glass slide used daily to calibrate the instrument and re-Zonax, with the microscope. ported as Corning units. The purpose of this correction wasfilters, and dichroic beam splitter com- to allow direct comparison of cell intensities independent ofted for use with FITC. The excitation high voltage and gain settings and daily lamp fluctuationss of 450 to 490 nm. The dichroic beam (D. S. Kaplan, Ph.D. dissertation, George Washington Uni-and the barrier filter was a long-wave versity, Washington, D.C., 1985).order to exclude the intensity produced A total of 67 sera, shown previously by the clinical(Evans blue, which emits from 560 nm laboratory by IF to be positive for T. gondii antibodies, werea KP-560 short-wave bandpass cutoff tested. The American Medical Laboratories, Fairfax, Va.,
nto the light path to the photometer. provided 57 of the specimens and prepared the fluorescentlyemission spectra of FITC-labeled T. labeled ENI slides. The remaining 10 sera and MBR slidesout a KP-560 bandpass emission filter. were provided by the Immunoserology Department at Theslide standard was measured with an Washington Hospital Center, Washington, D.C. The Amer-set. The excitation filter had a bandpass ican Medical Laboratories also provided 49 sera (at a 1:16e dichroic beam splitter was FT460, and dilution) from patients known to have a titer less dilute thana long-wave bandpass LP470. 8 and therefore considered negative for antibodies to T.insisted of an R928 Hamamatsu photo- gondii.[') with a multialkali photocathode sur- Serial twofold dilutions of the sera were processed and-d by a stabilized high-voltage power mounted in 0.033 M DTE-glycerol, and 30 of these sera werer was built into the PMT housing. A also mounted in glycerol alone. Three observers (D. S.edge monochromator was placed be- Kaplan, observer 1, and observer 2) visually determined then and the photomultiplier in the light endpoints of the specimens, and the photometric readingsiorescence intensity was converted into were also taken. Cells that fit completely within the 0.63-as a digital signal on the computer mm-diameter diaphragm were used. For each dilution well,
:reen. A series of variable field stops an instantaneous intensity reading was taken for each of2.5 mm in diameter were used to mask three cells.e specimen actually illuminated by the (iii) Negative controls. The kit-supplied negative controlfield stop was selected such that the was diluted from the starting dilution, 1:16, to the greatesthe field stop was slightly larger than the dilution of the serum positive for antibodies to T. gondii. ForL PMT diaphragm was used to adjust the each dilution, three cells were measured by taking instanta-d to be slightly larger than the cell. neous readings.)rovided by Zeiss controlled the incident The correlation coefficient, r, was determined between the:ters, high voltage, amplifier gain, and log2 of the dilution and the corrected intensity in Corning
units. A decreasing value for r indicates the endpoint. Inof the emitted light was performed by order to obtain a minimum 94% correlation, the quantitativeoro-Scan program. A corrected wave- titer was selected as the highest dilution in which the r valuegenerated by using a tungsten lamp of was greater than or equal to 0.94. A value of 0.94 was
rature. The reference spectrum could selected since this value is within 2 standard deviations (SD)-ect the emission spectrum of all wave- of the mean corrected intensity and improved the correlationon the microscope-photometer. with the known samples.mical agent used to reduce fading during (iv) Calculation of mean corrected intensity. After correc-erythritol (DTE) (Sigma Chemical Com- tion, the three intensity readings taken for each dilution of>.). DTE was prepared as a 0.3 M stock the negative control were averaged. The mean intensity at
VOL. 27, 1989
Dow
nloa
ded
from
http
s://j
ourn
als.
asm
.org
/jour
nal/j
cm o
n 31
Dec
embe
r 20
21 b
y 20
01:f
90:4
0b0:
c8d:
f44e
:680
b:ff
52:e
985.
2010 KAPLAN AND PICCIOLO
TABLE 1. Percentage of specimens showing a change in titer forT. gondii antibodies between DTE and no protecting agent
No. of specimens (%) with changeChange according to observer:in titera
Kaplan Observer 1
-1 2 (8) 2 (8)O 1i (44) 15 (60)1 11 (44) 8 (32)2 1 (4) 0 (0)
a The difference in the number of twofold dilutions for each sample readwith and without DTE in the mounting medium.
each dilution of the negative control was subtracted from thethree corrected intensity values at the corresponding dilutionof the sera positive for T. gondii antibodies. These valuesrepresented the true corrected intensity, less backgroundand nonspecific staining. These three values were averagedto obtain the mean corrected intensity at each dilution.
RESULTS
The effect of DTE in the mounting medium on the visuallydetermined titer is shown in Table 1. The change in titer wasdefined as the difference in the number'of twofold dilutionsfor each sample read with and without DTE in the mountingmedium. When observed by observer 1, 60% of the time thetiter was the same both with and without DTE and in no casedid the titer differ by more than one twofold dilution. Whenobserved by D. S. Kaplan, about 44% of the time the titerswere raised by one twofold dilution and only 4% of the timewas the titer raised by two twofold dilutions.The agreement in visual titer determinations on each of the
sera positive for T. gondii antibodies for each reader (ob-server 1 and observer 2) versus (arbitrarily chosen) determi-nations for Kaplan is shown in Table 2. The number oftwofold dilutions by which the titer changed is the differencebetween Kaplan's visually determined titer and the otherreaders' visually determined titer. For the samples read withDTE present in the mounting medium, no reader's titerdiffered by more than one twofold dilution from that deter-mined by the other readers. Without DTE, however, 6% ofthe titers were outside the range plus or minus one twofolddilution.The quantitatively determined titer was compared with the
visually obtained titer (by using specimens read with DTEpresent by observer 1) for each of 62 specimens by using the
TABLE 2. Agreement among three readers in visualtiter determinations of FITC-stained sera positive for
T. gondii antibodies
No. of sera (%) with changeChangein titera No DTE, DTE
observer 1b Observer l' Observer 2
-2 1 (3) 0 0-1 8 (21) 16 (37) 1 (10)O 15 (39) 22 (51) 6 (60)1 13 (34) 5 (12) 3 (30)2 1 (3) 0 0
a The difference in the number of twofold dilutions between Kaplan'svisually determined titer and that of observer 1 or observer 2.
b Specimens 1 to 6 were not measured.C Specimen 7 was not measured.
15141312il
-10Co
o03756F5-4321
0 1 2 3 4 5 6 7 8 9 10 11 12 13 14 15Log2 Dilution 0IF
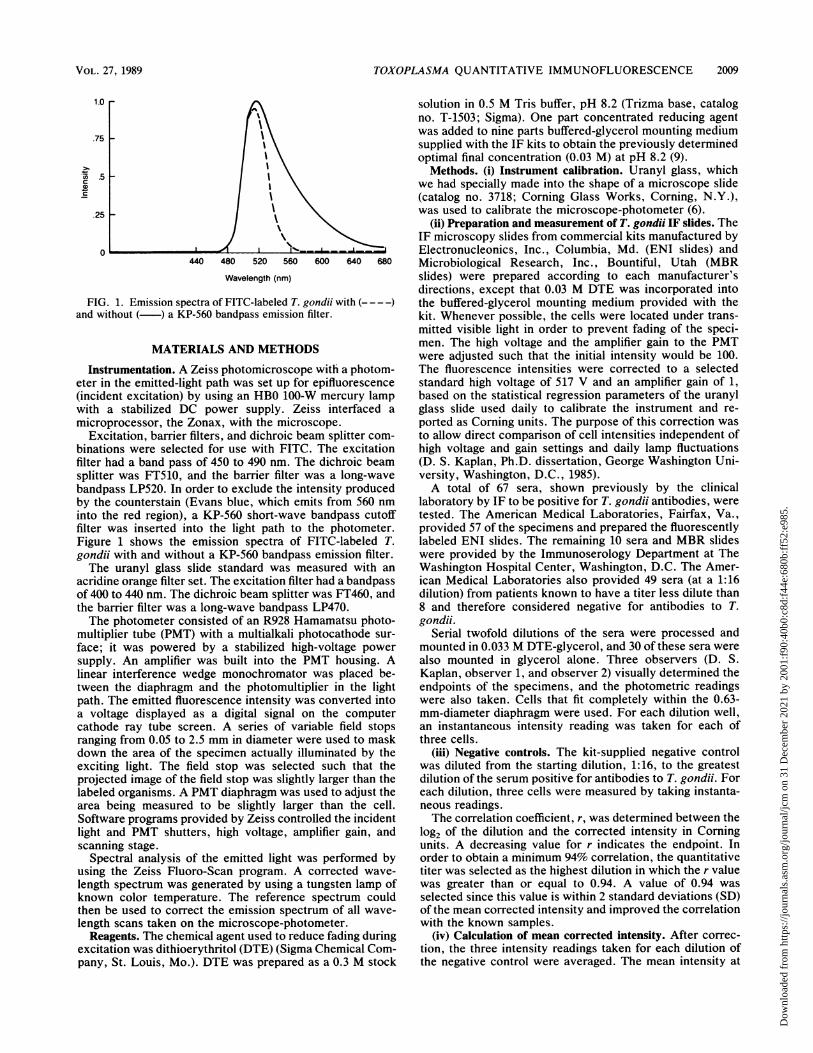
FIG. 2. Titer as determined by the visual method as read byobserver 1 plotted versus the titer as determined by the QIF methodat the 0.94 cutoff value for 62 specimens. The values are shown asthe log2 of the dilution. The numbers represent the number of datapairs at that point. The line is the fitted simple linear regression line.
established r = 0.94 cutoff to determine the titer (Fig. 2). Theresults were identical for 41 specimens, differéd by plus orminus one twofold dilution for 17 specimens, differed by plusor minus two twofold dilutions for 3 specimens, and differedby plus or minus three twofold dilutions for 1 specimen. Thecorrelation coefficient, r, was determined to be 0.9433; thestandard error of the visual method estimate (y) was 0.7957,and r2 was 0.8899. The equation for the linear regression linewas as follows: visual method estimate (y) = 1.0066 x QIFmethod (x) - 0.5548.
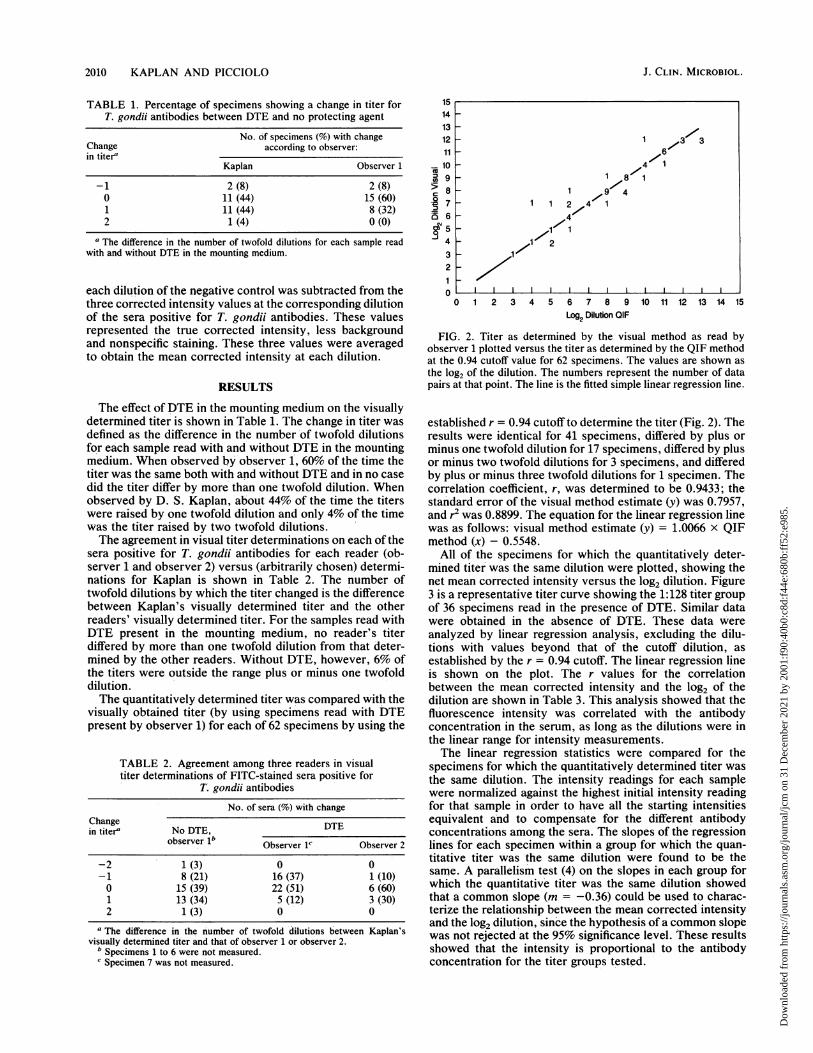
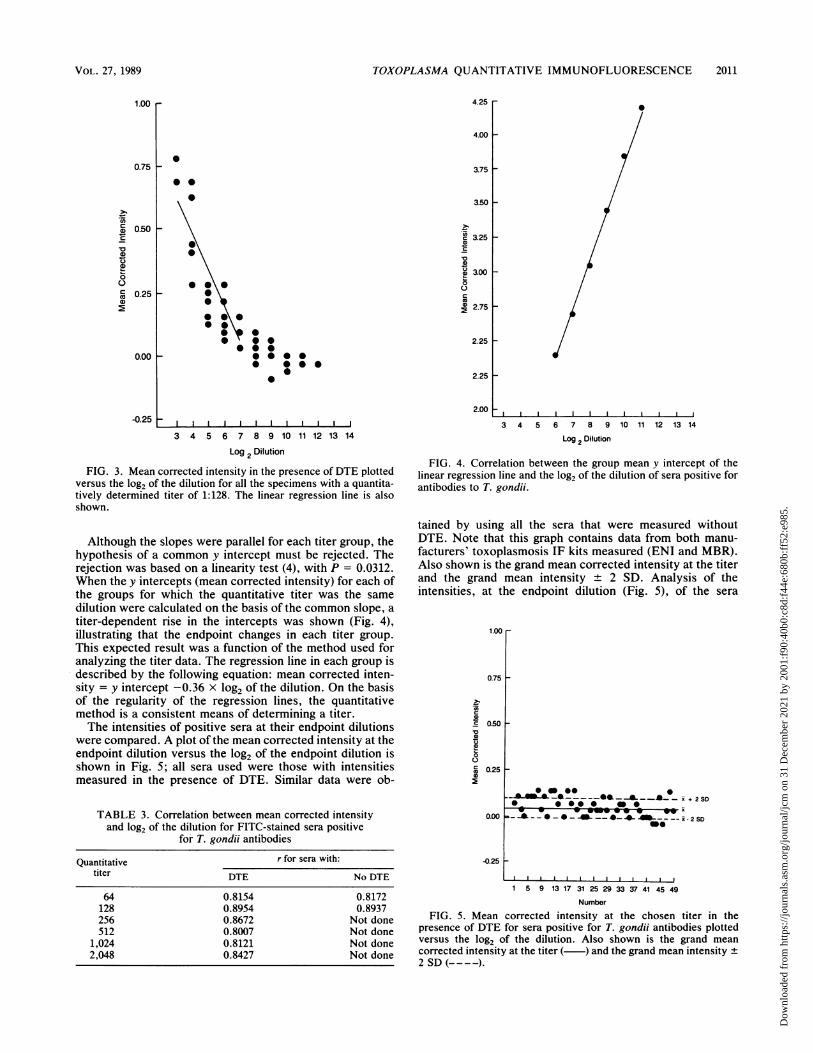
All of the specimens for which the quantitatively deter-mined titer was the same dilution were plotted, showing thenet mean corrected intensity versus the log2 dilution. Figure3 is a representative titer curve showing the 1:128 titer groupof 36 specimens read in the presence of DTE. Similar datawere obtained in the absence of DTE. These data wereanalyzed by linear regression analysis, excluding the dilu-tions with values beyond that of the cutoff dilution, asestablished by the r = 0.94 cutoff. The linear regression lineis shown on the plot. The r values 'for the correlationbetween the mean corrected intensity and the log2 of thedilution are shown in Table 3. This analysis showed that thefluorescence intensity was correlated with the antibodyconcentration in the serum, as long as the dilutions were inthe linear range for intensity measurements.The linear regression statistics were compared for the
specimens for which the quantitatively determined titer wasthe same dilution. The intensity readings for each samplewere normalized against the highest initial intensity readingfor that sample in order to have all the starting intensitiesequivalent and to compensate for the different antibodyconcentrations among the sera. The slopes of the regressionlines for each specimen within a group for which the quan-titative titer was the same dilution were found to be thesame. A parallelism test (4) on the slopes in each group forwhich the quantitative titer was the same dilution showedthat a common slope (m = -0.36) could be used to charac-terize the relationship between the mean corrected intensityand the log2 dilution, since the hypothesis of a common slopewas not rejected at the 95% significance level. These resultsshowed that the intensity is proportional to the antibodyconcentration for the titer groups tested.
J. CLIN. MICROBIOL.
Dow
nloa
ded
from
http
s://j
ourn
als.
asm
.org
/jour
nal/j
cm o
n 31
Dec
embe
r 20
21 b
y 20
01:f
90:4
0b0:
c8d:
f44e
:680
b:ff
52:e
985.
TOXOPLASMA QUANTITATIVE IMMUNOFLUORESCENCE
1.00 r
0.75 b
(OcoG,oc
CG
CD
Co
4.25 r
4.00 H
.3.75 1
* -
. 3.50 1
0.50 b
0.25 -
0.00 i-
-0.25
* *\-
e
ec 3.25
CD
3.00
C)
s 2.75.
* :e.ea
eee..ee
F
_
2.25 F
2.25 h
2.00
I I I±1 1L1ffiliL 1
3 4 5 6 7 8 9 10 11 12 13 14
Log 2 Dilution
FIG. 3. Mean corrected intensity in the presence of DTE plottedversus the log2 of the dilution for all the specimens with a quantita-tively determined titer of 1:128. The linear regression fine is alsoshown.
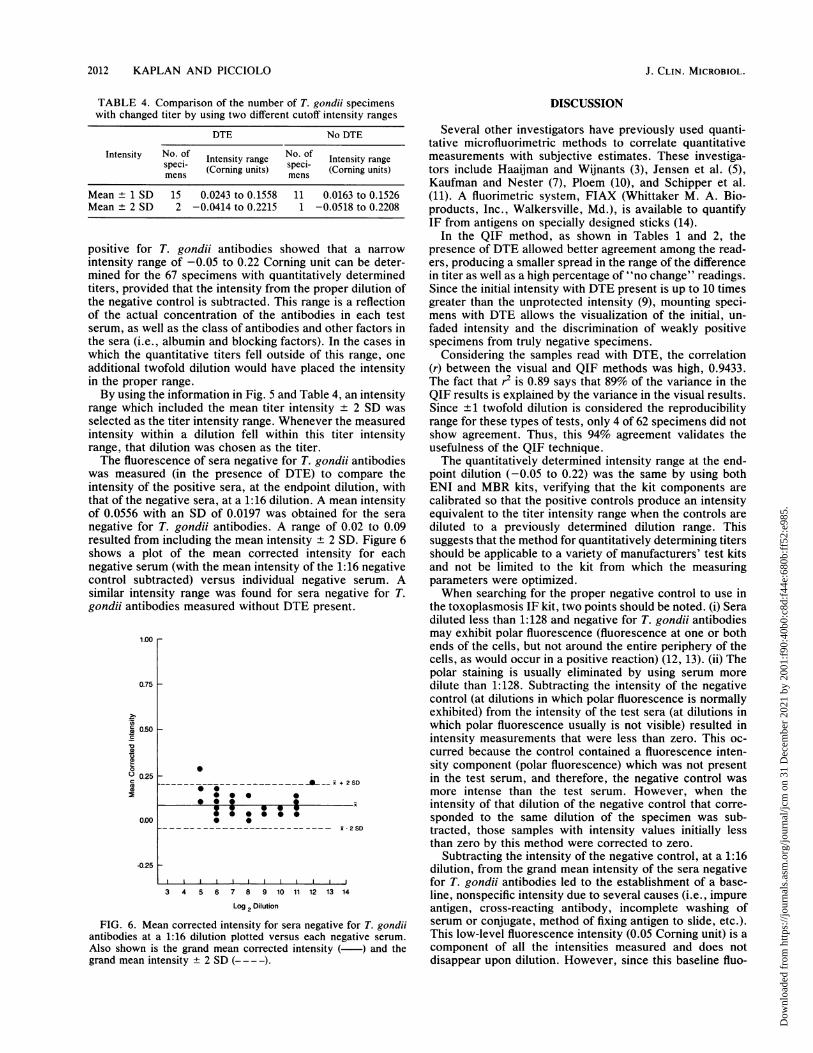
Although the slopes were parallel for each titer group, thehypothesis of a common y intercept must be rejected. Therejection was based on a linearity test (4), with P = 0.0312.When the y intercepts (mean corrected intensity) for each ofthe groups for which the quantitative titer was the samedilution were calculated on the basis of the common slope, atiter-dependent rise in the intercepts was shown (Fig. 4),illustrating that the endpoint changes in each titer group.This expected result was a function of the method used foranalyzing the titer data. The regression line in each group isdescribed by the following equation: mean corrected inten-sity = y intercept -0.36 x log2 of the dilution. On the basisof the regularity of the regression lines, the quantitativemethod is a consistent means of determining a titer.The intensities of positive sera at their endpoint dilutions
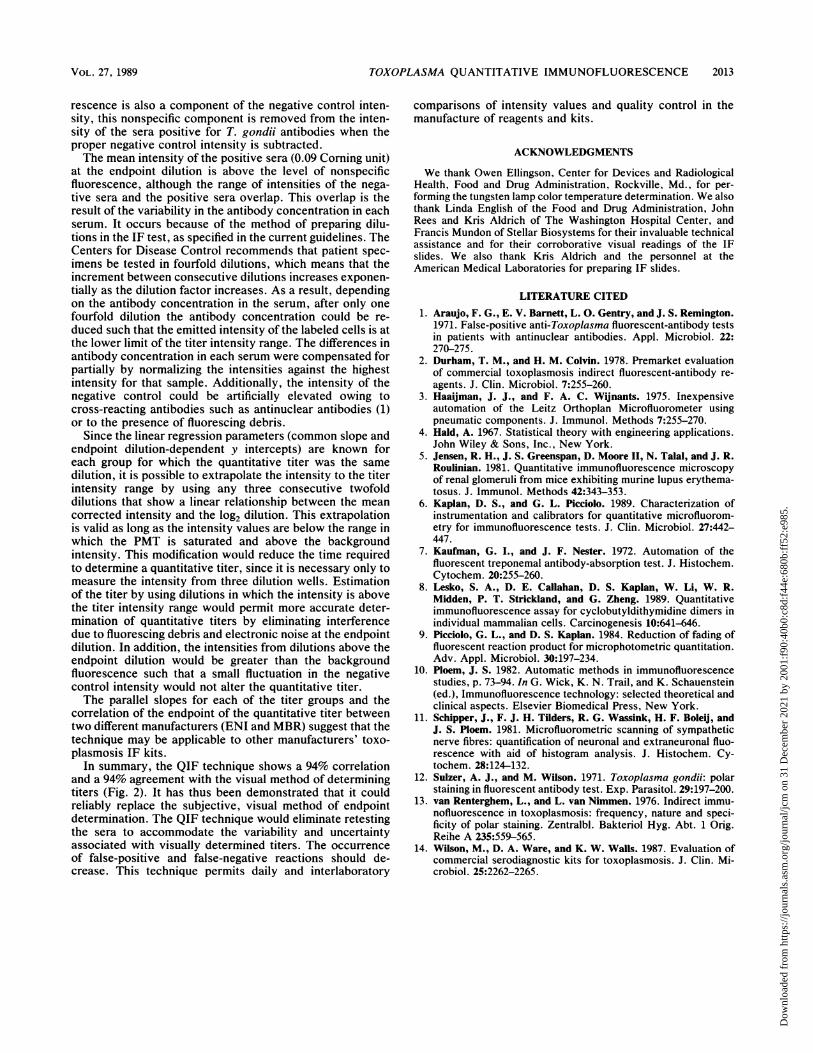
were compared. A plot of the mean corrected intensity at theendpoint dilution versus the log2 of the endpoint dilution isshown in Fig. 5; all sera used were those with intensitiesmeasured in the presence of DTE. Similar data were ob-
TABLE 3. Correlation between mean corrected intensityand log2 of the dilution for FITC-stained sera positive
for T. gondii antibodies
Quantitative r for sera with:titer DTE No DTE
64 0.8154 0.8172128 0.8954 0.8937256 0.8672 Not done512 0.8007 Not done
1,024 0.8121 Not done2,048 0.8427 Not done
I i
3 4 5 6 7 8 9 10 11 12 13 14
Log 2 Dilution
FIG. 4. Correlation between the group mean y intercept of thelinear regression line and the log2 of the dilution of sera positive forantibodies to T. gondii.
tained by using all the sera that were measured withoutDTE. Note that this graph contains data from both manu-facturers' toxoplasmosis IF kits measured (ENI and MBR).Also shown is the grand mean corrected intensity at the titerand the grand mean intensity + 2 SD. Analysis of theintensities, at the endpoint dilution (Fig. 5), of the sera
1.00 r0.75 F
0o50r-
ID
O
cJ0.25 _
0.00
-0.25
__*______z*_ ^ __*_- x + 2 SD~~~~~ X__ I*_&- -I - -i - 2 SD
0 0 O.."o 0 ID 40~~~~~~~~~~~~~~~~~~~
1 5 9 13 17 31 25 29 33 37 41 45 49
Number
FIG. 5. Mean corrected intensity at the chosen titer in thepresence of DTE for sera positive for T. gondii antibodies plottedversus the log2 of the dilution. Also shown is the grand meancorrected intensity at the titer ( ) and the grand mean intensity +2 SD (- - - -).
VOL. 27, 1989 2011
Dow
nloa
ded
from
http
s://j
ourn
als.
asm
.org
/jour
nal/j
cm o
n 31
Dec
embe
r 20
21 b
y 20
01:f
90:4
0b0:
c8d:
f44e
:680
b:ff
52:e
985.
2012 KAPLAN AND PICCIOLO
TABLE 4. Comparison of the number of T. gondii specimenswith changed titer by using two different cutoff intensity ranges
DTE No DTE
Intensity No. of Intensity range No.of Intensity rangespeci- (Corning units) speci- (Corning units)mens mens
Mean ± 1 SD 15 0.0243 to 0.1558 11 0.0163 to 0.1526Mean ± 2 SD 2 -0.0414 to 0.2215 1 -0.0518 to 0.2208
positive for T. gondii antibodies showed that a narrowintensity range of -0.05 to 0.22 Corning unit can be deter-mined for the 67 specimens with quantitatively determinedtiters, provided that the intensity from the proper dilution ofthe negative control is subtracted. This range is a reflectionof the actual concentration of the antibodies in each testserum, as well as the class of antibodies and other factors inthe sera (i.e., albumin and blocking factors). In the cases inwhich the quantitative titers fell outside of this range, oneadditional twofold dilution would have placed the intensityin the proper range.By using the information in Fig. 5 and Table 4, an intensity
range which included the mean titer intensity + 2 SD wasselected as the titer intensity range. Whenever the measuredintensity within a dilution fell within this titer intensityrange, that dilution was chosen as the titer.The fluorescence of sera negative for T. gondii antibodies
was measured (in the presence of DTE) to compare theintensity of the positive sera, at the endpoint dilution, withthat of the negative sera, at a 1:16 dilution. A mean intensityof 0.0556 with an SD of 0.0197 was obtained for the sera
negative for T. gondii antibodies. A range of 0.02 to 0.09resulted from including the mean intensity ± 2 SD. Figure 6shows a plot of the mean corrected intensity for eachnegative serum (with the mean intensity of the 1:16 negativecontrol subtracted) versus individual negative serum. Asimilar intensity range was found for sera negative for T.gondii antibodies measured without DTE present.
1.00 r
0.75 r
ae 0.50r-
0.25
0.00
-0.25
.._-_ _ _ _________ __ i + 2S0* 0
*.
---2SD
3 4 5 6 7 8 9 10 11 12 13 14
Log 2 Dilution
FIG. 6. Mean corrected intensity for sera negative for T. gondiiantibodies at a 1:16 dilution plotted versus each negative serum.Also shown is the grand mean corrected intensity ( ) and thegrand mean intensity ± 2 SD (-- -).
DISCUSSION
Several other investigators have previously used quanti-tative microfluorimetric methods to correlate quantitativemeasurements with subjective estimates. These investiga-tors include Haaijman and Wijnants (3), Jensen et al. (5),Kaufman and Nester (7), Ploem (10), and Schipper et al.(11). A fluorimetric system, FIAX (Whittaker M. A. Bio-products, Inc., Walkersville, Md.), is available to quantifyIF from antigens on specially designed sticks (14).
In the QIF method, as shown in Tables 1 and 2, thepresence of DTE allowed better agreement among the read-ers, producing a smaller spread in the range of the differencein titer as well as a high percentage of "no change" readings.Since the initial intensity with DTE present is up to 10 timesgreater than the unprotected intensity (9), mounting speci-mens with DTE allows the visualization of the initial, un-faded intensity and the discrimination of weakly positivespecimens from truly negative specimens.
Considering the samples read with DTE, the correlation(r) between the visual and QIF methods was high, 0.9433.The fact that r2 is 0.89 says that 89% of the variance in theQIF results is explained by the variance in the visual results.Since ±1 twofold dilution is considered the reproducibilityrange for these types of tests, only 4 of 62 specimens did notshow agreement. Thus, this 94% agreement validates theusefulness of the QIF technique.The quantitatively determined intensity range at the end-
point dilution (-0.05 to 0.22) was the same by using bothENI and MBR kits, verifying that the kit components arecalibrated so that the positive controls produce an intensityequivalent to the titer intensity range when the controls arediluted to a previously determined dilution range. Thissuggests that the method for quantitatively determining titersshould be applicable to a variety of manufacturers' test kitsand not be limited to the kit from which the measuringparameters were optimized.When searching for the proper negative control to use in
the toxoplasmosis IF kit, two points should be noted. (i) Seradiluted less than 1:128 and negative for T. gondii antibodiesmay exhibit polar fluorescence (fluorescence at one or bothends of the cells, but not around the entire periphery of thecells, as would occur in a positive reaction) (12, 13). (ii) Thepolar staining is usually eliminated by using serum moredilute than 1:128. Subtracting the intensity of the negativecontrol (at dilutions in which polar fluorescence is normallyexhibited) from the intensity of the test sera (at dilutions inwhich polar fluorescence usually is not visible) resulted inintensity measurements that were less than zero. This oc-curred because the control contained a fluorescence inten-sity component (polar fluorescence) which was not presentin the test serum, and therefore, the negative control wasmore intense than the test serum. However, when theintensity of that dilution of the negative control that corre-sponded to the same dilution of the specimen was sub-tracted, those samples with intensity values initially lessthan zero by this method were corrected to zero.
Subtracting the intensity of the negative control, at a 1:16dilution, from the grand mean intensity of the sera negativefor T. gondii antibodies led to the establishment of a base-line, nonspecific intensity due to several causes (i.e., impureantigen, cross-reacting antibody, incomplete washing ofserum or conjugate, method of fixing antigen to slide, etc.).This low-level fluorescence intensity (0.05 Corning unit) is acomponent of all the intensities measured and does notdisappear upon dilution. However, since this baseline fluo-
J. CLIN. MICROBIOL.
Dow
nloa
ded
from
http
s://j
ourn
als.
asm
.org
/jour
nal/j
cm o
n 31
Dec
embe
r 20
21 b
y 20
01:f
90:4
0b0:
c8d:
f44e
:680
b:ff
52:e
985.
TOXOPLASMA QUANTITATIVE IMMUNOFLUORESCENCE 2013
rescence is also a component of the negative control inten-sity, this nonspecific component is removed from the inten-sity of the sera positive for T. gondii antibodies when theproper negative control intensity is subtracted.The mean intensity of the positive sera (0.09 Corning unit)
at the endpoint dilution is above the level of nonspecificfluorescence, although the range of intensities of the nega-tive sera and the positive sera overlap. This overlap is theresult of the variability in the antibody concentration in eachserum. It occurs because of the method of preparing dilu-tions in the IF test, as specified in the current guidelines. TheCenters for Disease Control recommends that patient spec-imens be tested in fourfold dilutions, which means that theincrement between consecutive dilutions increases exponen-tially as the dilution factor increases. As a result, dependingon the antibody concentration in the serum, after only onefourfold dilution the antibody concentration could be re-duced such that the emitted intensity of the labeled cells is atthe lower limit of the titer intensity range. The differences inantibody concentration in each serum were compensated forpartially by normalizing the intensities against the highestintensity for that sample. Additionally, the intensity of thenegative control could be artificially elevated owing tocross-reacting antibodies such as antinuclear antibodies (1)or to the presence of fluorescing debris.
Since the linear regression parameters (common slope andendpoint dilution-dependent y intercepts) are known foreach group for which the quantitative titer was the samedilution, it is possible to extrapolate the intensity to the titerintensity range by using any three consecutive twofolddilutions that show a linear relationship between the meancorrected intensity and the log2 dilution. This extrapolationis valid as long as the intensity values are below the range inwhich the PMT is saturated and above the backgroundintensity. This modification would reduce the time requiredto determine a quantitative titer, since it is necessary only tomeasure the intensity from three dilution wells. Estimationof the titer by using dilutions in which the intensity is abovethe titer intensity range would permit more accurate deter-mination of quantitative titers by eliminating interferencedue to fluorescing debris and electronic noise at the endpointdilution. In addition, the intensities from dilutions above theendpoint dilution would be greater than the backgroundfluorescence such that a small fluctuation in the negativecontrol intensity would not alter the quantitative titer.The parallel slopes for each of the titer groups and the
correlation of the endpoint of the quantitative titer betweentwo different manufacturers (ENI and MBR) suggest that thetechnique may be applicable to other manufacturers' toxo-plasmosis IF kits.
In summary, the QIF technique shows a 94% correlationand a 94% agreement with the visual method of determiningtiters (Fig. 2). It has thus been demonstrated that it couldreliably replace the subjective, visual method of endpointdetermination. The QIF technique would eliminate retestingthe sera to accommodate the variability and uncertaintyassociated with visually determined titers. The occurrenceof false-positive and false-negative reactions should de-crease. This technique permits daily and interlaboratory
comparisons of intensity values and quality control in themanufacture of reagents and kits.
ACKNOWLEDGMENTS
We thank Owen Ellingson, Center for Devices and RadiologicalHealth, Food and Drug Administration, Rockville, Md., for per-forming the tungsten lamp color temperature determination. We alsothank Linda English of the Food and Drug Administration, JohnRees and Kris Aldrich of The Washington Hospital Center, andFrancis Mundon of Stellar Biosystems for their invaluable technicalassistance and for their corroborative visual readings of the IFslides. We also thank Kris Aldrich and the personnel at theAmerican Medical Laboratories for preparing IF slides.
LITERATURE CITED1. Araujo, F. G., E. V. Barnett, L. O. Gentry, and J. S. Remington.
1971. False-positive anti-Toxoplasma fluorescent-antibody testsin patients with antinuclear antibodies. Apple. Microbiol. 22:270-275.
2. Durham, T. M., and H. M. Colvin. 1978. Premarket evaluationof commercial toxoplasmosis indirect fluorescent-antibody re-agents. J. Clin. Microbiol. 7:255-260.
3. Haaijman, J. J., and F. A. C. Wijnants. 1975. Inexpensiveautomation of the Leitz Orthoplan Microfluorometer usingpneumatic components. J. Immunol. Methods 7:255-270.
4. Hald, A. 1967. Statistical theory with engineering applications.John Wiley & Sons, Inc., New York.
5. Jensen, R. H., J. S. Greenspan, D. Moore II, N. Talal, and J. R.Roulinian. 1981. Quantitative immunofluorescence microscopyof renal glomeruli from mice exhibiting murine lupus erythema-tosus. J. Immunol. Methods 42:343-353.
6. Kaplan, D. S., and G. L. Picciolo. 1989. Characterization ofinstrumentation and calibrators for quantitative microfluorom-etry for immunofluorescence tests. J. Clin. Microbiol. 27:442-447.
7. Kaufman, G. I., and J. F. Nester. 1972. Automation of thefluorescent treponemal antibody-absorption test. J. Histochem.Cytochem. 20:255-260.
8. Lesko, S. A., D. E. Callahan, D. S. Kaplan, W. Li, W. R.Midden, P. T. Strickland, and G. Zheng. 1989. Quantitativeimmunofluorescence assay for cyclobutyldithymidine dimers inindividual mammalian cells. Carcinogenesis 10:641-646.
9. Picciolo, G. L., and D. S. Kaplan. 1984. Reduction of fading offluorescent reaction product for microphotometric quantitation.Adv. Apple. Microbiol. 30:197-234.
10. Ploem, J. S. 1982. Automatic methods in immunofluorescencestudies, p. 73-94. In G. Wick, K. N. Trail, and K. Schauenstein(ed.), Immunofluorescence technology: selected theoretical andclinical aspects. Elsevier Biomedical Press, New York.
11. Shipper, J., F. J. H. Tilders, R. G. Wassink, H. F. Boleij, andJ. S. Ploem. 1981. Microfluorometric scanning of sympatheticnerve fibres: quantification of neuronal and extraneuronal fluo-rescence with aid of histogram analysis. J. Histochem. Cy-tochem. 28:124-132.
12. Sulzer, A. J., and M. Wilson. 1971. Toxoplasma gondii: polarstaining in fluorescent antibody test. Exp. Parasitol. 29:197-200.
13. van Renterghem, L., and L. van Nimmen. 1976. Indirect immu-nofluorescence in toxoplasmosis: frequency, nature and speci-ficity of polar staining. Zentralbl. Bakteriol Hyg. Abt. 1 Orig.Reihe A 235:559-565.
14. Wilson, M., D. A. Ware, and K. W. Walls. 1987. Evaluation ofcommercial serodiagnostic kits for toxoplasmosis. J. Clin. Mi-crobiol. 25:2262-2265.
VOL. 27, 1989
Dow
nloa
ded
from
http
s://j
ourn
als.
asm
.org
/jour
nal/j
cm o
n 31
Dec
embe
r 20
21 b
y 20
01:f
90:4
0b0:
c8d:
f44e
:680
b:ff
52:e
985.