Embed Size (px)
Citation preview

International Journal on Electrical Engineering and Informatics - Volume 8, Number 4, December 2016
Application of TCSC in Enhancing Dynamic Performance of
Interconnected Multimachine Power System
Rudy Gianto
Department of Electrical Engineering, Tanjungpura University, Indonesia
Abstract: TCSCs (Thyristor Controlled Series Capacitors) have been used by many modern
electric power system utilities for regulating power flow and increasing power transfer
capability. The ability in regulating the transmittable power flow also implies the potential
application of the device for the improvement of system stability and dynamic performance.
The research reported in this paper investigates the application of TCSC in improving dynamic
performance of large interconnected electric power system. Simulation results show that the
TCSC provides better system stability and dynamic performance. The results have also been
verified through eigenvalues analysis and confirmed by time-domain simulations.
Keywords: TCSC, FACTS, system stability, dynamic performance, power system.
1. Introduction
Maintaining good dynamic performance or system stability of an electric power system is
necessary for secure system operation. An unstable power system will cause loss of
synchronism of the interconnected synchronous generators in the system. This situation leads
to a dangerous system operation where some of the generators are unable to keep running in
parallel and will be separated from the system. If the remaining connected generators are not
capable of meeting the load demand, large-scale interruptions of services may occur and in turn
they will cause system collapse.
Traditionally, power system stability has been improved by using PSS (Power System
Stabilizer). PSS has been used for many years to enhance system dynamic performance.
However, the use of PSS may not be, in some cases, effective in improving system stability,
particularly with increasing transmission line loading over long distances [1, 2]. In such cases,
other effective alternatives are needed in addition to PSS.
Nowadays, many modern power systems have been equipped with FACTS (Flexible AC
Transmission System) devices. The primary purpose of these devices is to control voltage and
active- and/or reactive-power flow in the transmission system. However, by using
supplementary controller, it is expected to obtain the devices secondary function of improving
system stability and dynamic performance [3, 4]. This supplementary damping controller
(SDC) is augmented with FACTS devices main control systems, and often referred to as
FACTS device stabilizer (FDS).
TCSC is the second generation of FACTS devices. TCSC uses power electronics devices to
control capacitor bank connected in series with transmission line [5]. It is equivalent to a
controllable reactance inserted in series with a line to compensate the effect of the line
inductance. The net transfer reactance is reduced and leads to an increase in power transfer
capability. The voltage profiles are also improved due to the insertion of series capacitance in
the line. The TCSC capability in controlling transmittable power also implies the potential
application of the device for the enhancement of system stability and dynamic performance.
The application of TCSC in power system stability improvement has been investigated by
several researchers. Recent results can be found in [6-10]. In [6-9], TCSC was used to enhance
the stability of small power systems. Although, the TCSC has been successfully applied to
enhance stability of small power systems, its performance, however, on larger interconnected
multi-machine power systems is still unclear. In [10], an optimization algorithm-based fuzzy
adaptive bacterial foraging (FAFB) has been used to design the PSS and TCSC for damping
Received: January 3rd
, 2016. Accepted: December 7th
, 2016
DOI: 10.15676/ijeei.2016.8.4.7
788

the low frequency oscillations of the power system. However, the investigation results reported
in the paper were not very convincing since the eigenvalue analysis was not used to confirm
the results.
A general design method or procedure has been proposed in [11-13] for optimal control
coordination amongst PSSs and FACTS devices. In the method, the eigenvalue-eigenvector
equations are used as a set of equality constraints in the optimization by which the controllers
parameters are determined, and optimal dampings of the specified electromechanical modes are
achieved. The method has been developed in the context of, and applied to small power
systems. In the investigation, the effectiveness of the method in designing controllers that
guarantee and improve power system dynamic performance has been confirmed.
Therefore, against the above background, the objective of the present paper is to extend the
investigation to larger interconnected multi-machine electric power systems. Specifically, the
main contributions of the present paper can be described as follows: (i) development of general
mathematical model of multi-TCSC in multimachine power system environment for stability
studies. By using the mathematical formulation proposed, any number of TCSCs (installed in
any lines) can be modeled without difficulty. Also it can be applied to any size of power
system; (ii) application and extension of the method for control coordination of PSSs and
FACTS devices proposed in [11-13] to large multimachine power system, with a particular
reference to the enhancement of interarea mode damping. The performance of FACTS device
in improving system stability and dynamic performance is validated by eigenvalues analysis
and time-domain simulations of the power system.
2. Power System Dynamic Model
In the context of power system stability, the system dynamic responses derive from the
rotating machines (including their controllers) and FACTS devices which are interconnected
by the network. On this basis, the dynamic modeling required for the study related to dynamic
performance has two main aspects to be considered: the first is that of the modeling of
individual components of power systems, and the second the overall system model where their
interconnection is represented.
In general, the differential/algebraic equations derived from the system models are
nonlinear. In preparation for the stability study, the individual power system component
equations can be linearized about a specified operating point. Given the frequency range
encountered in the stability study, the network which has the function of interconnecting the
above items of system component will be modeled in a static form which combines the
network with other items of power system in forming the overall system model.
A. Synchronous Machine Model
In this paper, the synchronous machine is represented by the fifth-order model in the d-q
axes having the rotor frame of reference [14]:
rSmrmr VIFΨAΨ
(1)
MPPω emr/
(2)
Rrr ωωδ
(3)
where Ψr , ωr , and δr are rotor flux linkage vector, rotor angular frequency and rotor angle
respectively; Tfdr 00EV is the rotor voltage vector; Pm and Pe are the mechanical and
electrical powers respectively; M is calculated from RH2M / (H is the machine inertia
constant and ωR is the synchronous speed); Am and Fm are the matrices depending on machine
parameters; IS is the stator current vector, and Efd is the field voltage. The transients in the rotor
Rudy Gianto
789

fluxes set up by the field winding, and damper windings on the d and q axes are represented in
the model.
Electrical power Pe in (2) can be expressed in terms of generator current as follows:
rmsmeP ΨCIB (4)
where:
mTsrmm
Tsrm SICGIB ; (5)
Given the low frequency encountered in electromechanical transients, and to be consistent
with the network model in a static form, the stator flux transients are discounted. With the
stator flux linkage in a non-transient form, the relationship between the stator current vector Is
and the stator voltage vector Vs can be represented by the following algebraic equation:
smrms IZΨPV (6)
In (5) and (6), Gm, Sm, Pm and Zm are the matrices depending on machine parameters and
rotor angular frequency.
B. Excitation and Prime Mover Model
A wide range of block diagrams for modeling various types of excitation systems and
prime-mover controllers have been developed by the IEEE [15, 16]. Irrespective of the control
block diagram, the first-order differential equation set for describing the excitation system
dynamics can be arranged in the following form:
refsePSSeseeee VVV DBCxAx
(7)
where ex is the state vector for the excitation system; Vs is the synchronous machine terminal
voltage; VPSS is the supplementary signal from the PSS; refsV is the voltage reference; Ae, Be,
Ce and De are matrices of constant values which depend on the gains and time constants of the
controller.
The system dynamics of the prime-mover controller can also be represented by the set of
first-order differential equation as follows:
0mg
refgrgggg PDBCxAx
(8)
where gx is the state vector for the prime-mover controller; ref
is the speed reference; 0mP
is the initial power; Ag, Cg, Bg and Dg are matrices of constant values which depend on the
gains and time constants of the controller.
C. PSS Model
Figure 1. PSS control block diagram
Figure 1 shows the general structure of a PSS [17] which is adopted in this paper. The
structure consists of a gain block, a washout, lead-lag blocks and a limiter. A washout
term/filter (i.e. with a time derivative operator) in the PSS structure is needed to guarantee that
XP2 XP1
VPSS,min
VPSS,max
VPSS r
PSS
PSS
sT1
sT
PSSK
2PSS
1PSS
sT1
sT1
4PSS
3PSS
sT1
sT1
Application of TCSC in Enhancing Dynamic Performance
790
Pref
xPF Xt
+ PT
-
Xt,min.
Supplementary signal (XSDC)
Xt,max
+ - t
t
sT1
K
Σ
F
FF
sT
)sT1(K
Σ
the PSS responds only to disturbances, and does not respond to any steady-state condition,
when speed or power is input. Here, the rotor speed is used for the PSS input. The PSS output
is added to the exciter voltage error signal and served as a supplementary signal.
The state equation derived by examining the PSS transfer functions can be arranged in the
following form:
rpppp
CxAx (9)
where TPSS2P1Pp Vxxx is the vector of state variables of the PSS; Ap and Cp are
matrices the elements of which depend on the gains and time constants of the PSS controllers.
D. TCSC and Supplementary Controller Model
In Figure 2 is shown in a block diagram form the control system of a TCSC [6, 18] used in
the present work. In Figure 2, Xt is the reactance of TCSC. The TCSC control block diagram
contains Proportional-Integral (PI) controller block and the block that represents the TCSC
thyristor firing delays. The PI block is the TCSC main controller. The power flow control is
usually implemented with a slow controller which is typical for a PI controller with a large
time constant. For stability improvement purpose, a supplementary signal (XSDC) derived from
a separate controller is input to the main controller as shown in Figure 2. The state equations
for the TCSC main control system can be arranged as follows:
reftTtTtSDCtttt PPPX EDCBxAx
(10)
where TtPFt Xxx is the state vector for the TCSC main control system; At, Bt, Ct, Dt
and Et are matrices the elements of which depend on the gains and time constants of the
controllers.
Figure 2. Control block diagram of TCSC
Dynamic performance improvement with FACTS devices is effected through power
modulation by a supplementary damping controller (SDC). Figure 3 shows the control block
diagram used in the present work [12, 13].
Figure 3. Supplementary control block diagram
XS2 XS1
XSDC,min
XSDC,max
XSDC PT
SDC
SDC
sT1
sT
SDCK
2SDC
1SDC
sT1
sT1
4SDC
3SDC
sT1
sT1
Rudy Gianto
791
The state equation for the supplementary controller can be written in compact form as
follows:
Tsusususu P
CxAx (11)
where TSDC2s1ssu Xxxx is the vector of state variables of the supplementary
controller; Asu and Csu are matrices the elements of which depend on the gains and time
constants of the controller.
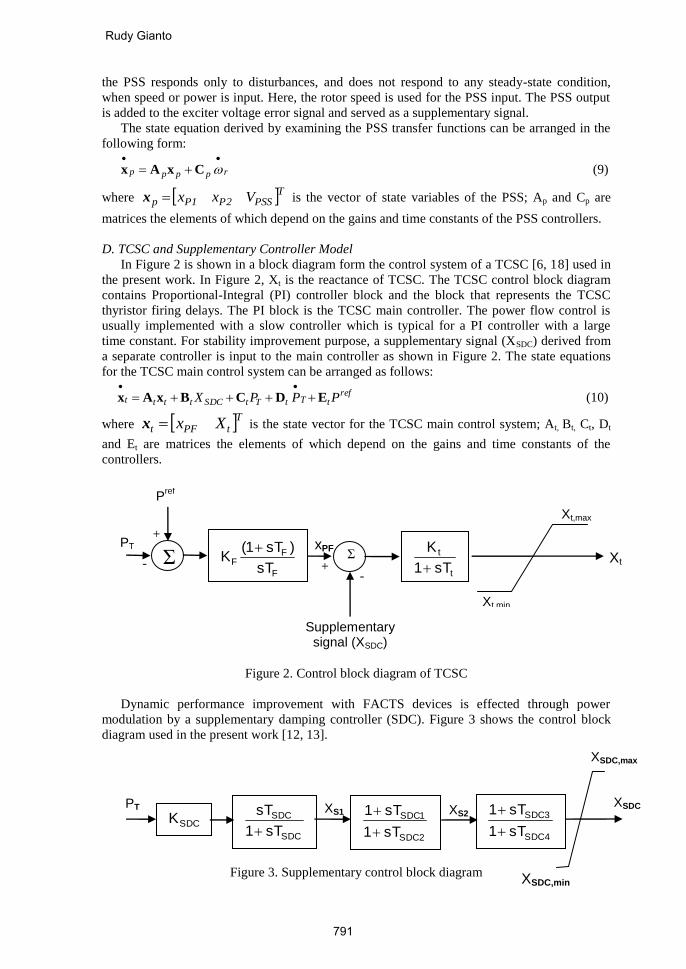
D. Multi-Machine Power System Network Model
Figure 4 shows an NB-node power system considered in this paper. It is to be assumed that
NG generators are connected to the power system. The network nodal current vector I and
nodal voltage vector V for the system are related by:
YVI (12)
where Y is the system admittance matrix.
Figure 4. Multi-machine power system
All of the quantities in (12) are, in general, complex numbers. Separating (12) into real and
imaginary parts and rearranging, leads to the following equation where all of the vector/matrix
coefficients are real:
NNN VYI (13)
where:
TNBNBN
TNBNBN
VimVreVimVreVimVre
IimIreIimIreIimIre
2211
2211
V
I (14)
and:
IS,NG
IS2
IS1
VS,NG
VS2
VS1
GNG
G2
G1
Network System
(NB-NG nodes)
Application of TCSC in Enhancing Dynamic Performance
792

NBNBNBNBNBNBNBNB
NBNBNBNBNBNBNBNB
NBNB
NBNB
NBNB
NBNB
YreYimYreYimYreYim
YimYreYimYreYimYre
YreYimYreYimYreYim
YimYreYimYreYimYre
YreYimYreYimYreYim
YimYreYimYreYimYre
,,2,2,1,1,
,,2,2,1,1,
,2,222222121
,2,222222121
,1,112121111
,1,112121111
N
Y
(15)
In (12), the static loads of constant admittance form and fixed form of reactive power
compensation are included in the system admittance matrix. In this way, the nodal currents in
vector I are non-zero only at generator nodes. Therefore, (12) can be partitioned as follows:
LN
SN
LLLS
SLSS
LN
SN
V
V
YY
YY
0I
I
(16)
where:
S: set of generator nodes
L: set of non-generator nodes
ISN, VSN: vectors of network nodal currents and voltages at generator nodes respectively
VLN: vector of nodal voltages at the remaining nodes in the system
YSS, YSL, YLS and YLL: submatrices from partitioning of Y matrix
Based on (16), the following equations are obtained:
LNSLSNSSSN VYVYI (17)
LNLLSNLS VYVY0 (18)
The nodal voltage vector VSN and nodal current vector ISN in (17) and (18) are in the
network D-Q frame of reference. By transforming the variables VSN and ISN into their
corresponding d-q components (VsM and IsM) using frame of reference transformation, (17) and
(18) become:
LNSLsMMSSsMM VYVTYIT (19)
LNLLsMMLS VYVTY0 (20)
where:
NGM diag ,21 ,,, TTTT (21)
It can be seen from the discussion that the network model for multi-machine power system
is described by two sets of algebraic equations (19) and (20). It is also to be noted that the
algebraic (non-state) variables of the network model of the system are VsM, IsM and VLN.
Rudy Gianto
793

E. Model of Multi-Machine Power System with TCSCs
Figure 5 shows a multi-machine power system installed with TCSCs. In order to illustrate
the mathematical formulation for modeling the power system network, it is to be assumed that
the TCSCs are installed as shown in Figure 5. In Figure 5, NT is the number of TCSCs.
In D-Q frame of reference and partitioned form, the network model for the multi-machine
power system installed with TCSCs can be described by:
LN
SN
FTLLLS
SLSS
LN
SN
V
V
YYY
YY
0I
I
(22)
The submatrix YFT in (22) has the same dimension as submatrix YLL and is given by:
(23)
Based on (22), the following equation is obtained:
LNFSLLSNLS VYYVY0 (24)
Transforming the variable VSN in (24) into VsM leads to:
LNFSLLsMMLS VYYVTY0 (25)
LNB
Lv2
Lv1
LNG+1
LNG+
1 Lx1 Lx2 LNB
22
22
11
11
22
22
11
11
tt
tt
tt
tt
tt
tt
tt
tt
YY
YY
YY
YY
YY
YY
YY
YY
FTY
Lv1 Lv2
Lx2
Lx1
Application of TCSC in Enhancing Dynamic Performance
794

The above discussion shows that the network model for multi-machine power system
installed with TCSCs can be described by two sets of algebraic equations (18) and (25). It is
also to be noted that the algebraic (non-state) variables of the network model of the system are
VsM, IsM and VLN.
Figure 5. Multi-machine power system with TCSCs
F. System State Matrix
Previous sections show that the dynamic model of the power system installed with TCSC is
described by a set of differential-algebraic equations (DAEs) which can be written in a more
compact form as the following:
)(
)(
wx,g0
wx,fx
(26)
where: x is the vector of state variables; w is the vector of non-state (algebraic) variables; f and
g are nonlinear vector functions the individual expressions of which have been given in the
previous sections.
The small-disturbance stability model of the power system installed with TCSC is obtained
by linearising the differential-algebraic equations which can also be written in a more compact
form as follows:
w
x
JJ
JJ
0
x
3 Δ
Δ
4
21 (27)
where J1, J2 , J3 , and J4 are matrices the elements of which are defined based on the power
system initial operating condition and the parameters of the system together with its
controllers. By reducing (27), the following equation is obtained:
xAx Δ
(28)
where 31
421 JJJJA is the system state matrix. Eigenvalues of this matrix are needed for
evaluation the stability and dynamic characteristic of the power system, and for the damping
controllers design. The state matrix is the function of controllers (PSSs and TCSC devices
together with their supplementary controllers) parameters.
Network System (NB-NG+NT nodes)
IS,NG
IS2
IS1
VS,NG
VS2
VS1
GNG
G2
G1 x1 w1
Line
Zt1=-jXt1 v1
TCSC 1
Line w2 x2 Zt2=-jXt2 v2
TCSC 2
Line wNT xNT
Zt,NT=-jXt,NT vNT
TCSC N
Rudy Gianto
795
3. Results of Investigation
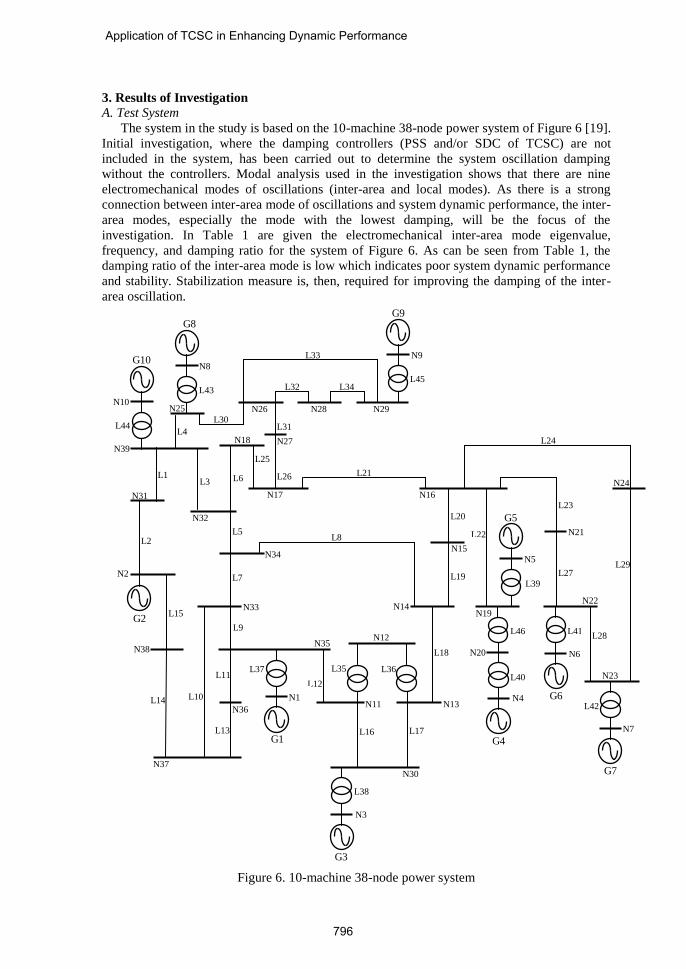
A. Test System
The system in the study is based on the 10-machine 38-node power system of Figure 6 [19].
Initial investigation, where the damping controllers (PSS and/or SDC of TCSC) are not
included in the system, has been carried out to determine the system oscillation damping
without the controllers. Modal analysis used in the investigation shows that there are nine
electromechanical modes of oscillations (inter-area and local modes). As there is a strong
connection between inter-area mode of oscillations and system dynamic performance, the inter-
area modes, especially the mode with the lowest damping, will be the focus of the
investigation. In Table 1 are given the electromechanical inter-area mode eigenvalue,
frequency, and damping ratio for the system of Figure 6. As can be seen from Table 1, the
damping ratio of the inter-area mode is low which indicates poor system dynamic performance
and stability. Stabilization measure is, then, required for improving the damping of the inter-
area oscillation.
Figure 6. 10-machine 38-node power system
L46
L45
L44
L43
L42
L41
L40
L39
L38
L37 L36 L35
L34
L33
L32
L31 L30
L29
L28
L27
L26
L25
L24
L23
L22
L21
L20
L19
L18
L17 L16
L15
L14
L13
L12 L11
L10
L9
L8
L7
L6
L5
L4
L3
L2
L1
N39
N38
N37
N36
N35
N34
N33
N32
N31
N30
N29 N28
N27
N26 N25
N24
N23
N22
N21
N20
N19
N18
N17 N16
N15
N14
N13
N12
N11
N10
N9
N8
N7
N6
N5
N4
N3
N2
N1
G10
G9 G8
G7
G6
G5
G4
G3
G2
G1
Application of TCSC in Enhancing Dynamic Performance
796

Therefore, in order to improve the stability, it is proposed to install two PSSs in the system
(in generators G2 and G5). The locations of the PSSs have been determined using participation
factor technique. In Table 2 are given the electromechanical inter-area mode eigenvalue,
frequency, and damping ratio for the system with PSSs. It is to be noted that optimal values of
PSSs parameters were used in the investigation. These values are given in Table 3 and were
obtained using the method proposed in [11-13].
Table 1. Electromechanical inter-area mode
EIGENVALUE FREQUENCY (HZ) DAMPING RATIO
-0.3589 ± J4.5167 0.72 0.0792
Table 2. Electromechanical inter-area mode (system with PSSs)
EIGENVALUE FREQUENCY (HZ) DAMPING RATIO
-0.5937±J4.5903 0.73 0.1283
Table 3. PSSs parameters
Parameter PSS at G2 PSS at G5
KPSS 10.6312 pu 19.9858 pu
TPSS 1.0016 s 1.0000 s
TPSS1 0.2498 s 0.2025 s
TPSS2 0.0150 s 0.0958 s
TPSS3 0.1729 s 0.0547 s
TPSS4 0.1396 s 0.1978 s
It can be seen from Table 2 that damping ratio of the inter-area mode increases from 0.0792
to 0.1283 with the installation of PSSs. Although it has been considered in [1, 20] that the
damping ratio greater than 0.1 is acceptable; however, as mentioned in [21, 22], a minimum
damping ratio of 0.15 is desirable for ensuring faster settling time of the oscillations.
B. SDC of TCSC Application
To ensure faster settling time, it is proposed to further improve system dynamic
performance by installing an SDC in the TCSC in line L14. It is to be noted that the TCSC has
already been installed in the system for the primary purpose of power transfer capacity
improvement of the line. An opportunity is then taken to equip the TCSC installed with an
SDC to provide a secondary function for damping enhancement of the electromechanical
modes, particularly the inter-area mode.
In Table 4 are given the electromechanical inter-area mode eigenvalue, frequency, and
damping ratio for the system where the SDC installed in the system. It is to be noted that
optimal values of PSSs, TCSC, and SDC parameters were used in the investigation. These
values are given in Table 5, and were also obtained using the method proposed in [11-13].
There is a damping improvement for the inter-area mode when the SDC of TCSC is installed
(compare the damping ratio in Table 2 with Table 4). This results show that the TCSC and its
SDC provides better system stability.
C. Time-Domain Simulations
Although the results given in Section 3.2 have been confirmed by eigenvalue calculations,
it is desirable to investigate the performance of the controllers in the time-domain under a large
disturbance. The disturbance is a three-phase fault on a busbar section connected to node N34
via a bus coupler. The fault is initiated at time t = 0.10 second, and the fault clearing time is
0.05 second with the bus coupler tripping.
Rudy Gianto
797

The improvement in performance is quantified by comparing the time-domain responses in
Figures 7 - 9. As the focus of the investigation is the inter-area mode, the responses used in the
comparisons are those of relative speed transients between generators G2 and G5.
From the responses, it can be seen that, without controllers (PSSs and/or SDC of TCSC),
the system oscillation is poorly damped and takes a considerable time to reach a stable
condition (see Figure 7). Note that this result is in agreement with the eigenvalue result where
the damping ratio of the oscillation is quite low and only 0.0792 (see Table 1).
Figure 8 shows the system transient with two PSSs installed in the system. There are some
improvements in oscillation settling time with PSSs installed in the system (compare Figure 7
with Figure 8). This result is also in agreement with the eigenvalue result (see Table 2), where
with the PSSs installed the damping ratio of the oscillation is higher (0.1283).
Further improvement in the inter-area oscillation settling time is obtained with the SDC of
TCSC installed in the system. The oscillation is damped more quickly as shown in Figure 9.
Figure 9 confirms a good system oscillation damping and dynamic performance when SDC is
installed in the power system. This result is also in agreement with the eigenvalue result (see
Table 4), where the damping ratio of the oscillation is at the highest (0.2092).
In Figure 10 is also shown in a graphical form the output of supplementary controller of
TCSC during the transient period following the disturbance. The settling time of the oscillation
is similar to that of Fig.9. This result is to be expected, and shows further the confirmation of
the TCSC performance under large disturbance. It can be seen from Figure 10 that during a
first few seconds of the transient period, the supplementary controller gives higher outputs, and
therefore, provides significant contribution to the system damping and stability.
Table 4. Electromechanical inter-area mode (system with PSSs, SDC and TCSC)
EIGENVALUE FREQUENCY (HZ) DAMPING RATIO
-0.9975±J4.8806 0.78 0.2002
Table 5. PSSs, SDC and TCSC parameters
Controller Parameter Value
PSS
(G2/G5)
KPSS 19.9833/10.3938
TPSS 1.0000/1.0000
TPSS1 0.2851/0.2092
TPSS2 0.0459/0.0876
TPSS3 0.2182/0.0625
TPSS4 0.1061/0.1910
TCSC
KF 0.0452 pu
TF 1.0009 s
Kt 0.0732 pu
Tt 0.0268 s
SDC
KSDC 1.0011 pu
TSDC 1.0000 s
TSDC1 0.1968 s
TSDC2 0.1590 s
TSDC3 0.0255 s
TSDC4 0.1796 s
Application of TCSC in Enhancing Dynamic Performance
798

Figure 7. System transient (without PSSs and SDC of TCSC)
Figure 8. System transient (with PSSs)
0 1 2 3 4 5 6 7 8 9 10-0.6
-0.4
-0.2
0
0.2
0.4
0.6
0.8Relative Speed vs Time
time in s
rela
tive s
peed in r
ad/s
0 1 2 3 4 5 6 7 8 9 10-0.4
-0.2
0
0.2
0.4
0.6
0.8
1Relative Speed vs Time
time in s
rela
tive s
peed in r
ad/s
Rudy Gianto
799

Figure 9. System transient (with PSSs and SDC of TCSC)
Figure 10. Transient of TCSC’s supplementary controller output
4. Conclusions
In this paper, the application of TCSC and its SDC in enhancing the system oscillation
damping and dynamic performance of an electric power system has been investigated. It is
found that the system oscillation damping can be improved by the TCSC. This result shows
0 1 2 3 4 5 6 7 8 9 10-0.6
-0.4
-0.2
0
0.2
0.4
0.6
0.8Relative Speed vs Time
time in s
rela
tive s
peed in r
ad/s
0 1 2 3 4 5 6 7 8 9 10-0.8
-0.6
-0.4
-0.2
0
0.2
0.4
0.6SDC Output vs Time
time in s
SD
C o
utp
ut
in p
u
TCSC1
Application of TCSC in Enhancing Dynamic Performance
800

that the TCSC provides better system dynamic performance and stability of a large
interconnected multi-machine power system. The result has also been verified through both
eigenvalue calculations and time-domain simulations.
5. Acknowledment
The author would like to express special appreciation to the Ministry of Research,
Technology and Higher Education of Indonesia (KEMENRISTEK DIKTI INDONESIA) for
funding the research reported in this paper.
6. References
[1]. Cai, L.J., and Erlich, I.: ‘Simultaneous coordinated tuning of PSS and FACTS damping
controllers in large power systems’, IEEE Trans. Power Systems, 2005, 20, (1), pp. 294-
300.
[2]. Noroozian, M, Ghandhari, M., Andersson, G., Gronquist, J., and Hiskens, I.A.: ‘A robust
control strategy for shunt and series reactive compensators to damp electromechanical
oscillations’, IEEE Trans. Power Delivery, 2001, 16, (4), pp. 812-817.
[3]. Hingorani, N.G., and Gyugyi, L.: ‘Understanding FACTS: concept and technology’,
IEEE Press, New York, 2000.
[4]. Hingorani, N.G.: ‘Flexible AC transmission system’, IEEE Spectrum, 1993, 30, (4), pp.
40-45.
[5]. S. Manoj and Puttaswamy P.S.: ‘Importance of FACTS controllers in power systems’,
International Journal of Advanced Engineering Technology, 2011, 2, (3), pp. 207-212.
[6]. Eslami, M., Shareef, H., Mohamed, A., and Khajehzadeh, M.: ‘PSS and TCSC damping
controller coordinated design using GSA’, Elsevier Procedia, 2012, 14, pp. 763-769.
[7]. Narrne, R., and Panda, P.C.: ‘Coordinated design of PSS with Multiple FACTS controller
using advanced adaptive PSO’, International Journal on Electrical Engineering and
Informatics (IJEEI), September 2013, 5, (3), pp. 361-376.
[8]. Davarani, R.Z., and Ghazi, R.: ’Optimal simultaneous coordination of PSS and TCSC
using multi objective genetic algorithm’, Journal of Electrical System (JES), 2013, 9, (4),
pp. 410-421.
[9]. Welhazi, Y., Guesmi, T., Jaoued, I.B., and Abdallah, H.H. ‘Power system stability
enhancement using FACTS controllers in multimachine power systems’, Journal of
Electrical System (JES), 2014, 10, (3), pp. 276-291.
[10]. Khorram, B., and Lesani, H.: ‘Coordinated control of FACTS devices and PSS for
improve the power system stability using fuzzy adaptive bacterial foraging’, International
Journal on Electrical Engineering and Informatics (IJEEI), June 2015, 7, (2), pp. 334-351.
[11]. Nguyen, T.T., and Gianto, R.: ‘Stability improvement of electromechanical oscillations
by control co-ordination of PSSs and FACTS devices in multi-machine systems’,
Proceedings of the IEEE PES GM 2007, June 2007, pp. 1-7.
[12]. Nguyen, T.T., and Gianto, R.: ‘Application of optimization method for control co-
ordination of PSSs and FACTS devices to enhance small-disturbance stability’,
Proceedings of the IEEE PES 2005/2006 Transmission and Distribution Conference &
Exposition, May 2006, pp. 1478-1485.
[13]. Nguyen, T.T., and Gianto, R.: ‘Optimisation-based control co-ordination of PSSs and
FACTS devices for optimal oscillations damping in multimachine power system’, IET
Gener. Transm. Distrib., 2007, 1, (4), pp.564-573.
[14]. Humpage, W.D., Bayne, J.P., and Durrani, K.E.: ‘Multinode-power-system dynamic
analyses’, Proc. IEE, 1972, 119, (8), pp. 1167-1175.
[15]. IEEE Std 421.5-2005: ‘IEEE recommended practice for excitation system models for
power system stability studies’, 2005.
[16]. IEEE Working Group: ‘Dynamic models for fossil fueled steam units in power system
studies’, IEEE Trans. Power Systems, 1991, 6, (2), pp. 753-761.
Rudy Gianto
801

[17]. Mithulananthan, N., Canizares, C.A., Reeve, J., and Rogers G.J.: ‘Comparison of PSS,
SVC, and STATCOM controllers for damping power system oscillations’, IEEE Trans.
Power System, 2003, 16, (2), pp. 786-792.
[18]. CIGRE TF 38.01.08: ‘Modeling of power electronics equipment (FACTS) in load flow
and stability programs: a representation guide for power system planning and analysis’,
1999.
[19]. Pai, M.A.: ‘Energy function analysis for power system stability’ (Kluwer Academic
Publishers, Boston, 1989).
[20]. Pourbeik, P., and Gibbard, M.J.: ‘Simultaneous coordination of power system stabilizers
and FACTS device stabilizers in a multimachine power system for enhancing dynamic
performance’, IEEE Trans. Power Systems, 1998, 13, (2), pp. 473-479.
[21]. Pal, B.C., Coonick, A.H., Jaimoukha, I.M., and El-Zobaidi, H.: ‘A linear matrix
inequality approach to robust damping control design in power systems with
superconducting magnetic energy storage device’, IEEE Trans. Power Systems, 2000, 15,
(1), pp. 356-362.
[22]. Majumder, R., Chaudhuri, B., El-Zobaidi, H., Pal, B.C., and Jaimoukha, I.M.: ‘LMI
approach to normalised H∞ loop-shaping design of power system damping controllers’,
IEE Proc.-Gener. Transm. Distrib., 2005, 152, (6), pp. 952-960.
Rudy Gianto received BE, ME and PhD degrees from Tanjungpura
University in 1991, Bandung Institute of Technology in 1995, and The
University of Western Australia in 2009 respectively. Currently, he is a
Senior Lecturer at Tanjungpura University, Indonesia. He has published
several international journal and conference papers. His research interests
include power system stability and control, and simulation of power system
dynamics.
Application of TCSC in Enhancing Dynamic Performance
802

![Enhancing the Dynamic Meta Modeling Formalism and its ... · namic Meta Modeling (DMM) [4], can be used. Dynamic Meta Modeling is a technique used to formally describe the dynamic](https://img.pdfslide.net/doc/110x75/5f6bb147a8ce9004a869923c/enhancing-the-dynamic-meta-modeling-formalism-and-its-namic-meta-modeling-dmm.jpg)