Embed Size (px)
Citation preview

Application of the condition factor in the production of African
Sharptooth Catfish Clarias gariepinus
Assignment presented in partial fulfilment of the requirements for the degree Master of
Philosophy in Livestock Industry Management: Aquaculture, at the University of
Stellenbosch
April 2005
Candidate: Paul Daniël Lückhoff
Supervisor: Lourens F de Wet
Co-supervisor: Dr Danie Brink

- 2-
Declaration
I the undersigned hereby declare that the work contained in this assignment is my own
work and has not previously in its entirely or in part been submitted at any University
for a degree.
Signature _____________________ Date _____10 March 2005_
- 3-
Abstract
In recent years there has been a renewed interest in the commercial culture of African
Sharptooth Catfish. Its robust characteristics and its air breathing capabilities makes the
African catfish a good candidate for culture in intensive recirculating systems. In light of
the size variation in offspring spawned from undomesticated fish, that may eventually
increase cannibalism, suitable methods for the quantification of some production
performance parameters such as growth and health measurements need to be established for
application in intensive catfish culture. In fish the condition factor (CF) reflects information
on the physiological state of the fish in relation to its welfare. This factor is expressed as
Fulton’s condition index, or the K-factor.
African Sharptooth Catfish fry with average weight of 1.9g ± 0.7867 and average length of
59.375mm ±8.812 were equally allocated into ten 1000L-recirculating tanks. The fish were
fed a commercial feed to apparent saturation at a frequency of 5 times per day. Sixteen fish
were sampled out of each treatment. Weight (g) and length (mm) of each fish were recorded
every seven days over a trial period of 175 days from which Fulton’s condition index K was
calculated. Results were analysed for significant differences using one-way ANOVA and
Tukey’s pair wise comparison test for the various parameters.
Growth parameters (a = -5.083, b = 3.004, R2 = 99.4%) derived from the logarithmic
relationship between body weight (W) and standard length (L) indicated an isometric
growth through the duration of the trail. No significant differences (P>0.05) in condition
factors between treatments were found at the beginning of the trail. Significant differences
(P<0.05) were found at the end of the trail for weight between ponds and condition factor
between treatments. No significant difference (P> 0.05) between length and treatments
were found at the end of the trial.
Mean condition factor was 0.856 ± 0.187. By using this information on condition factor for
African catfish a K-factor calculation chart for African catfish could be calculated, to be
used as a practical measurement tool to measure performance goals on catfish farms.
- 4-
Uittreksel
Die Skerptand baber Clarias gariepinus het ‘n hernuwe belangstelling in die kommersiële
produksie van hierdie vis spesie herleef. Hul geharde karakter einskappe en hul vermoë om
suurstof uit die atmosfeer te gebruik, maak hierdie vis ‘n ideale kandidaat vir produksie in
intensiewe hersirkulasie sisteme. Gepaste metodes vir die kwantifisering van sommige
produksie parameters, soos groei en gesondheids vlakke, moet geimplementeer word,
aangesien grootte verskille onder jonger visse tot verhoogde kannibalisme kan lei. In vis
reflekteer die kondisie faktor die algehele welstand van die vis. Hierdie faktor word
uitgedruk as Fulton se K waarde.
Jong Skerptand babers met ‘n gemiddelde gewig van 1.9g ± 0.7867 en ‘n gemiddelde lengte
van 59.375mm ± 8.812 was gelykop verdeel in tien 1000L hersirklasie tenke. Die vis was
‘n kommersiële dieet gevoer tot oënskynlike versadiging, vyf keer per dag. Steekproewe
van sestien visse uit elke behandeling was op ‘n weeklikse basis geneem. Gewig (g) en
lengte (mm) van elke individuele vis was weekliks gedokumenteer oor die proef periode
van 175 dae. Vanuit hierdie data is Fulton se kondisie faktor bepaal terwyl die
betekenisvolheid van waargenome verskille bepaal is aan die hand van ‘n eenrigting
Analitiese van Variasie asook deur middel van Tukey se paarwyse vergelykingings metode.
Groei parameters (a = -5.083, b = 3.004, R2 = 99.4%) was verkry van die logaritmiese
verhouding tussen gewig (W) en lengte (L), dui n isometriese groei aan. Geen
betekenisvolle verskille (P>0.05) vir kondisie was aan die begin van die proef gevind nie,
maar betekenisvolle verskille (P<0.05) was wel aan die einde van die proef gevind vir beide
gewig en kondisie. Geen betekenisvolle verskille (P>0.05) was vir lengte tussen
behandelings gevind aan die aanvang en einde van die proef nie. Gemiddelde kondisie
factor gedurende hierdie proef was 0.856 ± 0.187. Deur gebruik te maak van hierdie data is
‘n analitiese model opgestel vir Skerptand babers, om sodoende ‘n praktiese model
beskikbaar te stel vir die meet van prestasie doelwitte op baber plase.

- 5-
Acknowledgements I would like to thank and attribute my gratitude to the following people and institutions:
Lourens de Wet, for his guidance, patience and support throughout this thesis.
Dr Danie Brink, for the example and standards that he set, as well as the inspiration he
gives to all aquaculturists.
Trufish, for providing the fish and equipment.
Aquanutro, for supplying the feed.
Christie and Elma Truter, for their support and assistance.
Antoinette, for your love, patience and support
- 6-
Table of Contents
Page number Declaration 2 Abstract 3 Uittreksel 4 Acknowledgements 5 Table of contents 6 List of tables 7 List of figures 7 List of equations 7 List of abbreviations 8 Chapter 1: Literature review
1.1. Introduction 9 1.2. Factors influencing the condition of fish 9 1.2.1. Nutrition and feeding 10 1.2.2. Water quality 13 1.2.2.1. Ammonia 13 1.2.2.2. Nitrite 15 1.2.2.3. Dissolved oxygen 15 1.2.2.4. Suspended solids 16 1.2.3. Water temperature 17 1.2.4. Stocking densities 18 1.2.5. Stress and disease 19 1.2.6. Feed selection 22 1.3. Determining the condition of fish 22 1.3.1. Fulton’s condition index K 23 1.4. Conclusion 25 1.5. References 26
Chapter 2: Application Fulton’s K-factor in the production of African Sharptooth
Catfish Clarias gariepinus 2.1. Abstract 29 2.2. Introduction 30 2.3. Materials and methods 31 2.4. Results and discussion 32 2.5. Conclusion 38 2.6. References 39 Appendix A: Mean values 40 Appendix B: Raw Data 42
- 7-
List of tables
Table 2.1 Descriptive statistics on mean length, weight and condition factor
between treatments at the end of the trial
List of figures
Figure 1.1. Energy and nutritional balance in fish
Figure 1.2. Fate of nitrogen and phosphorus in feed
Figure 1.3. Biofilter start-up
Figure 1.4. Model for the response of animals to stress
Figure 2.1. Logarithmic relationship between body weight and length
Figure 2.2. Mean condition factor over 26 weeks
Figure 2.3. K-factor calculation chart for African sharptooth catfish
Figure 2.4. K-factor calculation chart for African Sharptooth catfish
List of equations
Equation 1.1. Nitrification process a
Equation 1.2. Nitrification process b
Equation 1.3. Fulton’s condition factor

- 8-
List of Abbreviations
BOD Biological Oxygen Demand
CF Condition Factor
GMP Good Manufacturing Practice
Hb Haemoglobin
Ht Haematicrit
SOP Standard Operating Procedures
TTP Total Plasma Protein
Chapter 1
LITERATURE REVIEW
1.1. Introduction
One of the most important characteristics of the African Sharptooth catfish is their ability to
exploit a wide variety of both animal and plant protein, and their ability to withstand
diverse environmental conditions and high stocking densities. One of the reasons for them
being able to withstand harsh environmental conditions is the fact that they can utilise
oxygen from the air. These characteristics make the African catfish a good candidate for the
culture in intensive recirculating systems. The success of such a system lies in the
management practices of the farm manager and the characteristics of the African catfish
make these management practices easier. However, the African catfish is an aggressive
predator and cannibalism is a frequent occurrence. To minimise cannibalism and aggressive
attacks the farm manager needs to implement good managerial practices. The manager of
such a venture also needs to understand the basic principles of recirculating systems as well
as the requirements of the species chosen (Losordo, 1998; McGee, 2000), and he/she will
need suitable methods to measure production parameters such as growth and the well-being
of the fish.
Due to the increase of production cost in a recirculating system, especially the increase in
feed costs; one must be able to market and sell the fish as a health product in order to select
the higher income groups. To market fish to the higher income groups the fish must be of
good quality and in a very good condition. The flesh must have the right colour, texture,
taste and smell. To get a good conditioned fish with the right colour flesh, no off flavours
and smells, it is imperative to give the fish all the nutritional requirements the fish needs, as
well as the optimum environmental conditions.
It is thus in the aquaculturist best interest if he/she knows and understand some of the major
factors that may influence the condition and overall well-being of the catfish in a intensive
recirculating system.
1.2. Factors influencing the condition of fish
Feeding and nutrition, water qualities, age and sex, stress, stocking densities and
environmental conditions are factors influencing the condition of fish. The condition of
fish, especially when sold whole, is not just its body volume but also the condition of the
- 10-
skin and fins. It is thus important that the fish is also in good health. In recirculating
systems most of these factors are easier to manage than in extensive system where there are
less control over certain environmental conditions. However, in a recirculating system the
stocking densities are usually higher per m3. With these higher stocking densities together
with more intensive feeding leads to higher risk to certain factors that could influence the
condition of catfish.
Recirculating systems are mechanically and biologically complex and component failures,
poor water quality, stress, disease and off flavour are common problems in a poorly
managed and poorly designed recirculating system (Masser 1999). For optimum condition
critical environmental parameters in a recirculating systems culture water include, dissolved
oxygen, unionised ammonia, nitrite-nitrogen, nitrate, carbon dioxide, pH and alkalinity.
1.2.1. Feeding and Nutrition
The nutritional requirements of the fish as well as the water quality are important in
assessing the feeding management in a recirculating system to achieve optimum growth and
condition. Since there is no natural food in a recirculating system fish in these systems
require high quality feeds which will provide optimum nutritional requirements to attain
good growth and good condition (Van Gorder, 1994). Fish feed for such a system must be
made to the requirements of the specie being cultured, and should contain as little dust
particles as possible.
In an extensive operation the availability of natural food are available in abundance. The
stocking densities in this system are also much lower than in an intensive system. This
means that the need for artificial diets is lower than in an intensive recirculating system. In
the intensive recirculating system it is the exact opposite and a good quality feed must be
produced to supply all the nutritional requirements the fish needs. In an intensive farming
operation a better feeding management strategy must be put in place (Riche, 2003).
Nutritional requirements are influenced by different factors such as; species, sex of the fish,
age, mass, stocking density, desired carcass composition, nutritional factors and
environmental factors. Uys, (1988) reported that best growth rates and feed conversion
ratios for juveniles and sub-adult catfish are achieved by a diet consisting of 38% to 42%
crude protein and an energy level of 12 kJ g-1. The protein requirement as well as the
energy requirement of catfish is important to have a good nutritional and energy balance in
the fish. If this balance is in equilibrium then the fish will have optimum growth rates and a
good condition.
- 11-
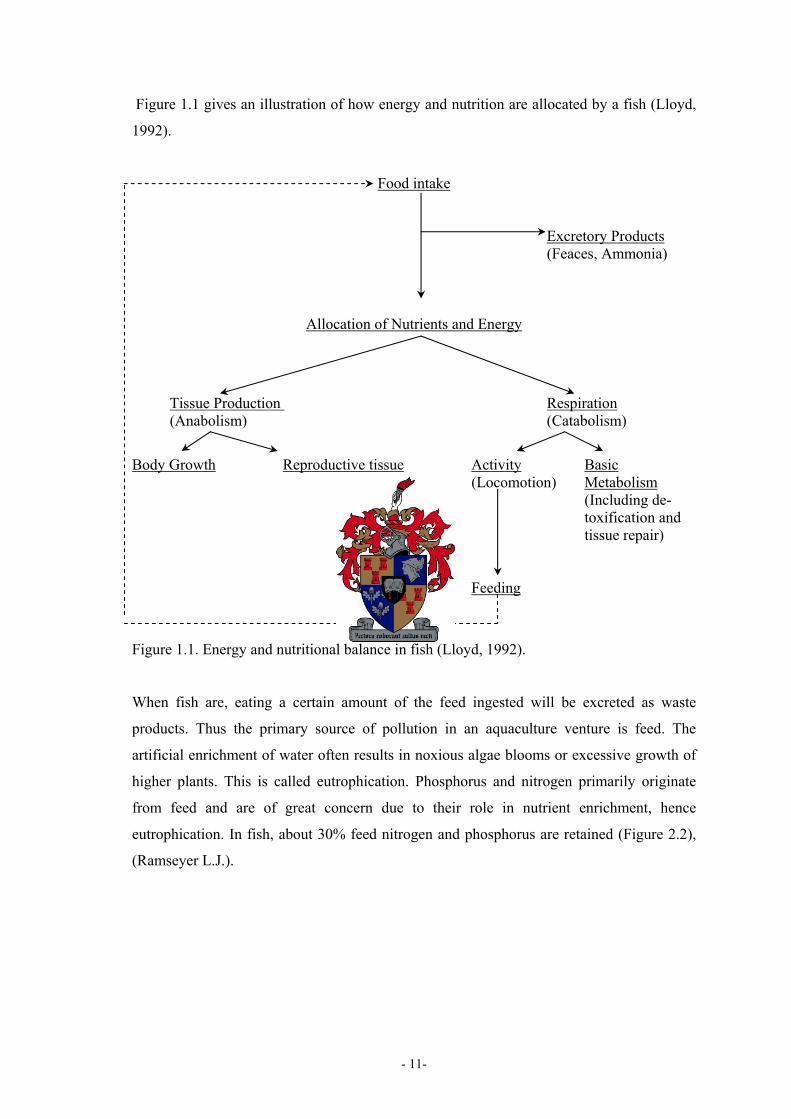
Figure 1.1 gives an illustration of how energy and nutrition are allocated by a fish (Lloyd,
1992).
Food intake
Excretory Products (Feaces, Ammonia)
Allocation of Nutrients and Energy
Tissue Production Respiration (Anabolism) (Catabolism)
Body Growth Reproductive tissue Activity Basic (Locomotion) Metabolism (Including de- toxification and tissue repair) Feeding
Figure 1.1. Energy and nutritional balance in fish (Lloyd, 1992).
When fish are, eating a certain amount of the feed ingested will be excreted as waste
products. Thus the primary source of pollution in an aquaculture venture is feed. The
artificial enrichment of water often results in noxious algae blooms or excessive growth of
higher plants. This is called eutrophication. Phosphorus and nitrogen primarily originate
from feed and are of great concern due to their role in nutrient enrichment, hence
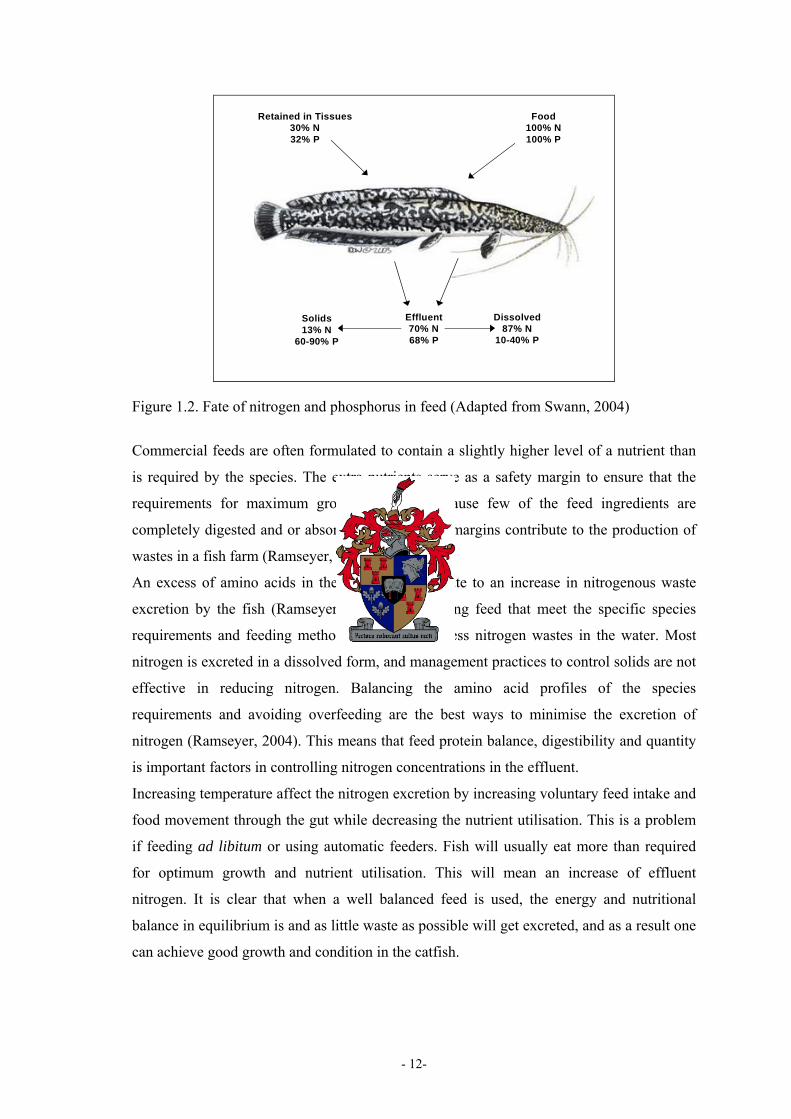
eutrophication. In fish, about 30% feed nitrogen and phosphorus are retained (Figure 2.2),
(Ramseyer L.J.).
- 12-
Food100% N100% P
Retained in Tissues30% N32% P
Dissolved87% N
10-40% P
Solids13% N
60-90% P
Effluent70% N68% P
Figure 1.2. Fate of nitrogen and phosphorus in feed (Adapted from Swann, 2004)
Commercial feeds are often formulated to contain a slightly higher level of a nutrient than
is required by the species. The extra nutrients serve as a safety margin to ensure that the
requirements for maximum growth are met, because few of the feed ingredients are
completely digested and or absorbed. These safety margins contribute to the production of
wastes in a fish farm (Ramseyer, 2004).
An excess of amino acids in the feed will contribute to an increase in nitrogenous waste
excretion by the fish (Ramseyer, 2004). Formulating feed that meet the specific species
requirements and feeding methods can reduce excess nitrogen wastes in the water. Most
nitrogen is excreted in a dissolved form, and management practices to control solids are not
effective in reducing nitrogen. Balancing the amino acid profiles of the species
requirements and avoiding overfeeding are the best ways to minimise the excretion of
nitrogen (Ramseyer, 2004). This means that feed protein balance, digestibility and quantity
is important factors in controlling nitrogen concentrations in the effluent.
Increasing temperature affect the nitrogen excretion by increasing voluntary feed intake and
food movement through the gut while decreasing the nutrient utilisation. This is a problem
if feeding ad libitum or using automatic feeders. Fish will usually eat more than required
for optimum growth and nutrient utilisation. This will mean an increase of effluent
nitrogen. It is clear that when a well balanced feed is used, the energy and nutritional
balance in equilibrium is and as little waste as possible will get excreted, and as a result one
can achieve good growth and condition in the catfish.
- 13-
1.2.2. Water quality
Water quality is one of the most important factors influencing the growth and condition of
catfish. African catfish will survive in poor environmental conditions, but this does not
mean the fish will grow optimally. To achieve optimum growth and condition it is
important to maintain optimum water qualities throughout the production cycle (Masser,
1999). Some of the most important components of water quality affecting growth and
condition are, ammonia, nitrite, dissolved oxygen, suspended solids and temperature.
1.2.2.1. Ammonia
Feeding rate, feed composition, fish metabolic rate and the quantity of wasted feed affect
the water quality in a recirculating system (Losordo, 1998). Ammonia is the result of the
digestion of protein, and is proportional to the feeding levels in the system. In most
recirculating systems ammonia is removed by a two-step process of biological filtration.
Adequate surface area for the growth of the bacteria is needed to meet the loading capacity
of a system (Wheaton. 1994). This process of ammonia removal is called nitrification, and
is the oxidation of ammonia to nitrate with nitrite as the intermediate product. Nitrifying
bacteria are called chemosynthetic autotrophs or chemolithotrophs. These autotrophic
bacteria receive their energy from inorganic compounds. Organic compounds serve as an
energy source for hetrotrophic bacteria. Of the autrotrophs, Nitrosomonas sp. is the major
species in ammonia oxidation and Nitrobacter for the oxygenation of nitrite to nitrate
(Wheaton, 1994). These processes require oxygen and the basic chemical conversions
occurring in nitrification is shown in equations 1.1 and 1.2 (Wheaton, 1994).
NH4+ + 1.5O2 → 2H+ + H2O + NO2
- (1.1)
NO2- + 0.5O2 → NO3
- (1.2)
Through these conversions one can see that nitrification require oxygen, produce nitrite as
an intermediate product and hydrogen ions, thus lowering the pH (Wheaton, 1994).
The filter will need a period in time to adjust to the load put on the filter by the stocking
densities of fish and their feeding rate. This period can be several weeks and Fred Wheaton
suggested that filter break-in usually requires 30 – 60 days. Filter start-up is described in
Figure 1.3 and is important for a manager to understand due to the impacts it might have on
the condition of fish would system failure occur (Wheaton, 1994; Wheaton, 2003). The
importance of filter start-up can be illustrated by Prinsloo et al (1999), where their initial
- 14-
data on catfish growth were influenced by catfish mortalities, which occurred during the
third week of their investigation when the nitrogen removal efficiency of the biofiltration
had not yet become functional (Prinsloo, 1999).
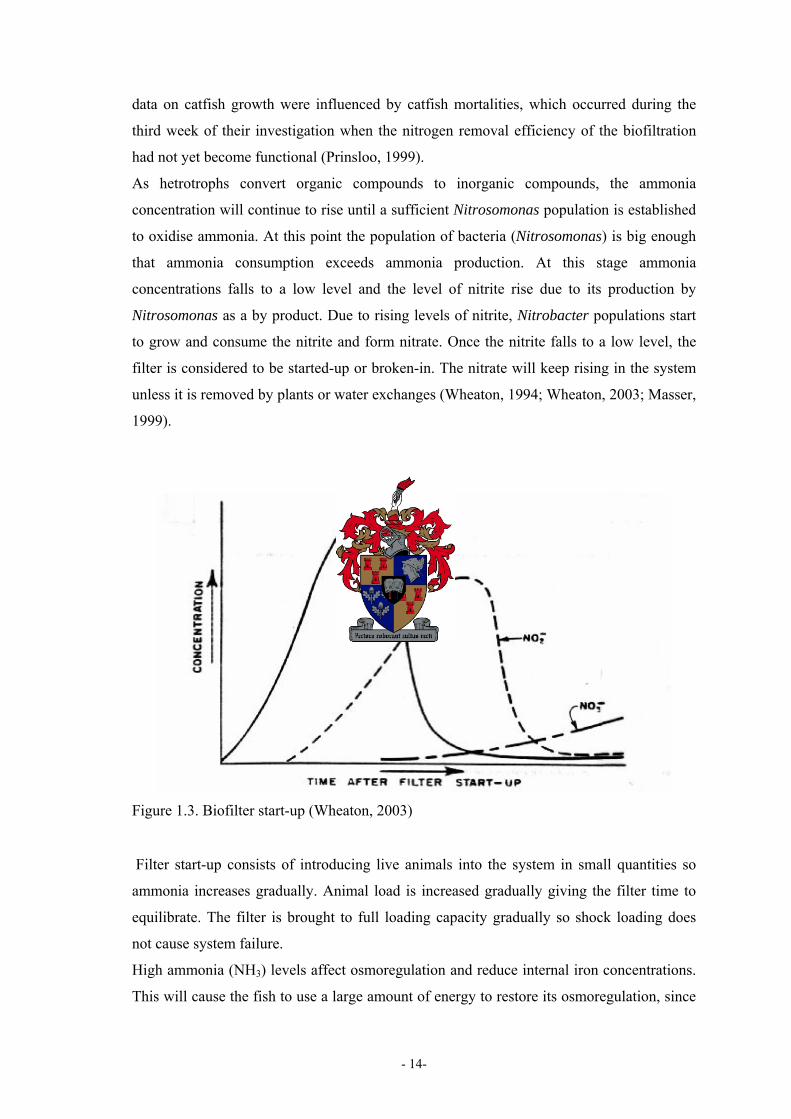
As hetrotrophs convert organic compounds to inorganic compounds, the ammonia
concentration will continue to rise until a sufficient Nitrosomonas population is established
to oxidise ammonia. At this point the population of bacteria (Nitrosomonas) is big enough
that ammonia consumption exceeds ammonia production. At this stage ammonia
concentrations falls to a low level and the level of nitrite rise due to its production by
Nitrosomonas as a by product. Due to rising levels of nitrite, Nitrobacter populations start
to grow and consume the nitrite and form nitrate. Once the nitrite falls to a low level, the
filter is considered to be started-up or broken-in. The nitrate will keep rising in the system
unless it is removed by plants or water exchanges (Wheaton, 1994; Wheaton, 2003; Masser,
1999).
Figure 1.3. Biofilter start-up (Wheaton, 2003)
Filter start-up consists of introducing live animals into the system in small quantities so
ammonia increases gradually. Animal load is increased gradually giving the filter time to
equilibrate. The filter is brought to full loading capacity gradually so shock loading does
not cause system failure.
High ammonia (NH3) levels affect osmoregulation and reduce internal iron concentrations.
This will cause the fish to use a large amount of energy to restore its osmoregulation, since
- 15-
this is such an important factor in the fish’s well-being. Ammonia also cause swelling and
inflammation of the gills and other tissues, damages skin and eyes, reduce oxygen transport
in the blood, swelling and diminishing of red blood cells, decrease oxygen consumption of
tissues and thus increasing susceptibility to disease. Gill hyperplasia is a common effect of
ammonia. This is the swelling of gill filaments and the filaments tend to clump together.
Gill hyperplasia will therefore reduce the transfer capacity of oxygen from the water to the
blood and in return reduce the excretion of waste products like ammonia and CO2 (Roets,
1997). The fish will need more energy to meet the oxygen levels required and to secrete
waste products. In this situation the energy and nutrition balance (figure 1.1) will shift and,
more energy will be spend to repair the gills, transfer of oxygen over gills (increase in
respiration), and excretion of ammonia and CO2 levels to the water. This means there will
be less energy for growth and, since eating levels in catfish and other species tend to
decrease or even stop means the fish needs to use its fat reserves and muscle protein to try
and repair its balance. This will lead to a decrease in growth and weight. Since the length
cannot decrease the condition of the catfish will decrease significantly (Lloyd, 1992).
1.2.2.2. Nitrite
In equation 1.1 and 1.2 one can see that nitrite is the intermediate product of nitrification.
Nitrite is toxic at low levels and damage the gills and oxidise the iron (Fe2+) in haemoglobin
to Fe3+ and is called metheamoglobin, which is not an effective oxygen carrier. This gives
the blood a brown colour, hence the term brown blood disease (Roets,1997).
Continued absorption of nitrite can lead to tissue hypoxia and cyanosis (Ceronio, 1995).
Fish with this nitrite poisoning will become inactive and will stop eating due to the low
levels of oxygen carrying capacity, one will also observe fish spending more time gasping
at the surface of water. In this instance the shift in the energy balance occur to increase
ventilation and to repair damage tissue as well as the balance within the fish. This will lead
to a decrease in growth and condition and in acute situation death (Roets, 1997)
1.2.2.3. Dissolved Oxygen
Dissolved oxygen levels should be maintained above 60% of saturation or above 5 mg/L
for most warm water culture systems (Watten, 1994). If the dissolved oxygen in the system
is not at the correct levels then this will directly influence the feeding levels of the fish, as
well as the function of the biofilter. The nitrification efficiency of the filter bacteria
becomes inadequate below 2 mg/L, with a filter failure as an result. Hence, an increase in
ammonia and nitrite as a result. The lowest level for the fish is specie dependent (Watten,
- 16-
1994). Since the African catfish is airbreathers these levels is not so critical. However,
under high stocking densities some catfish will have to work harder to reach the water
surface in order to get sufficient oxygen. African catfish can utilise oxygen like other fish
through its gills, thus if dissolved oxygen levels are kept at high levels then one can
minimise the work load on some of the catfish to get sufficient oxygen under high stocking
densities. When dissolved oxygen levels fall below a certain level it will have a direct effect
on the respiration of the fish. It will increase the respiration of the catfish and the catfish
will also have to swim to the water surface more often to utilise oxygen from the air. Thus
increasing the activity of the catfish and so increasing the energy demand to maintain
oxygen levels in the blood and tissues. With the increase in respiration a higher rate of toxic
chemicals can be taken up through the gills, increasing the stress on the fish (Lloyd, 1992).
As dissolved oxygen decline the body metabolism will become affected by an increase of
suffocation and very low levels may cause death. Again the effect on the energy and
nutrient balance will be affected as with ammonia and nitrite and the fish will lose growth
and as a result the condition of the fish may decrease.
The level of feeding, has the most influence on the operational requirements of the aeration
system, and the levels of maintaining dissolved oxygen levels can be decreased by an
efficient feed management program. Controlled, conservative levels of continuous feeding
will provide uniform levels of dissolved oxygen, while periods of heavy feeding will result
in more variable levels of dissolved oxygen (Losordo, 1998). If one keep high feeding
levels under conditions of low dissolved oxygen, the wastage of feed will be high and in
fact will worsen the situation by decreasing the water quality and by increasing the
suspended solids as well as fine dissolved solids, which in turn will increase the oxygen
demand of the system, and so increase the strain on growth and condition (Losordo, 1998).
1.2.2.4. Suspended solids
Waste solids are the product of fish wastes, uneaten feed, plankton and clay particles
(Swann, 1997). The part of feed not assimilated by the fish is excreted as faeces. Faeces and
uneaten feed contribute to waste solids. When broken down by bacteria, faecal solids and
uneaten feed will consume dissolved oxygen and generate ammonia-nitrogen. For this
reason, waste solids must be removed as quickly and as efficiently as possible. Waste solids
can become a big problem in recirculating systems because of the low water exchange rate.
Some systems water exchange can be as low as 0 – 5% of the total volume of water per day
(Losordo, 1998).
- 17-
There are three categories of waste solids; settable solids, suspended solids, and fine
dissolved solids (Losordo, 1999). Settable solids are those that will settle out of the water
within one hour under still conditions and should be removed as quickly as possible
(Losordo, 1998). Suspended solids and fine suspended solids are those solids that will not
settle and cannot be easily removed. Fine suspended solids (<30 micrometers) contribute
more than 50 percent of the total suspended solids in a recirculating system and increase the
oxygen demand of a system (Losordo, 1998). Dissolved solids or dissolved organic carbon
(protein) contribute to the oxygen demand of the system. Fine and dissolved solids are not
easily removed by screening or sedimentation; instead foam fractionation (also referred to
as protein skimmers) is used to remove these solids (Timmons, 1994).
All of the above mentioned solids will irritate the gills of the fish and can cause the
epithelium cells to swell and this will decrease the oxygen transfer capacity from the water
over the gills into the blood, and thus decreasing the system carrying capacity significantly
(Losordo, 1998). In situations of high levels of solids in a recirculating system it will have
the same effect on the energy balance by increasing the energy needed for respiration and
maintaining the balance within the fish.
1.2.3. Water temperature
In certain seasons of the year the fish grows more rapidly, in others it grows more slowly.
Each fish specie has its own optimum temperature, at which the rates of metabolism and
growth are most rapid. Therefore, deviations in either direction from the optimum
temperature will effect the growth rate of the immature fish (Nikoisky, 1963). The
temperature not only effects the growth of fish but acts as a signal factor. A reduction of
temperature below a certain level leads to a reduction of protein growth and the
commencement of the fat accumulation process. This was noted for carp. Changes in the
metabolic rate are most closely connected with changes in the temperature of the
surrounding water and, the rate of development of fishes is also related to a significant
extend to changes in the temperature. (Nikoisky, 1963). Changes in the temperature also
causes changes in the toxic actions of various substances upon the fish (Nikoisky, 1963).
Warm water fish grow best at temperatures between 25 and 32OC. Roets, 1997, stated that
the optimum temperature for the African Sharptooth catfish is at 27OC, and according to
Hogendoorn’s model for predicting growth in African catfish, the optimum temperature for
growth is 28OC (Uys, 1988). Bok et al (1984) recorded a drop in mean water temperature
during April with the lowest temperature in South Africa of 16.1OC. He found that the
mean growth of catfish started to decline at the end of February, and ceased completely and
- 18-
even showed a mass loss in April. Temperature is also important for survival and
metabolism of fish. Adeyemo et al, 2003, found a significant (P<0.05) difference in
haematicrit (Ht), heamoglobin (Hb), and total plasma protein (TPP) values at 23±1OC and
41±1OC relative to the control (29±1OC). A reduced quantity and quality of erytrocytes and
a decreased heamoglobin level lead to a deteriorated oxygen supply. Insufficient quantity
and quality of red cells would therefore have several effects on metabolism. A decrease in
TPP is suggestive of mal-absorbtion (Adeyemo, 2003). A high blood glucose level at low
water temperatures is indicative of retarded metabolism and also a indication of sub-lethal
stress and Adeyemo, 2003, observed the highest blood glucose level at 23±1OC. Thus, at
low temperatures the fish will not eat and use all its energy for the functions for
maintenance. The decrease in heamoglobin level with the deteriorated oxygen supply may
cause the increase in respiration, again shifting the energy and nutrient balance. Thus, low
temperatures may cause a decrease in condition and will cause a decrease in growth.
1.2.4. Stocking densities
Gerking, (1978) stated that some form of regulation occurs in populations at extremes of
densities, and that this usually involves some kind of density dependant mortality. This
density dependent mortality may operate through intra specific competition for food and
space (Gerking, 1978). For the African catfish it can be even competition for space at the
water surface to breath air. This researcher also stated that as the population density of fish
and, hence, their food consumption increases, the amount of food consumed per unit
feeding effort (catch per unit effort) will tend to decrease. In other words as the density
increases the amount of feed given will increase and according to Gerking the amount of
feed taken by the fish will in fact decrease, leading to a slower growth rate. Hengsawat
et.al. (1997) found that the mean fish weight for African catfish were highest at lowest
densities and mean weights decreased with increasing density, but the total harvest and
production were directly related to stocking density. It is clear that an increase in stocking
density results in an increase in stress, which leads to an increase energy requirements
causing reduced growth and food utilisation. Hossain et al. (1998) also found that growth
rate for the African catfish was significantly higher at lower stocking densities. However, at
low stocking densities cannibalism may increase (Hossain, 1998). A reason for this is that
African catfish may be highly territorial. Territoriality promotes resource monopolisation,
which is the uneven distribution of resources among individual fish (Grant, 1997). In a
aquaculture system this resource is food and will lead to variation in body mass and
condition. It is thus in the aquaculturists interest to minimise aggressive and territorial
- 19-
behaviour that wastes energy, causes damage to subordinates, and promotes a variation in
growth and condition (Grant, 1997). In African catfish culture this can be achieved by
keeping the stocking levels at its optimum and, under such conditions, aggressive
individuals do not monopolise a large share of the food. Consequently, identifying the
optimum stocking density is a critical factor to achieve maximum growth, maximum
condition and minimum level of cannibalism, hence minimum stress levels, to achieve
optimum growth and condition.
1.2.5. Stress and disease
Stress is a condition in which an fish is unable to maintain a normal physiological state,
because of various factors adversely affecting its well-being (Floyd, 2002). These factors
affect the well-being of a fish is called stressors and is any factor that threatens the
homeostasis of a fish. Stress is thus caused by placing a fish in a situation which is beyond
its normal level of tolerance. Floyd, (2002) divide stressors in four categories: chemical,
biological, physical and procedural. Chemical stressors are; poor water qualities, pollution,
diet composition and nitrogenous and other metabolic wastes. Biological factors include
population density, aggression, territoriality, micro-organisms and macro-organisms.
Physical stressors include temperature, light, sounds and dissolved gasses. Procedural
stressors include handling, shipping and disease treatments. This researcher also divides the
response of fish to stressors in three categories: alarm reaction, resistance and exhaustion.
The alarm response is the initial response. In this response the blood sugar levels increase
and is caused by a secretion of hormones. This will creates an energy reserve which
prepares the fish for emergency action. The osmoregulation is disrupted because of changes
in mineral metabolism. A freshwater fish will thus absorb excess water from the
environment. This disruption will require extra energy to maintain osmoregulation.
Respiration increases, blood pressure increases, and reserve red blood cells are released into
circulation. The inflammatory response is suppressed by hormones released. In the
resistance period, the fish is able to adapt to stress for a certain period of time. During this
period the fish may look and act normal, but is depleting energy reserves because of the
extra requirements placed upon the fish. The exhaustion period is recognised by the
depletion of the energy reserves, and adaptation fails and the fish is susceptible to disease
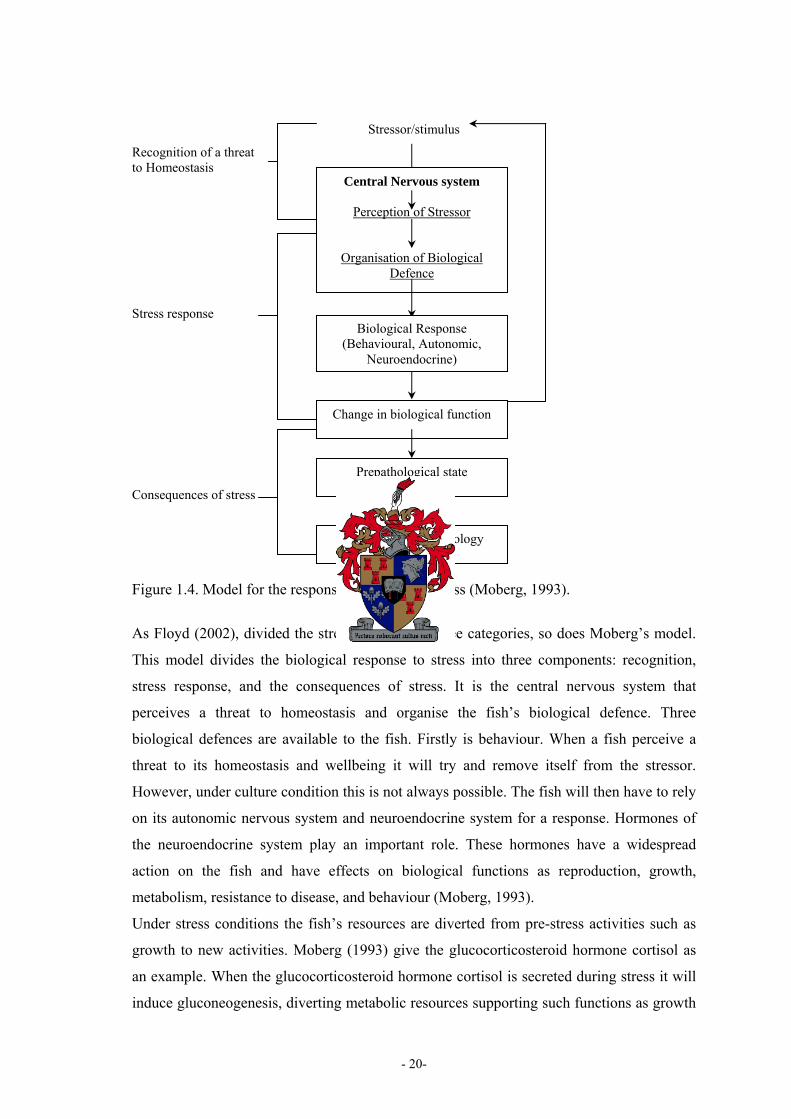
(Floyd, 2002). Moberg, (1993) illustrates the response of fish and other animals to stress in
figure 1.4.
- 20-
Stressor/stimulus
Recognition of a threat to Homeostasis
Stress response
Consequences of stress
Figure 1.4. Model for the response of animals to stress (Moberg, 1993).
As Floyd (2002), divided the stress response in three categories, so does Moberg’s model.
This model divides the biological response to stress into three components: recognition,
stress response, and the consequences of stress. It is the central nervous system that
perceives a threat to homeostasis and organise the fish’s biological defence. Three
biological defences are available to the fish. Firstly is behaviour. When a fish perceive a
threat to its homeostasis and wellbeing it will try and remove itself from the stressor.
However, under culture condition this is not always possible. The fish will then have to rely
on its autonomic nervous system and neuroendocrine system for a response. Hormones of
the neuroendocrine system play an important role. These hormones have a widespread
action on the fish and have effects on biological functions as reproduction, growth,
metabolism, resistance to disease, and behaviour (Moberg, 1993).
Under stress conditions the fish’s resources are diverted from pre-stress activities such as
growth to new activities. Moberg (1993) give the glucocorticosteroid hormone cortisol as
an example. When the glucocorticosteroid hormone cortisol is secreted during stress it will
induce gluconeogenesis, diverting metabolic resources supporting such functions as growth
Central Nervous system
Perception of Stressor
Organisation of Biological Defence
Biological Response (Behavioural, Autonomic,
Neuroendocrine)
Change in biological function
Prepathological state
Development of Pathology
- 21-
to the production of glucose. It does not matter which responses the fish chooses in
response to stress, a change in biological function occurs that will force a cost. Combined
stressors could cost the fish sufficient resources to induce a prepathological state and lead to
the development of a pathology and disease (Moberg, 1993). It is not possible to predict
when the stress on a fish will be acute, but for optimum growth and condition one would
like to keep the stress levels as low as possible. All animals including fish can handle a
certain amount of stress, but as soon as it becomes acute the fish will stop eating and
become susceptible for disease. In turn there will be a loss in condition and growth and an
increase in mortalities. The key to prevention of stress is good management. This means
maintaining good water quality, good nutrition, and good sanitation. Poor water quality is a
common and important stressor of fish and precedes many disease outbreaks (Floyd, 2002).
Feed a high quality feed that meets the nutritional requirements of the fish. Proper
sanitation implies routine removal of debris from fish tanks and disinfection of containers
and equipment between groups of fish. Disinfection of containers and equipment between
groups of fish helps minimise transmission of disease from one population to another
(Floyd, 2002).
One can clearly see that stress has a major influence on the fish’s energy resources and this
will affect the growth and condition and thus production. Fish farm management should
thus be designed to minimise tress on fish in order to decrease the occurrence of disease
outbreaks, and so increasing production. When a disease outbreak occur, the correction of
the stressor should precede of accompany disease treatment (Floyd, 2002). A disease
treatment is an artificial way of slowing down the invading pathogen so that the fish has
time to defend itself with an immune response. This is why it is important to correct the
stressors as soon as possible so the fish can use its energy to fight the invading pathogens
naturally (Floyd, 2002).
1.2.6. Feed selection
The type of feed used can also influence the condition of catfish. Floating feeds should be
used because floating extruded feed allow the aquaculturist to monitor fish feeding activity,
thus enabling the manager to stop feeding when the fish are not eating well. This will in
turn minimise the effect of feed wastage on the water quality which have a influence on the
growth, condition and health of fish. Extruded feeds are more stable than compressed
pelleted feeds, thus less nutrients will leach into the water. Feed the largest pellet size that is
accepted by the fish. Larger pellets also have a smaller surface-to-volume ratio than smaller
pellets, which reduce the rate and the amount of nutrients that leach into the water. High
- 22-
quality feeds will contain less than 1% fines. Extruded feeds will contain the least dust and
fines (Ramseyer, 2004).
Feedbags should be checked for date of manufacturing. Avoid feed that is older than 3
months. Masser, 1999, suggests to stop using feed that is older than 60 days from the
manufacture date. Fish will not fully utilise the feed if it is deficient in nutrients due to
break down over time, which will affect the growth and condition of the fish. Molds on
feed may produce Alfa toxins, which can stress or kill fish. A disease known, as “no blood”
is associated with feed that is deficient in certain vitamins and “broken back disease” from
vitamin C deficiencies. This will cause a serious imbalance in the fish and it will lead to
poor growth and condition of the fish. If these diseases occur the only thing the manager
can do is to discard the feed and to purchase new feed (Masser,1999; Riche, 2003
Ramseyer, 2004;)
1.3. Determining the condition of fish The general wellbeing of fish is often described in terms of its general condition, such as
poor, good, or excellent. By classifying or describing a catfish just by length or weight may
give a farm manager limited information. The fish may be very long but very thin and thus
very little fillet mass, and this is the exact opposite a farm manager would want. The farm
manager thus needs to understand weight-length relationships and its influence on the
condition of the fish. By using a condition index a farm manager may get a better idea of
the total well being of the fish.
1.3.1. Fulton’s Condition Index K:
The condition of fish is usually based on a visual assessment of the fish, and only an
experienced person will be able to tell if a fish is in a good or poor condition (Barnham,
1998). It will thus be more practical to allocate a numerical value to the state of condition of
a fish. In order to calculate a numerical value, one can calculate the condition of a fish as
the condition factor or coefficient of condition. This factor is expressed as Fulton’s
condition index, or the K-factor; equation 1.3 (Barnham, 1998; Williams, 2000). This factor
is directly influenced by the length-weight relationship.
- 23-
K = 100 000W
L 3 (1.3)
Where: W = the weight of the fish in grams
L = the length of the fish in millimetres The value of the b exponent is explained by the slope of the equation’s logarithmic form:
Log W = log a + b log L The value of the b exponent provides important information on fish growth and in turn
whether Fulton’s condition index K can be used or not. When b = 3, the increase in weight
is isometric. This means relative growth of both variables is identical (Santos, 2002). In
other words, as the fish length increases the weight increases accordingly. There are many
instances when the assumption of isometric growth will not be met, i.e. the b exponent is
not equal to 3. When the value of b is not equal to 3, weight increase is allometric. If b>3
(positive allometry) then there is a significant positive relationship between K and fish
length which indicates that K will increase with increasing length, thus as the fish length
increases the more rotund the fish will become. When b < 3 (negative allometry) then K
will decrease with increase in length, thus as the fish length increases the less rotund the
fish will become (Jones, 1999). Since Fulton’s condition index K assumes isometric growth
(b = 3) then a different approach must be taken when b is not equal to 3. Jones et al., (1999)
compared a proposed model (M = BL2H), where the height of the fish is also incorporated
to give a more accurate condition factor when b is not equal to 3.
The condition of a fish is influenced by the age of a fish, sex, season, stage of maturation,
fullness of the gut, type of food consumed, amount of fat reserved and the degree of
muscular development (Barnham 1998; Williams, 2000). Weight-length relationships
provide practical information on fish biology, ecology, health and physiology. Length-
weight relationships are used to predict growth in terms of weight as a function of length
(Jones, 1999). Other uses include; the estimation of weight at age and the conversion of
growth-in-length equations to growth-in weight, the calculation of production and biomass
of a fish population. Weight-length relationships also allow life history and morphological
comparison between fish populations from different ponds (Santos, 2002). With this
morphological comparison one can compare the condition of wild fish populations to the
condition of fish populations in an intensive recirculating system.
- 24-
Female African Sharptooth Catfish eggs can weigh 15% to 20% of the total body weight of
the fish (De Graaf, 1996) Thus, the K-factor will decrease significantly during spawning.
H.J. Ratz stated that cod with a low condition index presumably having experienced
adverse physical environmental conditions or insufficient nutrition. They used Fulton’s K-
factor as a simple and adequate way to estimate the energy levels of cod. They found that
the condition of cod follow inter-annual variations and seasonal cycles, with lower energy
reserves occurring during spawning (Ratz 2003). The females shedding their eggs can
explain this. The condition factor does not only reflect the feeding condition of the fish but
the gonad development as well (Lizama, 2002). So when a female catfish get sexually
matured the K-factor will increase. During winter period’s fish use their energy reserves
(fat stores and muscle proteins), therefore they eat less and the K-factor will decrease
according. When weighing and measuring a fish just after it had eaten the K-factor will be
higher due to the fullness of the gut. The type of feed fed and the feed management taken
influences amount of fat reserve and muscle protein.
Ideally condition of fish should be taken account of the sex of the fish, however, this is not
always possible or practical. Feeding record needs to be taken as accurately as possible.
This can explain a lot if the K-factor is high or low. Factors like water qualities, stress,
disease, and stocking densities all play a role in the condition of a fish. All of these factors
need to be taken into account when the condition of a fish is interpreted.
To get results of length-weight relationship or condition factor one needs to implement a
proper population inventory. The main purpose of this is to document length increases and
weight gains. Data acquired from the inventory provides the status of the population in
regards with the carrying capacities of the system and the size variation in a certain
population of fish. Size variation in Clarias gariepinus is of great importance due to of the
increase of cannibalism that occurs when there is a large size variation in the population.
Highest levels of cannibalism occur during the fry and fingerling stages, therefore the
farmer must take great care to ensure as little size variation as possible at this stage of
production. Klontz, (2004) suggested the inventory process should begin when a system is
stocked and suggested that this process should occur as follows. Firstly, determine the
average weight of the fish, the biomass and the number of fish. Take a minimum of 16 fish
(preferably more, about 40, if there is time to do more) and measure the individual length
and weight. Now you can calculate the mean, midrange and standard deviation as well as
the condition factor. At the end of a cycle determine the average weight of the fish, the
biomass and the number of fish. Take a minimum of 16 fish (preferably more, about 40, if
there is time to do more) and measure individual length and weight. Now you can calculate
- 25-
the mean, midrange and standard deviation again as well as the condition factor. This will
detect size bias from the original population to the new population (Klontz, 2004).
1.4. Conclusion
By applying proper population inventories one can determine the weight-length relationship
of fish populations. One can also get valuable information from the growth exponent b on
the growth of the fish which can be either isometric or allometric. Fulton’s condition index
K can only be used if the fish has an isometric growth. Condition factors may be used as
indicators of the well being or fitness of the fish and may be used as a method for
quantification of production parameters such as health and growth. Factors such as water
qualities, temperature, stress and disease, stocking densities, sex and age of the fish, can all
play a role in the condition of catfish. It is thus important for the aquaculturist to keep these
factors in mind when calculating the condition of catfish, for he/she might be able to find
answers to certain variations in the condition and growth of the farmed catfish. Thus in
order for an aquaculturist to make accurate decisions there must be proper standard
operating procedures (SOP) and good manufacturing practices (GMP) in place. This will
allow the aquaculturist to keep track of variables in the production period in terms of
feeding, disease control, water qualities, water temperature, log of unusual occurrences like
power failure etc. When the aquaculturist has ensured that good SOP’s and GMP’s are in
place the use of the condition factor to quantify production parameters will allow the
aquaculturist to solve unanswered questions with regard to why the fish did not performed
and what the possible causes thereof may be, in order to prevent that from happening again
in the future and to improve general production efficiency.
- 26-
1.5. References
ADEYEMO, O.K. AGBEDE, S.A. OLANIYAN, A.O. SHOAGA, O.A. 2003. The Haematological Response of Clarias gariepinus to changes in Acclimatisation Temperature. Department of Veterinary Public Health and Preventive Medicine, University of Ibadan, Ibadan Department of Wildlife and Fisheries Management,
University of Ibadan, Ibadan, Nigeria. African Journal of Biomedical Research. Vol. 6: 105 – 108
BARNHAM, C. BAXTER, A., 1998. Condition factor, K for Salmonid fish. State of Victoria. Department of Primary Industries. Fisheries Notes. FN 0005. ISSN: 1444-2254 CERONIO, A.D. HAARHOFF, J. STEYN, G.J. DU PREEZ, H.H. 1995. Predicting the
production of waste products in the high-density culture of Sharptooth catfish (Clarias gariepinus). Department of Zoology, Rand Afrikaans University, PO Box 524, Auckland park 2006, South Africa
DE GRAAF, G. JANSSEN, J. 1996. Handbook on the artificial reproduction and pond
rearing of the African catfish Clarias gariepinus in Sub-Saharan Africa. Nefisco Foundation Amsterdam, The Netherlands. FAO Fisheries Technical Paper: 362.
FLOYD, R.F. 2002. Stress, Its Role in Fish Disease. University of Florida. IFAS Extension. CIR 919. Visit website: http://edis.ifas.ufl.edu GERKING, S.D. 1978. Ecology of Freshwater Fish Production. PhD. Department of Zoology. Arizona State University. Tempe. Chapter 11: pp 279. GRANT, J.W.A. 1997. Chapter 4. Territoriality. In Godin, J.G.J. Behavioural Ecology of Teleost Fishes. Oxford University Press. pp 96 – 97. HENGSAWAT, K. WARD, F.J. JARURATJAMORN, P. 1997. The effect of stocking densities on yield, growth and mortality of the African catfish (Clarias gariepinus) cultured in cages. Aquaculture 152: 67 – 76. HOSSAIN, M.A.R. BEVERIDGE, C.M. HAYLOR, G.S. 1998. The effects of density, Light and shelter on the growth and survival of African catfish (Clarias gariepinus) fingerlings. Aquaculture 160: 251 – 258. JONES, R.E. PETRELL, R.J. PAULY, D., 1999. Using modified length-weight
Relationships to assess the condition of fish. Aquaculture engineering 20: 261-276.
KLONTZ, G.W. Pond inventory methods. Retrieved from the internet August 2004. http://www.users.uswest.net/~silvercup/info004.pdf LIZAMA, M. DE LOS, AP. AMBROSIO, A.M. 2002. Condition factor in nine
species of fish of the Characidae family in the upper Parana river floodplain, Brazil. Braz. J. Biol. 62(1): 113-124.
LLOYD, R. 1992. Pollution and Freshwater Fish. A Buckland Foundation Book. ISBN: 0-85238-187-5. pp 62.
- 27-
LOSORDO, T.M. MASSER, M.P. RAKOCY, J. 1998. Recirculating aquaculture tank
production systems. An overview of critical considerations. South regional aquaculture centre. Publication No. 451.
LOSORDO, T.M. MASSER, M.P. RAKOCY, J. 1999. Recirculating aquaculture tank production systems. A review of component options. South regional aquaculture centre. Publication No. 453.
MASSER, M.P. RAKOCY, J. LOSORDO, T.M. 1999. Recirculating aquaculture tank production systems. Management of recirculating systems. South regional aquaculture centre. Publication No. 452.
McGee, M. Cichira, C. 2000. Principles of water recirculating and filtration in aquaculture. University of Florida. Department of fisheries and aquatic sciences. FA-12. MOBERG, G.P. 1993. Stress Induced Pathologies in Fish: The Cost of Stress. Proceedings
of the 19th U.S. – Japan Natural Resources Meeting. NOAA Technical Report NMFS 111: 131 – 134.
NIKOISKY, G.V. 1963. The ecology of fishes. Academic Press London and New York. pp 17 – 19, 190, 203 – 208. PRINSLOO, J.F. ROETS, W. THERON, J. HOFFMAN L.C. SCHOONBEE, H.J. 1999.
Changes in some water quality conditions in recirculating water using three types of biofiltration systems during the production of sharptooth catfish Clarias gariepinus (Burchell). Part II: Growth and production of sharptooth catfish over a period of 78 days. Water SA. 25 (2) 253 – 256.
RAMSEYER L.J. GARLING D.L. 2004. Fish nutrition and aquaculture waste
management. Department of fisheries and wildlife. Michigan State University. Retrieved from the internet. 2004. http://aquanic.org/publicat/state/il-in/ces/garling.pdf
RATZ, H.J. LLORET, J. 2003. Variation in fish condition between Atlantic cod
(Gadus morhua) stocks, the effect on their productivity and management implications. Federal research centre. Elsevier Fisheries Research 60: 369-380.
ROETS, W. 1997. The influence of three different biological filtering units on the water
Quality in water recirculating systems for the intensive production of the African Sharptooth catfish Clarias gariepinus. Faculty of Mathematics and Natural Science. University of the North.
RICHE, M. 2003. Feeding tilapia in intensive recirculating systems. North central regional Aquaculture centre. Fact sheet series No. 114. SANTOS, M.N. GASPAR, M.B. VASCONCELOS, P. MONTEIRO, C.C., 2002.
Weight-length relationships for 50 selected fish species of the Algarve coast (Southern Portugal). Fisheries Research 59: 289-295.
SWANN, LA DON. 1997. A fish farmer’s guide to understanding water quality. Illinois- Indiana Sea Grant Program. AS-503. Pordue University. West Lafayette, IN. 7 pp.

- 28-
SWANN, LA DON. Fish nutrition and feeding. Mississippi-Alabama sea grant consortium. Auburn University. Retrieved from the internet. 2004. http://aquanic.org/courses/marine/slides/nutrition_2004.ppt TIMMONS, M.B. 1994. Use of foam fractionators in aquaculture. . In: Timmons, M.B.
and M. Losordo (editors), Aquaculture water re-use systems: Engineering design and management. Development in aquaculture and fisheries science, volume 27. Elsevier Scientific Publishing Company, Amsterdam, The Netherlands. pp 247-276.
UYS, W. 1988. Chapter 5. Nutrition. In Hecht, T. Uys, W. Britz, P.J. The culture of Sharptooth Catfish in Southern Africa. pp 47-57. VAN GONDER, S.D. 1994. Operating and managing water reuse systems. In: Timmons,
M.B. and M. Losordo (editors), Aquaculture water reusesystems: Engineering design and management. Development in aquaculture and fisheries science, volume 27. Elsevier Scientific Publishing Company, Amsterdam, The Netherlands. pp 283-295.
WATTEN, B.J. 1994. Aeration and oxygenation. In: Timmons, M.B. and M. Losordo (editors),Aquaculture water reusesystems: Engineering design and management. Development in aquaculture and fisheries science, volume 27. Elsevier Scientific Publishing Company, Amsterdam, The Netherlands. pp 174-200.
WHEATON F.W. Biological Filtration. Design and operation. Agriculture Engineering Department. The University of Maryland. Retrieved from the internet on 6 April 2003. http://aquanic.org/publicat/state/il-in/ces/ces-240_biofilter.htm
WHEATON F.W. HOCHHEIMER, J.H. KAISER, G.E. KRONES, M.J. LIBEY, G.S.
EASTER, C. 1994. Nitrification filter principles. In: Timmons, M.B. and M. Losordo (editors), Aquaculture water reuse systems: Engineering design and management. Developments in aquaculture and fisheries science, volume 27. Elsevier Scientific Publishing Company, Amsterdam, The Netherlands. pp101-123.
WILLIAMS, J.E. 2000. The coefficient of condition of fish. Chapter 13 in Schneider,
James C. (ed). Manual of fisheries survey methods II: periodic updates. Michigan Department of Natural Resources, Fisheries special report 25, Ann Arbor.
- 29-
Chapter 2 APPLLICATION OF FULTON’S K-FACTOR IN THE INTENSIVE
CULTURE OF AFRICAN SHARPTOOTH CATFISH CLARIAS GARIEPINUS
2.1. Abstract
Fulton’s condition factor K is derived from the weight-length relationship of fish and
provides useful information on the nutritional and health status of fish. With the recent
renewed interest in the commercial culture of African sharptooth catfish in South Africa,
suitable methods for the quantification of some production performance parameters such as
growth and health measurements need to be established for application in intensive catfish
culture. Especially in the light of the large size variation in offspring spawned from
undomesticated fish that may eventually increase cannibalism. The aim of the trial was to
establish and compare length-weight relationship and condition factors for future use in
commercial culture conditions.
Catfish fry with average weight of 1.912g ± 0.789 and average length of 59.375mm ± 8.812
were equally allocated into ten 1000L-recirculating tanks. The fish were fed a commercial
feed to apparent satiation at a frequency of 5 times per day. Sixteen fish were sampled out
of each treatment. Weight (g) and length (mm) of each fish were recorded every seven days
over a trial period of 175 days from which Fulton’s condition index K was calculated.
Results were analysed for significant differences using one-way ANOVA and Tukey’s pair
wise comparison test for the various parameters.
Growth parameters (a = -5.083, b = 3.004, R2 = 99.4%) derived from the logarithmic
relationship between body weight and length indicated an isometric growth over the
duration of the trail. No significant differences (P>0.005) in condition factors were found
between treatments at initial stocking but significant differences were found at the end of
the trail period for both weight and condition factor. No significant difference (P> 0.005) in
length measurements was found between treatments at the end of the trial. These results
indicate that Fulton’s K may be a more sensitive method for body scoring than length
measurements in African Sharptooth Catfish.
- 30-
2.2. Introduction
African Sharptooth Catfish Clarias gariepinus is widely distributed throughout Southern
Africa as well as through central West Africa (Bruton, 1988). In recent years there has been
a renewed interest in the commercial culture of African Sharptooth Catfish in Southern
Africa. Its robust characteristics and its air breathing capabilities makes the African catfish
a good candidate for culture in intensive recirculating systems.
Weight-length relationships provide practical information on fish biology, ecology, health
and physiology. Length-weight relationships are used to predict growth in terms of weight
as a function of length (Jones, 1999). Other uses include the estimation of weight at age and
the conversion of growth-in-length equations to growth-in weight, the calculation of
production and biomass of a fish population. Weight-length relationships also allow life
history and morphological comparison between fish populations from different ponds
(Santos, 2002). With this morphological comparison one can compare the condition of wild
fish populations to the condition of fish populations in an intensive recirculating system,
since brood fish mainly comes from the wild there is no domesticated gene pool. There is
known that size variation in African catfish is of great importance because of the increase
of cannibalism that occurs when there is large size variation. Highest levels of cannibalism
occur during the fry and fingerling stage.
Fish frequently gets described to be either in a poor, good or excellent condition. This
measure is usually based on a visual assessment of the fish (Barnham, 1998). In fish the
condition factor reflects information on the physiological state of the fish in relation to its
welfare (Lizama, 2002). This factor is expressed as Fulton’s condition index, or the K-
factor (Barnham, 1998):
K = 100 000W L 3
with W the body weight of the fish and L the length of the fish and the value of the
exponent b explained by the slope of the equation’s logarithmic form:
Log W = log a + b log L
The value of the b exponent provides important information on fish growth and in turn
whether Fulton’s condition index K can be used or not. When b is equal to 3, the increase in
weight is isometric. This means relative growth of both variables is identical (Santos,
- 31-
2002). There are many instances when the assumption of isometric growth will not be met,
i.e. the b exponent is not equal to 3. If b is larger than 3 then there is a significant positive
relationship between K and fish length which indicates that K will increase with increasing
length, and when b is less than 3 then K will decrease with increase in length (Jones 1999).
Since Fulton’s condition index K assumes isometric growth (b = 3), a different approach
must be taken when b is not equal to 3. Jones et al. (1999) compared a proposed model (M
= BL2H), where the height of the fish is also incorporated to give a more accurate condition
factor when b is not equal to 3.
Due to health and nutritional status, the weight of fish, of the same age, may differ greatly
while the length may show a minimum variance. Goncalves, et al., (1997) stated that the
weight parameter may vary seasonally, daily, and between habitats, unlike parameter b that
generally does not vary significantly.
Ratz, (2003) stated that cod with a low condition index presumably having experienced
adverse physical environmental or insufficient nutrition. They used Fulton’s K-factor as a
simple and adequate way to estimate the energy levels of cod. They found that the condition
of cod follow inter-annual variations and seasonal cycles, with lower energy reserves
occurring during spawning (Ratz, 2003).
The aim of this trail was to provide information on weight-length relationships and its
practical applications on first generation fish populations in an intensive recirculating
system, and to calculate a practical K-factor calculation chart for the African Sharptooth
catfish. 2.3. Materials and methods
African Sharptooth catfish fry with average weight of 1.9g ± 0.7867 and average length of
59.375mm ±8.812 were used in this trail. Fry were evenly divided into ten 1000L-
recirculating tanks. After the first month the fish were moved to holding cages of 1m x
1.15m x 0.4m in the recirculating system. Fish were fed a commercial feed (Aquanutro
Catfish pre-starter) ad lib at a frequency of 5 times per day. Sixteen fish were sampled out
of each treatment. Individual weight (g) and length (mm) of sampled fish were recorded
every seven days over a trial period of 175 days; feed intake was recorded for each period.
Length was measured from the centre between the two maxillary barbels on the mouth to
the base of the caudal fin. Fulton’s condition index K was used to express the condition of
the fish. Results were analysed for significant differences using one-way ANOVA and
Tukey’s pair wise comparison test for the various parameters.
- 32-
The mean condition factor was used as the average condition African catfish are likely to
achieve, and the standard deviation on the mean condition factor was used to determine the
upper and lower limits African catfish is likely to achieve. By using this information a K-
factor calculation chart or analytical model, was formulated. 2.4. Results and discussion
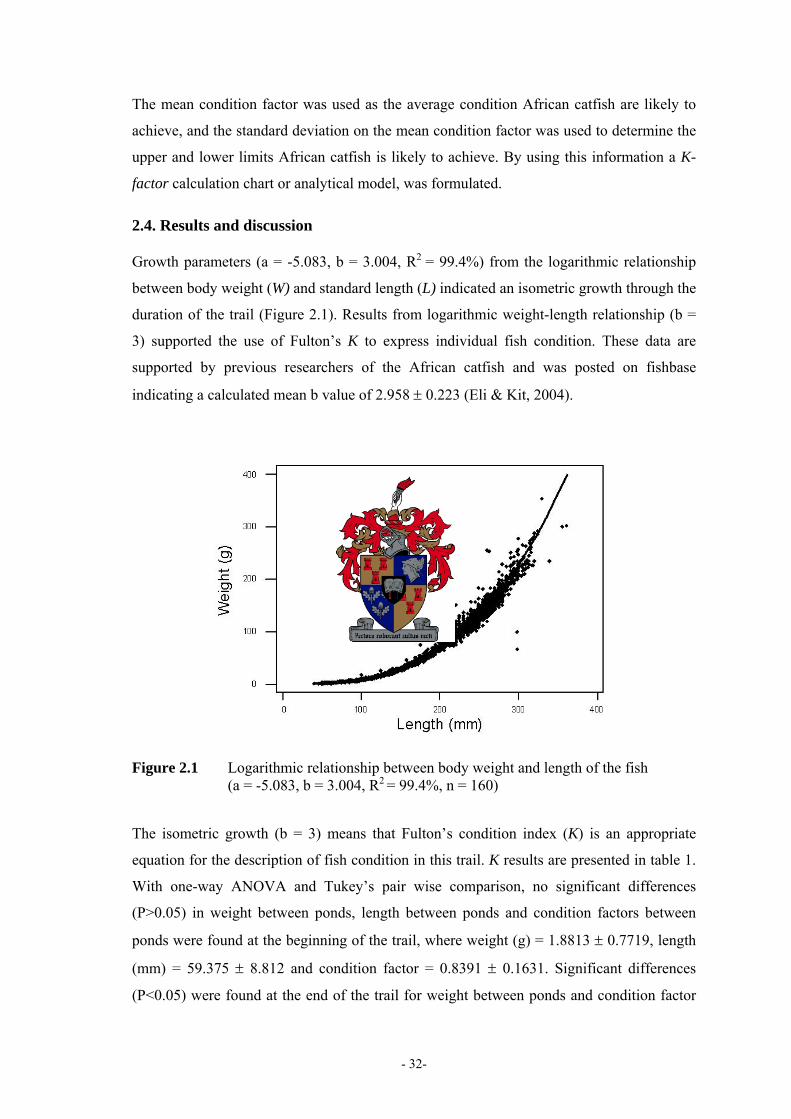
Growth parameters (a = -5.083, b = 3.004, R2 = 99.4%) from the logarithmic relationship
between body weight (W) and standard length (L) indicated an isometric growth through the
duration of the trail (Figure 2.1). Results from logarithmic weight-length relationship (b =
3) supported the use of Fulton’s K to express individual fish condition. These data are
supported by previous researchers of the African catfish and was posted on fishbase
indicating a calculated mean b value of 2.958 ± 0.223 (Eli & Kit, 2004).
Figure 2.1 Logarithmic relationship between body weight and length of the fish
(a = -5.083, b = 3.004, R2 = 99.4%, n = 160) The isometric growth (b = 3) means that Fulton’s condition index (K) is an appropriate
equation for the description of fish condition in this trail. K results are presented in table 1.
With one-way ANOVA and Tukey’s pair wise comparison, no significant differences
(P>0.05) in weight between ponds, length between ponds and condition factors between
ponds were found at the beginning of the trail, where weight (g) = 1.8813 ± 0.7719, length
(mm) = 59.375 ± 8.812 and condition factor = 0.8391 ± 0.1631. Significant differences
(P<0.05) were found at the end of the trail for weight between ponds and condition factor
- 33-
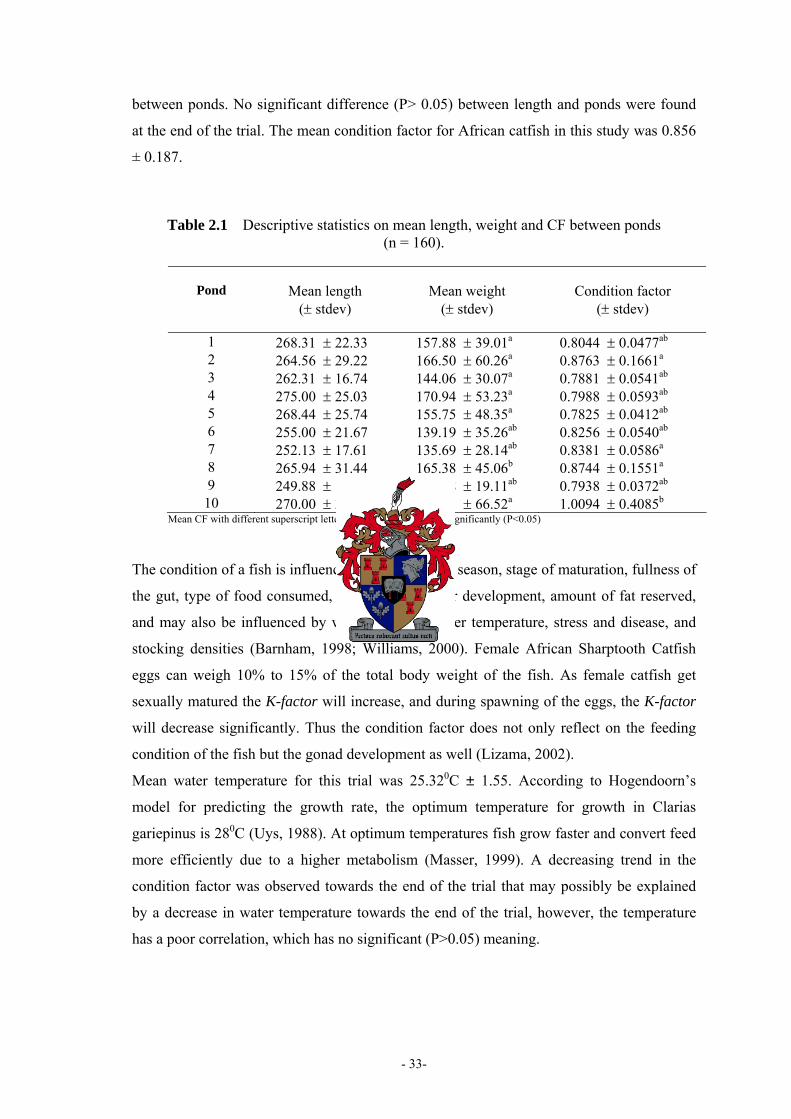
between ponds. No significant difference (P> 0.05) between length and ponds were found
at the end of the trial. The mean condition factor for African catfish in this study was 0.856
± 0.187.
Table 2.1 Descriptive statistics on mean length, weight and CF between ponds (n = 160).
Pond
Mean length (± stdev)
Mean weight
(± stdev)
Condition factor
(± stdev)
1 268.31 ± 22.33 157.88 ± 39.01a 0.8044 ± 0.0477ab 2 264.56 ± 29.22 166.50 ± 60.26a 0.8763 ± 0.1661a 3 262.31 ± 16.74 144.06 ± 30.07a 0.7881 ± 0.0541ab 4 275.00 ± 25.03 170.94 ± 53.23a 0.7988 ± 0.0593ab 5 268.44 ± 25.74 155.75 ± 48.35a 0.7825 ± 0.0412ab 6 255.00 ± 21.67 139.19 ± 35.26ab 0.8256 ± 0.0540ab 7 252.13 ± 17.61 135.69 ± 28.14ab 0.8381 ± 0.0586a 8 265.94 ± 31.44 165.38 ± 45.06b 0.8744 ± 0.1551a 9 249.88 ± 13.44 124.38 ± 19.11ab 0.7938 ± 0.0372ab
10 270.00 ± 30.40 194.31 ± 66.52a 1.0094 ± 0.4085b Mean CF with different superscript letters in each column differs significantly (P<0.05)
The condition of a fish is influenced by it’s age, sex, season, stage of maturation, fullness of
the gut, type of food consumed, degree of muscular development, amount of fat reserved,
and may also be influenced by water qualities, water temperature, stress and disease, and
stocking densities (Barnham, 1998; Williams, 2000). Female African Sharptooth Catfish
eggs can weigh 10% to 15% of the total body weight of the fish. As female catfish get
sexually matured the K-factor will increase, and during spawning of the eggs, the K-factor
will decrease significantly. Thus the condition factor does not only reflect on the feeding
condition of the fish but the gonad development as well (Lizama, 2002).
Mean water temperature for this trial was 25.320C ± 1.55. According to Hogendoorn’s
model for predicting the growth rate, the optimum temperature for growth in Clarias
gariepinus is 280C (Uys, 1988). At optimum temperatures fish grow faster and convert feed
more efficiently due to a higher metabolism (Masser, 1999). A decreasing trend in the
condition factor was observed towards the end of the trial that may possibly be explained
by a decrease in water temperature towards the end of the trial, however, the temperature
has a poor correlation, which has no significant (P>0.05) meaning.
- 34-
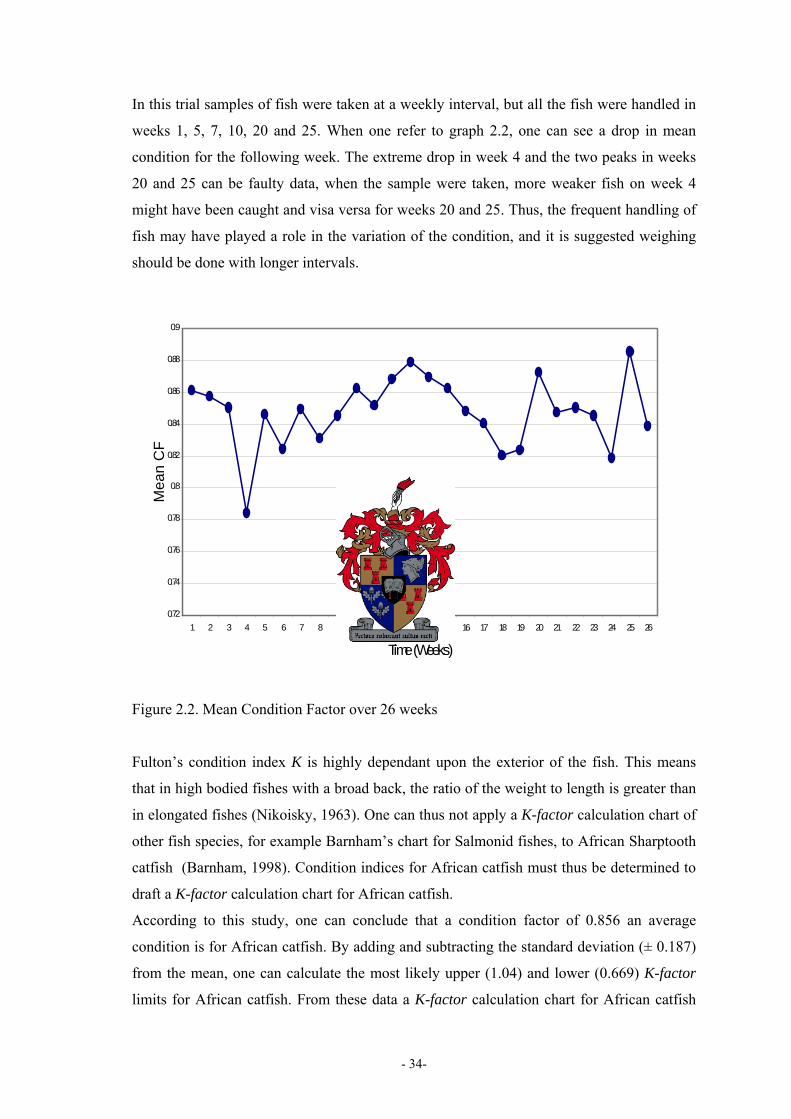
In this trial samples of fish were taken at a weekly interval, but all the fish were handled in
weeks 1, 5, 7, 10, 20 and 25. When one refer to graph 2.2, one can see a drop in mean
condition for the following week. The extreme drop in week 4 and the two peaks in weeks
20 and 25 can be faulty data, when the sample were taken, more weaker fish on week 4
might have been caught and visa versa for weeks 20 and 25. Thus, the frequent handling of
fish may have played a role in the variation of the condition, and it is suggested weighing
should be done with longer intervals.
Figure 2.2. Mean Condition Factor over 26 weeks
Fulton’s condition index K is highly dependant upon the exterior of the fish. This means
that in high bodied fishes with a broad back, the ratio of the weight to length is greater than
in elongated fishes (Nikoisky, 1963). One can thus not apply a K-factor calculation chart of
other fish species, for example Barnham’s chart for Salmonid fishes, to African Sharptooth
catfish (Barnham, 1998). Condition indices for African catfish must thus be determined to
draft a K-factor calculation chart for African catfish.
According to this study, one can conclude that a condition factor of 0.856 an average
condition is for African catfish. By adding and subtracting the standard deviation (± 0.187)
from the mean, one can calculate the most likely upper (1.04) and lower (0.669) K-factor
limits for African catfish. From these data a K-factor calculation chart for African catfish
0.72
0.74
0.76
0.78
0.8
0.82
0.84
0.86
0.88
0.9
1 2 3 4 5 6 7 8 9 10 11 12 13 14 15 16 17 18 19 20 21 22 23 24 25 26
Time (Weeks)
Mea
n C
F
- 35-
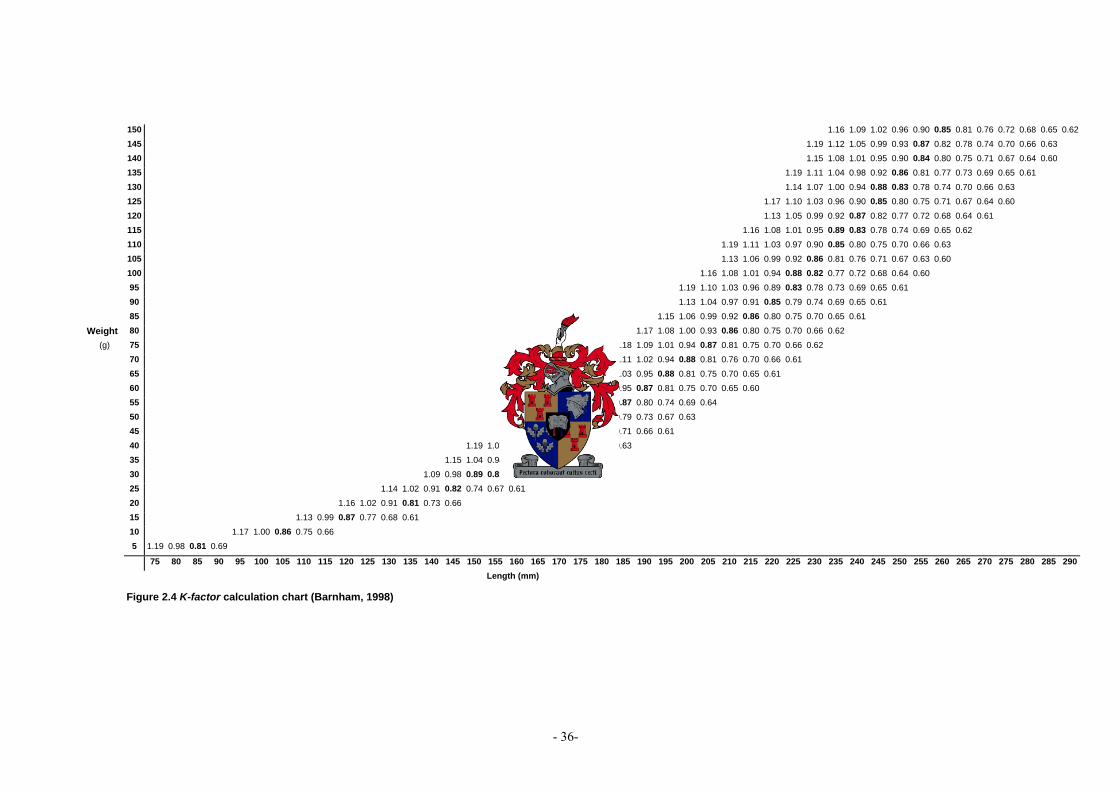
can be calculated using Fulton’s equation based on a similar K-factor calculation chart for
Salmonid fish (Barnham, 1998). To improve the usability of the K-factor chart the
condition indices are overlapping these upper and lower limits slightly. Weight intervals of
5g were used and length intervals of 5mm were used compared to Barnham’s chart for
Salmonid fish where weight intervals of 25g and length intervals of 25mm were used
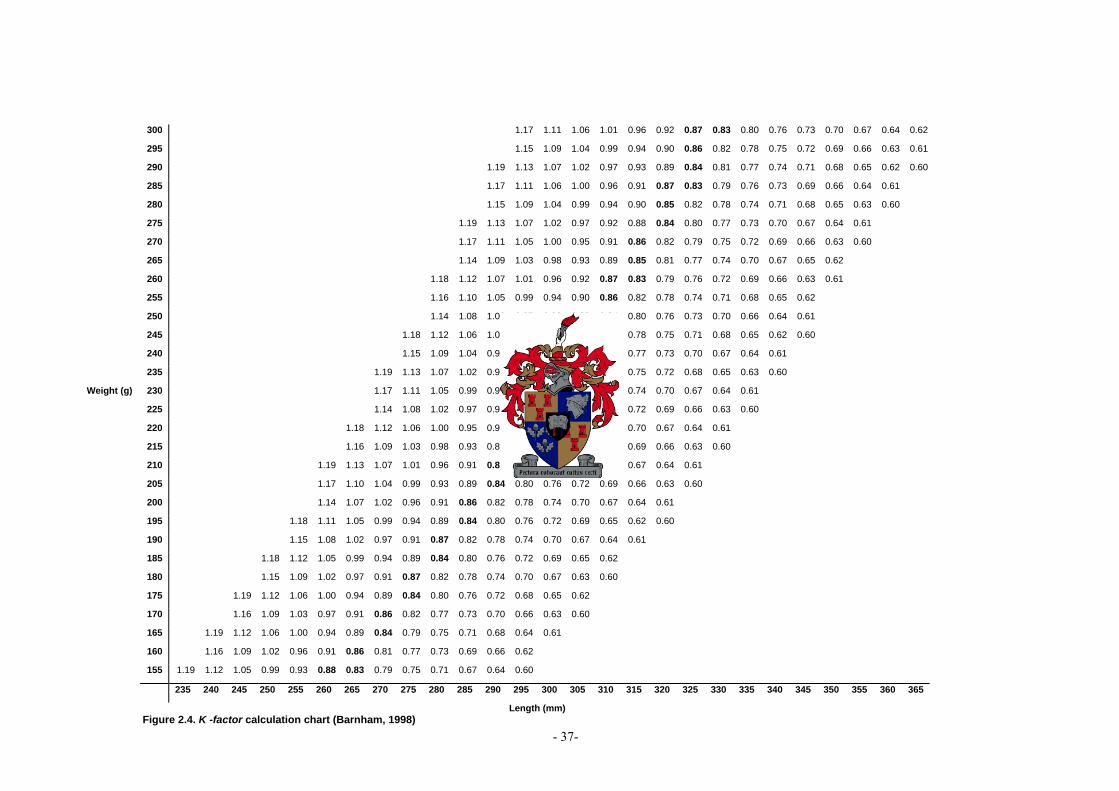
(Barnham, 1998). Figure 2.3 and 2.4 are K- factor calculation charts derived from the
results of this study for African Sharptooth catfish. The purpose of these charts is to assist a
catfish farmer to calculate the condition of the fish and to make it possible to determine if
the catfish is in a good condition or not.
From the results of the mean condition factor, one can see that the aquaculturist must strive
to reach a condition factor of 1.04 for African catfish, and if the condition factor is below
the average (0.856) the farmer knows that some factor in the production cycle is influencing
the condition of the fish and he/she can then investigate the rectify the problem.
- 36-
150 1.16 1.09 1.02 0.96 0.90 0.85 0.81 0.76 0.72 0.68 0.65 0.62
145 1.19 1.12 1.05 0.99 0.93 0.87 0.82 0.78 0.74 0.70 0.66 0.63
140 1.15 1.08 1.01 0.95 0.90 0.84 0.80 0.75 0.71 0.67 0.64 0.60
135 1.19 1.11 1.04 0.98 0.92 0.86 0.81 0.77 0.73 0.69 0.65 0.61
130 1.14 1.07 1.00 0.94 0.88 0.83 0.78 0.74 0.70 0.66 0.63
125 1.17 1.10 1.03 0.96 0.90 0.85 0.80 0.75 0.71 0.67 0.64 0.60
120 1.13 1.05 0.99 0.92 0.87 0.82 0.77 0.72 0.68 0.64 0.61
115 1.16 1.08 1.01 0.95 0.89 0.83 0.78 0.74 0.69 0.65 0.62
110 1.19 1.11 1.03 0.97 0.90 0.85 0.80 0.75 0.70 0.66 0.63
105 1.13 1.06 0.99 0.92 0.86 0.81 0.76 0.71 0.67 0.63 0.60
100 1.16 1.08 1.01 0.94 0.88 0.82 0.77 0.72 0.68 0.64 0.60
95 1.19 1.10 1.03 0.96 0.89 0.83 0.78 0.73 0.69 0.65 0.61
90 1.13 1.04 0.97 0.91 0.85 0.79 0.74 0.69 0.65 0.61
85 1.15 1.06 0.99 0.92 0.86 0.80 0.75 0.70 0.65 0.61
Weight 80 1.17 1.08 1.00 0.93 0.86 0.80 0.75 0.70 0.66 0.62
(g) 75 1.18 1.09 1.01 0.94 0.87 0.81 0.75 0.70 0.66 0.62
70 1.11 1.02 0.94 0.88 0.81 0.76 0.70 0.66 0.61
65 1.11 1.03 0.95 0.88 0.81 0.75 0.70 0.65 0.61
60 1.12 1.03 0.95 0.87 0.81 0.75 0.70 0.65 0.60
55 1.12 1.03 0.94 0.87 0.80 0.74 0.69 0.64
50 1.11 1.02 0.93 0.86 0.79 0.73 0.67 0.63
45 1.10 1.00 0.92 0.84 0.77 0.71 0.66 0.61
40 1.19 1.07 0.98 0.89 0.81 0.75 0.69 0.63
35 1.15 1.04 0.94 0.85 0.78 0.71 0.65 0.60
30 1.09 0.98 0.89 0.81 0.73 0.67 0.61
25 1.14 1.02 0.91 0.82 0.74 0.67 0.61
20 1.16 1.02 0.91 0.81 0.73 0.66
15 1.13 0.99 0.87 0.77 0.68 0.61
10 1.17 1.00 0.86 0.75 0.66
5 1.19 0.98 0.81 0.69
75 80 85 90 95 100 105 110 115 120 125 130 135 140 145 150 155 160 165 170 175 180 185 190 195 200 205 210 215 220 225 230 235 240 245 250 255 260 265 270 275 280 285 290
Length (mm)
Figure 2.4 K-factor calculation chart (Barnham, 1998)
- 37-
300 1.17 1.11 1.06 1.01 0.96 0.92 0.87 0.83 0.80 0.76 0.73 0.70 0.67 0.64 0.62
295 1.15 1.09 1.04 0.99 0.94 0.90 0.86 0.82 0.78 0.75 0.72 0.69 0.66 0.63 0.61
290 1.19 1.13 1.07 1.02 0.97 0.93 0.89 0.84 0.81 0.77 0.74 0.71 0.68 0.65 0.62 0.60
285 1.17 1.11 1.06 1.00 0.96 0.91 0.87 0.83 0.79 0.76 0.73 0.69 0.66 0.64 0.61
280 1.15 1.09 1.04 0.99 0.94 0.90 0.85 0.82 0.78 0.74 0.71 0.68 0.65 0.63 0.60
275 1.19 1.13 1.07 1.02 0.97 0.92 0.88 0.84 0.80 0.77 0.73 0.70 0.67 0.64 0.61
270 1.17 1.11 1.05 1.00 0.95 0.91 0.86 0.82 0.79 0.75 0.72 0.69 0.66 0.63 0.60
265 1.14 1.09 1.03 0.98 0.93 0.89 0.85 0.81 0.77 0.74 0.70 0.67 0.65 0.62
260 1.18 1.12 1.07 1.01 0.96 0.92 0.87 0.83 0.79 0.76 0.72 0.69 0.66 0.63 0.61
255 1.16 1.10 1.05 0.99 0.94 0.90 0.86 0.82 0.78 0.74 0.71 0.68 0.65 0.62
250 1.14 1.08 1.03 0.97 0.93 0.88 0.84 0.80 0.76 0.73 0.70 0.66 0.64 0.61
245 1.18 1.12 1.06 1.00 0.95 0.91 0.86 0.82 0.78 0.75 0.71 0.68 0.65 0.62 0.60
240 1.15 1.09 1.04 0.98 0.93 0.89 0.85 0.81 0.77 0.73 0.70 0.67 0.64 0.61
235 1.19 1.13 1.07 1.02 0.96 0.92 0.87 0.83 0.79 0.75 0.72 0.68 0.65 0.63 0.60
Weight (g) 230 1.17 1.11 1.05 0.99 0.94 0.90 0.85 0.81 0.77 0.74 0.70 0.67 0.64 0.61
225 1.14 1.08 1.02 0.97 0.92 0.88 0.83 0.79 0.76 0.72 0.69 0.66 0.63 0.60
220 1.18 1.12 1.06 1.00 0.95 0.90 0.86 0.81 0.78 0.74 0.70 0.67 0.64 0.61
215 1.16 1.09 1.03 0.98 0.93 0.88 0.84 0.80 0.76 0.72 0.69 0.66 0.63 0.60
210 1.19 1.13 1.07 1.01 0.96 0.91 0.86 0.82 0.78 0.74 0.70 0.67 0.64 0.61
205 1.17 1.10 1.04 0.99 0.93 0.89 0.84 0.80 0.76 0.72 0.69 0.66 0.63 0.60
200 1.14 1.07 1.02 0.96 0.91 0.86 0.82 0.78 0.74 0.70 0.67 0.64 0.61
195 1.18 1.11 1.05 0.99 0.94 0.89 0.84 0.80 0.76 0.72 0.69 0.65 0.62 0.60
190 1.15 1.08 1.02 0.97 0.91 0.87 0.82 0.78 0.74 0.70 0.67 0.64 0.61
185 1.18 1.12 1.05 0.99 0.94 0.89 0.84 0.80 0.76 0.72 0.69 0.65 0.62
180 1.15 1.09 1.02 0.97 0.91 0.87 0.82 0.78 0.74 0.70 0.67 0.63 0.60
175 1.19 1.12 1.06 1.00 0.94 0.89 0.84 0.80 0.76 0.72 0.68 0.65 0.62
170 1.16 1.09 1.03 0.97 0.91 0.86 0.82 0.77 0.73 0.70 0.66 0.63 0.60
165 1.19 1.12 1.06 1.00 0.94 0.89 0.84 0.79 0.75 0.71 0.68 0.64 0.61
160 1.16 1.09 1.02 0.96 0.91 0.86 0.81 0.77 0.73 0.69 0.66 0.62
155 1.19 1.12 1.05 0.99 0.93 0.88 0.83 0.79 0.75 0.71 0.67 0.64 0.60
235 240 245 250 255 260 265 270 275 280 285 290 295 300 305 310 315 320 325 330 335 340 345 350 355 360 365
Length (mm) Figure 2.4. K -factor calculation chart (Barnham, 1998)
- 38-
2.5. Conclusion
From these results it can be concluded that the condition factor is a helpful measurement
tool to assess differences between fishes in comparison to weight and length. Condition
factor can also be a helpful managerial parameter to reflect on a production period in as far
as to identify possible problems in relation to the efficiency of growth and general
wellbeing. Thus if the catfish has an isometric growth, the aquaculturist can then use
Fulton’s condition index K to calculate the condition of the African catfish by using the K-
factor calculation charts for African sharptooth catfish. According to this study, the
aquaculturist must strive for an above average condition factor of 1.04 for the African
Sharptooth catfish.
- 39-
2.6. References
BARNHAM, C. BAXTER, A., 1998. Condition factor, K for Salmonid fish. State of Victoria. Department of Primary Industries. Fisheries Notes. FN 0005. ISSN: 1444-2254. BRUTON, M.N., 1988. Systematics and biology of Clariid catfish. In Hecht, T. Uys, W. Britz, P.J. The culture of Sharptooth Catfish in Southern Africa. Pp 1-4.
ELI & KIT., 2004. Length-weight parameters for Clarias gariepinus. FishBase. World Web. http//www.fishbase.org, 2004/11/03. GONCALVES, L.M.S. BENTES, L. LINO, P.G. RIBEIRO, J. CANARIO, A.V.M.
ERZINI, K., 1997. Weight-length relationships for selected fish species of the small-scale commercial fisheries of the south and Southwest coast of Portugal.
Elsevier Fisheries research 30: 253-256. JONES, R.E. PETRELL, R.J. PAULY, D., 1999. Using modified length-weight
Relationships to assess the condition of fish. Aquaculture engineering 20: 261-276. LIZAMA, M. DE LOS, AP. AMBROSIO, A.M. 2002. Condition factor in nine species of
fish of the Characidae family in the upper Parana river floodplain, Brazil. Braz. J. Biol. 62(1): 113-124.
MASSER, M. P. RAKOCY, J. LOSORDO, T.M., 1999. Recirculating Aquaculture Tank
Production Systems. Management of Recirculating Systems. South regional aquaculture centre. Publication No. 452.
NIKOISKY, G.V. 1963. The ecology of fishes. Academic Press London and New York. pp 208. RATZ, H.J. LLORET, J. 2003. Variation in fish condition between Atlantic cod (Gadus
morhua) stocks, the effect on their productivity and management implications. Federal research centre. Elsevier Fisheries Research 60: 369-380.
SANTOS, M.N. GASPAR, M.B. VASCONCELOS, P. MONTEIRO, C.C., 2002. Weight-
length relationships for 50 selected fish species of the Algarve coast (Southern Portugal). Fisheries Research 59: 289-295.
UYS, W. HECHT, T., 1988. Chapter 6. Production and grow-out. In Hecht, T. Uys, W. Britz, P.J. The culture of Sharptooth Catfish in Southern Africa. Pp 68-69.
WILLIAMS, J.E. 2000. The coefficient of condition of fish. Chapter 13 in Schneider, James C. (ed). Manual of fisheries survey methods II: periodic updates. Michigan Department of Natural Resources, Fisheries special report 25, Ann Arbor.
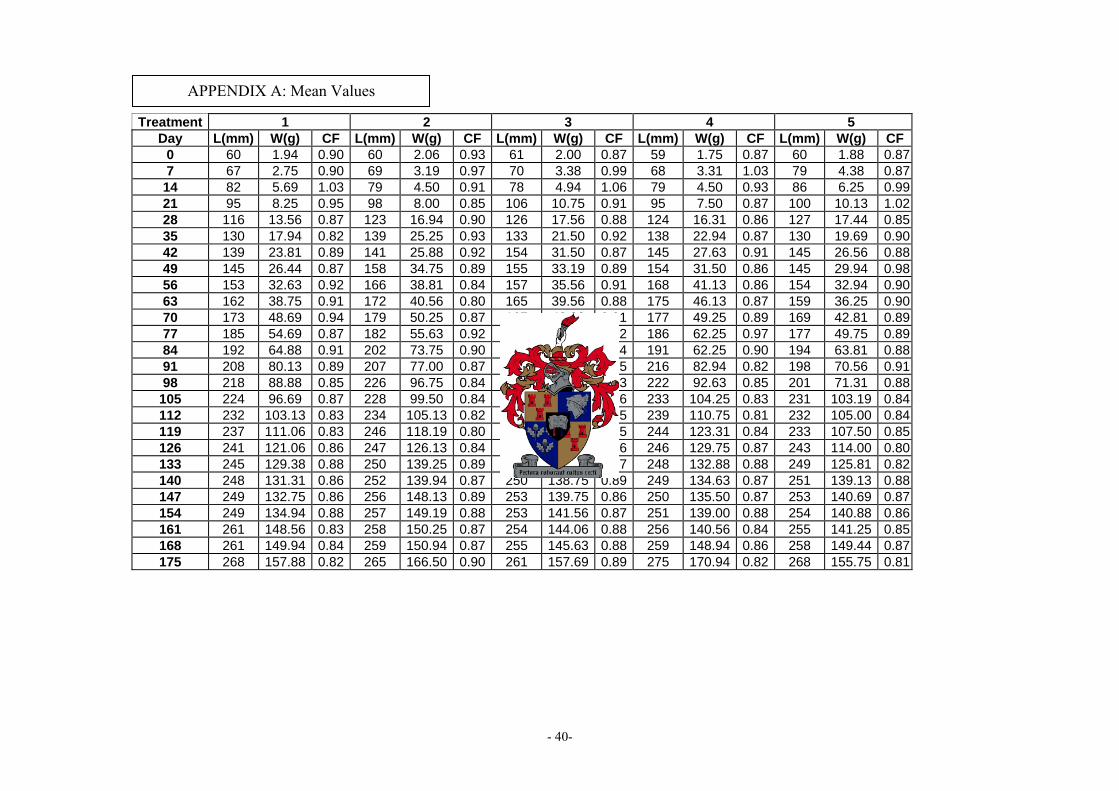
- 40-
Treatment 1 2 3 4 5 Day L(mm) W(g) CF L(mm) W(g) CF L(mm) W(g) CF L(mm) W(g) CF L(mm) W(g) CF
0 60 1.94 0.90 60 2.06 0.93 61 2.00 0.87 59 1.75 0.87 60 1.88 0.877 67 2.75 0.90 69 3.19 0.97 70 3.38 0.99 68 3.31 1.03 79 4.38 0.8714 82 5.69 1.03 79 4.50 0.91 78 4.94 1.06 79 4.50 0.93 86 6.25 0.9921 95 8.25 0.95 98 8.00 0.85 106 10.75 0.91 95 7.50 0.87 100 10.13 1.0228 116 13.56 0.87 123 16.94 0.90 126 17.56 0.88 124 16.31 0.86 127 17.44 0.8535 130 17.94 0.82 139 25.25 0.93 133 21.50 0.92 138 22.94 0.87 130 19.69 0.9042 139 23.81 0.89 141 25.88 0.92 154 31.50 0.87 145 27.63 0.91 145 26.56 0.8849 145 26.44 0.87 158 34.75 0.89 155 33.19 0.89 154 31.50 0.86 145 29.94 0.9856 153 32.63 0.92 166 38.81 0.84 157 35.56 0.91 168 41.13 0.86 154 32.94 0.9063 162 38.75 0.91 172 40.56 0.80 165 39.56 0.88 175 46.13 0.87 159 36.25 0.9070 173 48.69 0.94 179 50.25 0.87 167 42.38 0.91 177 49.25 0.89 169 42.81 0.8977 185 54.69 0.87 182 55.63 0.92 182 55.81 0.92 186 62.25 0.97 177 49.75 0.8984 192 64.88 0.91 202 73.75 0.90 193 67.69 0.94 191 62.25 0.90 194 63.81 0.8891 208 80.13 0.89 207 77.00 0.87 220 90.31 0.85 216 82.94 0.82 198 70.56 0.9198 218 88.88 0.85 226 96.75 0.84 232 103.88 0.83 222 92.63 0.85 201 71.31 0.88
105 224 96.69 0.87 228 99.50 0.84 235 111.88 0.86 233 104.25 0.83 231 103.19 0.84112 232 103.13 0.83 234 105.13 0.82 238 114.38 0.85 239 110.75 0.81 232 105.00 0.84119 237 111.06 0.83 246 118.19 0.80 239 117.31 0.85 244 123.31 0.84 233 107.50 0.85126 241 121.06 0.86 247 126.13 0.84 241 119.81 0.86 246 129.75 0.87 243 114.00 0.80133 245 129.38 0.88 250 139.25 0.89 241 122.31 0.87 248 132.88 0.88 249 125.81 0.82140 248 131.31 0.86 252 139.94 0.87 250 138.75 0.89 249 134.63 0.87 251 139.13 0.88147 249 132.75 0.86 256 148.13 0.89 253 139.75 0.86 250 135.50 0.87 253 140.69 0.87154 249 134.94 0.88 257 149.19 0.88 253 141.56 0.87 251 139.00 0.88 254 140.88 0.86161 261 148.56 0.83 258 150.25 0.87 254 144.06 0.88 256 140.56 0.84 255 141.25 0.85168 261 149.94 0.84 259 150.94 0.87 255 145.63 0.88 259 148.94 0.86 258 149.44 0.87175 268 157.88 0.82 265 166.50 0.90 261 157.69 0.89 275 170.94 0.82 268 155.75 0.81
APPENDIX A: Mean Values
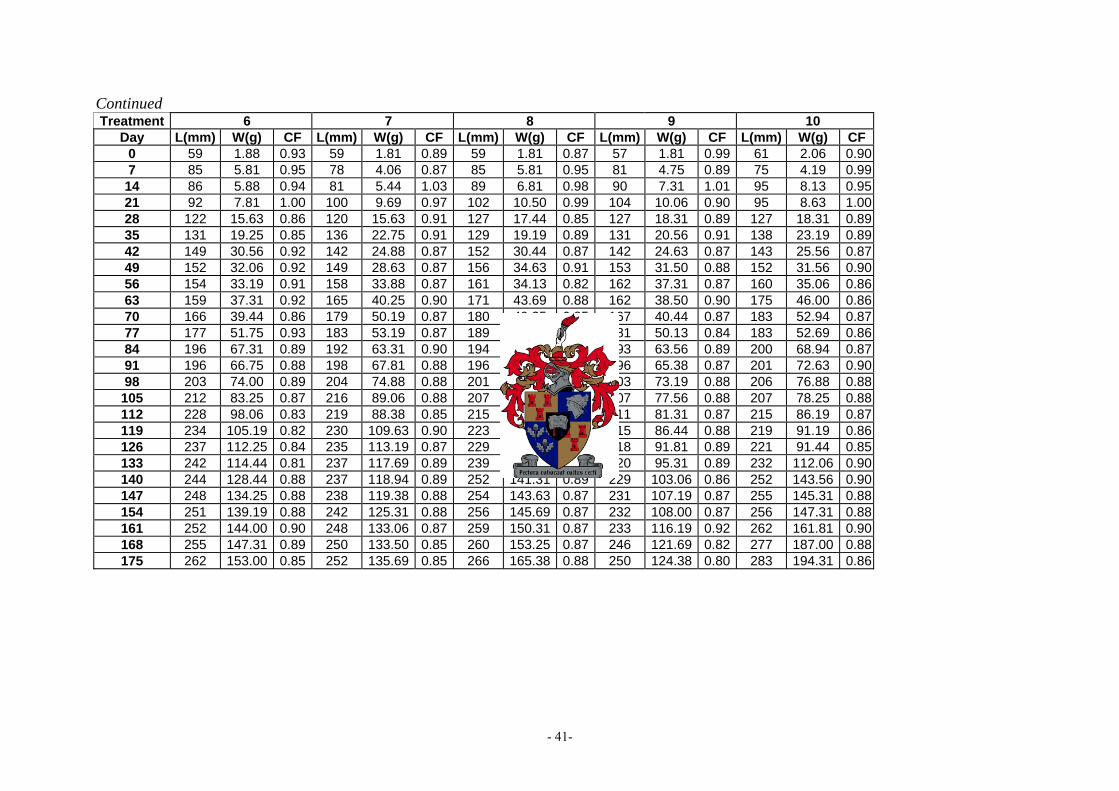
- 41-
Continued Treatment 6 7 8 9 10
Day L(mm) W(g) CF L(mm) W(g) CF L(mm) W(g) CF L(mm) W(g) CF L(mm) W(g) CF 0 59 1.88 0.93 59 1.81 0.89 59 1.81 0.87 57 1.81 0.99 61 2.06 0.907 85 5.81 0.95 78 4.06 0.87 85 5.81 0.95 81 4.75 0.89 75 4.19 0.9914 86 5.88 0.94 81 5.44 1.03 89 6.81 0.98 90 7.31 1.01 95 8.13 0.9521 92 7.81 1.00 100 9.69 0.97 102 10.50 0.99 104 10.06 0.90 95 8.63 1.0028 122 15.63 0.86 120 15.63 0.91 127 17.44 0.85 127 18.31 0.89 127 18.31 0.8935 131 19.25 0.85 136 22.75 0.91 129 19.19 0.89 131 20.56 0.91 138 23.19 0.8942 149 30.56 0.92 142 24.88 0.87 152 30.44 0.87 142 24.63 0.87 143 25.56 0.8749 152 32.06 0.92 149 28.63 0.87 156 34.63 0.91 153 31.50 0.88 152 31.56 0.9056 154 33.19 0.91 158 33.88 0.87 161 34.13 0.82 162 37.31 0.87 160 35.06 0.8663 159 37.31 0.92 165 40.25 0.90 171 43.69 0.88 162 38.50 0.90 175 46.00 0.8670 166 39.44 0.86 179 50.19 0.87 180 49.25 0.85 167 40.44 0.87 183 52.94 0.8777 177 51.75 0.93 183 53.19 0.87 189 58.06 0.87 181 50.13 0.84 183 52.69 0.8684 196 67.31 0.89 192 63.31 0.90 194 66.63 0.91 193 63.56 0.89 200 68.94 0.8791 196 66.75 0.88 198 67.81 0.88 196 66.75 0.88 196 65.38 0.87 201 72.63 0.9098 203 74.00 0.89 204 74.88 0.88 201 72.25 0.89 203 73.19 0.88 206 76.88 0.88
105 212 83.25 0.87 216 89.06 0.88 207 76.13 0.86 207 77.56 0.88 207 78.25 0.88112 228 98.06 0.83 219 88.38 0.85 215 86.25 0.87 211 81.31 0.87 215 86.19 0.87119 234 105.19 0.82 230 109.63 0.90 223 94.75 0.85 215 86.44 0.88 219 91.19 0.86126 237 112.25 0.84 235 113.19 0.87 229 103.88 0.86 218 91.81 0.89 221 91.44 0.85133 242 114.44 0.81 237 117.69 0.89 239 131.50 0.96 220 95.31 0.89 232 112.06 0.90140 244 128.44 0.88 237 118.94 0.89 252 141.31 0.89 229 103.06 0.86 252 143.56 0.90147 248 134.25 0.88 238 119.38 0.88 254 143.63 0.87 231 107.19 0.87 255 145.31 0.88154 251 139.19 0.88 242 125.31 0.88 256 145.69 0.87 232 108.00 0.87 256 147.31 0.88161 252 144.00 0.90 248 133.06 0.87 259 150.31 0.87 233 116.19 0.92 262 161.81 0.90168 255 147.31 0.89 250 133.50 0.85 260 153.25 0.87 246 121.69 0.82 277 187.00 0.88175 262 153.00 0.85 252 135.69 0.85 266 165.38 0.88 250 124.38 0.80 283 194.31 0.86
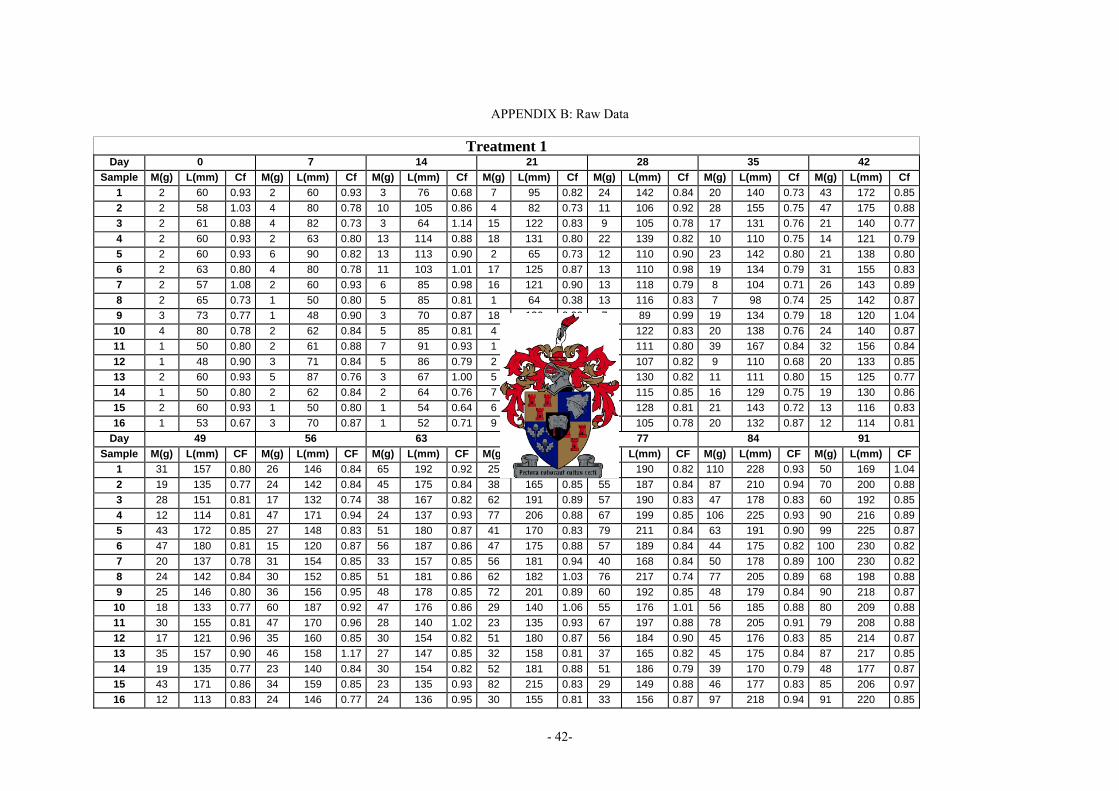
- 42-
APPENDIX B: Raw Data
Treatment 1 Day 0 7 14 21 28 35 42
Sample M(g) L(mm) Cf M(g) L(mm) Cf M(g) L(mm) Cf M(g) L(mm) Cf M(g) L(mm) Cf M(g) L(mm) Cf M(g) L(mm) Cf 1 2 60 0.93 2 60 0.93 3 76 0.68 7 95 0.82 24 142 0.84 20 140 0.73 43 172 0.852 2 58 1.03 4 80 0.78 10 105 0.86 4 82 0.73 11 106 0.92 28 155 0.75 47 175 0.883 2 61 0.88 4 82 0.73 3 64 1.14 15 122 0.83 9 105 0.78 17 131 0.76 21 140 0.774 2 60 0.93 2 63 0.80 13 114 0.88 18 131 0.80 22 139 0.82 10 110 0.75 14 121 0.795 2 60 0.93 6 90 0.82 13 113 0.90 2 65 0.73 12 110 0.90 23 142 0.80 21 138 0.806 2 63 0.80 4 80 0.78 11 103 1.01 17 125 0.87 13 110 0.98 19 134 0.79 31 155 0.837 2 57 1.08 2 60 0.93 6 85 0.98 16 121 0.90 13 118 0.79 8 104 0.71 26 143 0.898 2 65 0.73 1 50 0.80 5 85 0.81 1 64 0.38 13 116 0.83 7 98 0.74 25 142 0.879 3 73 0.77 1 48 0.90 3 70 0.87 18 126 0.90 7 89 0.99 19 134 0.79 18 120 1.04
10 4 80 0.78 2 62 0.84 5 85 0.81 4 88 0.59 15 122 0.83 20 138 0.76 24 140 0.8711 1 50 0.80 2 61 0.88 7 91 0.93 1 60 0.46 11 111 0.80 39 167 0.84 32 156 0.8412 1 48 0.90 3 71 0.84 5 86 0.79 2 75 0.47 10 107 0.82 9 110 0.68 20 133 0.8513 2 60 0.93 5 87 0.76 3 67 1.00 5 86 0.79 18 130 0.82 11 111 0.80 15 125 0.7714 1 50 0.80 2 62 0.84 2 64 0.76 7 96 0.79 13 115 0.85 16 129 0.75 19 130 0.8615 2 60 0.93 1 50 0.80 1 54 0.64 6 91 0.80 17 128 0.81 21 143 0.72 13 116 0.8316 1 53 0.67 3 70 0.87 1 52 0.71 9 98 0.96 9 105 0.78 20 132 0.87 12 114 0.81
Day 49 56 63 70 77 84 91 Sample M(g) L(mm) CF M(g) L(mm) CF M(g) L(mm) CF M(g) L(mm) CF M(g) L(mm) CF M(g) L(mm) CF M(g) L(mm) CF
1 31 157 0.80 26 146 0.84 65 192 0.92 25 138 0.95 56 190 0.82 110 228 0.93 50 169 1.042 19 135 0.77 24 142 0.84 45 175 0.84 38 165 0.85 55 187 0.84 87 210 0.94 70 200 0.883 28 151 0.81 17 132 0.74 38 167 0.82 62 191 0.89 57 190 0.83 47 178 0.83 60 192 0.854 12 114 0.81 47 171 0.94 24 137 0.93 77 206 0.88 67 199 0.85 106 225 0.93 90 216 0.895 43 172 0.85 27 148 0.83 51 180 0.87 41 170 0.83 79 211 0.84 63 191 0.90 99 225 0.876 47 180 0.81 15 120 0.87 56 187 0.86 47 175 0.88 57 189 0.84 44 175 0.82 100 230 0.827 20 137 0.78 31 154 0.85 33 157 0.85 56 181 0.94 40 168 0.84 50 178 0.89 100 230 0.828 24 142 0.84 30 152 0.85 51 181 0.86 62 182 1.03 76 217 0.74 77 205 0.89 68 198 0.889 25 146 0.80 36 156 0.95 48 178 0.85 72 201 0.89 60 192 0.85 48 179 0.84 90 218 0.87
10 18 133 0.77 60 187 0.92 47 176 0.86 29 140 1.06 55 176 1.01 56 185 0.88 80 209 0.8811 30 155 0.81 47 170 0.96 28 140 1.02 23 135 0.93 67 197 0.88 78 205 0.91 79 208 0.8812 17 121 0.96 35 160 0.85 30 154 0.82 51 180 0.87 56 184 0.90 45 176 0.83 85 214 0.8713 35 157 0.90 46 158 1.17 27 147 0.85 32 158 0.81 37 165 0.82 45 175 0.84 87 217 0.8514 19 135 0.77 23 140 0.84 30 154 0.82 52 181 0.88 51 186 0.79 39 170 0.79 48 177 0.8715 43 171 0.86 34 159 0.85 23 135 0.93 82 215 0.83 29 149 0.88 46 177 0.83 85 206 0.9716 12 113 0.83 24 146 0.77 24 136 0.95 30 155 0.81 33 156 0.87 97 218 0.94 91 220 0.85
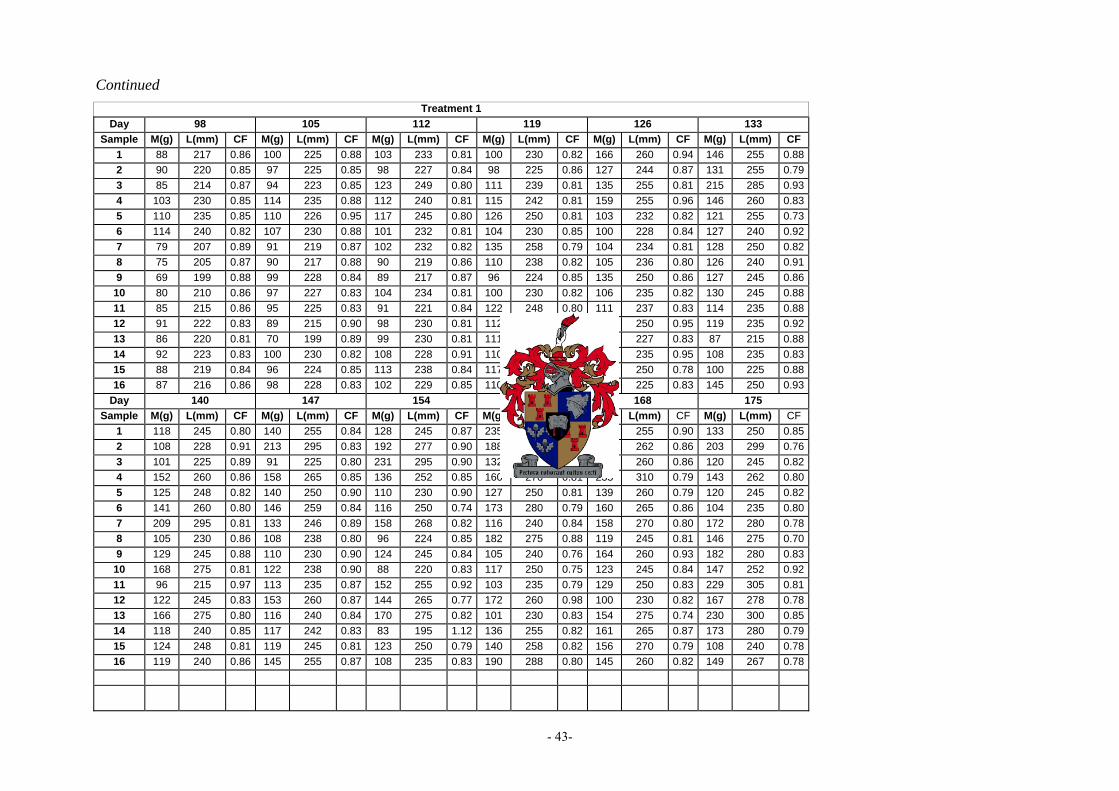
- 43-
Continued Treatment 1
Day 98 105 112 119 126 133 Sample M(g) L(mm) CF M(g) L(mm) CF M(g) L(mm) CF M(g) L(mm) CF M(g) L(mm) CF M(g) L(mm) CF
1 88 217 0.86 100 225 0.88 103 233 0.81 100 230 0.82 166 260 0.94 146 255 0.882 90 220 0.85 97 225 0.85 98 227 0.84 98 225 0.86 127 244 0.87 131 255 0.793 85 214 0.87 94 223 0.85 123 249 0.80 111 239 0.81 135 255 0.81 215 285 0.934 103 230 0.85 114 235 0.88 112 240 0.81 115 242 0.81 159 255 0.96 146 260 0.835 110 235 0.85 110 226 0.95 117 245 0.80 126 250 0.81 103 232 0.82 121 255 0.736 114 240 0.82 107 230 0.88 101 232 0.81 104 230 0.85 100 228 0.84 127 240 0.927 79 207 0.89 91 219 0.87 102 232 0.82 135 258 0.79 104 234 0.81 128 250 0.828 75 205 0.87 90 217 0.88 90 219 0.86 110 238 0.82 105 236 0.80 126 240 0.919 69 199 0.88 99 228 0.84 89 217 0.87 96 224 0.85 135 250 0.86 127 245 0.86
10 80 210 0.86 97 227 0.83 104 234 0.81 100 230 0.82 106 235 0.82 130 245 0.8811 85 215 0.86 95 225 0.83 91 221 0.84 122 248 0.80 111 237 0.83 114 235 0.8812 91 222 0.83 89 215 0.90 98 230 0.81 112 238 0.83 149 250 0.95 119 235 0.9213 86 220 0.81 70 199 0.89 99 230 0.81 111 235 0.86 97 227 0.83 87 215 0.8814 92 223 0.83 100 230 0.82 108 228 0.91 110 233 0.87 123 235 0.95 108 235 0.8315 88 219 0.84 96 224 0.85 113 238 0.84 117 242 0.83 122 250 0.78 100 225 0.8816 87 216 0.86 98 228 0.83 102 229 0.85 110 235 0.85 95 225 0.83 145 250 0.93
Day 140 147 154 161 168 175 Sample M(g) L(mm) CF M(g) L(mm) CF M(g) L(mm) CF M(g) L(mm) CF M(g) L(mm) CF M(g) L(mm) CF
1 118 245 0.80 140 255 0.84 128 245 0.87 235 320 0.72 150 255 0.90 133 250 0.852 108 228 0.91 213 295 0.83 192 277 0.90 188 280 0.86 155 262 0.86 203 299 0.763 101 225 0.89 91 225 0.80 231 295 0.90 132 250 0.84 151 260 0.86 120 245 0.824 152 260 0.86 158 265 0.85 136 252 0.85 160 270 0.81 235 310 0.79 143 262 0.805 125 248 0.82 140 250 0.90 110 230 0.90 127 250 0.81 139 260 0.79 120 245 0.826 141 260 0.80 146 259 0.84 116 250 0.74 173 280 0.79 160 265 0.86 104 235 0.807 209 295 0.81 133 246 0.89 158 268 0.82 116 240 0.84 158 270 0.80 172 280 0.788 105 230 0.86 108 238 0.80 96 224 0.85 182 275 0.88 119 245 0.81 146 275 0.709 129 245 0.88 110 230 0.90 124 245 0.84 105 240 0.76 164 260 0.93 182 280 0.83
10 168 275 0.81 122 238 0.90 88 220 0.83 117 250 0.75 123 245 0.84 147 252 0.9211 96 215 0.97 113 235 0.87 152 255 0.92 103 235 0.79 129 250 0.83 229 305 0.8112 122 245 0.83 153 260 0.87 144 265 0.77 172 260 0.98 100 230 0.82 167 278 0.7813 166 275 0.80 116 240 0.84 170 275 0.82 101 230 0.83 154 275 0.74 230 300 0.8514 118 240 0.85 117 242 0.83 83 195 1.12 136 255 0.82 161 265 0.87 173 280 0.7915 124 248 0.81 119 245 0.81 123 250 0.79 140 258 0.82 156 270 0.79 108 240 0.7816 119 240 0.86 145 255 0.87 108 235 0.83 190 288 0.80 145 260 0.82 149 267 0.78
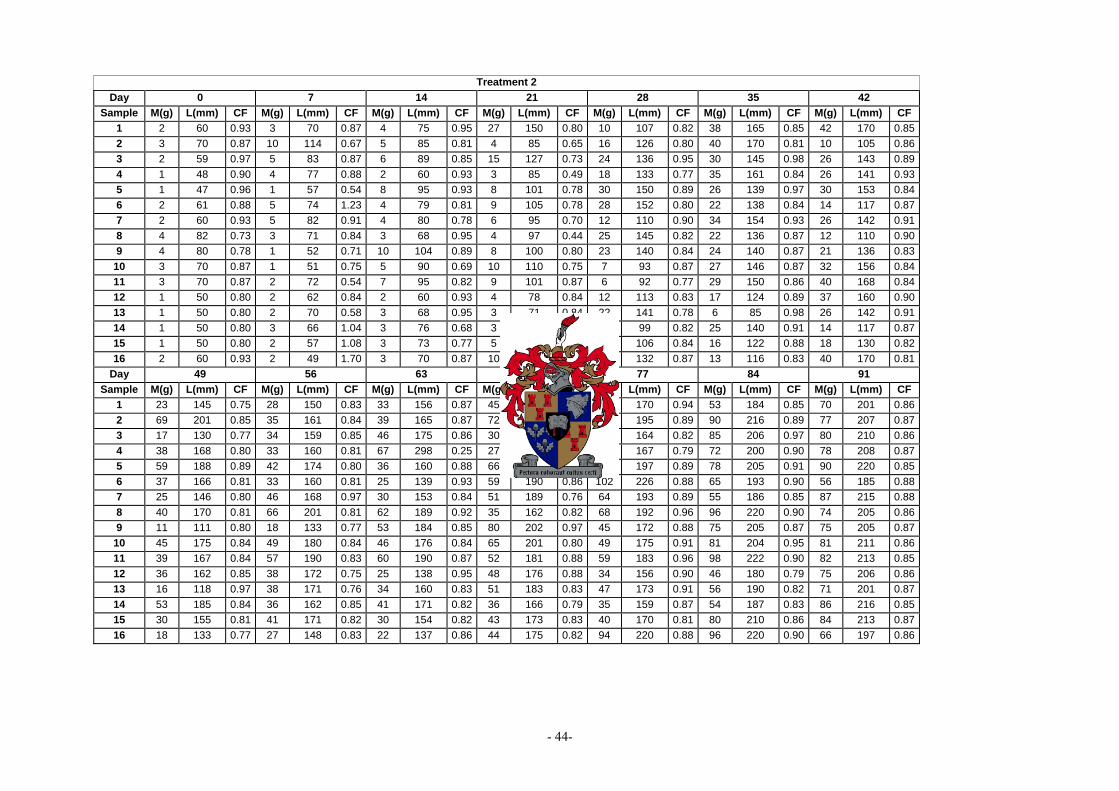
- 44-
Treatment 2 Day 0 7 14 21 28 35 42
Sample M(g) L(mm) CF M(g) L(mm) CF M(g) L(mm) CF M(g) L(mm) CF M(g) L(mm) CF M(g) L(mm) CF M(g) L(mm) CF 1 2 60 0.93 3 70 0.87 4 75 0.95 27 150 0.80 10 107 0.82 38 165 0.85 42 170 0.852 3 70 0.87 10 114 0.67 5 85 0.81 4 85 0.65 16 126 0.80 40 170 0.81 10 105 0.863 2 59 0.97 5 83 0.87 6 89 0.85 15 127 0.73 24 136 0.95 30 145 0.98 26 143 0.894 1 48 0.90 4 77 0.88 2 60 0.93 3 85 0.49 18 133 0.77 35 161 0.84 26 141 0.935 1 47 0.96 1 57 0.54 8 95 0.93 8 101 0.78 30 150 0.89 26 139 0.97 30 153 0.846 2 61 0.88 5 74 1.23 4 79 0.81 9 105 0.78 28 152 0.80 22 138 0.84 14 117 0.877 2 60 0.93 5 82 0.91 4 80 0.78 6 95 0.70 12 110 0.90 34 154 0.93 26 142 0.918 4 82 0.73 3 71 0.84 3 68 0.95 4 97 0.44 25 145 0.82 22 136 0.87 12 110 0.909 4 80 0.78 1 52 0.71 10 104 0.89 8 100 0.80 23 140 0.84 24 140 0.87 21 136 0.83
10 3 70 0.87 1 51 0.75 5 90 0.69 10 110 0.75 7 93 0.87 27 146 0.87 32 156 0.8411 3 70 0.87 2 72 0.54 7 95 0.82 9 101 0.87 6 92 0.77 29 150 0.86 40 168 0.8412 1 50 0.80 2 62 0.84 2 60 0.93 4 78 0.84 12 113 0.83 17 124 0.89 37 160 0.9013 1 50 0.80 2 70 0.58 3 68 0.95 3 71 0.84 22 141 0.78 6 85 0.98 26 142 0.9114 1 50 0.80 3 66 1.04 3 76 0.68 3 65 1.09 8 99 0.82 25 140 0.91 14 117 0.8715 1 50 0.80 2 57 1.08 3 73 0.77 5 84 0.84 10 106 0.84 16 122 0.88 18 130 0.8216 2 60 0.93 2 49 1.70 3 70 0.87 10 111 0.73 20 132 0.87 13 116 0.83 40 170 0.81
Day 49 56 63 70 77 84 91 Sample M(g) L(mm) CF M(g) L(mm) CF M(g) L(mm) CF M(g) L(mm) CF M(g) L(mm) CF M(g) L(mm) CF M(g) L(mm) CF
1 23 145 0.75 28 150 0.83 33 156 0.87 45 174 0.85 46 170 0.94 53 184 0.85 70 201 0.862 69 201 0.85 35 161 0.84 39 165 0.87 72 201 0.89 66 195 0.89 90 216 0.89 77 207 0.873 17 130 0.77 34 159 0.85 46 175 0.86 30 152 0.85 36 164 0.82 85 206 0.97 80 210 0.864 38 168 0.80 33 160 0.81 67 298 0.25 27 145 0.89 37 167 0.79 72 200 0.90 78 208 0.875 59 188 0.89 42 174 0.80 36 160 0.88 66 196 0.88 68 197 0.89 78 205 0.91 90 220 0.856 37 166 0.81 33 160 0.81 25 139 0.93 59 190 0.86 102 226 0.88 65 193 0.90 56 185 0.887 25 146 0.80 46 168 0.97 30 153 0.84 51 189 0.76 64 193 0.89 55 186 0.85 87 215 0.888 40 170 0.81 66 201 0.81 62 189 0.92 35 162 0.82 68 192 0.96 96 220 0.90 74 205 0.869 11 111 0.80 18 133 0.77 53 184 0.85 80 202 0.97 45 172 0.88 75 205 0.87 75 205 0.87
10 45 175 0.84 49 180 0.84 46 176 0.84 65 201 0.80 49 175 0.91 81 204 0.95 81 211 0.8611 39 167 0.84 57 190 0.83 60 190 0.87 52 181 0.88 59 183 0.96 98 222 0.90 82 213 0.8512 36 162 0.85 38 172 0.75 25 138 0.95 48 176 0.88 34 156 0.90 46 180 0.79 75 206 0.8613 16 118 0.97 38 171 0.76 34 160 0.83 51 183 0.83 47 173 0.91 56 190 0.82 71 201 0.8714 53 185 0.84 36 162 0.85 41 171 0.82 36 166 0.79 35 159 0.87 54 187 0.83 86 216 0.8515 30 155 0.81 41 171 0.82 30 154 0.82 43 173 0.83 40 170 0.81 80 210 0.86 84 213 0.8716 18 133 0.77 27 148 0.83 22 137 0.86 44 175 0.82 94 220 0.88 96 220 0.90 66 197 0.86
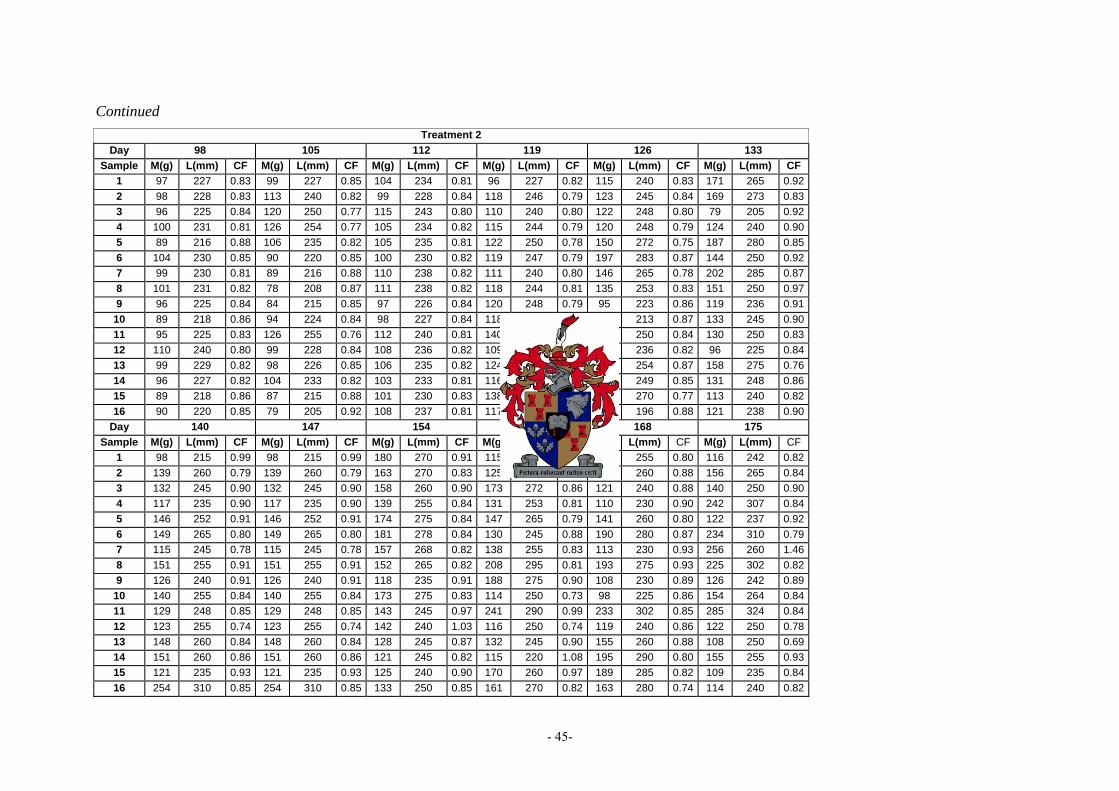
- 45-
Continued Treatment 2
Day 98 105 112 119 126 133 Sample M(g) L(mm) CF M(g) L(mm) CF M(g) L(mm) CF M(g) L(mm) CF M(g) L(mm) CF M(g) L(mm) CF
1 97 227 0.83 99 227 0.85 104 234 0.81 96 227 0.82 115 240 0.83 171 265 0.922 98 228 0.83 113 240 0.82 99 228 0.84 118 246 0.79 123 245 0.84 169 273 0.833 96 225 0.84 120 250 0.77 115 243 0.80 110 240 0.80 122 248 0.80 79 205 0.924 100 231 0.81 126 254 0.77 105 234 0.82 115 244 0.79 120 248 0.79 124 240 0.905 89 216 0.88 106 235 0.82 105 235 0.81 122 250 0.78 150 272 0.75 187 280 0.856 104 230 0.85 90 220 0.85 100 230 0.82 119 247 0.79 197 283 0.87 144 250 0.927 99 230 0.81 89 216 0.88 110 238 0.82 111 240 0.80 146 265 0.78 202 285 0.878 101 231 0.82 78 208 0.87 111 238 0.82 118 244 0.81 135 253 0.83 151 250 0.979 96 225 0.84 84 215 0.85 97 226 0.84 120 248 0.79 95 223 0.86 119 236 0.91
10 89 218 0.86 94 224 0.84 98 227 0.84 118 245 0.80 84 213 0.87 133 245 0.9011 95 225 0.83 126 255 0.76 112 240 0.81 140 265 0.75 132 250 0.84 130 250 0.8312 110 240 0.80 99 228 0.84 108 236 0.82 109 238 0.81 108 236 0.82 96 225 0.8413 99 229 0.82 98 226 0.85 106 235 0.82 124 250 0.79 142 254 0.87 158 275 0.7614 96 227 0.82 104 233 0.82 103 233 0.81 116 243 0.81 131 249 0.85 131 248 0.8615 89 218 0.86 87 215 0.88 101 230 0.83 138 257 0.81 152 270 0.77 113 240 0.8216 90 220 0.85 79 205 0.92 108 237 0.81 117 244 0.81 66 196 0.88 121 238 0.90
Day 140 147 154 161 168 175 Sample M(g) L(mm) CF M(g) L(mm) CF M(g) L(mm) CF M(g) L(mm) CF M(g) L(mm) CF M(g) L(mm) CF
1 98 215 0.99 98 215 0.99 180 270 0.91 115 245 0.78 133 255 0.80 116 242 0.822 139 260 0.79 139 260 0.79 163 270 0.83 125 242 0.88 154 260 0.88 156 265 0.843 132 245 0.90 132 245 0.90 158 260 0.90 173 272 0.86 121 240 0.88 140 250 0.904 117 235 0.90 117 235 0.90 139 255 0.84 131 253 0.81 110 230 0.90 242 307 0.845 146 252 0.91 146 252 0.91 174 275 0.84 147 265 0.79 141 260 0.80 122 237 0.926 149 265 0.80 149 265 0.80 181 278 0.84 130 245 0.88 190 280 0.87 234 310 0.797 115 245 0.78 115 245 0.78 157 268 0.82 138 255 0.83 113 230 0.93 256 260 1.468 151 255 0.91 151 255 0.91 152 265 0.82 208 295 0.81 193 275 0.93 225 302 0.829 126 240 0.91 126 240 0.91 118 235 0.91 188 275 0.90 108 230 0.89 126 242 0.89
10 140 255 0.84 140 255 0.84 173 275 0.83 114 250 0.73 98 225 0.86 154 264 0.8411 129 248 0.85 129 248 0.85 143 245 0.97 241 290 0.99 233 302 0.85 285 324 0.8412 123 255 0.74 123 255 0.74 142 240 1.03 116 250 0.74 119 240 0.86 122 250 0.7813 148 260 0.84 148 260 0.84 128 245 0.87 132 245 0.90 155 260 0.88 108 250 0.6914 151 260 0.86 151 260 0.86 121 245 0.82 115 220 1.08 195 290 0.80 155 255 0.9315 121 235 0.93 121 235 0.93 125 240 0.90 170 260 0.97 189 285 0.82 109 235 0.8416 254 310 0.85 254 310 0.85 133 250 0.85 161 270 0.82 163 280 0.74 114 240 0.82
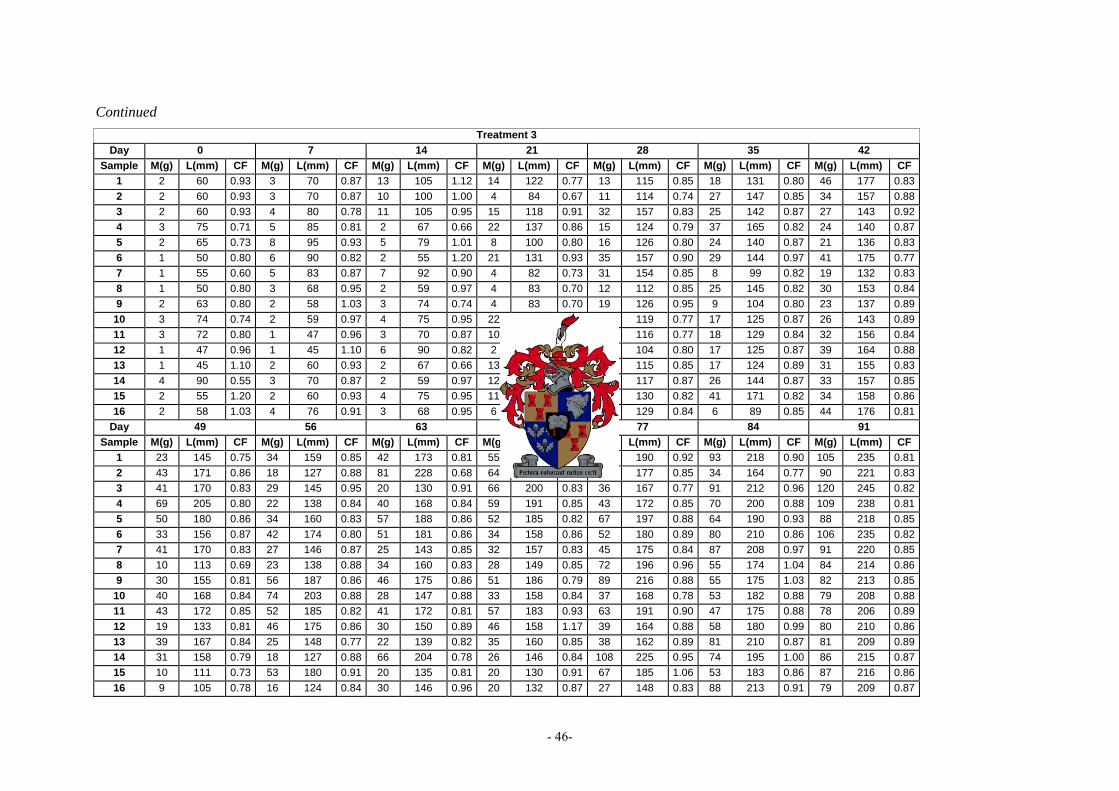
- 46-
Continued Treatment 3
Day 0 7 14 21 28 35 42 Sample M(g) L(mm) CF M(g) L(mm) CF M(g) L(mm) CF M(g) L(mm) CF M(g) L(mm) CF M(g) L(mm) CF M(g) L(mm) CF
1 2 60 0.93 3 70 0.87 13 105 1.12 14 122 0.77 13 115 0.85 18 131 0.80 46 177 0.832 2 60 0.93 3 70 0.87 10 100 1.00 4 84 0.67 11 114 0.74 27 147 0.85 34 157 0.883 2 60 0.93 4 80 0.78 11 105 0.95 15 118 0.91 32 157 0.83 25 142 0.87 27 143 0.924 3 75 0.71 5 85 0.81 2 67 0.66 22 137 0.86 15 124 0.79 37 165 0.82 24 140 0.875 2 65 0.73 8 95 0.93 5 79 1.01 8 100 0.80 16 126 0.80 24 140 0.87 21 136 0.836 1 50 0.80 6 90 0.82 2 55 1.20 21 131 0.93 35 157 0.90 29 144 0.97 41 175 0.777 1 55 0.60 5 83 0.87 7 92 0.90 4 82 0.73 31 154 0.85 8 99 0.82 19 132 0.838 1 50 0.80 3 68 0.95 2 59 0.97 4 83 0.70 12 112 0.85 25 145 0.82 30 153 0.849 2 63 0.80 2 58 1.03 3 74 0.74 4 83 0.70 19 126 0.95 9 104 0.80 23 137 0.89
10 3 74 0.74 2 59 0.97 4 75 0.95 22 130 1.00 13 119 0.77 17 125 0.87 26 143 0.8911 3 72 0.80 1 47 0.96 3 70 0.87 10 113 0.69 12 116 0.77 18 129 0.84 32 156 0.8412 1 47 0.96 1 45 1.10 6 90 0.82 2 65 0.73 9 104 0.80 17 125 0.87 39 164 0.8813 1 45 1.10 2 60 0.93 2 67 0.66 13 121 0.73 13 115 0.85 17 124 0.89 31 155 0.8314 4 90 0.55 3 70 0.87 2 59 0.97 12 119 0.71 14 117 0.87 26 144 0.87 33 157 0.8515 2 55 1.20 2 60 0.93 4 75 0.95 11 115 0.72 18 130 0.82 41 171 0.82 34 158 0.8616 2 58 1.03 4 76 0.91 3 68 0.95 6 91 0.80 18 129 0.84 6 89 0.85 44 176 0.81
Day 49 56 63 70 77 84 91 Sample M(g) L(mm) CF M(g) L(mm) CF M(g) L(mm) CF M(g) L(mm) CF M(g) L(mm) CF M(g) L(mm) CF M(g) L(mm) CF
1 23 145 0.75 34 159 0.85 42 173 0.81 55 182 0.91 63 190 0.92 93 218 0.90 105 235 0.812 43 171 0.86 18 127 0.88 81 228 0.68 64 197 0.84 47 177 0.85 34 164 0.77 90 221 0.833 41 170 0.83 29 145 0.95 20 130 0.91 66 200 0.83 36 167 0.77 91 212 0.96 120 245 0.824 69 205 0.80 22 138 0.84 40 168 0.84 59 191 0.85 43 172 0.85 70 200 0.88 109 238 0.815 50 180 0.86 34 160 0.83 57 188 0.86 52 185 0.82 67 197 0.88 64 190 0.93 88 218 0.856 33 156 0.87 42 174 0.80 51 181 0.86 34 158 0.86 52 180 0.89 80 210 0.86 106 235 0.827 41 170 0.83 27 146 0.87 25 143 0.85 32 157 0.83 45 175 0.84 87 208 0.97 91 220 0.858 10 113 0.69 23 138 0.88 34 160 0.83 28 149 0.85 72 196 0.96 55 174 1.04 84 214 0.869 30 155 0.81 56 187 0.86 46 175 0.86 51 186 0.79 89 216 0.88 55 175 1.03 82 213 0.85
10 40 168 0.84 74 203 0.88 28 147 0.88 33 158 0.84 37 168 0.78 53 182 0.88 79 208 0.8811 43 172 0.85 52 185 0.82 41 172 0.81 57 183 0.93 63 191 0.90 47 175 0.88 78 206 0.8912 19 133 0.81 46 175 0.86 30 150 0.89 46 158 1.17 39 164 0.88 58 180 0.99 80 210 0.8613 39 167 0.84 25 148 0.77 22 139 0.82 35 160 0.85 38 162 0.89 81 210 0.87 81 209 0.8914 31 158 0.79 18 127 0.88 66 204 0.78 26 146 0.84 108 225 0.95 74 195 1.00 86 215 0.8715 10 111 0.73 53 180 0.91 20 135 0.81 20 130 0.91 67 185 1.06 53 183 0.86 87 216 0.8616 9 105 0.78 16 124 0.84 30 146 0.96 20 132 0.87 27 148 0.83 88 213 0.91 79 209 0.87
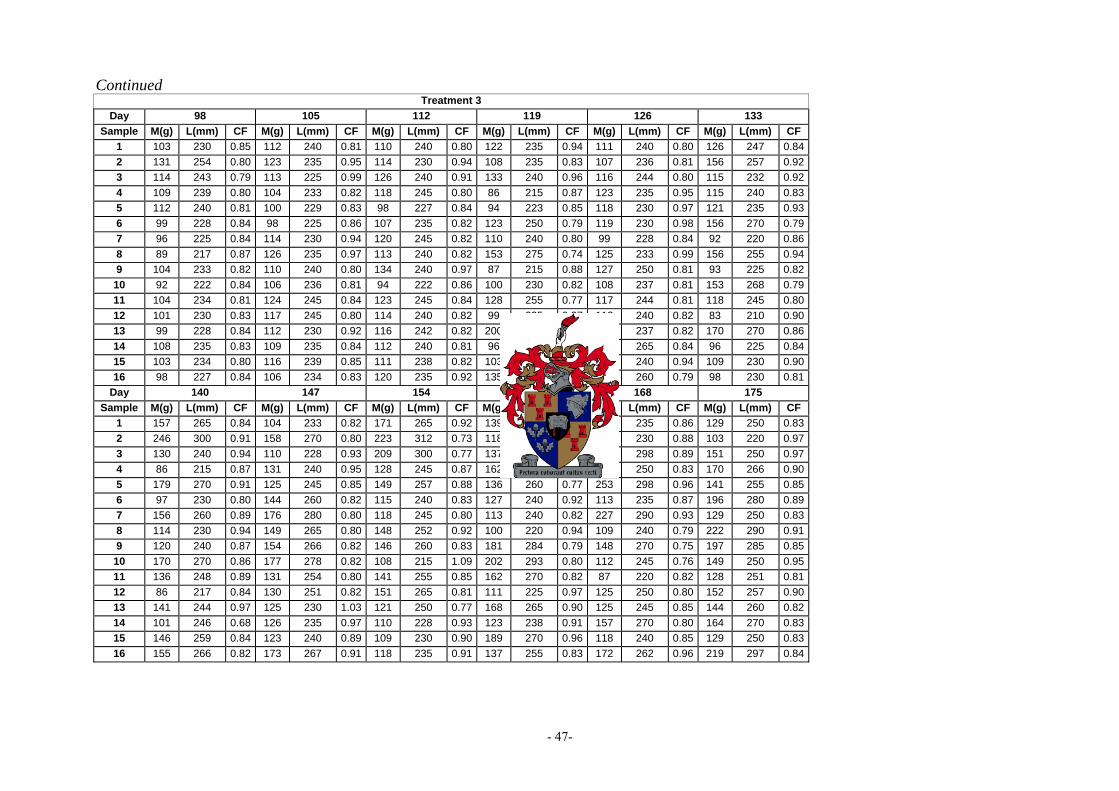
- 47-
Continued Treatment 3
Day 98 105 112 119 126 133 Sample M(g) L(mm) CF M(g) L(mm) CF M(g) L(mm) CF M(g) L(mm) CF M(g) L(mm) CF M(g) L(mm) CF
1 103 230 0.85 112 240 0.81 110 240 0.80 122 235 0.94 111 240 0.80 126 247 0.842 131 254 0.80 123 235 0.95 114 230 0.94 108 235 0.83 107 236 0.81 156 257 0.923 114 243 0.79 113 225 0.99 126 240 0.91 133 240 0.96 116 244 0.80 115 232 0.924 109 239 0.80 104 233 0.82 118 245 0.80 86 215 0.87 123 235 0.95 115 240 0.835 112 240 0.81 100 229 0.83 98 227 0.84 94 223 0.85 118 230 0.97 121 235 0.936 99 228 0.84 98 225 0.86 107 235 0.82 123 250 0.79 119 230 0.98 156 270 0.797 96 225 0.84 114 230 0.94 120 245 0.82 110 240 0.80 99 228 0.84 92 220 0.868 89 217 0.87 126 235 0.97 113 240 0.82 153 275 0.74 125 233 0.99 156 255 0.949 104 233 0.82 110 240 0.80 134 240 0.97 87 215 0.88 127 250 0.81 93 225 0.82
10 92 222 0.84 106 236 0.81 94 222 0.86 100 230 0.82 108 237 0.81 153 268 0.7911 104 234 0.81 124 245 0.84 123 245 0.84 128 255 0.77 117 244 0.81 118 245 0.8012 101 230 0.83 117 245 0.80 114 240 0.82 99 225 0.87 113 240 0.82 83 210 0.9013 99 228 0.84 112 230 0.92 116 242 0.82 200 290 0.82 109 237 0.82 170 270 0.8614 108 235 0.83 109 235 0.84 112 240 0.81 96 220 0.90 156 265 0.84 96 225 0.8415 103 234 0.80 116 239 0.85 111 238 0.82 103 230 0.85 130 240 0.94 109 230 0.9016 98 227 0.84 106 234 0.83 120 235 0.92 135 253 0.83 139 260 0.79 98 230 0.81
Day 140 147 154 161 168 175 Sample M(g) L(mm) CF M(g) L(mm) CF M(g) L(mm) CF M(g) L(mm) CF M(g) L(mm) CF M(g) L(mm) CF
1 157 265 0.84 104 233 0.82 171 265 0.92 139 245 0.95 112 235 0.86 129 250 0.832 246 300 0.91 158 270 0.80 223 312 0.73 118 242 0.83 107 230 0.88 103 220 0.973 130 240 0.94 110 228 0.93 209 300 0.77 137 250 0.88 235 298 0.89 151 250 0.974 86 215 0.87 131 240 0.95 128 245 0.87 162 260 0.92 130 250 0.83 170 266 0.905 179 270 0.91 125 245 0.85 149 257 0.88 136 260 0.77 253 298 0.96 141 255 0.856 97 230 0.80 144 260 0.82 115 240 0.83 127 240 0.92 113 235 0.87 196 280 0.897 156 260 0.89 176 280 0.80 118 245 0.80 113 240 0.82 227 290 0.93 129 250 0.838 114 230 0.94 149 265 0.80 148 252 0.92 100 220 0.94 109 240 0.79 222 290 0.919 120 240 0.87 154 266 0.82 146 260 0.83 181 284 0.79 148 270 0.75 197 285 0.85
10 170 270 0.86 177 278 0.82 108 215 1.09 202 293 0.80 112 245 0.76 149 250 0.9511 136 248 0.89 131 254 0.80 141 255 0.85 162 270 0.82 87 220 0.82 128 251 0.8112 86 217 0.84 130 251 0.82 151 265 0.81 111 225 0.97 125 250 0.80 152 257 0.9013 141 244 0.97 125 230 1.03 121 250 0.77 168 265 0.90 125 245 0.85 144 260 0.8214 101 246 0.68 126 235 0.97 110 228 0.93 123 238 0.91 157 270 0.80 164 270 0.8315 146 259 0.84 123 240 0.89 109 230 0.90 189 270 0.96 118 240 0.85 129 250 0.8316 155 266 0.82 173 267 0.91 118 235 0.91 137 255 0.83 172 262 0.96 219 297 0.84
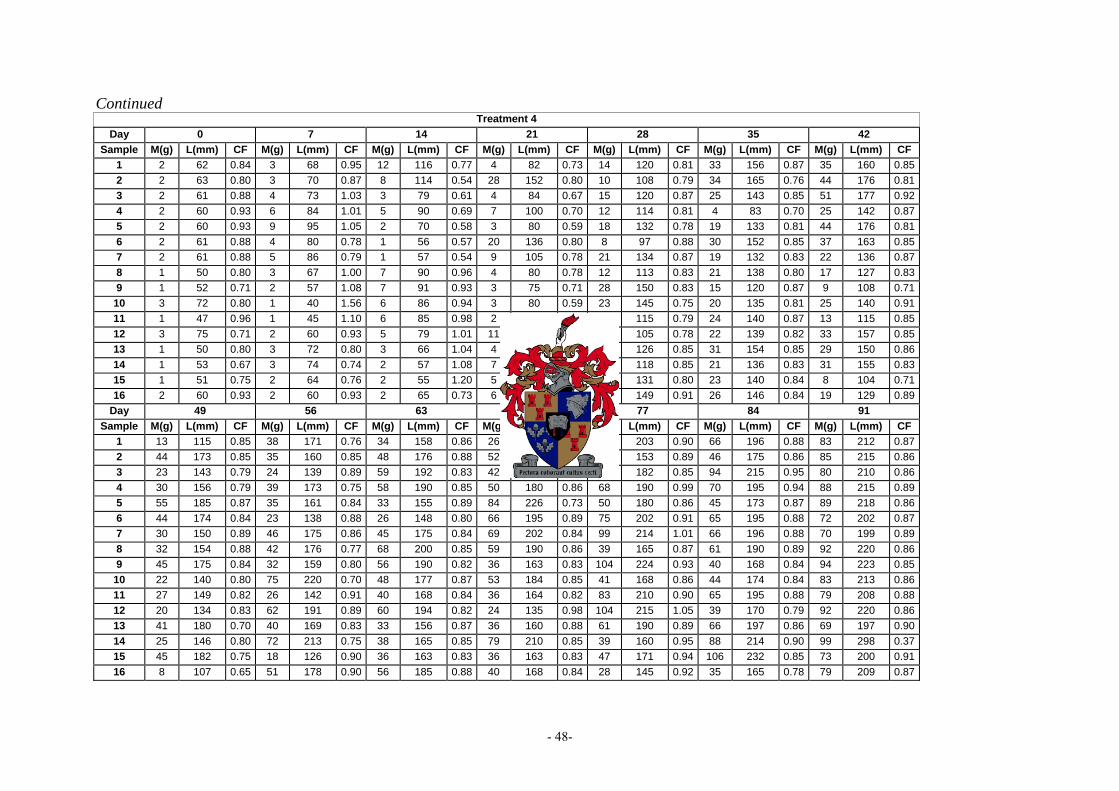
- 48-
Continued
Treatment 4 Day 0 7 14 21 28 35 42
Sample M(g) L(mm) CF M(g) L(mm) CF M(g) L(mm) CF M(g) L(mm) CF M(g) L(mm) CF M(g) L(mm) CF M(g) L(mm) CF 1 2 62 0.84 3 68 0.95 12 116 0.77 4 82 0.73 14 120 0.81 33 156 0.87 35 160 0.852 2 63 0.80 3 70 0.87 8 114 0.54 28 152 0.80 10 108 0.79 34 165 0.76 44 176 0.813 2 61 0.88 4 73 1.03 3 79 0.61 4 84 0.67 15 120 0.87 25 143 0.85 51 177 0.924 2 60 0.93 6 84 1.01 5 90 0.69 7 100 0.70 12 114 0.81 4 83 0.70 25 142 0.875 2 60 0.93 9 95 1.05 2 70 0.58 3 80 0.59 18 132 0.78 19 133 0.81 44 176 0.816 2 61 0.88 4 80 0.78 1 56 0.57 20 136 0.80 8 97 0.88 30 152 0.85 37 163 0.857 2 61 0.88 5 86 0.79 1 57 0.54 9 105 0.78 21 134 0.87 19 132 0.83 22 136 0.878 1 50 0.80 3 67 1.00 7 90 0.96 4 80 0.78 12 113 0.83 21 138 0.80 17 127 0.839 1 52 0.71 2 57 1.08 7 91 0.93 3 75 0.71 28 150 0.83 15 120 0.87 9 108 0.71
10 3 72 0.80 1 40 1.56 6 86 0.94 3 80 0.59 23 145 0.75 20 135 0.81 25 140 0.9111 1 47 0.96 1 45 1.10 6 85 0.98 2 70 0.58 12 115 0.79 24 140 0.87 13 115 0.8512 3 75 0.71 2 60 0.93 5 79 1.01 11 111 0.80 9 105 0.78 22 139 0.82 33 157 0.8513 1 50 0.80 3 72 0.80 3 66 1.04 4 83 0.70 17 126 0.85 31 154 0.85 29 150 0.8614 1 53 0.67 3 74 0.74 2 57 1.08 7 99 0.72 14 118 0.85 21 136 0.83 31 155 0.8315 1 51 0.75 2 64 0.76 2 55 1.20 5 88 0.73 18 131 0.80 23 140 0.84 8 104 0.7116 2 60 0.93 2 60 0.93 2 65 0.73 6 95 0.70 30 149 0.91 26 146 0.84 19 129 0.89
Day 49 56 63 70 77 84 91 Sample M(g) L(mm) CF M(g) L(mm) CF M(g) L(mm) CF M(g) L(mm) CF M(g) L(mm) CF M(g) L(mm) CF M(g) L(mm) CF
1 13 115 0.85 38 171 0.76 34 158 0.86 26 140 0.95 75 203 0.90 66 196 0.88 83 212 0.872 44 173 0.85 35 160 0.85 48 176 0.88 52 180 0.89 32 153 0.89 46 175 0.86 85 215 0.863 23 143 0.79 24 139 0.89 59 192 0.83 42 170 0.85 51 182 0.85 94 215 0.95 80 210 0.864 30 156 0.79 39 173 0.75 58 190 0.85 50 180 0.86 68 190 0.99 70 195 0.94 88 215 0.895 55 185 0.87 35 161 0.84 33 155 0.89 84 226 0.73 50 180 0.86 45 173 0.87 89 218 0.866 44 174 0.84 23 138 0.88 26 148 0.80 66 195 0.89 75 202 0.91 65 195 0.88 72 202 0.877 30 150 0.89 46 175 0.86 45 175 0.84 69 202 0.84 99 214 1.01 66 196 0.88 70 199 0.898 32 154 0.88 42 176 0.77 68 200 0.85 59 190 0.86 39 165 0.87 61 190 0.89 92 220 0.869 45 175 0.84 32 159 0.80 56 190 0.82 36 163 0.83 104 224 0.93 40 168 0.84 94 223 0.85
10 22 140 0.80 75 220 0.70 48 177 0.87 53 184 0.85 41 168 0.86 44 174 0.84 83 213 0.8611 27 149 0.82 26 142 0.91 40 168 0.84 36 164 0.82 83 210 0.90 65 195 0.88 79 208 0.8812 20 134 0.83 62 191 0.89 60 194 0.82 24 135 0.98 104 215 1.05 39 170 0.79 92 220 0.8613 41 180 0.70 40 169 0.83 33 156 0.87 36 160 0.88 61 190 0.89 66 197 0.86 69 197 0.9014 25 146 0.80 72 213 0.75 38 165 0.85 79 210 0.85 39 160 0.95 88 214 0.90 99 298 0.3715 45 182 0.75 18 126 0.90 36 163 0.83 36 163 0.83 47 171 0.94 106 232 0.85 73 200 0.9116 8 107 0.65 51 178 0.90 56 185 0.88 40 168 0.84 28 145 0.92 35 165 0.78 79 209 0.87

- 49-
Continued
Treatment 4 Day 98 105 112 119 126 133
Sample M(g) L(mm) CF M(g) L(mm) CF M(g) L(mm) CF M(g) L(mm) CF M(g) L(mm) CF M(g) L(mm) CF 1 92 221 0.85 100 230 0.82 110 240 0.80 145 255 0.87 146 245 0.99 197 280 0.902 90 220 0.85 87 215 0.88 121 250 0.77 122 244 0.84 130 237 0.98 148 250 0.953 111 240 0.80 74 204 0.87 109 238 0.81 117 237 0.88 129 250 0.83 200 285 0.864 87 215 0.88 108 236 0.82 101 229 0.84 120 240 0.87 129 250 0.83 151 260 0.865 88 215 0.89 119 246 0.80 99 229 0.82 125 245 0.85 126 248 0.83 151 255 0.916 76 205 0.88 100 230 0.82 134 260 0.76 131 252 0.82 128 251 0.81 88 215 0.897 120 248 0.79 109 236 0.83 114 240 0.82 118 238 0.88 134 240 0.97 80 220 0.758 101 230 0.83 124 250 0.79 106 235 0.82 120 237 0.90 136 240 0.98 116 237 0.879 94 223 0.85 107 235 0.82 110 240 0.80 116 240 0.84 140 255 0.84 108 230 0.89
10 98 227 0.84 104 233 0.82 111 240 0.80 115 238 0.85 126 250 0.81 122 240 0.8811 88 217 0.86 92 222 0.84 117 243 0.82 125 250 0.80 120 245 0.82 144 265 0.7712 79 210 0.85 98 226 0.85 104 230 0.85 123 247 0.82 119 239 0.87 156 265 0.8413 92 222 0.84 111 239 0.81 100 229 0.83 126 250 0.81 132 250 0.84 90 215 0.9114 98 228 0.83 104 234 0.81 106 234 0.83 130 250 0.83 129 253 0.80 137 260 0.7815 89 218 0.86 116 245 0.79 112 242 0.79 128 248 0.84 124 248 0.81 93 225 0.8216 79 205 0.92 115 243 0.80 118 245 0.80 112 239 0.82 128 240 0.93 145 260 0.82
Day 140 147 154 161 168 175 Sample M(g) L(mm) CF M(g) L(mm) CF M(g) L(mm) CF M(g) L(mm) CF M(g) L(mm) CF M(g) L(mm) CF
1 177 273 0.87 127 245 0.86 145 252 0.91 181 290 0.74 153 260 0.87 116 250 0.742 122 243 0.85 153 265 0.82 111 234 0.87 110 238 0.82 144 255 0.87 148 270 0.753 112 230 0.92 128 252 0.80 207 295 0.81 165 270 0.84 222 300 0.82 120 260 0.684 123 245 0.84 177 277 0.83 109 228 0.92 100 233 0.79 129 255 0.78 177 275 0.855 159 270 0.81 107 222 0.98 127 248 0.83 171 272 0.85 164 278 0.76 123 243 0.866 123 240 0.89 110 237 0.83 119 237 0.89 121 250 0.77 152 270 0.77 217 290 0.897 115 232 0.92 150 260 0.85 95 222 0.87 110 230 0.90 170 270 0.86 292 325 0.858 101 230 0.83 176 273 0.87 164 264 0.89 123 245 0.84 100 235 0.77 122 250 0.789 151 251 0.95 148 250 0.95 161 260 0.92 118 245 0.80 99 225 0.87 168 282 0.75
10 105 230 0.86 216 300 0.80 144 250 0.92 165 275 0.79 158 260 0.90 222 300 0.8211 114 247 0.76 114 240 0.82 162 273 0.80 219 308 0.75 165 265 0.89 159 280 0.7212 111 237 0.83 157 265 0.84 110 233 0.87 102 225 0.90 189 275 0.91 115 240 0.8313 127 257 0.75 112 235 0.86 120 241 0.86 103 230 0.85 109 230 0.90 193 290 0.7914 210 308 0.72 123 245 0.84 112 235 0.86 169 275 0.81 144 260 0.82 142 255 0.8615 189 274 0.92 84 215 0.85 167 270 0.85 162 260 0.92 169 270 0.86 258 315 0.8316 115 213 1.19 86 217 0.84 171 274 0.83 130 250 0.83 116 235 0.89 163 275 0.78
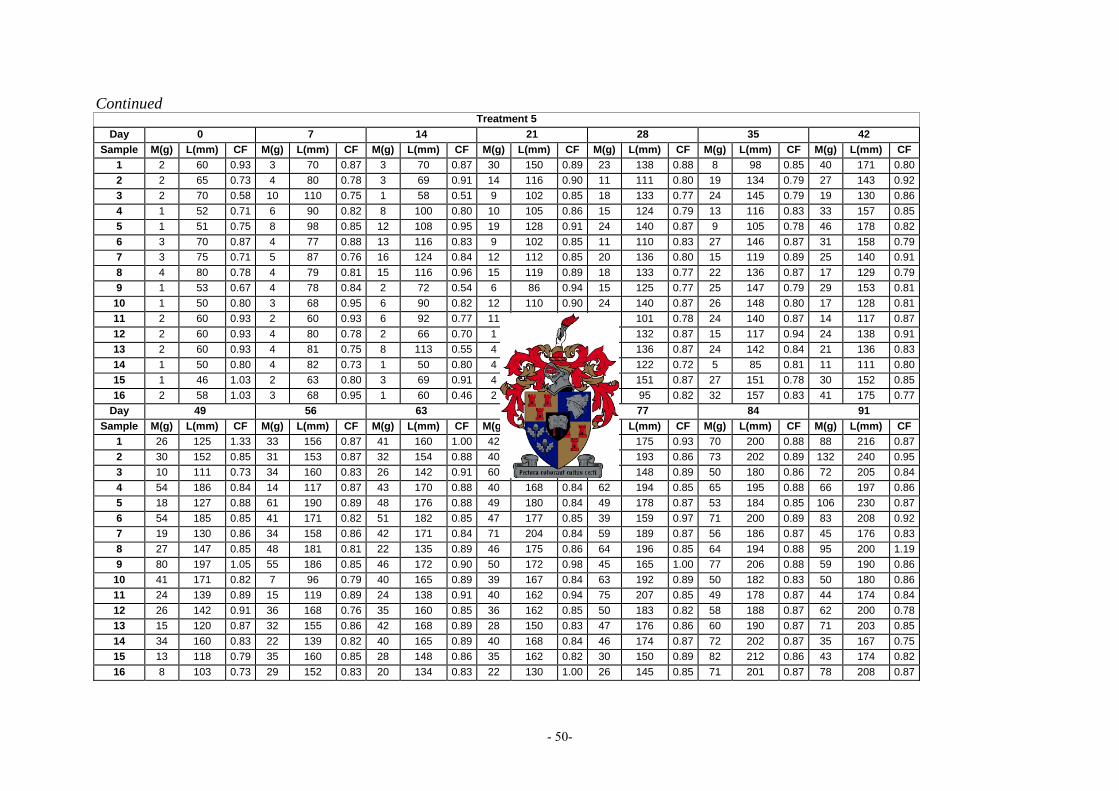
- 50-
Continued
Treatment 5 Day 0 7 14 21 28 35 42
Sample M(g) L(mm) CF M(g) L(mm) CF M(g) L(mm) CF M(g) L(mm) CF M(g) L(mm) CF M(g) L(mm) CF M(g) L(mm) CF 1 2 60 0.93 3 70 0.87 3 70 0.87 30 150 0.89 23 138 0.88 8 98 0.85 40 171 0.802 2 65 0.73 4 80 0.78 3 69 0.91 14 116 0.90 11 111 0.80 19 134 0.79 27 143 0.923 2 70 0.58 10 110 0.75 1 58 0.51 9 102 0.85 18 133 0.77 24 145 0.79 19 130 0.864 1 52 0.71 6 90 0.82 8 100 0.80 10 105 0.86 15 124 0.79 13 116 0.83 33 157 0.855 1 51 0.75 8 98 0.85 12 108 0.95 19 128 0.91 24 140 0.87 9 105 0.78 46 178 0.826 3 70 0.87 4 77 0.88 13 116 0.83 9 102 0.85 11 110 0.83 27 146 0.87 31 158 0.797 3 75 0.71 5 87 0.76 16 124 0.84 12 112 0.85 20 136 0.80 15 119 0.89 25 140 0.918 4 80 0.78 4 79 0.81 15 116 0.96 15 119 0.89 18 133 0.77 22 136 0.87 17 129 0.799 1 53 0.67 4 78 0.84 2 72 0.54 6 86 0.94 15 125 0.77 25 147 0.79 29 153 0.81
10 1 50 0.80 3 68 0.95 6 90 0.82 12 110 0.90 24 140 0.87 26 148 0.80 17 128 0.8111 2 60 0.93 2 60 0.93 6 92 0.77 11 105 0.95 8 101 0.78 24 140 0.87 14 117 0.8712 2 60 0.93 4 80 0.78 2 66 0.70 1 64 0.38 20 132 0.87 15 117 0.94 24 138 0.9113 2 60 0.93 4 81 0.75 8 113 0.55 4 78 0.84 22 136 0.87 24 142 0.84 21 136 0.8314 1 50 0.80 4 82 0.73 1 50 0.80 4 79 0.81 13 122 0.72 5 85 0.81 11 111 0.8015 1 46 1.03 2 63 0.80 3 69 0.91 4 75 0.95 30 151 0.87 27 151 0.78 30 152 0.8516 2 58 1.03 3 68 0.95 1 60 0.46 2 65 0.73 7 95 0.82 32 157 0.83 41 175 0.77
Day 49 56 63 70 77 84 91 Sample M(g) L(mm) CF M(g) L(mm) CF M(g) L(mm) CF M(g) L(mm) CF M(g) L(mm) CF M(g) L(mm) CF M(g) L(mm) CF
1 26 125 1.33 33 156 0.87 41 160 1.00 42 174 0.80 50 175 0.93 70 200 0.88 88 216 0.872 30 152 0.85 31 153 0.87 32 154 0.88 40 167 0.86 62 193 0.86 73 202 0.89 132 240 0.953 10 111 0.73 34 160 0.83 26 142 0.91 60 190 0.87 29 148 0.89 50 180 0.86 72 205 0.844 54 186 0.84 14 117 0.87 43 170 0.88 40 168 0.84 62 194 0.85 65 195 0.88 66 197 0.865 18 127 0.88 61 190 0.89 48 176 0.88 49 180 0.84 49 178 0.87 53 184 0.85 106 230 0.876 54 185 0.85 41 171 0.82 51 182 0.85 47 177 0.85 39 159 0.97 71 200 0.89 83 208 0.927 19 130 0.86 34 158 0.86 42 171 0.84 71 204 0.84 59 189 0.87 56 186 0.87 45 176 0.838 27 147 0.85 48 181 0.81 22 135 0.89 46 175 0.86 64 196 0.85 64 194 0.88 95 200 1.199 80 197 1.05 55 186 0.85 46 172 0.90 50 172 0.98 45 165 1.00 77 206 0.88 59 190 0.86
10 41 171 0.82 7 96 0.79 40 165 0.89 39 167 0.84 63 192 0.89 50 182 0.83 50 180 0.8611 24 139 0.89 15 119 0.89 24 138 0.91 40 162 0.94 75 207 0.85 49 178 0.87 44 174 0.8412 26 142 0.91 36 168 0.76 35 160 0.85 36 162 0.85 50 183 0.82 58 188 0.87 62 200 0.7813 15 120 0.87 32 155 0.86 42 168 0.89 28 150 0.83 47 176 0.86 60 190 0.87 71 203 0.8514 34 160 0.83 22 139 0.82 40 165 0.89 40 168 0.84 46 174 0.87 72 202 0.87 35 167 0.7515 13 118 0.79 35 160 0.85 28 148 0.86 35 162 0.82 30 150 0.89 82 212 0.86 43 174 0.8216 8 103 0.73 29 152 0.83 20 134 0.83 22 130 1.00 26 145 0.85 71 201 0.87 78 208 0.87

- 51-
Continued
Treatment 5 Day 98 105 112 119 126 133
Sample M(g) L(mm) CF M(g) L(mm) CF M(g) L(mm) CF M(g) L(mm) CF M(g) L(mm) CF M(g) L(mm) CF 1 71 201 0.87 103 230 0.85 99 228 0.84 160 265 0.86 101 229 0.84 182 285 0.792 68 199 0.86 112 240 0.81 121 230 0.99 118 236 0.90 98 228 0.83 137 260 0.783 74 204 0.87 117 243 0.82 105 233 0.83 118 240 0.85 111 239 0.81 159 270 0.814 63 195 0.85 123 235 0.95 100 230 0.82 90 220 0.85 110 240 0.80 107 234 0.845 89 216 0.88 101 230 0.83 92 222 0.84 106 240 0.77 119 245 0.81 109 237 0.826 70 199 0.89 95 225 0.83 96 224 0.85 113 234 0.88 122 250 0.78 128 255 0.777 62 190 0.90 90 220 0.85 115 243 0.80 129 255 0.78 115 243 0.80 115 245 0.788 72 200 0.90 104 231 0.84 102 232 0.82 97 225 0.85 114 243 0.79 131 260 0.759 71 200 0.89 91 219 0.87 110 240 0.80 57 195 0.77 116 245 0.79 97 225 0.85
10 64 194 0.88 98 228 0.83 112 241 0.80 101 235 0.78 118 245 0.80 146 260 0.8311 78 208 0.87 103 233 0.81 120 230 0.99 81 215 0.82 119 247 0.79 157 275 0.7512 88 218 0.85 102 232 0.82 117 244 0.81 113 240 0.82 120 249 0.78 162 275 0.7813 59 188 0.89 99 228 0.84 90 220 0.85 94 220 0.88 113 243 0.79 91 220 0.8514 72 201 0.89 102 232 0.82 101 231 0.82 80 205 0.93 127 256 0.76 110 238 0.8215 71 200 0.89 99 228 0.84 105 233 0.83 148 265 0.80 112 243 0.78 94 224 0.8416 69 199 0.88 112 240 0.81 95 224 0.85 115 240 0.83 109 238 0.81 88 218 0.85
Day 140 147 154 161 168 175 Sample M(g) L(mm) CF M(g) L(mm) CF M(g) L(mm) CF M(g) L(mm) CF M(g) L(mm) CF M(g) L(mm) CF
1 104 225 0.91 105 235 0.81 93 225 0.82 121 236 0.92 148 260 0.84 158 275 0.762 144 265 0.77 121 245 0.82 147 260 0.84 101 225 0.89 168 270 0.85 173 275 0.833 155 260 0.88 119 235 0.92 104 230 0.85 126 245 0.86 150 260 0.85 192 295 0.754 114 245 0.78 302 362 0.64 121 247 0.80 123 240 0.89 136 243 0.95 250 316 0.795 124 240 0.90 231 290 0.95 94 225 0.83 228 314 0.74 162 259 0.93 173 273 0.856 106 235 0.82 140 260 0.80 232 300 0.86 257 320 0.78 135 248 0.89 106 245 0.727 137 250 0.88 126 250 0.81 126 250 0.81 145 260 0.82 142 263 0.78 240 307 0.838 122 248 0.80 142 255 0.86 163 265 0.88 117 250 0.75 141 260 0.80 112 250 0.729 145 253 0.90 135 240 0.98 115 235 0.89 183 280 0.83 148 265 0.80 123 255 0.74
10 118 240 0.85 119 240 0.86 205 285 0.89 179 282 0.80 94 225 0.83 216 305 0.7611 225 290 0.92 146 250 0.93 183 295 0.71 123 249 0.80 99 230 0.81 109 242 0.7712 112 240 0.81 119 243 0.83 144 255 0.87 126 245 0.86 220 300 0.81 121 250 0.7713 141 255 0.85 90 220 0.85 106 230 0.87 111 235 0.86 242 295 0.94 166 275 0.8014 128 245 0.87 144 252 0.90 88 220 0.83 115 240 0.83 123 246 0.83 108 240 0.7815 101 230 0.83 128 250 0.82 106 235 0.82 105 235 0.81 100 230 0.82 116 240 0.8416 250 290 1.03 84 215 0.85 227 305 0.80 100 230 0.82 183 270 0.93 129 252 0.81
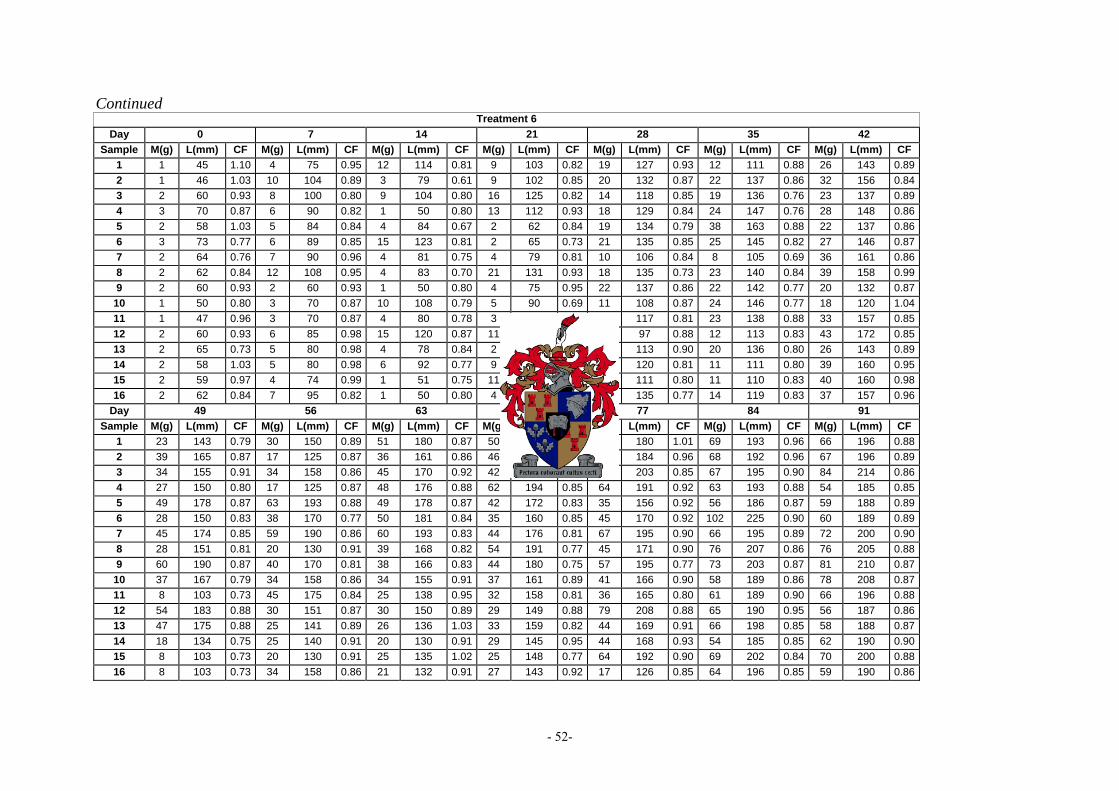
- 52-
Continued
Treatment 6 Day 0 7 14 21 28 35 42
Sample M(g) L(mm) CF M(g) L(mm) CF M(g) L(mm) CF M(g) L(mm) CF M(g) L(mm) CF M(g) L(mm) CF M(g) L(mm) CF 1 1 45 1.10 4 75 0.95 12 114 0.81 9 103 0.82 19 127 0.93 12 111 0.88 26 143 0.892 1 46 1.03 10 104 0.89 3 79 0.61 9 102 0.85 20 132 0.87 22 137 0.86 32 156 0.843 2 60 0.93 8 100 0.80 9 104 0.80 16 125 0.82 14 118 0.85 19 136 0.76 23 137 0.894 3 70 0.87 6 90 0.82 1 50 0.80 13 112 0.93 18 129 0.84 24 147 0.76 28 148 0.865 2 58 1.03 5 84 0.84 4 84 0.67 2 62 0.84 19 134 0.79 38 163 0.88 22 137 0.866 3 73 0.77 6 89 0.85 15 123 0.81 2 65 0.73 21 135 0.85 25 145 0.82 27 146 0.877 2 64 0.76 7 90 0.96 4 81 0.75 4 79 0.81 10 106 0.84 8 105 0.69 36 161 0.868 2 62 0.84 12 108 0.95 4 83 0.70 21 131 0.93 18 135 0.73 23 140 0.84 39 158 0.999 2 60 0.93 2 60 0.93 1 50 0.80 4 75 0.95 22 137 0.86 22 142 0.77 20 132 0.87
10 1 50 0.80 3 70 0.87 10 108 0.79 5 90 0.69 11 108 0.87 24 146 0.77 18 120 1.0411 1 47 0.96 3 70 0.87 4 80 0.78 3 66 1.04 13 117 0.81 23 138 0.88 33 157 0.8512 2 60 0.93 6 85 0.98 15 120 0.87 11 109 0.85 8 97 0.88 12 113 0.83 43 172 0.8513 2 65 0.73 5 80 0.98 4 78 0.84 2 65 0.73 13 113 0.90 20 136 0.80 26 143 0.8914 2 58 1.03 5 80 0.98 6 92 0.77 9 105 0.78 14 120 0.81 11 111 0.80 39 160 0.9515 2 59 0.97 4 74 0.99 1 51 0.75 11 107 0.90 11 111 0.80 11 110 0.83 40 160 0.9816 2 62 0.84 7 95 0.82 1 50 0.80 4 80 0.78 19 135 0.77 14 119 0.83 37 157 0.96
Day 49 56 63 70 77 84 91 Sample M(g) L(mm) CF M(g) L(mm) CF M(g) L(mm) CF M(g) L(mm) CF M(g) L(mm) CF M(g) L(mm) CF M(g) L(mm) CF
1 23 143 0.79 30 150 0.89 51 180 0.87 50 174 0.95 59 180 1.01 69 193 0.96 66 196 0.882 39 165 0.87 17 125 0.87 36 161 0.86 46 175 0.86 60 184 0.96 68 192 0.96 67 196 0.893 34 155 0.91 34 158 0.86 45 170 0.92 42 175 0.78 71 203 0.85 67 195 0.90 84 214 0.864 27 150 0.80 17 125 0.87 48 176 0.88 62 194 0.85 64 191 0.92 63 193 0.88 54 185 0.855 49 178 0.87 63 193 0.88 49 178 0.87 42 172 0.83 35 156 0.92 56 186 0.87 59 188 0.896 28 150 0.83 38 170 0.77 50 181 0.84 35 160 0.85 45 170 0.92 102 225 0.90 60 189 0.897 45 174 0.85 59 190 0.86 60 193 0.83 44 176 0.81 67 195 0.90 66 195 0.89 72 200 0.908 28 151 0.81 20 130 0.91 39 168 0.82 54 191 0.77 45 171 0.90 76 207 0.86 76 205 0.889 60 190 0.87 40 170 0.81 38 166 0.83 44 180 0.75 57 195 0.77 73 203 0.87 81 210 0.87
10 37 167 0.79 34 158 0.86 34 155 0.91 37 161 0.89 41 166 0.90 58 189 0.86 78 208 0.8711 8 103 0.73 45 175 0.84 25 138 0.95 32 158 0.81 36 165 0.80 61 189 0.90 66 196 0.8812 54 183 0.88 30 151 0.87 30 150 0.89 29 149 0.88 79 208 0.88 65 190 0.95 56 187 0.8613 47 175 0.88 25 141 0.89 26 136 1.03 33 159 0.82 44 169 0.91 66 198 0.85 58 188 0.8714 18 134 0.75 25 140 0.91 20 130 0.91 29 145 0.95 44 168 0.93 54 185 0.85 62 190 0.9015 8 103 0.73 20 130 0.91 25 135 1.02 25 148 0.77 64 192 0.90 69 202 0.84 70 200 0.8816 8 103 0.73 34 158 0.86 21 132 0.91 27 143 0.92 17 126 0.85 64 196 0.85 59 190 0.86
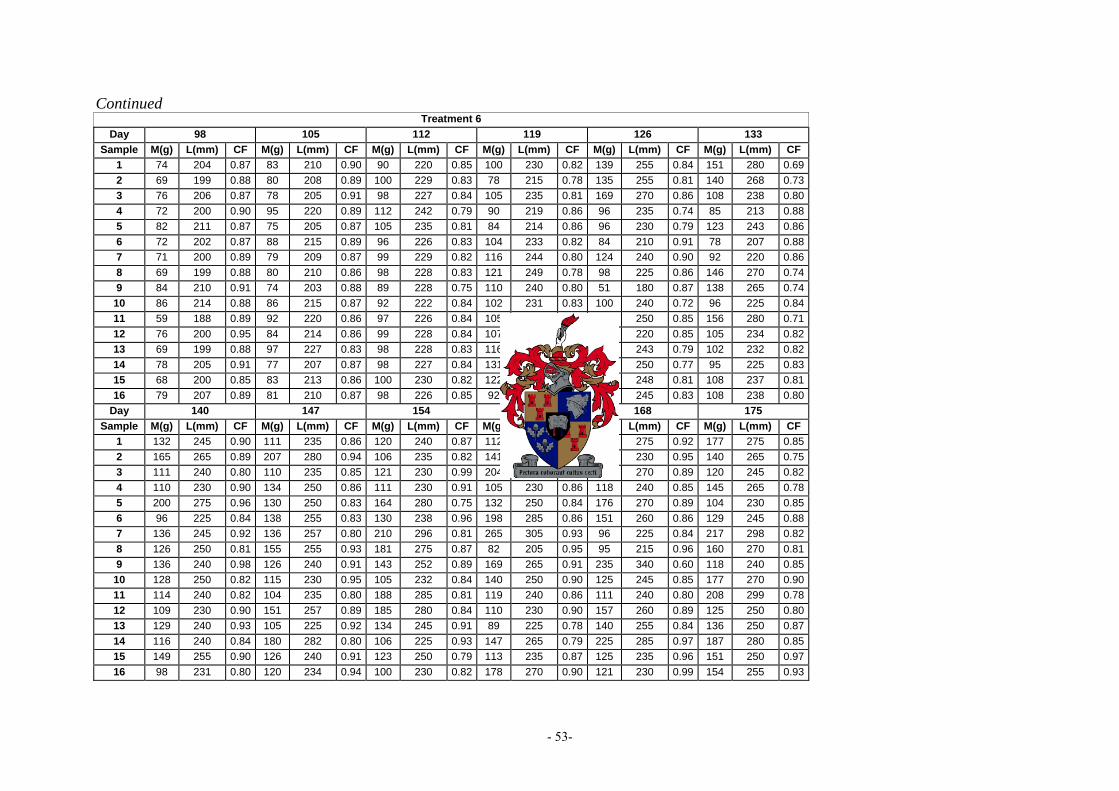
- 53-
Continued
Treatment 6 Day 98 105 112 119 126 133
Sample M(g) L(mm) CF M(g) L(mm) CF M(g) L(mm) CF M(g) L(mm) CF M(g) L(mm) CF M(g) L(mm) CF 1 74 204 0.87 83 210 0.90 90 220 0.85 100 230 0.82 139 255 0.84 151 280 0.692 69 199 0.88 80 208 0.89 100 229 0.83 78 215 0.78 135 255 0.81 140 268 0.733 76 206 0.87 78 205 0.91 98 227 0.84 105 235 0.81 169 270 0.86 108 238 0.804 72 200 0.90 95 220 0.89 112 242 0.79 90 219 0.86 96 235 0.74 85 213 0.885 82 211 0.87 75 205 0.87 105 235 0.81 84 214 0.86 96 230 0.79 123 243 0.866 72 202 0.87 88 215 0.89 96 226 0.83 104 233 0.82 84 210 0.91 78 207 0.887 71 200 0.89 79 209 0.87 99 229 0.82 116 244 0.80 124 240 0.90 92 220 0.868 69 199 0.88 80 210 0.86 98 228 0.83 121 249 0.78 98 225 0.86 146 270 0.749 84 210 0.91 74 203 0.88 89 228 0.75 110 240 0.80 51 180 0.87 138 265 0.74
10 86 214 0.88 86 215 0.87 92 222 0.84 102 231 0.83 100 240 0.72 96 225 0.8411 59 188 0.89 92 220 0.86 97 226 0.84 105 233 0.83 133 250 0.85 156 280 0.7112 76 200 0.95 84 214 0.86 99 228 0.84 107 235 0.82 91 220 0.85 105 234 0.8213 69 199 0.88 97 227 0.83 98 228 0.83 116 244 0.80 114 243 0.79 102 232 0.8214 78 205 0.91 77 207 0.87 98 227 0.84 131 259 0.75 120 250 0.77 95 225 0.8315 68 200 0.85 83 213 0.86 100 230 0.82 122 245 0.83 124 248 0.81 108 237 0.8116 79 207 0.89 81 210 0.87 98 226 0.85 92 222 0.84 122 245 0.83 108 238 0.80
Day 140 147 154 161 168 175 Sample M(g) L(mm) CF M(g) L(mm) CF M(g) L(mm) CF M(g) L(mm) CF M(g) L(mm) CF M(g) L(mm) CF
1 132 245 0.90 111 235 0.86 120 240 0.87 112 240 0.81 192 275 0.92 177 275 0.852 165 265 0.89 207 280 0.94 106 235 0.82 141 250 0.90 115 230 0.95 140 265 0.753 111 240 0.80 110 235 0.85 121 230 0.99 204 289 0.85 175 270 0.89 120 245 0.824 110 230 0.90 134 250 0.86 111 230 0.91 105 230 0.86 118 240 0.85 145 265 0.785 200 275 0.96 130 250 0.83 164 280 0.75 132 250 0.84 176 270 0.89 104 230 0.856 96 225 0.84 138 255 0.83 130 238 0.96 198 285 0.86 151 260 0.86 129 245 0.887 136 245 0.92 136 257 0.80 210 296 0.81 265 305 0.93 96 225 0.84 217 298 0.828 126 250 0.81 155 255 0.93 181 275 0.87 82 205 0.95 95 215 0.96 160 270 0.819 136 240 0.98 126 240 0.91 143 252 0.89 169 265 0.91 235 340 0.60 118 240 0.85
10 128 250 0.82 115 230 0.95 105 232 0.84 140 250 0.90 125 245 0.85 177 270 0.9011 114 240 0.82 104 235 0.80 188 285 0.81 119 240 0.86 111 240 0.80 208 299 0.7812 109 230 0.90 151 257 0.89 185 280 0.84 110 230 0.90 157 260 0.89 125 250 0.8013 129 240 0.93 105 225 0.92 134 245 0.91 89 225 0.78 140 255 0.84 136 250 0.8714 116 240 0.84 180 282 0.80 106 225 0.93 147 265 0.79 225 285 0.97 187 280 0.8515 149 255 0.90 126 240 0.91 123 250 0.79 113 235 0.87 125 235 0.96 151 250 0.9716 98 231 0.80 120 234 0.94 100 230 0.82 178 270 0.90 121 230 0.99 154 255 0.93
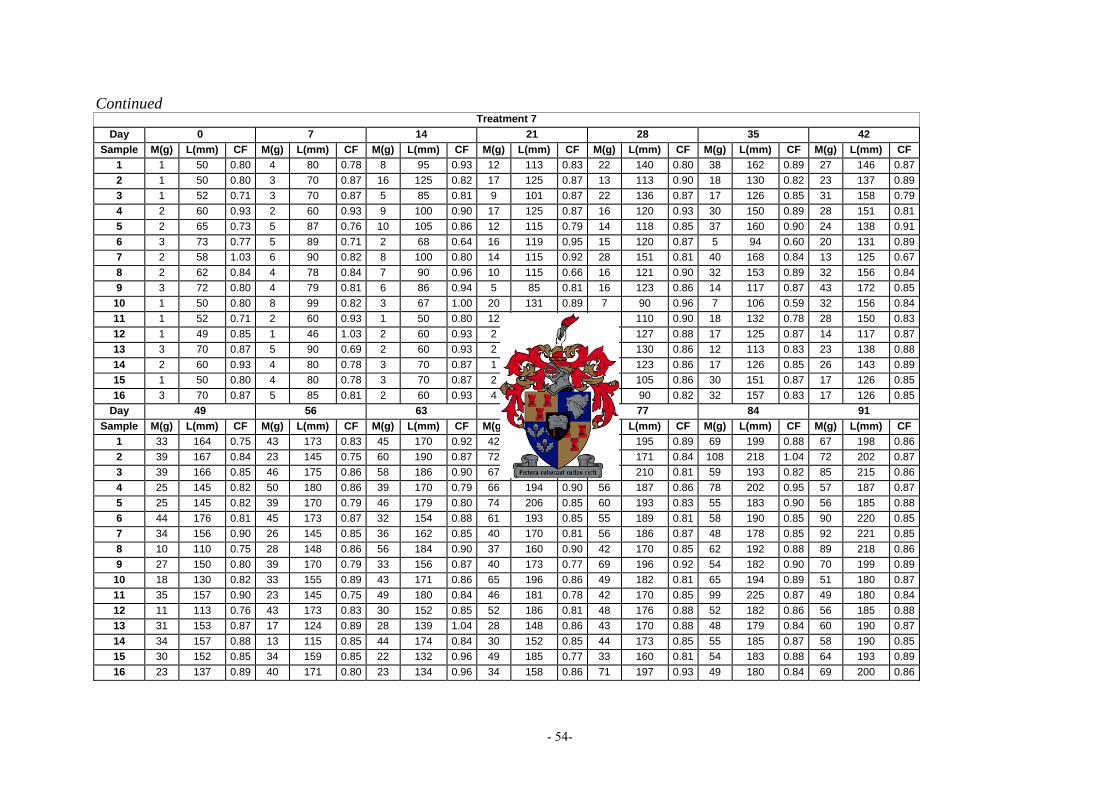
- 54-
Continued
Treatment 7 Day 0 7 14 21 28 35 42
Sample M(g) L(mm) CF M(g) L(mm) CF M(g) L(mm) CF M(g) L(mm) CF M(g) L(mm) CF M(g) L(mm) CF M(g) L(mm) CF 1 1 50 0.80 4 80 0.78 8 95 0.93 12 113 0.83 22 140 0.80 38 162 0.89 27 146 0.872 1 50 0.80 3 70 0.87 16 125 0.82 17 125 0.87 13 113 0.90 18 130 0.82 23 137 0.893 1 52 0.71 3 70 0.87 5 85 0.81 9 101 0.87 22 136 0.87 17 126 0.85 31 158 0.794 2 60 0.93 2 60 0.93 9 100 0.90 17 125 0.87 16 120 0.93 30 150 0.89 28 151 0.815 2 65 0.73 5 87 0.76 10 105 0.86 12 115 0.79 14 118 0.85 37 160 0.90 24 138 0.916 3 73 0.77 5 89 0.71 2 68 0.64 16 119 0.95 15 120 0.87 5 94 0.60 20 131 0.897 2 58 1.03 6 90 0.82 8 100 0.80 14 115 0.92 28 151 0.81 40 168 0.84 13 125 0.678 2 62 0.84 4 78 0.84 7 90 0.96 10 115 0.66 16 121 0.90 32 153 0.89 32 156 0.849 3 72 0.80 4 79 0.81 6 86 0.94 5 85 0.81 16 123 0.86 14 117 0.87 43 172 0.85
10 1 50 0.80 8 99 0.82 3 67 1.00 20 131 0.89 7 90 0.96 7 106 0.59 32 156 0.8411 1 52 0.71 2 60 0.93 1 50 0.80 12 115 0.79 12 110 0.90 18 132 0.78 28 150 0.8312 1 49 0.85 1 46 1.03 2 60 0.93 2 69 0.61 18 127 0.88 17 125 0.87 14 117 0.8713 3 70 0.87 5 90 0.69 2 60 0.93 2 70 0.58 19 130 0.86 12 113 0.83 23 138 0.8814 2 60 0.93 4 80 0.78 3 70 0.87 1 56 0.57 16 123 0.86 17 126 0.85 26 143 0.8915 1 50 0.80 4 80 0.78 3 70 0.87 2 64 0.76 10 105 0.86 30 151 0.87 17 126 0.8516 3 70 0.87 5 85 0.81 2 60 0.93 4 79 0.81 6 90 0.82 32 157 0.83 17 126 0.85
Day 49 56 63 70 77 84 91 Sample M(g) L(mm) CF M(g) L(mm) CF M(g) L(mm) CF M(g) L(mm) CF M(g) L(mm) CF M(g) L(mm) CF M(g) L(mm) CF
1 33 164 0.75 43 173 0.83 45 170 0.92 42 170 0.85 66 195 0.89 69 199 0.88 67 198 0.862 39 167 0.84 23 145 0.75 60 190 0.87 72 200 0.90 42 171 0.84 108 218 1.04 72 202 0.873 39 166 0.85 46 175 0.86 58 186 0.90 67 195 0.90 75 210 0.81 59 193 0.82 85 215 0.864 25 145 0.82 50 180 0.86 39 170 0.79 66 194 0.90 56 187 0.86 78 202 0.95 57 187 0.875 25 145 0.82 39 170 0.79 46 179 0.80 74 206 0.85 60 193 0.83 55 183 0.90 56 185 0.886 44 176 0.81 45 173 0.87 32 154 0.88 61 193 0.85 55 189 0.81 58 190 0.85 90 220 0.857 34 156 0.90 26 145 0.85 36 162 0.85 40 170 0.81 56 186 0.87 48 178 0.85 92 221 0.858 10 110 0.75 28 148 0.86 56 184 0.90 37 160 0.90 42 170 0.85 62 192 0.88 89 218 0.869 27 150 0.80 39 170 0.79 33 156 0.87 40 173 0.77 69 196 0.92 54 182 0.90 70 199 0.89
10 18 130 0.82 33 155 0.89 43 171 0.86 65 196 0.86 49 182 0.81 65 194 0.89 51 180 0.8711 35 157 0.90 23 145 0.75 49 180 0.84 46 181 0.78 42 170 0.85 99 225 0.87 49 180 0.8412 11 113 0.76 43 173 0.83 30 152 0.85 52 186 0.81 48 176 0.88 52 182 0.86 56 185 0.8813 31 153 0.87 17 124 0.89 28 139 1.04 28 148 0.86 43 170 0.88 48 179 0.84 60 190 0.8714 34 157 0.88 13 115 0.85 44 174 0.84 30 152 0.85 44 173 0.85 55 185 0.87 58 190 0.8515 30 152 0.85 34 159 0.85 22 132 0.96 49 185 0.77 33 160 0.81 54 183 0.88 64 193 0.8916 23 137 0.89 40 171 0.80 23 134 0.96 34 158 0.86 71 197 0.93 49 180 0.84 69 200 0.86
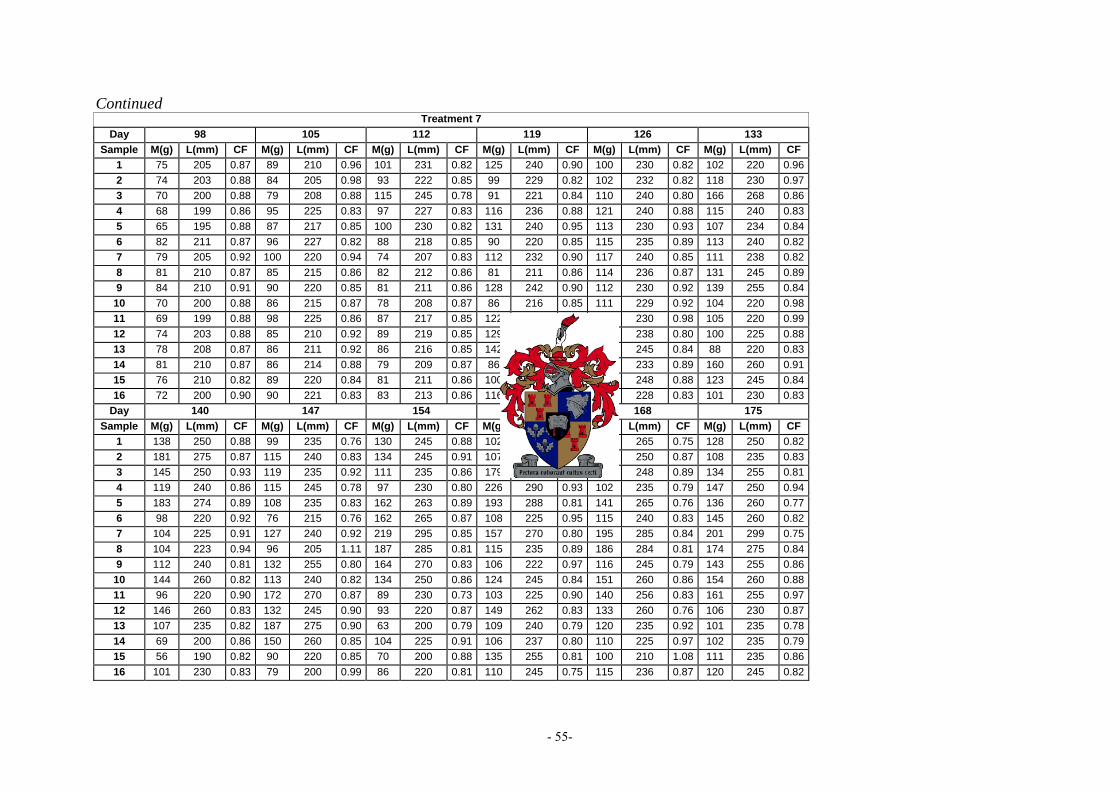
- 55-
Continued
Treatment 7 Day 98 105 112 119 126 133
Sample M(g) L(mm) CF M(g) L(mm) CF M(g) L(mm) CF M(g) L(mm) CF M(g) L(mm) CF M(g) L(mm) CF 1 75 205 0.87 89 210 0.96 101 231 0.82 125 240 0.90 100 230 0.82 102 220 0.962 74 203 0.88 84 205 0.98 93 222 0.85 99 229 0.82 102 232 0.82 118 230 0.973 70 200 0.88 79 208 0.88 115 245 0.78 91 221 0.84 110 240 0.80 166 268 0.864 68 199 0.86 95 225 0.83 97 227 0.83 116 236 0.88 121 240 0.88 115 240 0.835 65 195 0.88 87 217 0.85 100 230 0.82 131 240 0.95 113 230 0.93 107 234 0.846 82 211 0.87 96 227 0.82 88 218 0.85 90 220 0.85 115 235 0.89 113 240 0.827 79 205 0.92 100 220 0.94 74 207 0.83 112 232 0.90 117 240 0.85 111 238 0.828 81 210 0.87 85 215 0.86 82 212 0.86 81 211 0.86 114 236 0.87 131 245 0.899 84 210 0.91 90 220 0.85 81 211 0.86 128 242 0.90 112 230 0.92 139 255 0.84
10 70 200 0.88 86 215 0.87 78 208 0.87 86 216 0.85 111 229 0.92 104 220 0.9811 69 199 0.88 98 225 0.86 87 217 0.85 122 242 0.86 119 230 0.98 105 220 0.9912 74 203 0.88 85 210 0.92 89 219 0.85 129 240 0.93 108 238 0.80 100 225 0.8813 78 208 0.87 86 211 0.92 86 216 0.85 142 250 0.91 124 245 0.84 88 220 0.8314 81 210 0.87 86 214 0.88 79 209 0.87 86 210 0.93 113 233 0.89 160 260 0.9115 76 210 0.82 89 220 0.84 81 211 0.86 100 218 0.97 134 248 0.88 123 245 0.8416 72 200 0.90 90 221 0.83 83 213 0.86 116 230 0.95 98 228 0.83 101 230 0.83
Day 140 147 154 161 168 175 Sample M(g) L(mm) CF M(g) L(mm) CF M(g) L(mm) CF M(g) L(mm) CF M(g) L(mm) CF M(g) L(mm) CF
1 138 250 0.88 99 235 0.76 130 245 0.88 102 218 0.98 140 265 0.75 128 250 0.822 181 275 0.87 115 240 0.83 134 245 0.91 107 235 0.82 136 250 0.87 108 235 0.833 145 250 0.93 119 235 0.92 111 235 0.86 179 275 0.86 136 248 0.89 134 255 0.814 119 240 0.86 115 245 0.78 97 230 0.80 226 290 0.93 102 235 0.79 147 250 0.945 183 274 0.89 108 235 0.83 162 263 0.89 193 288 0.81 141 265 0.76 136 260 0.776 98 220 0.92 76 215 0.76 162 265 0.87 108 225 0.95 115 240 0.83 145 260 0.827 104 225 0.91 127 240 0.92 219 295 0.85 157 270 0.80 195 285 0.84 201 299 0.758 104 223 0.94 96 205 1.11 187 285 0.81 115 235 0.89 186 284 0.81 174 275 0.849 112 240 0.81 132 255 0.80 164 270 0.83 106 222 0.97 116 245 0.79 143 255 0.86
10 144 260 0.82 113 240 0.82 134 250 0.86 124 245 0.84 151 260 0.86 154 260 0.8811 96 220 0.90 172 270 0.87 89 230 0.73 103 225 0.90 140 256 0.83 161 255 0.9712 146 260 0.83 132 245 0.90 93 220 0.87 149 262 0.83 133 260 0.76 106 230 0.8713 107 235 0.82 187 275 0.90 63 200 0.79 109 240 0.79 120 235 0.92 101 235 0.7814 69 200 0.86 150 260 0.85 104 225 0.91 106 237 0.80 110 225 0.97 102 235 0.7915 56 190 0.82 90 220 0.85 70 200 0.88 135 255 0.81 100 210 1.08 111 235 0.8616 101 230 0.83 79 200 0.99 86 220 0.81 110 245 0.75 115 236 0.87 120 245 0.82
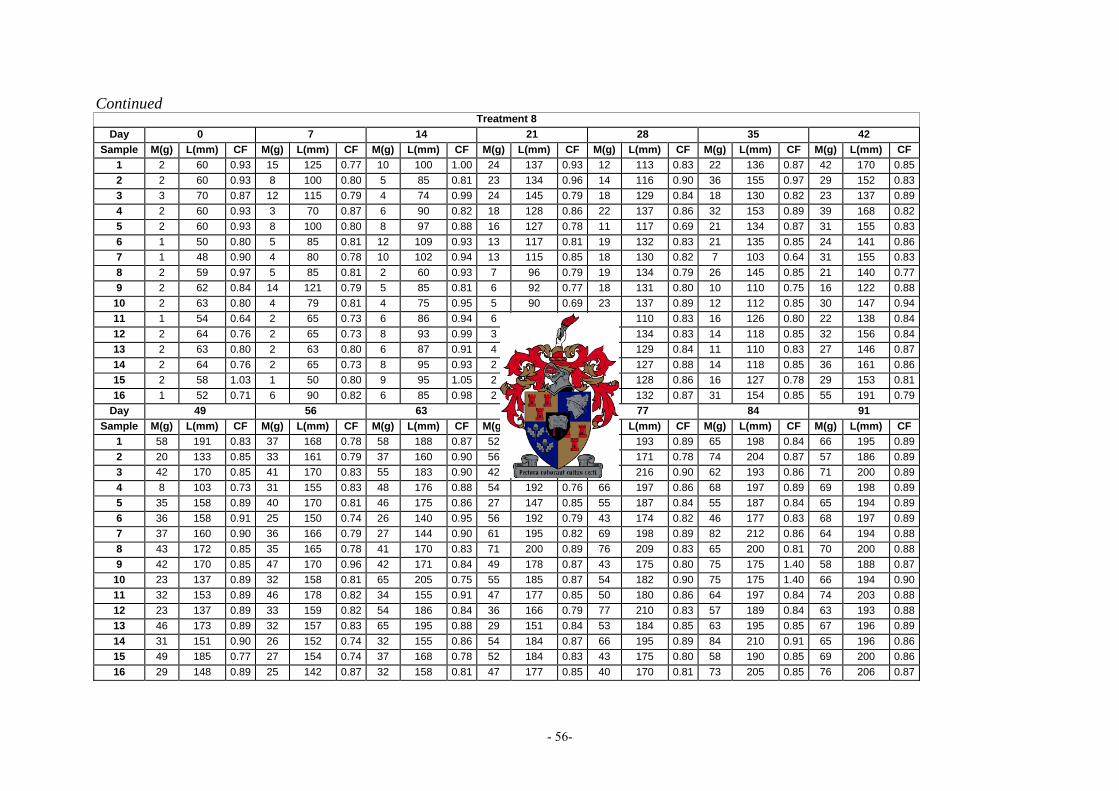
- 56-
Continued
Treatment 8 Day 0 7 14 21 28 35 42
Sample M(g) L(mm) CF M(g) L(mm) CF M(g) L(mm) CF M(g) L(mm) CF M(g) L(mm) CF M(g) L(mm) CF M(g) L(mm) CF 1 2 60 0.93 15 125 0.77 10 100 1.00 24 137 0.93 12 113 0.83 22 136 0.87 42 170 0.852 2 60 0.93 8 100 0.80 5 85 0.81 23 134 0.96 14 116 0.90 36 155 0.97 29 152 0.833 3 70 0.87 12 115 0.79 4 74 0.99 24 145 0.79 18 129 0.84 18 130 0.82 23 137 0.894 2 60 0.93 3 70 0.87 6 90 0.82 18 128 0.86 22 137 0.86 32 153 0.89 39 168 0.825 2 60 0.93 8 100 0.80 8 97 0.88 16 127 0.78 11 117 0.69 21 134 0.87 31 155 0.836 1 50 0.80 5 85 0.81 12 109 0.93 13 117 0.81 19 132 0.83 21 135 0.85 24 141 0.867 1 48 0.90 4 80 0.78 10 102 0.94 13 115 0.85 18 130 0.82 7 103 0.64 31 155 0.838 2 59 0.97 5 85 0.81 2 60 0.93 7 96 0.79 19 134 0.79 26 145 0.85 21 140 0.779 2 62 0.84 14 121 0.79 5 85 0.81 6 92 0.77 18 131 0.80 10 110 0.75 16 122 0.88
10 2 63 0.80 4 79 0.81 4 75 0.95 5 90 0.69 23 137 0.89 12 112 0.85 30 147 0.9411 1 54 0.64 2 65 0.73 6 86 0.94 6 91 0.80 11 110 0.83 16 126 0.80 22 138 0.8412 2 64 0.76 2 65 0.73 8 93 0.99 3 78 0.63 20 134 0.83 14 118 0.85 32 156 0.8413 2 63 0.80 2 63 0.80 6 87 0.91 4 81 0.75 18 129 0.84 11 110 0.83 27 146 0.8714 2 64 0.76 2 65 0.73 8 95 0.93 2 66 0.70 18 127 0.88 14 118 0.85 36 161 0.8615 2 58 1.03 1 50 0.80 9 95 1.05 2 66 0.70 18 128 0.86 16 127 0.78 29 153 0.8116 1 52 0.71 6 90 0.82 6 85 0.98 2 70 0.58 20 132 0.87 31 154 0.85 55 191 0.79
Day 49 56 63 70 77 84 91 Sample M(g) L(mm) CF M(g) L(mm) CF M(g) L(mm) CF M(g) L(mm) CF M(g) L(mm) CF M(g) L(mm) CF M(g) L(mm) CF
1 58 191 0.83 37 168 0.78 58 188 0.87 52 181 0.88 64 193 0.89 65 198 0.84 66 195 0.892 20 133 0.85 33 161 0.79 37 160 0.90 56 190 0.82 39 171 0.78 74 204 0.87 57 186 0.893 42 170 0.85 41 170 0.83 55 183 0.90 42 175 0.78 91 216 0.90 62 193 0.86 71 200 0.894 8 103 0.73 31 155 0.83 48 176 0.88 54 192 0.76 66 197 0.86 68 197 0.89 69 198 0.895 35 158 0.89 40 170 0.81 46 175 0.86 27 147 0.85 55 187 0.84 55 187 0.84 65 194 0.896 36 158 0.91 25 150 0.74 26 140 0.95 56 192 0.79 43 174 0.82 46 177 0.83 68 197 0.897 37 160 0.90 36 166 0.79 27 144 0.90 61 195 0.82 69 198 0.89 82 212 0.86 64 194 0.888 43 172 0.85 35 165 0.78 41 170 0.83 71 200 0.89 76 209 0.83 65 200 0.81 70 200 0.889 42 170 0.85 47 170 0.96 42 171 0.84 49 178 0.87 43 175 0.80 75 175 1.40 58 188 0.87
10 23 137 0.89 32 158 0.81 65 205 0.75 55 185 0.87 54 182 0.90 75 175 1.40 66 194 0.9011 32 153 0.89 46 178 0.82 34 155 0.91 47 177 0.85 50 180 0.86 64 197 0.84 74 203 0.8812 23 137 0.89 33 159 0.82 54 186 0.84 36 166 0.79 77 210 0.83 57 189 0.84 63 193 0.8813 46 173 0.89 32 157 0.83 65 195 0.88 29 151 0.84 53 184 0.85 63 195 0.85 67 196 0.8914 31 151 0.90 26 152 0.74 32 155 0.86 54 184 0.87 66 195 0.89 84 210 0.91 65 196 0.8615 49 185 0.77 27 154 0.74 37 168 0.78 52 184 0.83 43 175 0.80 58 190 0.85 69 200 0.8616 29 148 0.89 25 142 0.87 32 158 0.81 47 177 0.85 40 170 0.81 73 205 0.85 76 206 0.87

- 57-
Continued
Treatment 8 Day 98 105 112 119 126 133
Sample M(g) L(mm) CF M(g) L(mm) CF M(g) L(mm) CF M(g) L(mm) CF M(g) L(mm) CF M(g) L(mm) CF 1 72 201 0.89 76 206 0.87 100 230 0.82 90 220 0.85 94 223 0.85 354 330 0.992 62 191 0.89 70 200 0.88 86 215 0.87 96 225 0.84 102 234 0.80 277 300 1.033 59 189 0.87 89 219 0.85 78 205 0.91 94 225 0.83 104 232 0.83 80 205 0.934 71 200 0.89 69 199 0.88 75 205 0.87 99 225 0.87 130 250 0.83 108 230 0.895 72 201 0.89 74 204 0.87 92 222 0.84 94 225 0.83 102 232 0.82 86 215 0.876 84 213 0.87 92 223 0.83 93 223 0.84 97 225 0.85 80 209 0.88 83 220 0.787 81 210 0.87 84 214 0.86 88 215 0.89 89 217 0.87 80 210 0.86 83 215 0.848 90 220 0.85 79 210 0.85 74 202 0.90 105 230 0.86 100 230 0.82 86 220 0.819 71 200 0.89 74 215 0.74 95 225 0.83 93 223 0.84 86 210 0.93 142 260 0.81
10 70 199 0.89 64 195 0.86 71 200 0.89 94 224 0.84 183 285 0.79 101 220 0.9511 62 190 0.90 75 205 0.87 96 226 0.83 97 227 0.83 121 241 0.86 229 300 0.8512 74 202 0.90 75 205 0.87 87 215 0.88 96 226 0.83 80 210 0.86 86 210 0.9313 72 201 0.89 76 204 0.90 86 215 0.87 87 215 0.88 75 205 0.87 121 240 0.8814 69 198 0.89 78 207 0.88 91 219 0.87 100 219 0.95 125 245 0.85 83 205 0.9615 70 199 0.89 69 199 0.88 78 205 0.91 90 221 0.83 120 240 0.87 78 220 0.7316 77 206 0.88 74 204 0.87 90 220 0.85 95 226 0.82 80 209 0.88 107 235 0.82
Day 140 147 154 161 168 175 Sample M(g) L(mm) CF M(g) L(mm) CF M(g) L(mm) CF M(g) L(mm) CF M(g) L(mm) CF M(g) L(mm) CF
1 206 304 0.73 192 285 0.83 80 210 0.86 190 280 0.87 175 270 0.89 199 275 0.962 187 280 0.85 109 235 0.84 138 257 0.81 108 236 0.82 177 275 0.85 221 300 0.823 131 263 0.72 115 239 0.84 221 300 0.82 88 217 0.86 229 280 1.04 134 240 0.974 102 234 0.80 92 225 0.81 80 210 0.86 237 311 0.79 214 295 0.83 210 290 0.865 126 245 0.86 160 270 0.81 109 240 0.79 213 296 0.82 175 275 0.84 229 309 0.786 135 250 0.86 203 285 0.88 209 295 0.81 86 220 0.81 190 280 0.87 207 302 0.757 79 210 0.85 224 290 0.92 288 320 0.88 138 245 0.94 164 270 0.83 158 260 0.908 115 235 0.89 227 305 0.80 80 210 0.86 113 240 0.82 146 260 0.83 185 286 0.799 153 267 0.80 73 213 0.76 135 260 0.77 180 286 0.77 153 265 0.82 191 283 0.84
10 194 293 0.77 98 220 0.92 103 235 0.79 106 234 0.83 123 250 0.79 168 275 0.8111 113 242 0.80 96 225 0.84 122 250 0.78 124 256 0.74 124 248 0.81 192 290 0.7912 115 245 0.78 163 270 0.83 261 316 0.83 213 294 0.84 115 247 0.76 122 245 0.8313 227 319 0.70 179 280 0.82 88 220 0.83 221 310 0.74 115 240 0.83 121 205 1.4014 137 160 3.34 145 260 0.82 96 235 0.74 156 240 1.13 105 235 0.81 94 230 0.7715 163 266 0.87 152 260 0.86 135 255 0.81 112 238 0.83 127 240 0.92 105 225 0.9216 78 211 0.83 70 205 0.81 186 283 0.82 120 240 0.87 120 234 0.94 110 240 0.80

- 58-
Continued
Treatment 9 Day 0 7 14 21 28 35 42
Sample M(g) L(mm) CF M(g) L(mm) CF M(g) L(mm) CF M(g) L(mm) CF M(g) L(mm) CF M(g) L(mm) CF M(g) L(mm) CF 1 2 60 0.93 4 80 0.78 11 105 0.95 5 85 0.81 14 120 0.81 21 133 0.89 33 157 0.852 2 64 0.76 4 76 0.91 5 85 0.81 4 87 0.61 16 121 0.90 22 135 0.89 31 153 0.873 2 62 0.84 8 99 0.82 5 80 0.98 27 150 0.80 22 141 0.78 14 118 0.85 33 156 0.874 2 63 0.80 10 105 0.86 13 113 0.90 17 125 0.87 17 122 0.94 47 184 0.75 45 177 0.815 2 61 0.88 5 87 0.76 5 86 0.79 21 140 0.77 12 107 0.98 17 126 0.85 38 166 0.836 2 57 1.08 6 91 0.80 11 110 0.83 2 72 0.54 14 115 0.92 23 137 0.89 17 126 0.857 2 59 0.97 6 90 0.82 2 62 0.84 20 137 0.78 24 142 0.84 6 93 0.75 11 115 0.728 3 73 0.77 5 88 0.73 9 102 0.85 9 105 0.78 16 124 0.84 15 120 0.87 18 132 0.789 1 50 0.80 4 80 0.78 9 103 0.82 19 132 0.83 20 130 0.91 38 164 0.86 15 123 0.81
10 1 50 0.80 3 74 0.74 3 70 0.87 4 84 0.67 14 117 0.87 12 114 0.81 20 135 0.8111 1 50 0.80 1 45 1.10 2 59 0.97 3 79 0.61 24 135 0.98 16 121 0.90 23 137 0.8912 4 47 3.85 1 52 0.71 4 72 1.07 12 116 0.77 27 148 0.83 20 130 0.91 11 116 0.7013 1 49 0.85 2 62 0.84 5 80 0.98 2 68 0.64 14 120 0.81 18 128 0.86 28 147 0.8814 1 54 0.64 4 80 0.78 13 113 0.90 6 93 0.75 16 125 0.82 19 130 0.86 25 146 0.8015 1 48 0.90 5 90 0.69 2 67 0.66 5 93 0.62 20 131 0.89 15 120 0.87 24 142 0.8416 2 60 0.93 8 100 0.80 18 130 0.82 5 92 0.64 23 135 0.93 26 144 0.87 22 138 0.84
Day 49 56 63 70 77 84 91 Sample M(g) L(mm) CF M(g) L(mm) CF M(g) L(mm) CF M(g) L(mm) CF M(g) L(mm) CF M(g) L(mm) CF M(g) L(mm) CF
1 17 121 0.96 36 162 0.85 47 175 0.88 35 160 0.85 62 195 0.84 63 190 0.92 51 182 0.852 30 152 0.85 63 198 0.81 33 158 0.84 52 184 0.83 36 166 0.79 60 190 0.87 54 185 0.853 51 181 0.86 59 193 0.82 27 145 0.89 47 177 0.85 42 176 0.77 62 190 0.90 74 202 0.904 34 157 0.88 35 160 0.85 40 170 0.81 46 178 0.82 52 182 0.86 58 190 0.85 60 192 0.855 22 135 0.89 61 192 0.86 56 182 0.93 45 174 0.85 45 175 0.84 75 205 0.87 72 200 0.906 60 190 0.87 34 158 0.86 24 137 0.93 36 168 0.76 54 192 0.76 59 189 0.87 62 193 0.867 32 160 0.78 34 158 0.86 28 140 1.02 48 180 0.82 43 172 0.85 66 195 0.89 84 213 0.878 32 159 0.80 28 155 0.75 43 174 0.82 47 176 0.86 40 170 0.81 71 200 0.89 62 193 0.869 28 148 0.86 38 166 0.83 34 160 0.83 20 135 0.81 66 200 0.83 59 189 0.87 44 175 0.82
10 39 169 0.81 28 155 0.75 54 180 0.93 62 190 0.90 56 188 0.84 63 190 0.92 62 192 0.8811 27 150 0.80 22 135 0.89 26 140 0.95 60 190 0.87 59 190 0.86 61 190 0.89 57 188 0.8612 17 121 0.96 24 140 0.87 40 170 0.81 48 179 0.84 39 165 0.87 65 195 0.88 65 196 0.8613 32 160 0.78 20 130 0.91 60 190 0.87 38 168 0.80 50 180 0.86 56 185 0.88 82 212 0.8614 26 148 0.80 41 171 0.82 42 173 0.81 22 138 0.84 59 192 0.83 70 200 0.88 87 216 0.8615 41 173 0.79 39 169 0.81 40 169 0.83 20 135 0.81 44 175 0.82 69 199 0.88 69 200 0.8616 16 122 0.88 35 156 0.92 22 135 0.89 21 134 0.87 55 185 0.87 60 189 0.89 61 192 0.86
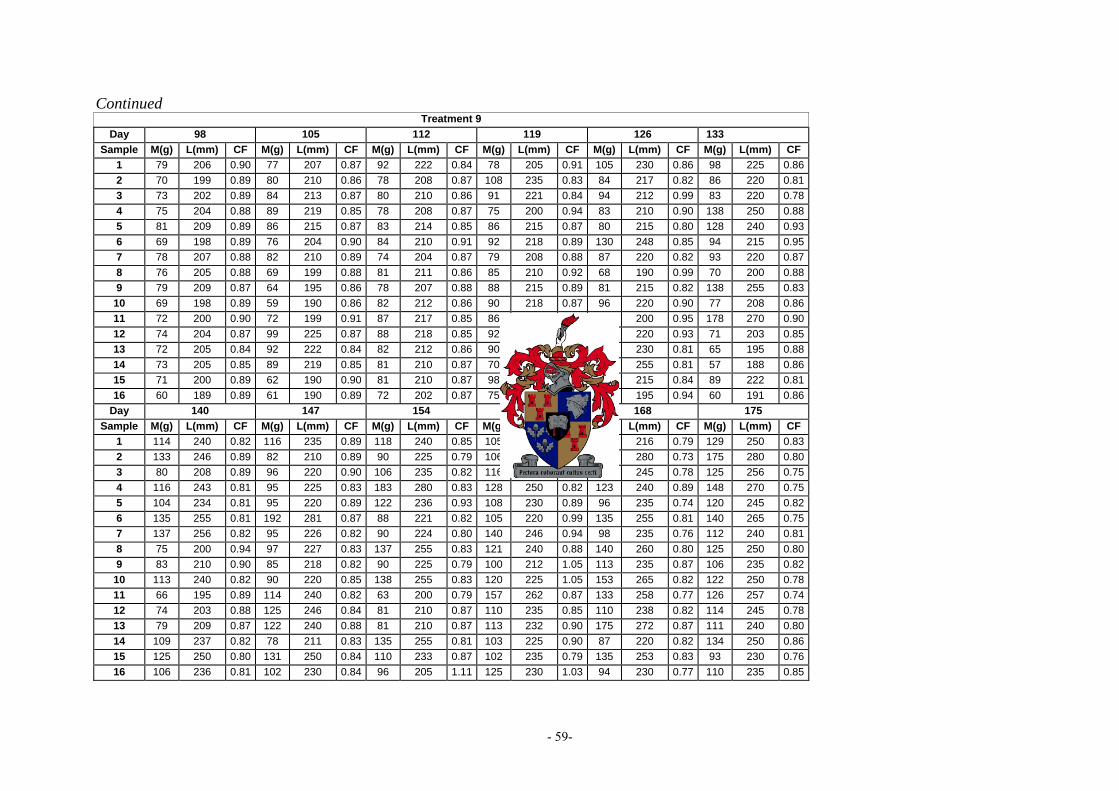
- 59-
Continued
Treatment 9 Day 98 105 112 119 126 133
Sample M(g) L(mm) CF M(g) L(mm) CF M(g) L(mm) CF M(g) L(mm) CF M(g) L(mm) CF M(g) L(mm) CF 1 79 206 0.90 77 207 0.87 92 222 0.84 78 205 0.91 105 230 0.86 98 225 0.862 70 199 0.89 80 210 0.86 78 208 0.87 108 235 0.83 84 217 0.82 86 220 0.813 73 202 0.89 84 213 0.87 80 210 0.86 91 221 0.84 94 212 0.99 83 220 0.784 75 204 0.88 89 219 0.85 78 208 0.87 75 200 0.94 83 210 0.90 138 250 0.885 81 209 0.89 86 215 0.87 83 214 0.85 86 215 0.87 80 215 0.80 128 240 0.936 69 198 0.89 76 204 0.90 84 210 0.91 92 218 0.89 130 248 0.85 94 215 0.957 78 207 0.88 82 210 0.89 74 204 0.87 79 208 0.88 87 220 0.82 93 220 0.878 76 205 0.88 69 199 0.88 81 211 0.86 85 210 0.92 68 190 0.99 70 200 0.889 79 209 0.87 64 195 0.86 78 207 0.88 88 215 0.89 81 215 0.82 138 255 0.83
10 69 198 0.89 59 190 0.86 82 212 0.86 90 218 0.87 96 220 0.90 77 208 0.8611 72 200 0.90 72 199 0.91 87 217 0.85 86 216 0.85 76 200 0.95 178 270 0.9012 74 204 0.87 99 225 0.87 88 218 0.85 92 222 0.84 99 220 0.93 71 203 0.8513 72 205 0.84 92 222 0.84 82 212 0.86 90 220 0.85 98 230 0.81 65 195 0.8814 73 205 0.85 89 219 0.85 81 210 0.87 70 199 0.89 135 255 0.81 57 188 0.8615 71 200 0.89 62 190 0.90 81 210 0.87 98 227 0.84 83 215 0.84 89 222 0.8116 60 189 0.89 61 190 0.89 72 202 0.87 75 203 0.90 70 195 0.94 60 191 0.86
Day 140 147 154 161 168 175 Sample M(g) L(mm) CF M(g) L(mm) CF M(g) L(mm) CF M(g) L(mm) CF M(g) L(mm) CF M(g) L(mm) CF
1 114 240 0.82 116 235 0.89 118 240 0.85 105 210 1.13 80 216 0.79 129 250 0.832 133 246 0.89 82 210 0.89 90 225 0.79 106 240 0.77 160 280 0.73 175 280 0.803 80 208 0.89 96 220 0.90 106 235 0.82 116 233 0.92 115 245 0.78 125 256 0.754 116 243 0.81 95 225 0.83 183 280 0.83 128 250 0.82 123 240 0.89 148 270 0.755 104 234 0.81 95 220 0.89 122 236 0.93 108 230 0.89 96 235 0.74 120 245 0.826 135 255 0.81 192 281 0.87 88 221 0.82 105 220 0.99 135 255 0.81 140 265 0.757 137 256 0.82 95 226 0.82 90 224 0.80 140 246 0.94 98 235 0.76 112 240 0.818 75 200 0.94 97 227 0.83 137 255 0.83 121 240 0.88 140 260 0.80 125 250 0.809 83 210 0.90 85 218 0.82 90 225 0.79 100 212 1.05 113 235 0.87 106 235 0.82
10 113 240 0.82 90 220 0.85 138 255 0.83 120 225 1.05 153 265 0.82 122 250 0.7811 66 195 0.89 114 240 0.82 63 200 0.79 157 262 0.87 133 258 0.77 126 257 0.7412 74 203 0.88 125 246 0.84 81 210 0.87 110 235 0.85 110 238 0.82 114 245 0.7813 79 209 0.87 122 240 0.88 81 210 0.87 113 232 0.90 175 272 0.87 111 240 0.8014 109 237 0.82 78 211 0.83 135 255 0.81 103 225 0.90 87 220 0.82 134 250 0.8615 125 250 0.80 131 250 0.84 110 233 0.87 102 235 0.79 135 253 0.83 93 230 0.7616 106 236 0.81 102 230 0.84 96 205 1.11 125 230 1.03 94 230 0.77 110 235 0.85
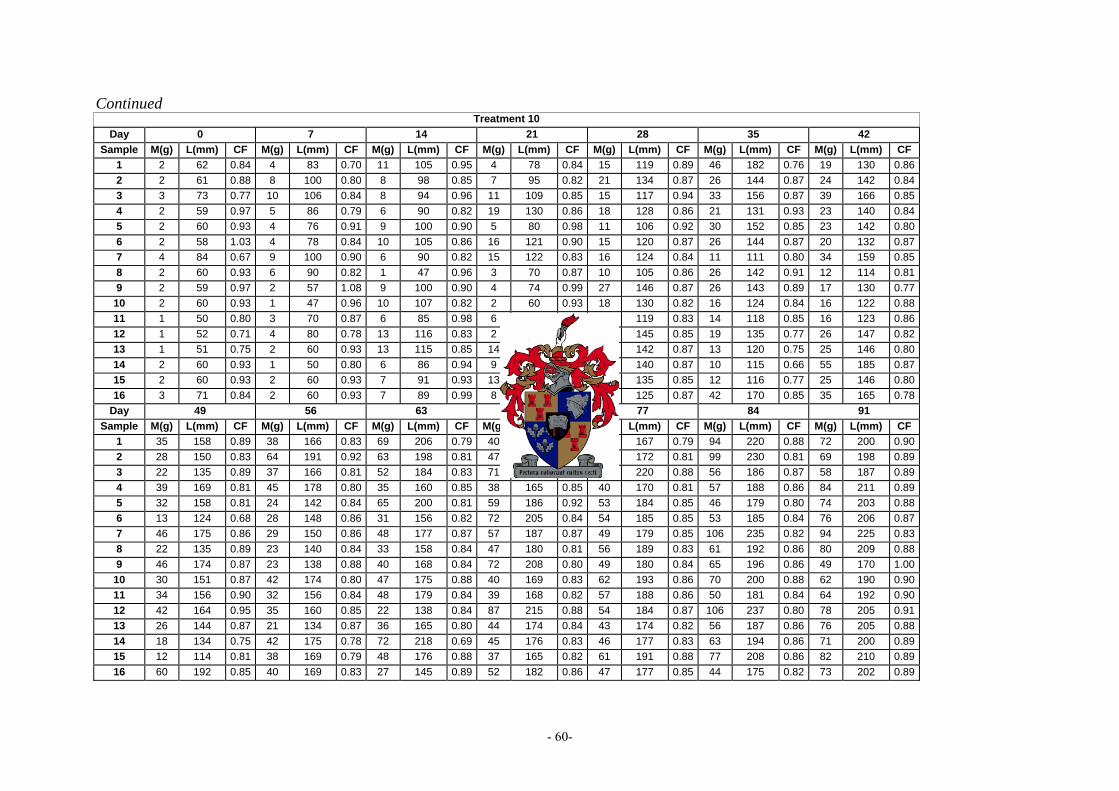
- 60-
Continued
Treatment 10 Day 0 7 14 21 28 35 42
Sample M(g) L(mm) CF M(g) L(mm) CF M(g) L(mm) CF M(g) L(mm) CF M(g) L(mm) CF M(g) L(mm) CF M(g) L(mm) CF 1 2 62 0.84 4 83 0.70 11 105 0.95 4 78 0.84 15 119 0.89 46 182 0.76 19 130 0.862 2 61 0.88 8 100 0.80 8 98 0.85 7 95 0.82 21 134 0.87 26 144 0.87 24 142 0.843 3 73 0.77 10 106 0.84 8 94 0.96 11 109 0.85 15 117 0.94 33 156 0.87 39 166 0.854 2 59 0.97 5 86 0.79 6 90 0.82 19 130 0.86 18 128 0.86 21 131 0.93 23 140 0.845 2 60 0.93 4 76 0.91 9 100 0.90 5 80 0.98 11 106 0.92 30 152 0.85 23 142 0.806 2 58 1.03 4 78 0.84 10 105 0.86 16 121 0.90 15 120 0.87 26 144 0.87 20 132 0.877 4 84 0.67 9 100 0.90 6 90 0.82 15 122 0.83 16 124 0.84 11 111 0.80 34 159 0.858 2 60 0.93 6 90 0.82 1 47 0.96 3 70 0.87 10 105 0.86 26 142 0.91 12 114 0.819 2 59 0.97 2 57 1.08 9 100 0.90 4 74 0.99 27 146 0.87 26 143 0.89 17 130 0.77
10 2 60 0.93 1 47 0.96 10 107 0.82 2 60 0.93 18 130 0.82 16 124 0.84 16 122 0.8811 1 50 0.80 3 70 0.87 6 85 0.98 6 90 0.82 14 119 0.83 14 118 0.85 16 123 0.8612 1 52 0.71 4 80 0.78 13 116 0.83 2 62 0.84 26 145 0.85 19 135 0.77 26 147 0.8213 1 51 0.75 2 60 0.93 13 115 0.85 14 119 0.83 25 142 0.87 13 120 0.75 25 146 0.8014 2 60 0.93 1 50 0.80 6 86 0.94 9 101 0.87 24 140 0.87 10 115 0.66 55 185 0.8715 2 60 0.93 2 60 0.93 7 91 0.93 13 115 0.85 21 135 0.85 12 116 0.77 25 146 0.8016 3 71 0.84 2 60 0.93 7 89 0.99 8 97 0.88 17 125 0.87 42 170 0.85 35 165 0.78
Day 49 56 63 70 77 84 91 Sample M(g) L(mm) CF M(g) L(mm) CF M(g) L(mm) CF M(g) L(mm) CF M(g) L(mm) CF M(g) L(mm) CF M(g) L(mm) CF
1 35 158 0.89 38 166 0.83 69 206 0.79 40 168 0.84 37 167 0.79 94 220 0.88 72 200 0.902 28 150 0.83 64 191 0.92 63 198 0.81 47 176 0.86 41 172 0.81 99 230 0.81 69 198 0.893 22 135 0.89 37 166 0.81 52 184 0.83 71 201 0.87 94 220 0.88 56 186 0.87 58 187 0.894 39 169 0.81 45 178 0.80 35 160 0.85 38 165 0.85 40 170 0.81 57 188 0.86 84 211 0.895 32 158 0.81 24 142 0.84 65 200 0.81 59 186 0.92 53 184 0.85 46 179 0.80 74 203 0.886 13 124 0.68 28 148 0.86 31 156 0.82 72 205 0.84 54 185 0.85 53 185 0.84 76 206 0.877 46 175 0.86 29 150 0.86 48 177 0.87 57 187 0.87 49 179 0.85 106 235 0.82 94 225 0.838 22 135 0.89 23 140 0.84 33 158 0.84 47 180 0.81 56 189 0.83 61 192 0.86 80 209 0.889 46 174 0.87 23 138 0.88 40 168 0.84 72 208 0.80 49 180 0.84 65 196 0.86 49 170 1.00
10 30 151 0.87 42 174 0.80 47 175 0.88 40 169 0.83 62 193 0.86 70 200 0.88 62 190 0.9011 34 156 0.90 32 156 0.84 48 179 0.84 39 168 0.82 57 188 0.86 50 181 0.84 64 192 0.9012 42 164 0.95 35 160 0.85 22 138 0.84 87 215 0.88 54 184 0.87 106 237 0.80 78 205 0.9113 26 144 0.87 21 134 0.87 36 165 0.80 44 174 0.84 43 174 0.82 56 187 0.86 76 205 0.8814 18 134 0.75 42 175 0.78 72 218 0.69 45 176 0.83 46 177 0.83 63 194 0.86 71 200 0.8915 12 114 0.81 38 169 0.79 48 176 0.88 37 165 0.82 61 191 0.88 77 208 0.86 82 210 0.8916 60 192 0.85 40 169 0.83 27 145 0.89 52 182 0.86 47 177 0.85 44 175 0.82 73 202 0.89
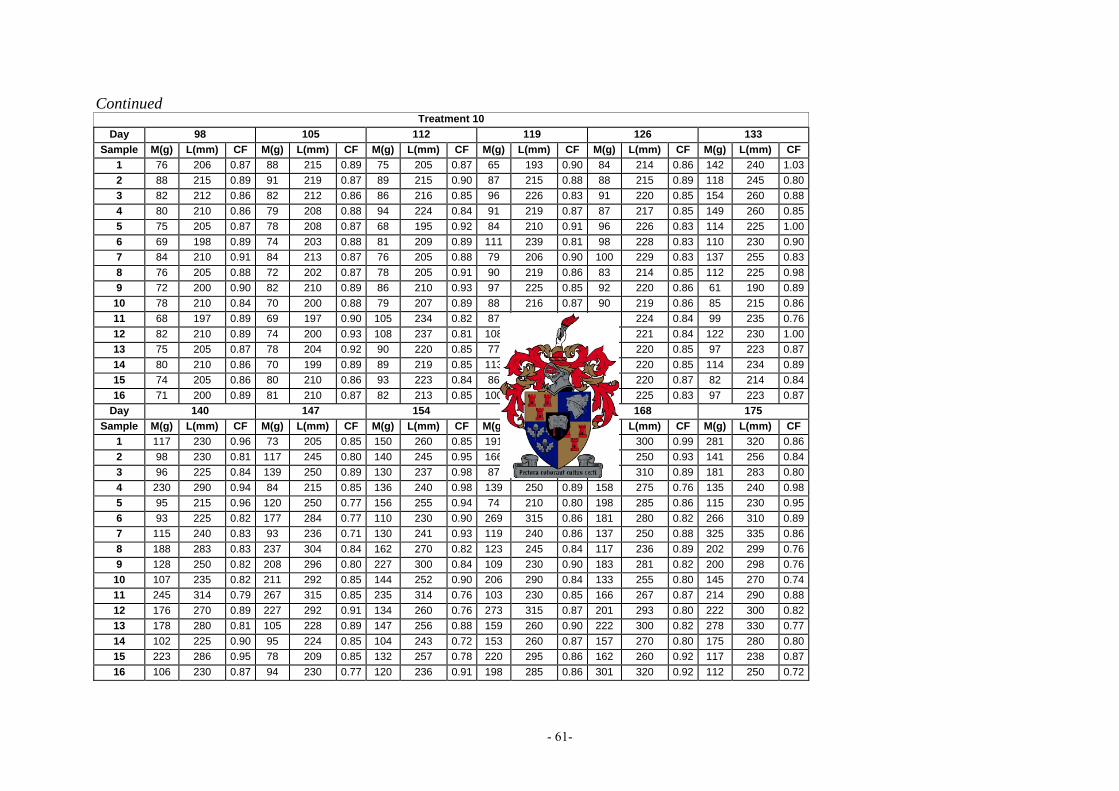
- 61-
Continued
Treatment 10 Day 98 105 112 119 126 133
Sample M(g) L(mm) CF M(g) L(mm) CF M(g) L(mm) CF M(g) L(mm) CF M(g) L(mm) CF M(g) L(mm) CF 1 76 206 0.87 88 215 0.89 75 205 0.87 65 193 0.90 84 214 0.86 142 240 1.032 88 215 0.89 91 219 0.87 89 215 0.90 87 215 0.88 88 215 0.89 118 245 0.803 82 212 0.86 82 212 0.86 86 216 0.85 96 226 0.83 91 220 0.85 154 260 0.884 80 210 0.86 79 208 0.88 94 224 0.84 91 219 0.87 87 217 0.85 149 260 0.855 75 205 0.87 78 208 0.87 68 195 0.92 84 210 0.91 96 226 0.83 114 225 1.006 69 198 0.89 74 203 0.88 81 209 0.89 111 239 0.81 98 228 0.83 110 230 0.907 84 210 0.91 84 213 0.87 76 205 0.88 79 206 0.90 100 229 0.83 137 255 0.838 76 205 0.88 72 202 0.87 78 205 0.91 90 219 0.86 83 214 0.85 112 225 0.989 72 200 0.90 82 210 0.89 86 210 0.93 97 225 0.85 92 220 0.86 61 190 0.89
10 78 210 0.84 70 200 0.88 79 207 0.89 88 216 0.87 90 219 0.86 85 215 0.8611 68 197 0.89 69 197 0.90 105 234 0.82 87 216 0.86 94 224 0.84 99 235 0.7612 82 210 0.89 74 200 0.93 108 237 0.81 108 235 0.83 91 221 0.84 122 230 1.0013 75 205 0.87 78 204 0.92 90 220 0.85 77 207 0.87 90 220 0.85 97 223 0.8714 80 210 0.86 70 199 0.89 89 219 0.85 113 240 0.82 91 220 0.85 114 234 0.8915 74 205 0.86 80 210 0.86 93 223 0.84 86 215 0.87 93 220 0.87 82 214 0.8416 71 200 0.89 81 210 0.87 82 213 0.85 100 229 0.83 95 225 0.83 97 223 0.87
Day 140 147 154 161 168 175 Sample M(g) L(mm) CF M(g) L(mm) CF M(g) L(mm) CF M(g) L(mm) CF M(g) L(mm) CF M(g) L(mm) CF
1 117 230 0.96 73 205 0.85 150 260 0.85 191 280 0.87 267 300 0.99 281 320 0.862 98 230 0.81 117 245 0.80 140 245 0.95 166 270 0.84 145 250 0.93 141 256 0.843 96 225 0.84 139 250 0.89 130 237 0.98 87 220 0.82 264 310 0.89 181 283 0.804 230 290 0.94 84 215 0.85 136 240 0.98 139 250 0.89 158 275 0.76 135 240 0.985 95 215 0.96 120 250 0.77 156 255 0.94 74 210 0.80 198 285 0.86 115 230 0.956 93 225 0.82 177 284 0.77 110 230 0.90 269 315 0.86 181 280 0.82 266 310 0.897 115 240 0.83 93 236 0.71 130 241 0.93 119 240 0.86 137 250 0.88 325 335 0.868 188 283 0.83 237 304 0.84 162 270 0.82 123 245 0.84 117 236 0.89 202 299 0.769 128 250 0.82 208 296 0.80 227 300 0.84 109 230 0.90 183 281 0.82 200 298 0.76
10 107 235 0.82 211 292 0.85 144 252 0.90 206 290 0.84 133 255 0.80 145 270 0.7411 245 314 0.79 267 315 0.85 235 314 0.76 103 230 0.85 166 267 0.87 214 290 0.8812 176 270 0.89 227 292 0.91 134 260 0.76 273 315 0.87 201 293 0.80 222 300 0.8213 178 280 0.81 105 228 0.89 147 256 0.88 159 260 0.90 222 300 0.82 278 330 0.7714 102 225 0.90 95 224 0.85 104 243 0.72 153 260 0.87 157 270 0.80 175 280 0.8015 223 286 0.95 78 209 0.85 132 257 0.78 220 295 0.86 162 260 0.92 117 238 0.8716 106 230 0.87 94 230 0.77 120 236 0.91 198 285 0.86 301 320 0.92 112 250 0.72
- 62-