Embed Size (px)
Citation preview

Application of the Lake Okeechobee Regulation Schedule (LORS2008) on 4/11/2016 (El Nino Condition)
Lake Okeechobee Net Inflow Outlook:
The Lake Okeechobee Net Inflow Outlook has been computed using 4 methods: Croley's method1, the SFWMD empirical method2, a sub-sampling of El Nino years3 and a sub-sampling of warm years of the Atlantic Multi-decadal Oscillation (AMO) in combination with El Nino ENSO years4. The results for Croley's method and the SFWMD empirical method are based on the CPC Outlook.
Table of the Lake Okeechobee Net Inflow Outlooks in feet of equivalent depth. All methods are updated on a weekly basis with observed net inflow for the current month.
Season
Croley's
Method1*
SFWMD
Empirical
Method2
Sub-sampling of
El Nino ENSO
Years3
Sub-sampling of
AMO Warm + El
Nino ENSO
Years4
Value
(ft)Condition
Value
(ft)Condition
Value
(ft)Condition
Value
(ft)Condition
Current
(Apr-
Sep)
N/A N/A 1.85 Wet 1.79 Wet 2.86 Very Wet
Multi
Seasonal
(May-
Apr)
N/A N/A 2.53 Wet 3.99 Wet 6.05 Very Wet
*Croley’s Method Not Produced For This Report
See Seasonal and Multi-Seasonal tables for the classification of Lake Okeechobee Outlooks.
The recommended methods and values for estimating the Lake Okeechobee Net Inflow Outlook are shaded and should be used in the LORS2008 Release Guidance Flow Charts.

Tributary Hydrologic Conditions Graph:
1803 cfs 14-day running average for Lake Okeechobee Net Inflow through 4/11/2016. According to the classification in Tributary Hydrologic Conditions table, this condition is Normal.
0.05 for Palmer Index on 4/10/2016.According to the classification in Tributary Hydrologic Conditions table, this condition is Normal.
The wetter of the two conditions above is Normal.
LORS2008 Classification Tables:
Lake Okeechobee Stage on 4/11/2016
Lake Okeechobee Stage: 14.89 feet
USACE Report for Lake Okeechobee
Lake Okeechobee Stage Hydrograph
Lake Okeechobee Management
Zone/Band
Bottom Elevation
(feet, NGVD)
Current
Lake Stage
High Lake Management Band 17.05
Operational
Band
High sub-band 16.34
Intermediate
sub-band 15.42
Low sub-band 13.50 14.89
Base Flow sub-band 12.60
Beneficial Use sub-band 11.45
Water Shortage Management Band

Part C of LORS2008: Discharge to WCA's
Release Guidance Flow Chart Outcome: Up to Maximum Releases to the WCAs if Desirable or with Minimum Everglades Impacts
Part D of LORS2008: Discharge to Tidewater
Release Guidance Flow Chart Outcome: S-79 up to 3000 cfs and S-80 up to 1170 cfs
Technical Input Summaries from:
• Lake Okeechobee Division• Coastal Ecosystems• Everglades Ecosystems Division• Water Supply Department• Water Resource Management Release Recommendation• Kissimmee Watershed Environmental Conditions• Operations Department
Back to Lake Okeechobee Operations Main Page
Back to U.S. Army Corps of Engineers LORSS Homepage

LORS2008 Implementation on 4/11/2016 (ENSO El Nino Condition):
Water Supply Department Technical Input
Water Supply Outlook:
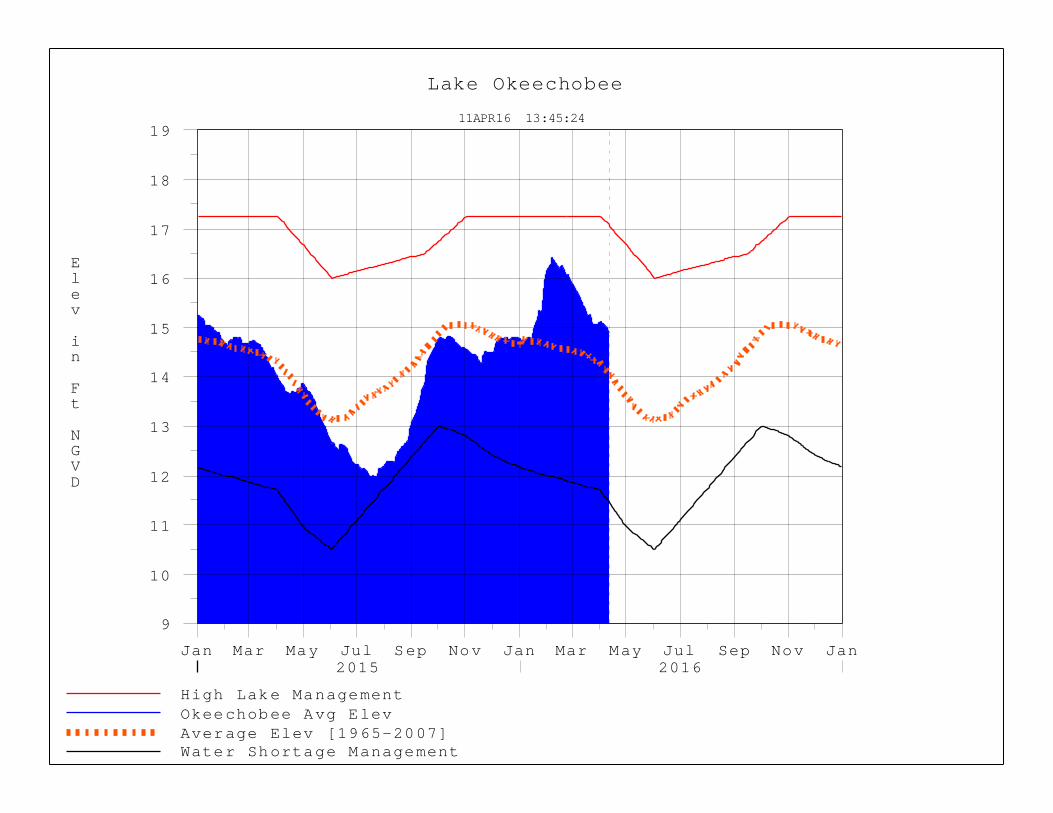
District wide, Raindar rainfall 0.02 inches for the week ending 4/11/2016. Lake stage on 4/11/2016 is 14.89 ft, down 0.20 ft from last week. The updated April 2016 SFWMM Dynamic Position Analysis percentile graph and tracking chart for Lake Okeechobee show that the lake stage is in the Low Operational Sub-Band.
The LORS2008 tributary indices are classified as Normal. The PDSI indicates normal condition and the LONIN is Normal. The classification is based on the wetter of the two.
Water Supply Risk Evaluation
Area Indicator Value Color Coded
Scoring Scheme
LOK
Projected LOK Stage for the next two months
Low Flow Sub-Band M
Palmer Index for LOK Tributary Conditions
0.05 L
(Normal)
CPC Precipitation Outlook 1 month: Normal L
3 months: Above Normal L
LOK Seasonal Net Inflow Forecast 1.79 ft (Normal to Extremely Wet)
L AMO warm/El Nino
LOK Multi-Seasonal Net Inflow Forecast 3.99 ft (Normal) L
AMO warm/El Nino
WCAs
WCA 1: Site 1-7, Site 1-8T, & Site 1-9 Average
Above Line 1 (16.20 ft) L
WCA 2A: Site 2-17 HW Above Line1 (11.90 ft) L
WCA-3A: 3 Station Average (Site 63, 64 and 65)
Above Line 1 (10.35 ft) L
LEC
Service Area 1 Year-Round Irrigation Rule
in effect L
Service Area 2 Year-Round Irrigation Rule
in effect L
Service Area 3 Year-Round Irrigation Rule
in effect L
Note: The water supply risk classification based on the Palmer index, as well as the LOK seasonal and multi-seasonal net inflow forecasts use slightly different classification intervals than those used by the 2008-LORS for classifying the tributary hydrologic condition (THC).
Back to Lake Okeechobee Operations Main PageBack to U.S. Army Corps of Engineers LORSS Homepage

Mar
12
13
14
15
16
Sta
ge (
feet
, NG
VD
)Lake Okeechobee SFWMM April 2016 Position Analysis
Percentiles PA_LA1
Mon Apr 11 15:25:07 2016
Historical
12
13
14
15
16
Mon Apr 11 15:25:07 2016
MAXP95P90P75P50P25P10P5MIN
Beneficial Use Band
HLM High Inter Low BasFlo BenUse
Intermediate Sub−Band
(See assumptions on the Position Analysis Results website)

3−18
−201
54−
1−20
154−
15−2
015
4−29
−201
55−
13−2
015
5−27
−201
56−
10−2
015
6−24
−201
57−
8−20
157−
22−2
015
8−5−
2015
8−19
−201
59−
2−20
159−
16−2
015
9−30
−201
510
−14−
2015
10−2
8−20
1511
−11−
2015
11−2
5−20
1512
−9−2
015
12−2
3−20
151−
6−20
161−
20−2
016
2−3−
2016
2−17
−201
63−
2−20
163−
16−2
016
3−30
−201
64−
13−2
016
−10000−5000
05000
1000015000200002500030000
Flo
w (
cfs)
Lake Okeechobee Net Inflow (LONIN) 14−day Running Average
Mon Apr 11 15:17:31 EDT 2016
< Very Wet< Wet> Dry> Very Dry
Mon Apr 11 15:17:31 EDT 2016
3−18
−201
54−
1−20
154−
15−2
015
4−29
−201
55−
13−2
015
5−27
−201
56−
10−2
015
6−24
−201
57−
8−20
157−
22−2
015
8−5−
2015
8−19
−201
59−
2−20
159−
16−2
015
9−30
−201
510
−14−
2015
10−2
8−20
1511
−11−
2015
11−2
5−20
1512
−9−2
015
12−2
3−20
151−
6−20
161−
20−2
016
2−3−
2016
2−17
−201
63−
2−20
163−
16−2
016
3−30
−201
64−
13−2
016
−6
−4
−2
0
2
4
6
Tributary Basin Condition Indicators as of April 11 2016Palmer Index
Mon Apr 11 15:17:31 EDT 2016
< Very Wet< Wet> Dry> Very Dry
Mon Apr 11 15:17:31 EDT 2016
Normal
Normal

NORMAL TOVERY WETTributary
HydrologicConditions
Multi-Seasonal
Climate/HydroOutlook
STARTLake Okeechobee
Water Level
AllDownstreamWCAs < max
of upperschedule+0.25 ft
MaximumPracticableto WCAs
NoReleasesto WCAs
DesirableOR with minimum
Evergladesimpacts
Up to MaximumPracticableto WCAs
NoReleasesto WCAs
AllDownstreamWCAs < max
of upperschedule+0.25 ft
MaximumPracticableto WCAs
NoReleasesto WCAs
PumpMaximum
Practicableto WCAs
2008 LORSPart C: Establish Allowable Lake Okeechobee Releases to the Water Conservation Areas
High Lake Management Band
OTHERWISE
DRY
FALSE
TRUE
FALSE
TRUE
FALSE
TRUE
Note: This operational guidance provides essentialsupplementary information to be used in conjunction withother supporting documentation including text within theWater Control Plan.
High
Intermediate
Low
Base Flow
Fig
ure
7-3
Apply TributaryCondition
Criteria Daily
Apply Multi-SeasonalClimate/Hydrologic Outlooks
on a Monthly Basis
DRY

VERY WET
NORMAL TO DRY
Up to 30 dayMeteorological
Forecast
Lake level projected to rise to High Lake Management Band
VERY WET
FALSE
WET TO VERY WET
WETTributaryHydrologicConditions
Multi-Seasonal
Climate/HydroOutlook
S-79 Up to 450 cfsS-80 Up to 200 cfs
S-79 Up to 3000 cfsS-80 Up to 1170 cfs
S-79 Up to 450 cfsS-80 Up to 200 cfs
Up to Maximum Discharge Capacity
To Tidewater
2008 LORSPart D: Establish Allowable Lake Okeechobee Releases to Tide (Estuaries)
STARTLake Okeechobee
Level
DRY *
NORMAL OR WETTER
TributaryHydrologicConditions
TributaryHydrologicConditions
Lake Stagewithin 1.0 ft ofIntermediate
SeasonalClimate/Hydrologic
Outlook
SeasonalClimate/Hydrologic
Outlook
Multi-Seasonal
Climate/HydroOutlook
S-77 Up to 4000 cfsS-80 Up to 1800 cfs
S-79 Up to 3000 cfsS-80 Up to 1170 cfs
S-77 Up to 6500 cfsS-80 Up to 2800 cfs
Up to 30 dayMeteorological
Forecast
Up to 30 dayMeteorological
Forecast
S-77 Up to 6500 cfsS-80 Up to 2800 cfs
S-77 Up to 4000 cfsS-80 Up to 1800 cfs
S-79 Up to 3000 cfsS-80 Up to 1170 cfs
SeasonalClimate/Hydrologic
Outlook
TRUE VERY WET
OTHERWISE
DRY
NORMAL TO WET
Lake level projected to rise to High
EITHER FORECAST INDICATESNORMAL TO VERY WET
BOTH FORECASTS INDICATE DRY
NORMAL TO VERY WET
DRY
VERY WET
NORMAL TO WET
DRY
NORMAL TO VERY WET
WET TO VERY WET
DRY
NORMAL TO DRY
Note: This operational guidance provides essential supplementary information to be used in conjunctionwith other supporting documentation including text within the Water Control Plan.
NORMAL TO DRY
High Lake Management Band
High
Intermediate
Low *
* Very Dry Conditions may require that releases to tide (estuaries) be discontinued
NORMAL
SeasonalClimate/Hydro
Outlook &Meteorological
Forecast
OTHERWISE OTHERWISE
(NORMAL TO DRY)Base Flow *
Fig
ure
7-4
Apply Meteorological Forecasts on aWeekly Basis; apply Seasonal and
Multi-Seasonal Climate/Hydrologic Outlooks on a Monthly Basis
When conducting Base Flow releases, flows can be distributed East and West
up to 650 cfs as neededto minimize impacts or provide benefits
through S-80 and S-79
S-79 Up to 450 cfsS-80 Up to 200 cfs

NORMAL TOVERY WETTributary
HydrologicConditions
Multi-Seasonal
Climate/HydroOutlook
STARTLake Okeechobee
Water Level
AllDownstreamWCAs < max
of upperschedule+0.25 ft
MaximumPracticableto WCAs
NoReleasesto WCAs
DesirableOR with minimum
Evergladesimpacts
Up to MaximumPracticableto WCAs
NoReleasesto WCAs
AllDownstreamWCAs < max
of upperschedule+0.25 ft
MaximumPracticableto WCAs
NoReleasesto WCAs
PumpMaximum
Practicableto WCAs
2008 LORS FORECASTPart C: Establish Allowable Lake Okeechobee Releases to the Water Conservation Areas
High Lake Management Band
OTHERWISE
DRY
FALSE
TRUE
FALSE
TRUE
FALSE
TRUE
Note: This operational guidance provides essential supplementary information to be used in conjunction with other supporting documentation including text within the Water Control Plan.
High
Intermediate
Low
Base Flow
Fig
ure
7-3
Apply TributaryCondition
Criteria Daily
Apply Multi-SeasonalClimate/Hydrologic Outlooks
on a Monthly Basis
DRY

VERY WET
NORMAL TO DRY
Up to 30 dayMeteorological
Forecast
Lake level projected to rise to High Lake Management Band
VERY WET
FALSE
WET TO VERY WET
WETTributaryHydrologicConditions
Multi-Seasonal
Climate/HydroOutlook
S-79 Up to 450 cfsS-80 Up to 200 cfs
S-79 Up to 3000 cfsS-80 Up to 1170 cfs
S-79 Up to 450 cfsS-80 Up to 200 cfs
Up to Maximum Discharge Capacity
To Tidewater
2008 LORS FORECASTPart D: Establish Allowable Lake Okeechobee Releases to Tide (Estuaries)
STARTLake Okeechobee
Level
DRY *
NORMAL OR WETTER
TributaryHydrologicConditions
TributaryHydrologicConditions
Lake Stagewithin 1.0 ft ofIntermediate
SeasonalClimate/Hydrologic
Outlook
SeasonalClimate/Hydrologic
Outlook
Multi-Seasonal
Climate/HydroOutlook
S-77 Up to 4000 cfsS-80 Up to 1800 cfs
S-79 Up to 3000 cfsS-80 Up to 1170 cfs
S-77 Up to 6500 cfsS-80 Up to 2800 cfs
Up to 30 dayMeteorological
Forecast
Up to 30 dayMeteorological
Forecast
S-77 Up to 6500 cfsS-80 Up to 2800 cfs
S-77 Up to 4000 cfsS-80 Up to 1800 cfs
S-79 Up to 3000 cfsS-80 Up to 1170 cfs
SeasonalClimate/Hydrologic
Outlook
TRUE VERY WET
OTHERWISE
DRY
NORMAL TO WET
Lake level projected to rise to High
EITHER FORECAST INDICATESNORMAL TO VERY WET
BOTH FORECASTS INDICATE DRY
NORMAL TO VERY WET
DRY
VERY WET
NORMAL TO WET
DRY
NORMAL TO VERY WET
WET TO VERY WET
DRY
NORMAL TO DRY
Note: This operational guidance provides essential supplementary information to be used in conjunctionwith other supporting documentation including text within the Water Control Plan.
NORMAL TO DRY
High Lake Management Band
High
Intermediate
Low *
* Very Dry Conditions may require that releases to tide (estuaries) be discontinued
NORMAL
SeasonalClimate/Hydro
Outlook &Meteorological
Forecast
OTHERWISE OTHERWISE
(NORMAL TO DRY)Base Flow *
Fig
ure
7-4
Apply Meteorological Forecasts on aWeekly Basis; apply Seasonal and
Multi-Seasonal Climate/Hydrologic Outlooks on a Monthly Basis
When conducting Base Flow releases, flows can be distributed East and West
up to 650 cfs as neededto minimize impacts or provide benefits
through S-80 and S-79
S-79 Up to 450 cfsS-80 Up to 200 cfs


U. S. Army Corps of Engineers, Jacksonville District Lake Okeechobee and Vicinity Report ** Preliminary Data - Subject to Revision **
Data Ending 2400 hours 10 APR 2016 _____________________________________________________________________________
Okeechobee Lake Regulation Elevation Last Year 2YRS Ago (ft-NGVD) (ft-NGVD) (ft-NGVD) *Okeechobee Lake Elevation 14.89 13.71 13.37 (Official Elv) Bottom of High Lake Mngmt= 17.07 Top of Water Short Mngmt= 11.45 Currently in Operational Management Band
Simulated Average LORS2008 [1965-2000] 12.83 Difference from Average LORS2008 2.06
10APR (1965-2007) Period of Record Average 14.07 Difference from POR Average 0.82
Today Lake Okeechobee elevation is determined from the 4 Int & 4 Edge stations
++Navigation Depth (Based on 2007 Channel Condition Survey) Route 1 ÷ 8.83' ++Navigation Depth (Based on 2008 Channel Condition Survey) Route 2 ÷ 7.03' Bridge Clearance = 49.15' ______________________________________________________________________________
4 Interior and 4 Edge Okeechobee Lake Average (Avg-Daily values):
L001 L005 L006 LZ40 S4 S352 S308 S133 14.74 15.00 14.94 14.86 15.02 15.01 14.80 14.78
*Combination Okeechobee Avg-Daily Lake Average = 14.89 (*See Note) ______________________________________________________________________________
Okeechobee Inflows (cfs): S65E 4113 C5 0 Fisheating Cr 24 S154 0 S191 0 S135 Pumps 0 S84 0 S133 Pumps 0 S2 Pumps 0 S84X 0 S127 Pumps 0 S3 Pumps 0 S71 0 S129 Pumps 0 S4 Pumps 0 S72 0 S131 Pumps 0 Total Inflows: 4137
Okeechobee Outflows (cfs): S135 Culverts 0 S354 411 S77 (Not Used) S127 Culverts 0 S351 1168 S77Below 3104 (USED) S129 Culverts -NR- S352 364 S308 (Not Used)

S131 Culverts -NR- L8 Canal Pt 170 S308Below 866 (USED) Total Outflows: 6082
****S77 Structure outflow is being used to compute Total Outflow. ****S308 Structure outflow is being used to compute Total Outflow.
Okeechobee Pan Evaporation (inches): S77 0.21 S308 0.15 Average Pan Evap x 0.75 Pan Coefficient = 0.14" = 0.01'
Lake Average Precipitation using NEXRAD: = 0.00" = 0.00'
Evaporation - Precipitation: = 0.14" = 0.01' Evaporation - Precipitation using Lake Area of 730 square miles is equal to 2650 cfs out of the lake. Lake Okeechobee (Change in Storage) Flow is -10638 cfs or -21100 AC-FT ______________________________________________________________________________ ______________________________________________________________________________
Note: Headwater, tailwater, and stage values below are instantaneous values unless otherwise specified.
Headwater Tailwater ----------- Gate Positions ------------ Elevation Elevation Disch #1 #2 #3 #4 #5 #6 #7 #8 (ft-msl) (ft-msl) (cfs) (ft) (ft) (ft) (ft) (ft) (ft) (ft) (ft) (I) see note at bottom North East Shore S133 Pumps: 13.66 14.80 0 0 0 0 0 0 (cfs) S193: ______ S191: 18.28 14.79 0 0.0 0.0 0.0 S135 Pumps: ______ -NR- 0 0 0 0 0 (cfs) S135 Culverts: 0 -NR- -NR-
North West Shore S65E: 21.17 14.66 4113 1.4 1.4 1.4 1.4 0.9 0.9 S127 Pumps: 13.39 14.86 0 0 0 0 0 0 (cfs) S127 Culvert: 0 0.0
S129 Pumps: 13.22 14.98 0 0 0 0 (cfs) S129 Culvert: -NR- -NR-
S131 Pumps: 12.99 15.09 0 0 0 (cfs) S131 Culvert: -NR-
Fisheating Creek nr Palmdale 29.06 24 nr Lakeport ______ C5: 14.44 14.97 0 0.0 0.0 0.0

South Shore S4 Pumps: 10.79 14.95 0 0 0 0 (cfs) S169: 14.98 10.78 35 0.0 0.0 0.0 S310: 14.90 88 S3 Pumps: 10.47 14.96 0 0 0 0 (cfs) S354: 14.96 10.47 411 7.5 7.5 S2 Pumps: 10.59 14.90 0 0 0 0 0 (cfs) S351: 14.90 10.59 1168 2.0 2.0 2.0 S352: 14.92 11.00 364 0.9 0.9 C10A: -NR- 13.71 0.0 0.0 4.0 0.0 0.0 L8 Canal PT 13.51 170
_________________________________________________________________________ S351 and S352 Temporary Pumps/S354 Spillway
S351: 10.59 14.90 1168 -NR--NR--NR--NR--NR--NR- S352: 11.00 14.92 364 -NR--NR--NR--NR- S354: 10.47 14.96 411 -NR--NR--NR--NR- _________________________________________________________________________
Caloosahatchee River (S77, S78, S79) S47B: 12.83 10.97 0.0 0.0 S47D: 11.01 11.01 13 5.0 S77: Spillway and Sector Flow: 14.50 11.13 3104 3.5 4.0 4.0 3.5 Flow Due to Lockages+: 5
S77 Below USGS Flow Gage 3104
S78: Spillway and Sector Flow: 11.01 3.12 2527 1.5 2.5 2.5 2.5 Flow Due to Lockages+: 17
S79: Spillway and Sector Flow: 3.18 0.76 2911 1.0 1.0 1.0 2.0 2.0 1.0 1.0 1.0 Flow Due to Lockages+: 12 Percent of flow from S77 103% Chloride (ppm) 50
St. Lucie Canal (S308, S80) S308: Spillway and Sector Flow: 14.75 14.35 866 3.0 3.0 3.0 3.5 Flow Due to Lockages+: 1
S308 Below USGS Flow Gage 866 S153: 18.95 14.18 0 0.0 0.0 S80: Spillway and Sector Flow: 14.21 1.02 953 0.0 0.6 0.6 0.0 0.6 0.6 0.0 Flow Due to Lockages+: 33 Percent of flow from S308 129%

Steele Point Top Salinity (mg/ml) 260 Steele Point Bottom Salinity (mg/ml) ****
Speedy Point Top Salinity (mg/ml) **** Speedy Point Bottom Salinity (mg/ml) ****
+ Flow Due to lockages is computed utilizing average daily headwater and tailwater along with total number of lockages for the day to calculate a volume which is then converted to an average discharge in cfs. ______________________________________________________________________________ ----- Wind ---- Daily Precipitation Totals 1-Day 3-Day 7-Day Direction Speed (inches) (inches) (inches) (Degø) (mph) S133 Pump Station: -NR- 0.00 0.00 S193: -NR- 0.00 0.00 -NR- -NR- Okeechobee Field Station: -NR- 0.00 0.00 S135 Pump Station: -NR- 0.00 0.00 S127 Pump Station: -NR- 0.00 0.00 S129 Pump Station: -NR- 0.00 0.00 S131 Pump Station: -NR- 0.00 0.00 S77: 0.00 0.00 0.00 117 2 S78: 0.00 0.00 0.63 33 2 S79: 0.00 0.00 0.00 137 3 S4 Pump Station: -NR- 0.00 0.00 Clewiston Field Station: -NR- 0.00 0.00 S3 Pump Station: -NR- 0.00 0.00 S2 Pump Station: -NR- 0.00 0.00 S308: ******* ******* ******* 36 0 S80: 0.00 0.00 0.00 97 3 Okeechobee Average ******* 5453.85 ******* (Sites S78, S79 and S80 not included) ----------------------------------------------------------------- Oke Nexrad Basin Avg 0.00 0.00 0.00 -----------------------------------------------------------------
______________________________________________________________________________ Okeechobee Lake Elevations 10 APR 2016 14.89 Difference from 10APR16 10APR16 -1 Day = 09 APR 2016 14.94 0.05 10APR16 -2 Days = 08 APR 2016 14.99 0.10 10APR16 -3 Days = 07 APR 2016 15.01 0.12 10APR16 -4 Days = 06 APR 2016 15.02 0.13 10APR16 -5 Days = 05 APR 2016 15.06 0.17 10APR16 -6 Days = 04 APR 2016 15.08 0.19 10APR16 -7 Days = 03 APR 2016 15.09 0.20 10APR16 -30 Days = 11 MAR 2016 15.51 0.62 10APR16 -1 Year = 10 APR 2015 13.71 -1.18 10APR16 -2 Year = 10 APR 2014 13.37 -1.52 ______________________________________________________________________________

Long Term Mean 30day Avearge ET for Lake Alfred (Inches) = -NR- ______________________________________________________________________________ Lake Okeechobee Net Inflow (LONIN) Average Flow over the previous 14 days | Avg-Daily Flow 10APR16 Today = 10 APR 2016 1804 MON | -4556 10APR16 -1 Day = 09 APR 2016 2338 SUN | -5424 10APR16 -2 Days = 08 APR 2016 2889 SAT | 804 10APR16 -3 Days = 07 APR 2016 3313 FRI | 4876 10APR16 -4 Days = 06 APR 2016 3012 THU | -1989 10APR16 -5 Days = 05 APR 2016 2969 WED | 926 10APR16 -6 Days = 04 APR 2016 1879 TUE | 1837 10APR16 -7 Days = 03 APR 2016 1402 MON | -3406 10APR16 -8 Days = 02 APR 2016 2115 SUN | 5073 10APR16 -9 Days = 01 APR 2016 2010 SAT | 4409 10APR16 -10 Days = 31 MAR 2016 1548 FRI | 5641 10APR16 -11 Days = 30 MAR 2016 900 THU | 10576 10APR16 -12 Days = 29 MAR 2016 -195 WED | 2263 10APR16 -13 Days = 28 MAR 2016 -253 TUE | 4225 ______________________________________________________________________________ ______________________________________________________________________________ S65E Average Flow over previous 14 days | Avg-Daily Flow 10APR16 Today= 10 APR 2016 3833 MON | 4113 10APR16 -1 Day = 09 APR 2016 3655 SUN | 4390 10APR16 -2 Days = 08 APR 2016 3428 SAT | 4486 10APR16 -3 Days = 07 APR 2016 3163 FRI | 4785 10APR16 -4 Days = 06 APR 2016 2866 THU | 5140 10APR16 -5 Days = 05 APR 2016 2528 WED | 5211 10APR16 -6 Days = 04 APR 2016 2184 TUE | 5276 10APR16 -7 Days = 03 APR 2016 1852 MON | 4853 10APR16 -8 Days = 02 APR 2016 1550 SUN | 3970 10APR16 -9 Days = 01 APR 2016 1299 SAT | 3156 10APR16 -10 Days = 31 MAR 2016 1098 FRI | 2462 10APR16 -11 Days = 30 MAR 2016 971 THU | 2058 10APR16 -12 Days = 29 MAR 2016 866 WED | 1970 10APR16 -13 Days = 28 MAR 2016 761 TUE | 1790 ______________________________________________________________________________ Lake Okeechobee Outlets Last 14 Days
S-77 S-77 Below S-77 S-78 S-78 S-79 Discharge Discharge Discharge Discharge Discharge Discharge (0700-2100) (ALL DAY) (ALL-DAY) (0700-2100) (ALL DAY) (ALL DAY) DATE (AC-FT) (AC-FT) (AC-FT) (AC-FT) (AC-FT) (AC-FT) 10 APR 2016 6155 -NR- 5044 5797 09 APR 2016 4101 -NR- 3514 4433 08 APR 2016 4498 -NR- 3508 4302 07 APR 2016 7743 -NR- 6347 6968 06 APR 2016 8092 -NR- 6501 8321 05 APR 2016 6096 -NR- 5475 7281 04 APR 2016 4425 -NR- 4279 5694 03 APR 2016 3900 -NR- 3673 5504 02 APR 2016 2325 -NR- 2950 4086 01 APR 2016 2906 -NR- 2663 3864

31 MAR 2016 5308 -NR- 4184 6319 30 MAR 2016 5389 -NR- 6289 8528 29 MAR 2016 5479 -NR- 5767 7677 28 MAR 2016 4044 -NR- 4163 6122
S-310 S-351 S-352 S-354 L8 Canal Pt Discharge Discharge Discharge Discharge Discharge (ALL DAY) (ALL DAY) (ALL DAY) (ALL DAY) (ALL DAY) DATE (AC-FT) (AC-FT) (AC-FT) (AC-FT) (AC-FT) 10 APR 2016 175 2316 722 815 336 09 APR 2016 228 2437 886 982 354 08 APR 2016 335 2116 777 984 340 07 APR 2016 278 1495 432 990 332 06 APR 2016 20 482 331 803 310 05 APR 2016 65 204 254 920 344 04 APR 2016 9 0 369 869 245 03 APR 2016 43 0 101 775 16 02 APR 2016 23 403 1162 1005 -1 01 APR 2016 13 0 180 387 25 31 MAR 2016 1 0 0 0 121 30 MAR 2016 -56 0 0 167 244 29 MAR 2016 78 303 131 408 344 28 MAR 2016 25 474 375 811 347
S-308 Below S-308 S-80 Discharge Discharge Discharge (ALL DAY) (ALL-DAY) (ALL-DAY) DATE (AC-FT) (AC-FT) (AC-FT) 10 APR 2016 1717 1138 09 APR 2016 1480 894 08 APR 2016 1377 893 07 APR 2016 2977 1779 06 APR 2016 3233 2239 05 APR 2016 2616 1775 04 APR 2016 2035 1446 03 APR 2016 1350 1130 02 APR 2016 866 873 01 APR 2016 946 996 31 MAR 2016 1458 1768 30 MAR 2016 2275 2215 29 MAR 2016 2121 1771 28 MAR 2016 2327 1462
*** NOTE: 1) Discharge from (0700-2100) is computed using Spillway and Sector Gate Discharges from 0700 hrs to 2100 hrs. 2) Discharge (ALL DAY) is computed using Spillway, Sector Gate and Lockages Discharges from 0015 hrs to 2400 hrs. ______________________________________________________________________________
(I) - Flows preceeded by "I" signify an instantaneous flow computed from the single value reported for the day ______________________________________________________________________________ * On 11 May 1999, Lake Okeechobee Elevation was switched from
Instantaneous 2400 value to an average-daily lake average. On 14 Mar 2001, due to the isolation of various gages within the standard 10 stations, the average of the interior 4 station gages was used as the Lake Okeechobee Elevation. On 05 November 2010, Lake Okeechobee Elevation was switched to a 9 gage mix of interior and edge gages to obtain a more reliable representation of the lake level. On 09 May 2011, Lake Okeechobee Elevation was switched to a 8 gage mix of interior and edge gages to obtain a more reliable representation of the lake level due to isolation of S135 from low lake levels. Today Lake Okechobee elevation is determined from the 4 Int & 4 Edge stations ++ For more information see the Jacksonville District Navigation website at http://www.saj.usace.army.mil/ $ For information regarding Lake Okeechobee Service Area water restrictions please refer to www.sfwmd.gov ______________________________________________________________________________ Report Generated 11APR2016 @ 14:07 ** Preliminary Data - Subject to Revision **
Jan Mar May Jul Sep Nov Jan2015
Mar May Jul Sep Nov Jan2016
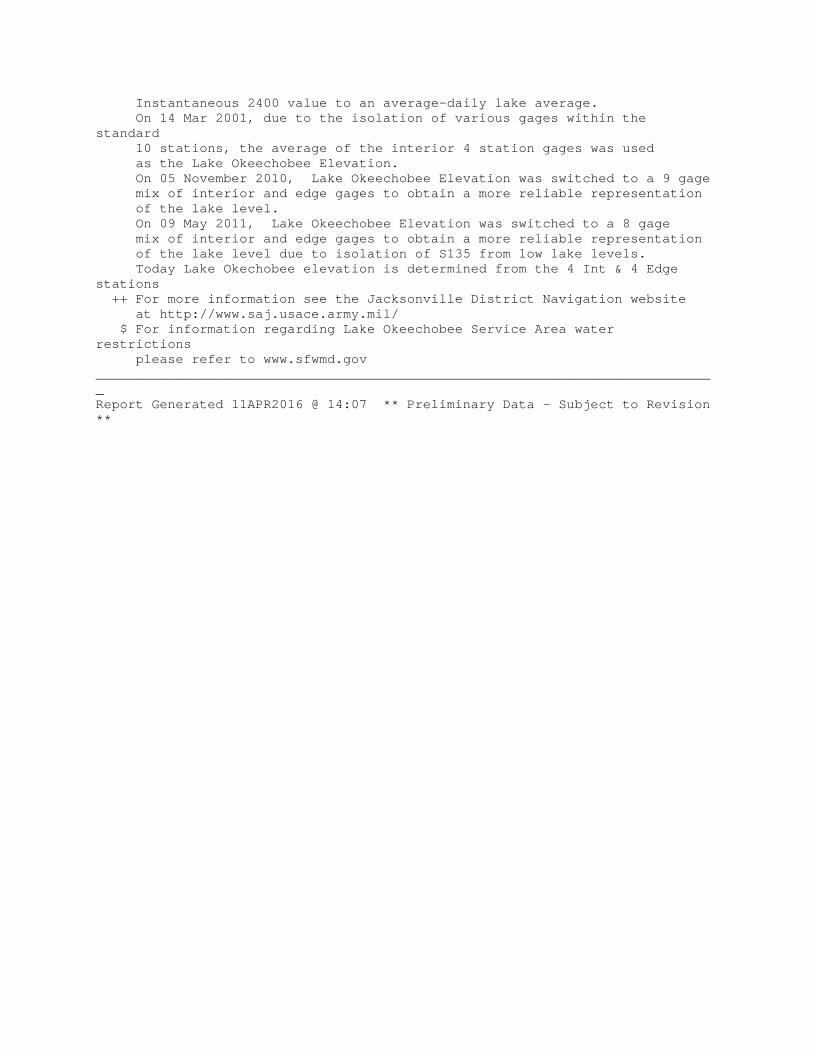
9
10
11
12
13
14
15
16
17
18
19
Elev
in
Ft
NGVD
High Lake ManagementOkeechobee Avg ElevAverage Elev [1965-2007]Water Shortage Management
Lake Okeechobee
11APR16 13:45:24

WSE Classification Tables
Classification Tables
Supplemental Tables used in conjunction with the LORS2008 ReleaseGuidance Flow Charts • Class Limits for Tributary Hydrologic Conditions Table K-2 in the Lake Okeechobee Water Control Plan • 6-15 Day Precipitation Outlook Categories Table ?? in the Lake Okeechobee Water Control Plan • Classification of Lake Okeechobee Net Inflow for Seasonal Outlook Table K-3 in the Lake Okeechobee Water Control Plan • Classification of Lake Okeechobee Net Inflow for Multi-Seasonal Outlook Table K-4 in the Lake Okeechobee Water Control Plan
Back to Lake Okeechobee Operations Main Page
Back to U.S. Army Corps of Engineers Lake Okeechobee Operations Homepage
file:///Y|/LORS/STAGING/lors01182010/lors_support/class_tables.html [01/20/2010 14:47:54]
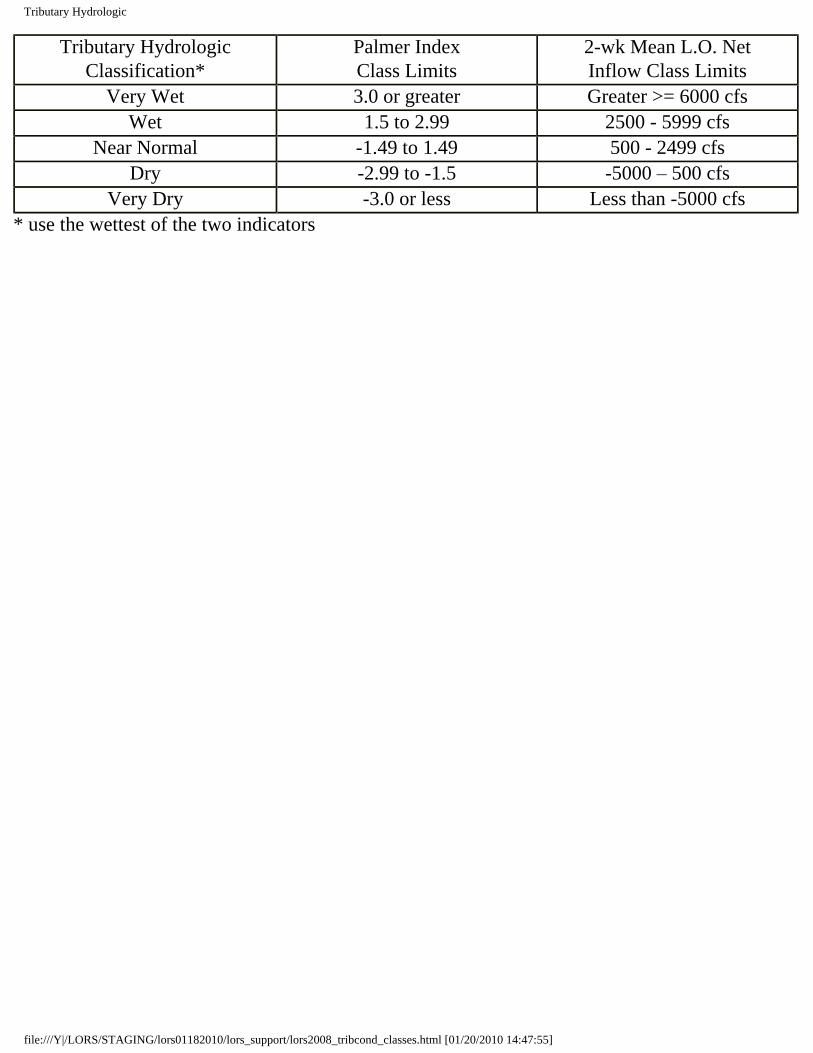
Tributary Hydrologic
Tributary HydrologicClassification*
Palmer IndexClass Limits
2-wk Mean L.O. NetInflow Class Limits
Very Wet 3.0 or greater Greater >= 6000 cfsWet 1.5 to 2.99 2500 - 5999 cfs
Near Normal -1.49 to 1.49 500 - 2499 cfsDry -2.99 to -1.5 -5000 – 500 cfs
Very Dry -3.0 or less Less than -5000 cfs* use the wettest of the two indicators
file:///Y|/LORS/STAGING/lors01182010/lors_support/lors2008_tribcond_classes.html [01/20/2010 14:47:55]

WSEwebtables_seasoutlook
Classification of Lake Okeechobee Net Inflow Seasonal Outlook*
Lake Net Inflow Prediction
[million acre-feet]
Equivalent Depth**
[feet]
Lake Okeechobee
Net Inflow
Seasonal Outlook
> 0.93 > 2.0 Very Wet
0.71 to 0.93 1.51 to 2.0 Wet
0.35 to 0.70 0.75 to 1.5 Normal
< 0.35 < 0.75 Dry
**Volume-depth conversion based on average lake surface area of 467,000 acres
file:///Y|/LORS/STAGING/lors01182010/lors_support/seasoutlook_table.html [01/20/2010 14:47:56]

WSEwebtables_multiseasoutlook
Classification of Lake Okeechobee Net Inflow Multi-Seasonal Outlook*
Lake Net Inflow Prediction
[million acre-feet]
Equivalent Depth**
[feet]
Lake Okeechobee
Net Inflow
Multi-Seasonal Outlook
> 2.0 > 4.3 Very Wet
1.18 to 2.0 2.51 to 4.3 Wet
0.5 to 1.17 1.1 to 2.5 Normal
< 0.5 < 1.1 Dry
**Volume-depth conversion based on average lake surface area of 467,000 acres
file:///Y|/LORS/STAGING/lors01182010/lors_support/multiseasoutlook_table.html [01/20/2010 14:47:55]

wsewebtable_precip
6-15 Day Precipitation Outlook Categories*
6-15 Day Precipitation Outlook Categories
WSE Decision Tree Categories
Above Normal Wet to Very Wet
Normal Normal
Below Normal Dry
* Corresponds to Table 7-6 in the Lake Okeechobee Water Control Plan
file:///Y|/LORS/STAGING/lors01182010/lors_support/precip_table.html [01/20/2010 14:47:55]

Under Construction