Embed Size (px)
Citation preview

APPLICATION OF THE RESEARCH PROCESS FOR THE DEVELOPMENT OF A
MICROGRID MODULAR DESIGN FOR TRIBAL HEALTHCARE FACILITIES
IN THE NAVAJO NATION: KAYENTA HEALTH CENTER USED
AS A SUBJECT STUDY FOR EXPERIMENTAL DATA
by
SAMUEL VEGA-COTTO
Presented to the Faculty of the Graduate School of Electrical Engineering
The University of Texas at Arlington in Partial Fulfillment
of the Requirements
for the Degree of
DOCTOR OF PHILOSOPHY
THE UNIVERSITY OF TEXAS AT ARLINGTON
February 2018

ii
Copyright © by Samuel Vega-Cotto 2018
All Rights Reserved

iii
Acknowledgements
First, I thank God for this achievement and all the blessings and learning
opportunities during my academic and professional career.
I wish to express my sincere appreciation to my supervisor Dr. Wei-Jen Lee. He
provided the guidance that I needed to be able to discover the right topic and the
procedures for the completeness of my dissertation work. Also Dr. William Dillon was
very instrumental during my transition process of transferring from University of Idaho to
University of Texas in Arlington.
I am thankful to my dissertation defense committee members, Dr. Wei-Jen Lee,
Dr. William Dillon, Dr. David A. Wetz, Dr. Ali Davoudi, and Dr. Rasool Kenarangui for
their instructive guidelines and constructive comments on my dissertation. Thanks to my
classmates and friends from the Energy Systems Research Center team for sharing a
good educational environment and great memories.
The Indian Health Service, Office of Environmental Health and Engineering,
Division of Engineering Services supported this work. I like to thanks to my supervisor,
Joe Bermes and DES director, Mike Weaver for their continuous support and comments
regarding my work. I also like to mention Howard Wellspring, Gary Hartz and the rest of
the management team as well as my co-workers at Division of Engineering Services. I
don’t like to forget the support from my former supervisors during my PhD studies: Todd
Bofinger (VA), Ken Brown (VA), Bob Moseley (VA) and Mark Bakotic (Northrop
Grumman, Shipbuilding).
I wish to specially thank my parents (Rafael and Eufemia), my wife, Sandra
Siurano-Perez, my children, Samuel Vega-Siurano, Sandra Yelitzza Vega-Siurano,
Sannely Vega-Siurano, and Savier Esteban Vega-Siurano to whom this dissertation is
dedicated. I also like to mention my siblings (Lepes, Dr. Piotr, Gallo, Cuca, Fusty, and

iv
Tote), other family members and friends (especially those from “El Trabuco del Moe”).
Thanks for the unconditional support and encouragement during my PhD studies.
February 08, 2018

v
Abstract
APPLICATION OF THE RESEARCH PROCESS FOR THE DEVELOPMENT OF A
MICROGRID MODULAR DESIGN FOR TRIBAL HEALTHCARE FACILITIES
IN THE NAVAJO NATION: KAYENTA HEALTH CENTER USED
AS A SUBJECT STUDY FOR EXPERIMENTAL DATA
Samuel Vega-Cotto, PhD
The University of Texas at Arlington, 2018
Supervising Professor: Wei-Jen Lee
There exist significant challenges and opportunities for improvement the power
system of healthcare facilities for American Indian and Alaska natives. This Dissertation
establishes plans and methodology to include the research process in the power system
design utilizing Kayenta health center, which is located in the Navajo nation, as a subject
study. Information about the solar irradiance on site, the PV system performance, the
power quality and the power system load demand at the facility as well as observation of
the related equipment is gathered.
The Dissertation describes a seasonal experimental process related to a 100KW
PV system case study at the Kayenta Health Center and is supplemented with detailed
information about the power system of the facility. Detailed study of existing PV system at
the Kayenta Health Center combined with modeling and simulation tools is used to
discover additional information, process and methodology for the implementation of the
microgrid in other tribal health care facilities at the Navajo Nation. Seasonal experimental
data validated with theoretical data available for the zone, the facility, the systems and
the equipment is used to develop a concept model for the actual implementation.

vi
Targeted information about harmonics provides insight about specific features of
the concept model. The concept model is adjusted such that the actual implementation of
the microgrid will enhance the power quality, result in optimum power system design,
produce energy savings and reduce environmental pollution.
The concept model of microgrid architecture lead to the development of a
proposal for the implementation of the microgrid at Dilkon Health Center, which is a
facility in the IHS New Construction Priority List. The Microgrid proposal was accepted
and adopted by the management of Division of Engineering Services from Indian Health
Services. The proposal basically use previous research information and the concept
model and apply a procedure and cost estimates for a specific facility (Dilkon HC). The
proposal include different type of language (cost vs benefits instead of highly technical)
because it have the intent of convince the different stakeholders. The proposal is a
necessary stage between the research and the actual implementation.
The research foundation presented can be applied for additional proposals of
Microgrid implementation or power system improvements in other healthcare facilities
and staff quarter projects.
vii
Table of Contents
Acknowledgements ............................................................................................................. iii
Abstract ............................................................................................................................... v
List of Illustrations .............................................................................................................. xi
List of Tables .....................................................................................................................xiv
Challenges and opportunities ............................................................................. 1
1.1 Introduction ............................................................................................................... 1
1.2 Facility Selection Process ......................................................................................... 4
1.2.1 General information ........................................................................................... 4
1.2.2 Selecting a healthcare facility ............................................................................ 6
1.2.3 Existing power system in Kayenta HC .............................................................. 7
1.2.4 Renewable energy source data ......................................................................... 8
1.2.5 Renewable Energy Technologies .................................................................... 10
1.2.6 Challenges and Opportunities ......................................................................... 13
1.3 The Microgrid Concept ........................................................................................... 14
1.3.1 Microgrid architecture ...................................................................................... 14
1.3.2 Methodology and proposed studies ................................................................ 16
1.4 Opportunities for Improvement ............................................................................... 17
1.4.1 General opportunities ...................................................................................... 17
1.4.2 Technical opportunities ................................................................................... 17
1.5 Chapter 1 Conclusions ........................................................................................... 18
Kayenta Health Center PV system case study ................................................ 19
2.1 Introduction ............................................................................................................. 19
2.2 Proposed Strategy .................................................................................................. 25
2.3 Experimental Process ............................................................................................. 26
viii
2.3.1 PV System performance ................................................................................. 26
2.3.2 Power Quality of NTUA ................................................................................... 28
2.3.3 Field Observations........................................................................................... 30
2.4 Data Analysis .......................................................................................................... 30
2.4.1 Irradiance data ................................................................................................. 30
2.4.2 PV System data ............................................................................................... 33
2.4.3 Inverter Efficiency data .................................................................................... 37
2.4.4 Power Quality data .......................................................................................... 37
2.4.5 Harmonics ....................................................................................................... 38
2.5 Modeling Kayenta PV System ................................................................................ 42
2.5.1 Mathematical Model to match Kayenta PV system ......................................... 43
2.5.2 Simulation expanded Kayenta PV system in Simulink .................................... 44
2.5.3 Simulation Results ........................................................................................... 46
2.6 Modified Configuration of Existing Power System .................................................. 47
2.7 Chapter 2 Conclusion ............................................................................................. 48
Kayenta Health Center used as guidance for concept model for
Navajo Nation .................................................................................................................... 50
3.1 Introduction ............................................................................................................. 50
3.2 Experimental Data Winter Time .............................................................................. 52
3.2.1 Power System Measurements ........................................................................ 52
3.2.2 PV System performance ................................................................................. 53
3.2.3 Power System load current data ..................................................................... 55
3.2.4 Field Observations........................................................................................... 56
3.3 Data Analysis & Comparison .................................................................................. 57
3.3.1 Irradiance data ................................................................................................. 57
ix
3.3.2 PV System data ............................................................................................... 58
3.3.3 Power System Load Profile data ..................................................................... 60
3.3.4 Wind Speed data ............................................................................................. 61
3.3.5 Harmonics Data ............................................................................................... 62
3.4 Modeling fifth and seventh Harmonic Filter ............................................................ 65
3.4.1 Simulation fifth and seventh harmonic filters for Kayenta HC
power system in Simulink ......................................................................................... 65
3.4.2 Simulation Results ........................................................................................... 66
3.5 Microgrid Concept Model for Navajo Nation ........................................................... 69
3.5.1 Code compliance ............................................................................................. 70
3.5.2 Improved Power Quality .................................................................................. 71
3.5.3 Low harmonic system ...................................................................................... 71
3.5.4 Renewable energy .......................................................................................... 72
3.5.5 Modular design ................................................................................................ 72
3.5 Chapter 3 Conclusion ............................................................................................. 72
Proposal for Dilkon health center in the Navajo Nation based on
Microgrid concept model ................................................................................................... 74
4.1 Executive Summary ................................................................................................ 74
4.2 Background ............................................................................................................. 75
4.3 Purpose .................................................................................................................. 77
4.4 Renewable Energy Resources ............................................................................... 79
4.4.1 Review wind power feasibility .......................................................................... 79
4.4.2 Review of solar power feasibility ..................................................................... 81
4.5 Dilkon HC options for power system and microgrid configuration .......................... 83
4.5.1 Active Filters and Zigzag transformer.............................................................. 84

x
4.5.2 Augmented PV system .................................................................................... 85
4.5.3 Energy storage system (battery bank) ............................................................ 86
4.5.4 Microgrid Controller ......................................................................................... 86
4.5.5 Static Transfer Switch ..................................................................................... 87
4.5.6 Combination of different features .................................................................... 88
4.6 Cost estimates for the different features ................................................................ 90
4.6.1 Active Filters and Zigzag transformer.............................................................. 90
4.6.2 Augmented PV system .................................................................................... 91
4.6.3 Energy storage system (battery bank) ............................................................ 96
4.6.4 Microgrid Controller ......................................................................................... 96
4.6.5 Static Transfer Switch ..................................................................................... 96
4.7 Analysis of Options ................................................................................................. 97
4.8 Chapter 4 Conclusion ............................................................................................. 99
General Conclusions and Future work ........................................................... 100
Appendix A Sample specification for solar energy electrical power generation
system ............................................................................................................................. 103
References by Chapter ................................................................................................... 121
Chapter 1 .................................................................................................................... 121
Chapter 2 .................................................................................................................... 124
Chapter 3 .................................................................................................................... 128
Chapter 4 .................................................................................................................... 130
Biographical Information ................................................................................................. 132
xi
List of Illustrations
Figure 1-1 Typical Architecture for the design of a Microgrid for tribal HC facilities ........... 5
Figure 1-2 Existing configuration of electrical system in Kayenta ...................................... 8
Figure 1-3 Average daily solar radiation per year ............................................................... 9
Figure 1-4 Kayenta PV System ......................................................................................... 11
Figure 1-5 Net Generation from Renewable Sources ....................................................... 12
Figure 2-1 Power Logger (Fluke 1735) installed in the output of the Inverter .................. 25
Figure 2-2 Power Quality & Revenue Meter (SEL 735) installed in SES-2 ...................... 26
Figure 2-3 Power Delivered by PV system at Kayenta HC – one week ........................... 27
Figure 2-4 Energy Supplied by PV system at Kayenta HC – one week ........................... 28
Figure 2-5 Solar Irradiance at Kayenta, Instantaneous vs hourly average ....................... 32
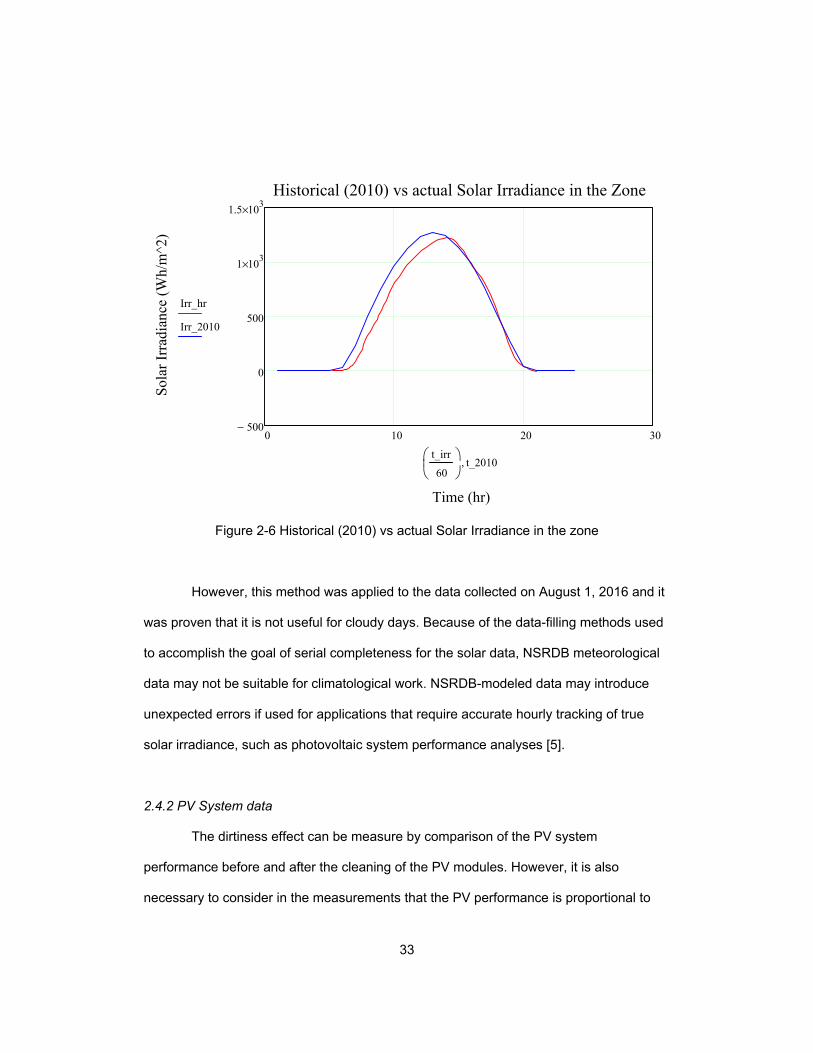
Figure 2-6 Historical (2010) vs actual Solar Irradiance in the zone .................................. 33
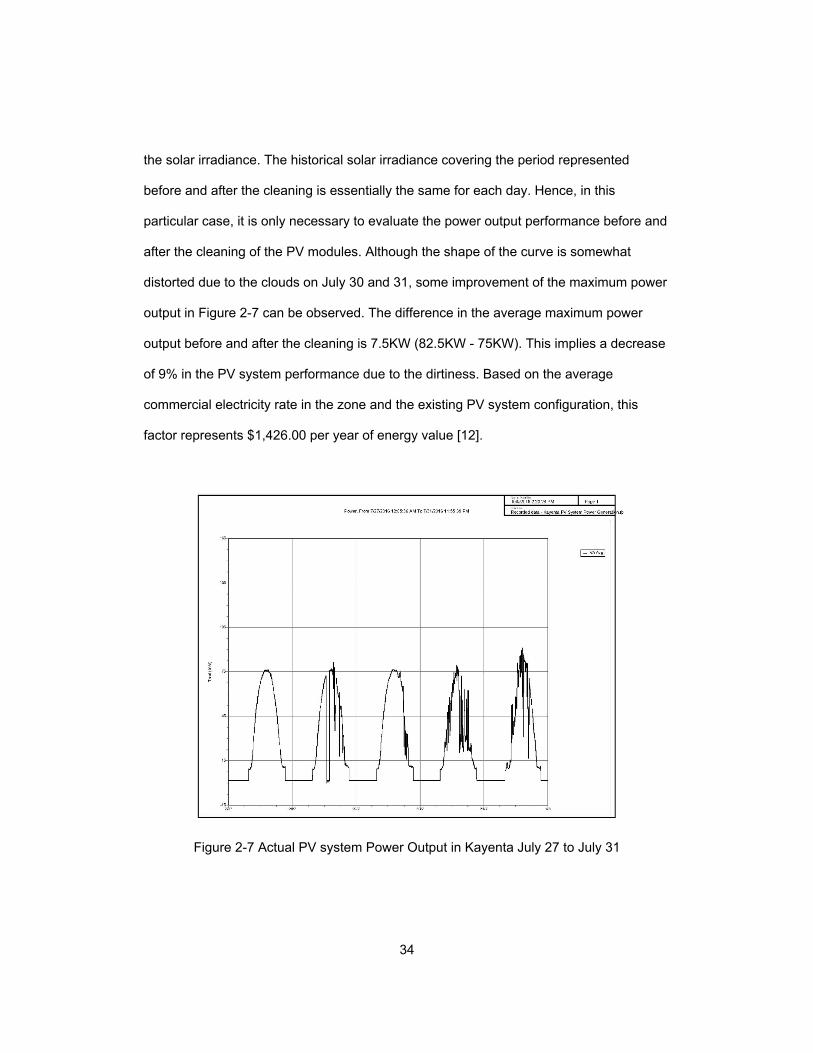
Figure 2-7 Actual PV system Power Output in Kayenta July 27 to July 31 ...................... 34
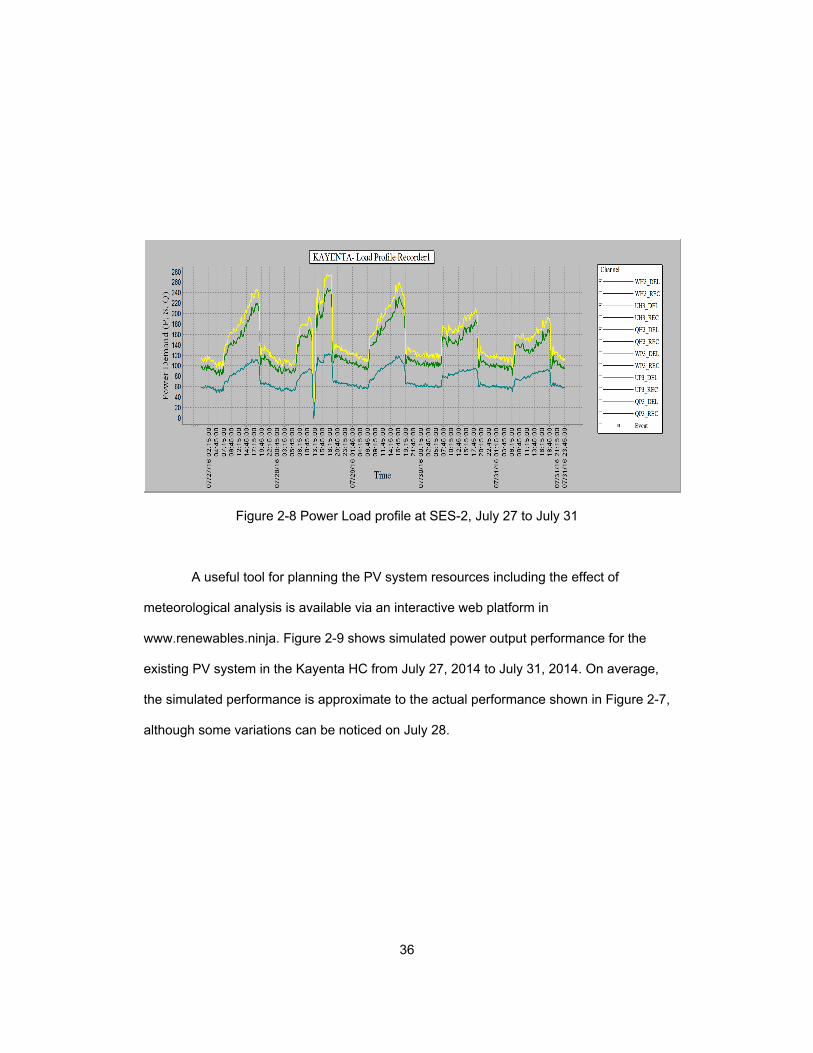
Figure 2-8 Power Load profile at SES-2, July 27 to July 31 ............................................. 36
Figure 2-9 Power Output - PV system at Kayenta 7/27/14 to 7/31/14: source
www.renewables.ninja ...................................................................................................... 37
Figure 2-10 Current level performance, Kayenta HC ....................................................... 38
Figure 2-11 THD Currents performance, at SES-2 ........................................................... 39
Figure 2-12 THD Currents performance, at Critical loads branch .................................... 40
Figure 2-13 KCL for THD Calculations ............................................................................. 41
Figure 2-14 Expanded PV System model for Kayenta HC ............................................... 45
Figure 2-15 Simulation results DC side - Expanded PV System model for Kayenta HC . 46
Figure 2-16 Simulation results AC side - Expanded PV System model for Kayenta HC . 47
Figure 2-17 Block diagram of modified configuration existing power system, Kayenta HC
.......................................................................................................................................... 48
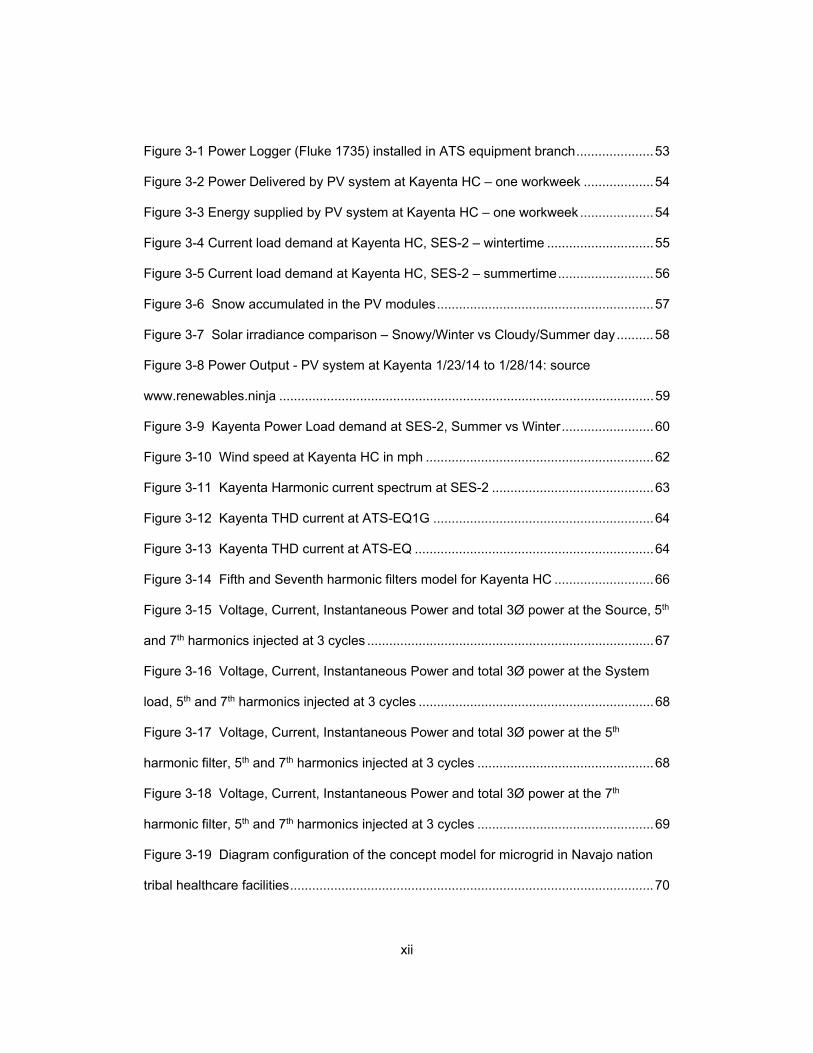
xii
Figure 3-1 Power Logger (Fluke 1735) installed in ATS equipment branch ..................... 53
Figure 3-2 Power Delivered by PV system at Kayenta HC – one workweek ................... 54
Figure 3-3 Energy supplied by PV system at Kayenta HC – one workweek .................... 54
Figure 3-4 Current load demand at Kayenta HC, SES-2 – wintertime ............................. 55
Figure 3-5 Current load demand at Kayenta HC, SES-2 – summertime .......................... 56
Figure 3-6 Snow accumulated in the PV modules ........................................................... 57
Figure 3-7 Solar irradiance comparison – Snowy/Winter vs Cloudy/Summer day .......... 58
Figure 3-8 Power Output - PV system at Kayenta 1/23/14 to 1/28/14: source
www.renewables.ninja ...................................................................................................... 59
Figure 3-9 Kayenta Power Load demand at SES-2, Summer vs Winter ......................... 60
Figure 3-10 Wind speed at Kayenta HC in mph .............................................................. 62
Figure 3-11 Kayenta Harmonic current spectrum at SES-2 ............................................ 63
Figure 3-12 Kayenta THD current at ATS-EQ1G ............................................................ 64
Figure 3-13 Kayenta THD current at ATS-EQ ................................................................. 64
Figure 3-14 Fifth and Seventh harmonic filters model for Kayenta HC ........................... 66
Figure 3-15 Voltage, Current, Instantaneous Power and total 3Ø power at the Source, 5th
and 7th harmonics injected at 3 cycles .............................................................................. 67
Figure 3-16 Voltage, Current, Instantaneous Power and total 3Ø power at the System
load, 5th and 7th harmonics injected at 3 cycles ................................................................ 68
Figure 3-17 Voltage, Current, Instantaneous Power and total 3Ø power at the 5th
harmonic filter, 5th and 7th harmonics injected at 3 cycles ................................................ 68
Figure 3-18 Voltage, Current, Instantaneous Power and total 3Ø power at the 7th
harmonic filter, 5th and 7th harmonics injected at 3 cycles ................................................ 69
Figure 3-19 Diagram configuration of the concept model for microgrid in Navajo nation
tribal healthcare facilities ................................................................................................... 70

xiii
Figure 4-1 Dilkon HC Wind Prospector check .................................................................. 80
Figure 4-2 Dilkon HC wind turbine system performance check ........................................ 81
Figure 4-3 Dilkon HC location solar irradiance resources check ...................................... 82
Figure 4-4 Dilkon HC PV system performance check ...................................................... 83
Figure 4-5 Dilkon HC microgrid concept model ................................................................ 84
Figure 4-6 Dilkon HC PVWatts® Calculator Run .............................................................. 93
xiv
List of Tables
Table 1-1 Higher Rated Facilities ........................................................................................ 6
Table 2-1 Priorities assigned based on size of the facility power system ......................... 22
Table 2-2 Events (VSSI) recorded by Power Quality & Revenue Meter .......................... 29
Table 2-3 Summary of harmonic current measurements and calculations ...................... 42
Table 3-1 Comparison of average values of power - Wintertime vs Summertime ........... 61
Table 4-1 Size comparison of existing facilities with Dilkon HC ....................................... 77
Table 4-2 Combination of features to form different options for power system - Dilkon HC
.......................................................................................................................................... 88
Table 4-3 Feature 1 - Active Filters and Zigzag transformer ............................................ 91
Table 4-4 Feature 2 – Expanded PV System ................................................................... 95
Table 4-5 Feature 3 – Energy Storage System ................................................................ 96
Table 4-6 Cost comparison of different options for power system at Dilkon HC .............. 98
Table 4-7 Life cycle cost analysis of different options for renewable energy systems at
Dilkon HC .......................................................................................................................... 99

1
Challenges and opportunities
1.1 Introduction
There exist significant challenges and opportunities for improvement the power
system of healthcare facilities for American Indian and Alaska natives. Creativities, new
technologies, and joint efforts among different stakeholders are needed to address tribal
concerns about their environment, their wild life and their traditions while improving the
electrical power system. This chapter establishes plans and methodology to include the
research process in the power system design utilizing Kayenta health center, which is
located in the Navajo nation, as a subject study. A microgrid modular design architecture
is defined. Modeling and simulation tools combined with experimental results are
proposed for future implementation of the actual microgrid. The microgrid architecture
can be used for improvement the power system of existing and new healthcare facilities
for American Indian and Alaska natives.
Congress recognized the importance of tribal decision-making in tribal affairs and
the primacy of the nation-to-nation relationship between the Unites States and Tribes
through the passage of the Indian Self-Determination and Education Assistance Act
(ISDEAA, Public Law 93-638, 1975). In subsequent amendments to the ISDEAA, among
other things congress authorized federally recognized Tribes the option of entering into
self-governance compacts to gain more autonomy in the management and delivery of
their health care programs [3].
Throughout the process of construction of new healthcare facilities and updating
existing ones, the Tribes are facing significant challenges regarding the design process
as well as the reliability and efficiency of the electrical power service:

2
1. Living conditions on the reservations have been cited as "comparable to Third
World," (May 5 2004, Gallup Independent).
2. The overall percentage of American Indians living below the federal poverty
line is 28.2% (2008, American Indians Census Facts).
3. About 40% of on-reservation housing is considered inadequate (2003, U.S.
Commission on Civil Rights).
4. Overcrowding, substandard dwellings, and lack of utilities all increase the
potential for health risk, especially in rural and remote areas where there is a lack of
accessible healthcare.
5. About 55% of American Indians rely on the Indian Health Service for medical
care (2006, Indian Health Facts).
6. Yet, the Indian Health Care Improvement Act only meets about 60% of their
health needs (2003, U.S. Commission on Civil Rights).
7. The healthcare facilities are usually located in remote locations. In some
cases, there is no electrical power service or the service is not reliable enough for a
healthcare facility.
8. Most Tribes does not have the expertise in latest technologies of power
systems and they rely on the support of the Indian Health Services (IHS) and private
designers. In some cases, the electrical system is over design, low efficient or has power
quality issues.
9. Tribes prefer to be as much independent as possible from the US government
and they have specific preferences about the way they foresee the power system for the
healthcare facilities. The electrical power system needs to be designed such way that it
fits in Tribes concerns about their environment, their wild life or their traditions.

3
10. The budget available for the design and construction and upgrades of power
system for healthcare facilities varies significantly among different tribes.
11. One of the top priorities of the IHS is to renew and strengthen partnerships
with Tribes and Urban Indian Health Programs. Most of the time, Tribes expect IHS to
perform costly changes during the design process for the power system of healthcare
facilities. The facilities of the IHS network are widely dispersed among 36 states, primarily
on or near Indian reservations where travel can be difficult, especially where
transportation options are unavailable or limited by harsh climatic conditions. For most of
these rural communities, IHS and tribal health care facilities offer the only feasible source
of health care services. The IHS hospitals now average 40 years of age, almost four
times older than U.S. hospitals (10.6 years of age). At the existing replacement rate, a
new 2016 facility would not be replaced for 400 years. The facilities are undersized for
the populations served, the magnitude of the need is enormous and the space and layout
limitations impede delivery of modern health care services [27].
Reliability and efficiency of the power system declines as buildings and
equipment age. There are significant challenges regarding the power quality of the
facilities being mainly older electrical designs and the electrical services needed in
remote locations.
The question is how is it possible to overcome all these issues all together? Is
there a way to optimize the power system of a typical healthcare facility located in the
Indian lands by developing a Microgrid modular design?
IHS current A/E Design Guide (2013) provides general guidance and rules for the
development of design documents, specifications, and other contract documents,
architectural and engineering design features, submittals, and supplemental information.
However, it does not contain specific information or guidance related to the power system

4
reliability, efficiency and security or survivability analysis. The quality of the power system
design rely mostly on the competence of the A/E design firm (which varies significantly
from project to project) and the design revision process from IHS and the Tribal team.
There is no research component in the A/E Design Guide [4]. IHS recognizes the need of
going beyond the traditional way of providing Electrical Engineering support to the Tribes.
This Chapter explores the feasibilities of deploying Microgrid (either grid tie or islanded)
to improve the reliability and quality of the power supply of healthcare facilities for
American Indian and Alaska natives. Since the electrical power system needs to be
designed such way that it fits in Tribes concerns about their environment, their wild life or
their traditions, it is necessary to combine the available latest technologies and
processes, the Clean Energy resources and the new ideas into the research process in
order to come up with improved and acceptable solutions. Recent development on
microgrid technologies found in extensive literature search suggest that the microgrid is
a good option to achieve desired goals [6], [7], [8], [13], [14].The dissertation proposes a
procedure to adopt microgrid technologies in tribal healthcare facilities to improve the
power quality and efficiency of the electrical system while promoting environmental
friendly energy resources. It demonstrates a complete process from initial investigation,
experimental, research, practical application and proposal with information ready for
design and implementation.
1.2 Facility Selection Process
1.2.1 General information
Indian health care services are provided in over 640 IHS and tribal health care
facilities, located mostly in rural and isolated areas. The IHS also operates nearly 2,300
staff quarters units to support health care services in remote locations. The health care

5
facilities are distributed among twelve (12) different tribal areas: Alaska, Albuquerque,
Bemidji, Billings, California, Great Plains, Nashville, Navajo, Oklahoma City, Phoenix,
Portland, and Tucson [3]. Figure 1-1 illustrates a typical architecture of a Microgrid for
tribal healthcare facilities with renewable energy sources. Since they are location
dependent, it is necessary to gather data from IHS to select a typical Indian tribal
healthcare facility for a target location that can potentially benefit a significant population
by improving the power system. The study of the power system of the subject facility will
result in improved renewable energy based power systems for upcoming new projects in
the region. By means of the study, analysis and experimental results of the power system
for a healthcare facility, it is expected to discover additional challenges and opportunities
for the implementation of a Microgrid modular design.
Figure 1-1 Typical Architecture for the design of a Microgrid for tribal HC facilities
6
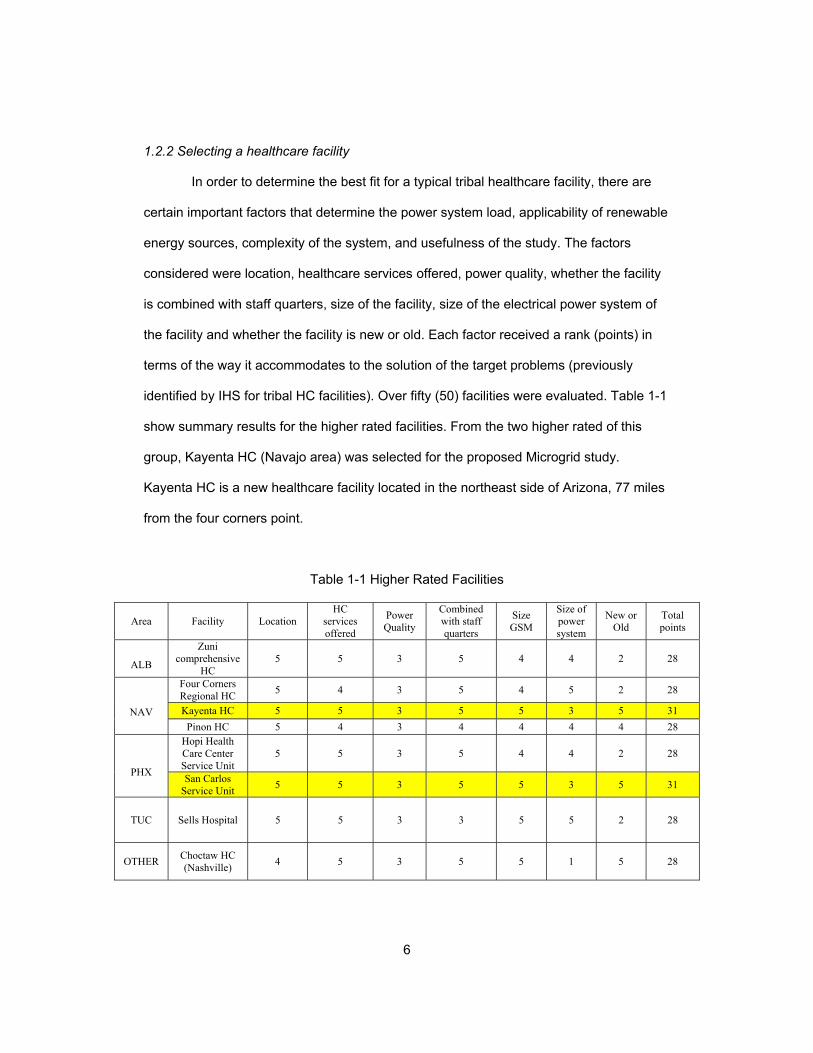
1.2.2 Selecting a healthcare facility
In order to determine the best fit for a typical tribal healthcare facility, there are
certain important factors that determine the power system load, applicability of renewable
energy sources, complexity of the system, and usefulness of the study. The factors
considered were location, healthcare services offered, power quality, whether the facility
is combined with staff quarters, size of the facility, size of the electrical power system of
the facility and whether the facility is new or old. Each factor received a rank (points) in
terms of the way it accommodates to the solution of the target problems (previously
identified by IHS for tribal HC facilities). Over fifty (50) facilities were evaluated. Table 1-1
show summary results for the higher rated facilities. From the two higher rated of this
group, Kayenta HC (Navajo area) was selected for the proposed Microgrid study.
Kayenta HC is a new healthcare facility located in the northeast side of Arizona, 77 miles
from the four corners point.
Table 1-1 Higher Rated Facilities
Area Facility Location HC
services offered
Power Quality
Combined with staff quarters
Size GSM
Size of power system
New or Old
Total points
ALB
Zuni comprehensive
HC 5 5 3 5 4 4 2 28
NAV
Four Corners Regional HC
5 4 3 5 4 5 2 28
Kayenta HC 5 5 3 5 5 3 5 31
Pinon HC 5 4 3 4 4 4 4 28
PHX
Hopi Health Care Center Service Unit
5 5 3 5 4 4 2 28
San Carlos Service Unit
5 5 3 5 5 3 5 31
TUC Sells Hospital 5 5 3 3 5 5 2 28
OTHER
Choctaw HC (Nashville)
4 5 3 5 5 1 5 28

7
1.2.3 Existing power system in Kayenta HC
Figure 1-2 shows a simplified model of the existing electrical power system in
Kayenta HC. NTUA provided two separate feeders, each one connected to a 2.5MVA,
25KV - 480/277V transformer. Each transformer feeds one side of double-ended
switchgear (3000A, 480/277V). The system provides redundancy of main feeder and
transformer. However, the power source comes from the same substation.
The PV system consists of Suniva optimus monocrystalline solar modules (model
OPT # 265-60-4-100). There are 378 modules installed in two different roof areas of the
facility. The inverter is Solectria Renewables, model PVI 100KW, 480V. The inverter
output is connected to the double-ended switchgear, such that the system supplements
the NTUA commercial power. In compliance with IEEE 1547 and NEC 690.61, the
inverter system automatically de-energizes when there is an outage from the utility.
Five (5) diesel generators (1000KVA @ 0.8PF, 480/277V) provide emergency
power for the entire facility in case of loss of power or power quality issues from the
utility. The emergency power supply system (EPSS) also includes three main automatic
transfer switches (ATS) to separate the loads into the different categories for healthcare
facilities: critical, life safety and equipment branches.
The design is very stiff, traditional and not planned around the microgrid concept.
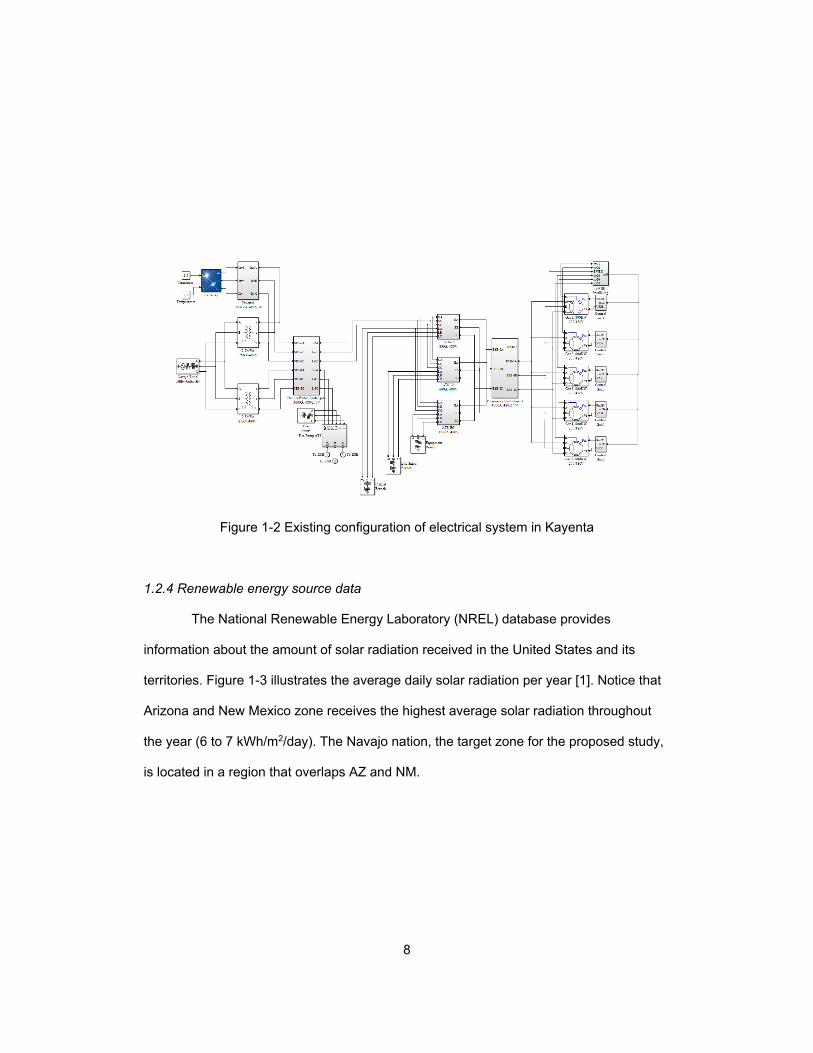
8
Figure 1-2 Existing configuration of electrical system in Kayenta
1.2.4 Renewable energy source data
The National Renewable Energy Laboratory (NREL) database provides
information about the amount of solar radiation received in the United States and its
territories. Figure 1-3 illustrates the average daily solar radiation per year [1]. Notice that
Arizona and New Mexico zone receives the highest average solar radiation throughout
the year (6 to 7 kWh/m2/day). The Navajo nation, the target zone for the proposed study,
is located in a region that overlaps AZ and NM.
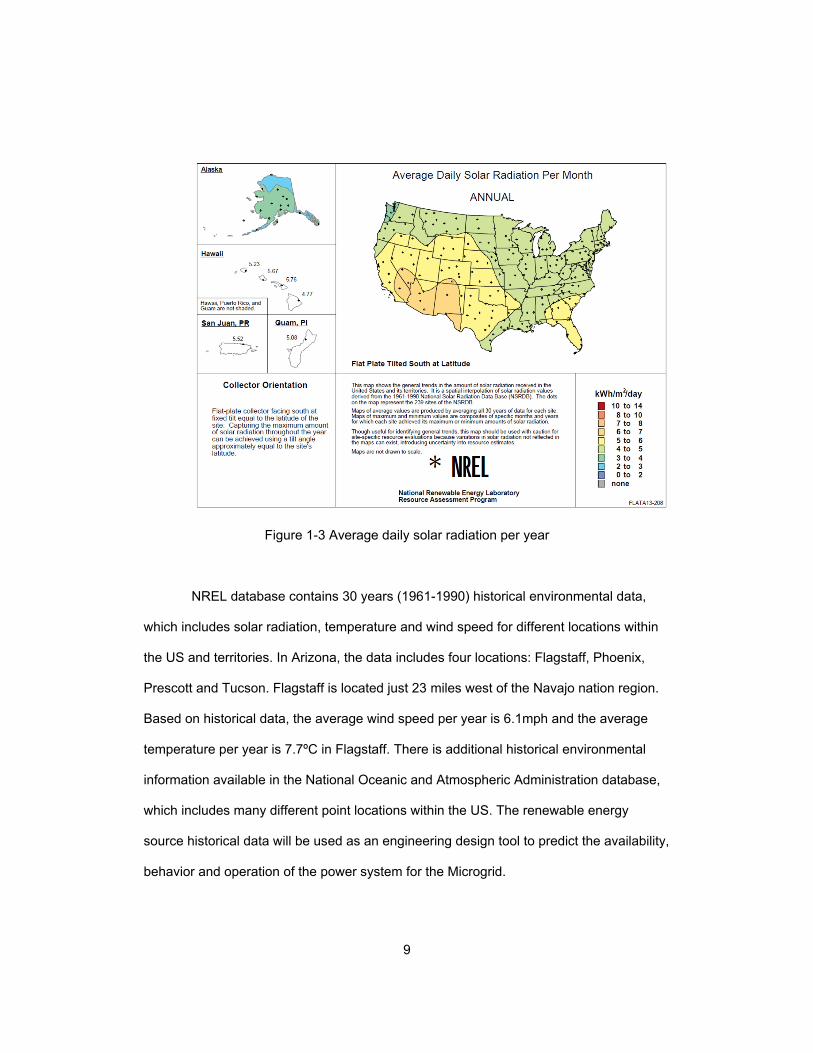
9
Figure 1-3 Average daily solar radiation per year
NREL database contains 30 years (1961-1990) historical environmental data,
which includes solar radiation, temperature and wind speed for different locations within
the US and territories. In Arizona, the data includes four locations: Flagstaff, Phoenix,
Prescott and Tucson. Flagstaff is located just 23 miles west of the Navajo nation region.
Based on historical data, the average wind speed per year is 6.1mph and the average
temperature per year is 7.7ºC in Flagstaff. There is additional historical environmental
information available in the National Oceanic and Atmospheric Administration database,
which includes many different point locations within the US. The renewable energy
source historical data will be used as an engineering design tool to predict the availability,
behavior and operation of the power system for the Microgrid.

10
On April 15, 2016, the US Department of Energy (DOE) announced nearly $4
million for projects to increase access to solar data. According to DOE, four partners will
help launch the new Orange Button℠ initiative, which will increase solar market
transparency and fair pricing by establishing data standards for the industry [11].
1.2.5 Renewable Energy Technologies
Multiple laws and executive orders define requirements for the use of renewable
energy in federal facilities, for example: the Energy Policy Act of 2005 (EPACT 2005) and
Executive Order (EO)13693. Literature widely explains the advantages and challenges
with renewable energy technologies [5], [7], [13], [14], [15]. IHS also encourages the use
of renewable energy power sources for all new tribal healthcare facilities. It is typical to
install Photovoltaic (PV) systems to supplement the normal power from the utility.
However, other types of renewable energy sources are seldom considered to be
combined together as Distributed Energy (DE) resources. As it is important to join efforts
with the academia, IHS is working with University of Texas at Arlington (UTA) in the
research process for Microgrid modular design to improve the power system of
healthcare facilities for American Indian and Alaska natives. Figure 1-4 shows a picture
(partial view) of the PV system installed in Kayenta HC. Experimental data collected from
the power system of Kayenta HC, including the utility, PV system and special loads
applicable for healthcare facilities (i.e. medical equipment) will be discussed in Chapters
2 and 3.

11
Figure 1-4 Kayenta PV System
U.S. Energy Information Administration (EIA) publishes data among other things
about net generation from different sources, including renewable [2]. According to EIA,
solar and wind are the fastest growing among all renewable energy generation types in
the US. Figure 1-5 shows the increasing tendency on solar and wind renewable energy
generation in the US. The wind generation increased 4.1% in Arizona and 3.7% in New
Mexico from 2013 to 2014, while the solar PV generation increased 25.5% in Arizona and
32.7% in New Mexico for the same period. Arizona is the state with the second larger net
generation of solar PV energy (2,538 GWh, in 2014), only overcome by California (8,336
GWh, in 2014) [2].

12
Figure 1-5 Net Generation from Renewable Sources
Due to the increasing tendency in the use of renewable energy, many
universities, private organization and government entities are conducting research
studies regarding renewable energy and distributed generation resources. However,
there are still many challenges regarding renewable energy, for example: the scalability
and timing, commercialization, substitutability, material input requirements, intermittency,
energy density, and energy return on investment.
There are many different factors when considering renewable energy generation
technologies [5], [7]. For tribal healthcare facilities in the Navajo area (as proposed)
Photovoltaic systems and Wind turbines show advantage due to the natural energy
resources available, low level of fault current, foot print availability in tribal lands, mature
technology, increasing trend and environmental friendly. However, these technologies
Year2004 2005 2006 2007 2008 2009 2010 2011 2012 2013 2014
Sol
ar P
V (
x100
0MW
h)
104
0
0.5
1
1.5
2Fig.4: Net Generation from Renewable Sources
Solar
Year2004 2005 2006 2007 2008 2009 2010 2011 2012 2013 2014
Win
d(x1
000M
Wh)
105
0
0.5
1
1.5
2
Wind

13
need energy storage components and have to combine with other nonrenewable energy
generation technologies in order to improve reliability of the system and increase the
power system capacity.
1.2.6 Challenges and Opportunities
There are still gaps in terms of improvement the reliability and efficiency of the
electrical power service in tribal healthcare facilities. It is important in the design process
to perform beyond traditional ways of providing electrical engineering support to the
Tribes, including addition of a wide base of knowledge, experience and tolls through the
research process. Creativities, new technologies, and joint efforts among different
stakeholders are needed to address Tribal concerns about their environment, their wild
life and their traditions while improving the electrical power system.
As mentioned earlier, the health care facilities are located in twelve (12) different
tribal areas. Due to the size, location and configuration of healthcare facilities, the
climate, transportation and other factors, certain areas (e.g. Alaska) deserve separate
future studies. The renewable energy resources, the power quality issues and hence the
solutions for the power system improvement will vary significantly from different areas.
For example, efficient Combined Heat and Power (CHP) solution alternatives would
receive stronger consideration in some areas. Kayenta HC was selected as a
representative healthcare facility within the Navajo area. Power systems for other areas
will be considered in the future study.
Available data about natural resources demonstrates that the Navajo area (which
overlaps AZ and NM) offers great opportunity to take advantage of solar PV and wind
renewable energy as part of the components to be included in the Microgrid. The

14
accessibility, accuracy and standardization of the solar data will increase as DOE is
putting efforts and resources for it.
Navajo Generating Station is a 2250-megawatt coal-fired power plant located 65
miles West of Kayenta. The Navajo Generating Station is the United States of America's
third largest emitter of carbon dioxide [9]. Thus, the environmental concern in the Navajo
nation also drives the applicability of renewable energy components for the microgrid. In
fact, the Navajo Tribal Utility Authority (NTUA) announced in 2009 the Salt River Project
as its first utility customer for an 85-megawatt wind project at the Big Boquillas Ranch
and they also offers solar PV services for residential customer in remote locations [10].
Nevertheless, one of the main challenges will be the reconciliation the return on
investment with the additional cost of energy storage components.
Existing literature provide background, information and tools for the modeling and
simulation of PV systems [19], [20], [21], [22], energy storage components [12] and wind
turbine generation [23]. The modeling and simulation tools are very useful to gather
additional information about the behavior of renewable energy systems in tribal
healthcare facilities. Experimental results will be obtained from the full-scale PV system
installed in Kayenta HC.
1.3 The Microgrid Concept
1.3.1 Microgrid architecture
More flexible and reliable power system designs have potential around the
microgrid concept. In order to balance the reliability and power system capacity against
the capital investment and energy savings, energy storage components and other
nonrenewable energy generation are considered. Generation technologies considered for
this microgrid application in Kayenta HC are:

15
• Internal combustion engines (ICE, diesel 600 kW)
• Photovoltaic systems (typical 100kW modules)
• Intermediate wind turbines (100kW-250kW)
• Battery banks (typical 100kW, 100kWh)
• Flywheel energy storage (190kW nom., 225kW max).
A static switch is also necessary at the point of common coupling (PCC) between
the utility and the microgrid. The static switch has the ability to interchange the mode of
operation of the microgrid from grid connected to island or vice versa. Each component of
the microgrid needs to be a peer-to-peer and plug-and-play to avoid disturbances among
the controls and the power system protection [24].
It is important to notice that the reliability of the ICE depends on the maintenance
of the units. Hence, the Navajo area (Kayenta service unit personnel) requires of proper
training, documentation and support in this subject. Microgrids composed of considerable
ICE capacity should perform very well handling day-to-day fluctuations in loading and
typical load steps [5].
The International Electromechanical Commission (IEC) standard 61400 and
manufacturer data available for intermediate wind turbines shows nominal wind speed to
be 13 m/s, the cut in speed < 3 m/s, and the cut out speed 25 m/s. However, the NREL
database states that the highest annual average wind speed in the zone (near Kayenta)
is less than 5 m/s. Under these conditions, existing intermediate wind generation turbines
would perform at very low efficiency.
Energy storage systems provide a mean to smooth the shape of the
characteristic response of intermittent power generation sources. There are several
advantages of energy storage systems for transmission and distribution applications
listed in [25]. Lithium-ion technology battery banks and flywheel technology are more

16
suitable for this microgrid application. Taking field measurements of real time power
system data is important for adequately sizing the energy storage systems and proper
identification of strategic locations for the installation.
The propose microgrid architecture will include additional PV system modules,
addition of battery banks and/or flywheel systems, and the static switch connected to
intercept the main feeders at the primary side of transformer. Then, the simplified model
shown in Figure 1-2 is modified accordingly and simulation results obtained.
1.3.2 Methodology and proposed studies
It is required to conduct additional studies for completeness of the microgrid
research and figure out better alternatives for the feasibility of the actual implementation.
Experimental results will demonstrate the behavior and efficiency of the PV system
installed in Kayenta. Real time data obtained will be compared to results from equivalent
PV system model built in Matlab/Simulink. Experimental results will also provide light
about the power quality of the utility and the behavior of the different type of loads in the
electrical system of Kayenta HC. This method will define gaps and constraints for
consideration in the addition of PV modules, energy storage components and the static
switch for islanded operation.
Modeling and simulation is a proven method for research and development of the
microgrid concept within the power systems. However, due to certain limitations
(simulation time, storage data capacity, inaccurate assumptions, complexity of real full-
scale system, etc.) it is not practical to model the entire microgrid with all detailed
components and possible incidents over time. Instead, some aspects of the microgrid
and specific important incidents (faults, sudden load changes, power quality issues,
insufficient capacity or loss of a component, etc.) which we can both understand and

17
quantify are feasible for modeling. Another interesting topic is the interaction between
subsystems added to the microgrid.
1.4 Opportunities for Improvement
Two different categories classify the opportunities for improvement: general and
technical.
1.4.1 General opportunities
• Provide better solutions for the quality of power system for healthcare facilities
of the American Indian and Alaska natives.
• Increase access to solar data initiative by DOE will enhance accuracy to
engineering calculations and models.
• Address environmental concern in the Navajo nation and the US government by
providing power system designs with generous renewable energy components. Reduce
carbon dioxide emissions from Navajo Generating Station. Consider different types of
renewable energy sources combined as DE resources in the microgrid.
• Add research component in the A/E Design Guide and establish new standards
for the design of power systems around the microgrid concept.
1.4.2 Technical opportunities
• Improving the PV system efficiency in Kayenta HC.
• Develop accurate models and perform simulation studies for microgrid system
and components applicable for tribal healthcare facilities.
• Investigate the interaction among additional parallel inverters proposed for
Kayenta HC.

18
The above list is not all-inclusive. As the research process continues, new
opportunities for improvement will be discovered. There are many healthcare facilities
with different constraints in the electrical power systems that deserve separate studies
that will result in additional opportunities.
1.5 Chapter 1 Conclusions
The purpose of this work is to establish plans and methodology to include the
research process in the power system design utilizing Kayenta HC as a subject study.
The first step is the facility selection process, as the constraints of the power system are
dependent of the geographical location. Then, renewable energy source data is obtained
and different technologies considered and analyzed as DE resources in the microgrid.
Next, determine existing electrical power system in the facility and define microgrid
architecture. Once the possible challenges and solutions are identified, experiments and
field test will be performed.

19
Kayenta Health Center PV system case study
2.1 Introduction
A facility selection criteria was developed in order to choose a facility to conduct
experiments in the electrical power system. In order to determine the best fit for a typical
tribal healthcare facility, there are certain important factors that determine the power
system load, applicability of renewable energy sources, complexity of the system, and
usefulness of the study. These factors are determined by the problem statement outlined
in Chapter 1. Each factor will receive a rank (points) in terms of the way it accommodates
to the solution of the target problems. The following factors considered:
1. Location – the facility can be located in a metro, rural, or far remote zone. The
location of the facility will impact the probability of having a reliable power source (vs
having power quality issues) and hence the applicability for Distributed Generation and
diversified renewable energy sources. The closer to the metro area the location is; the
more probability of having a reliable power system. If the facility is located very remote,
the process, schedule and cost of dispatching non-renewable energy sources (i.e. diesel
fuel) become more complex. The ranks (points) assigned for the location are metro (3),
rural (4) and far remote (5).
2. Healthcare services offered – IHS healthcare facilities are classified as
Hospital, Health Center, alcohol and substance abuse program (ASAP), and Health
station. The classification of facility depends on the type of services offered and
contributes to the complexity of the electrical power system. If more complexity is added
to the system, there will be more different type of medical equipment, mechanical
systems, computers, electronic and communication systems. The complexity is not

20
necessary directly related to the capacity of the electrical power system. The ranks
(points) assigned for classification are Hospital (5), Health Center (4), ASAP (2), and
Health station (1). The reasoning for these ranks is that if a solution is found for a general
case, it can be simplified and applied for a specific case.
3. Specific Power Quality issues – The specific Power Quality problems is an
unknown variable at this point. In certain occasions DES receive some feedback from the
facility management personnel of the tribal areas about specific issues in their electrical
power systems. However, due to the diversity and complexity of the Power Quality
problems, the facility management personnel seldom times are able to provide an
accurate description of the issue. Moreover, the Power Quality issues vary widely from
facility to facility. Precisely description of the problems for a specific facility can be
achieved utilizing accurate instruments to study the power system.
Part of the process in this study includes the collection of actual data in order to
be able to define accurately any Power Quality issue for the selected facility. As more
data is obtained in the future for different facilities, a weight factor could be estimated for
this variable. Future studies also will consider if there is a correlation between specific
Power Quality issues and one or more of the factors listed here.
For the purpose of this study, a neutral value of 3 points is assigned for all the
facilities, where 5 points represents that the facility have complex Power Quality
problems and 0 points represents that the facility doesn’t have Power Quality problems at
all.
4. Whether the facility is combined with staff quarters – Healthcare facilities that
are combined with quarters include an additional component of complexity. The quarters
can be represented as an additional multi-residential electrical load in parallel to the
healthcare facility. The ranks assigned are 5 points for combined healthcare and quarters

21
facilities and 3 points for just healthcare facilities. There are no points assigned for just
quarters or residential facilities because it lies outside the scope of this study. However,
future studies could consider power system solutions for residential tribal facilities in
certain remote locations. The sky city in New Mexico is an example of a residential
community without electrical energy service.
5. Size of the facility – The size of the facility is directly related with the
population of Indian tribe members that impact, but not necessary with the type of
healthcare services offered. The larger the size, the more tribal members impacted and
hence the more relatively importance of the facility. The facilities will be classified based
on the gross square meters (GSM) of construction as large (> 10,000 GSM), medium
(3,000 ≤ GSM ≤ 10,000) or small (GSM < 3,000) and priority will be given to larger
facilities such that the contribution of this study will benefit more tribal members. The
points assigned for the size are large (5), medium (4) and small (2).
6. Size of the electrical power system of the facility – The information about the
size of the power system is normally available at IHS for new facilities (built in the past 5
years) based on the design. For old facilities surveyed recently, this information is
available in the facility condition report. However, it is possible to find certain old facilities
that the information is not readily available or is not accurate due to project upgrades (or
downgrades) to the electrical power systems.
Typical tribal healthcare facilities electrical power system sizes range from a 200
KVA to 5MVA for the normal power. However, normal power design in hospitals usually
provides for redundancy and for future expansions. The range for renewable energy goes
from 0 to 300KW. Therefore, a target size value of 1MVA is selected for the facility under
study in this project. Priorities are assigned for facilities with a power system capacity as
shown in Table 2.1.

22
Table 2-1 Priorities assigned based on size of the facility power system
Power System Capacity (PSC) Priority
750 KVA ≤ PSC ≤ 1.25MVA 5 points
400 KVA ≤ PSC ≤ 750 KVA 4 points
1.25MVA ≤ PSC ≤ 2.5 MVA 3 points
PSC ≥ 2.5 MVA 1 points
PSC ≤ 400 KVA 1 points
PSC information not readily available 0 points
7. Whether the facility is new (≤ 5 years) or old (> 5 years) – The new tribal
healthcare facilities have improved power systems designs as compared to the old
facilities. The IHS Design Guide, the NEC, NFPA 110, the federal renewable energy
mandates, the EPA regulations, LEED compliance efforts and other codes and
regulations are updated over time. The new electrical equipment is also more reliable and
requires less maintenance than the old equipment. Hence, the margin for improvement
the power system for a new healthcare facility is reduced. It is the intention of the
research component added in this study to find out solutions improvements beyond the
codes and regulations. Therefore, higher priority is given to new facilities available
operationally (5 points).
There are some old healthcare facilities with proposed renovation projects or that
recently was performed a facility condition survey or currently under study of the power
system from DES. There is additional information about the power system of these
facilities which is readily available. For this type of facilities, 4 points priority is assigned.
For new facilities under design or construction in the early stage and for old facilities

23
without much information about the power system readily available, 1 and 2 points priority
respectively are assigned.
As mentioned in Chapter 1, Kayenta HC (Navajo area) was selected for the
proposed experimental studies. This chapter describes an experimental process and
detailed information related to a 100KW PV system case study at the Kayenta Health
Center, which is located in the Navajo Nation. Information about the solar irradiance on
site, the PV system performance, the power quality at the facility, and observation of the
related equipment is gathered. Experimental data validate the theoretical data available
for the zone, the facility, the systems and the equipment. Detailed study of existing PV
system at the Navajo nation combined with modeling and simulation will lead to a good
industrial pilot project from implementation and practical perspective of the microgrid in
existing tribal health care facilities. A modified configuration of the existing power system
is presented. The configuration provides guidance for redesign of existing healthcare
facilities around the microgrid concept. Since the Kayenta Health Center is representative
of the average healthcare facility in the Navajo Nation, this guidance will be useful for
improvement power system of many tribal healthcare facilities. This in turn will improve
the quality of the healthcare service and will benefit the living conditions of significant
tribal population.
It was not found in literature articles that specifically address issues related to the
power system in tribal healthcare facilities presented in [1]. The Indian Health Service
(IHS) in considering a power system design around the Microgrid concept for existing or
new healthcare facilities in order to improve flexibility, reliability and energy savings.
Kayenta Health Center is a new hospital that began operations in July 2016. The power
system at Kayenta HC is over designed, very stiff and traditional. The study of the PV
system performance and the electrical load behavior is important to evaluate the

24
possibility of expanding renewable energy components. This chapter describes the
experimental process performed at the Kayenta HC, which focused on a detailed study of
the PV system and is complemented with additional examination of the Power Quality at
the facility. During the latest stage of construction, the power system at Kayenta HC has
been experiencing a significant number of power disturbance events, which result in
operational inconvenient.
Navajo Tribal Utility Authority (NTUA) provided two separate feeders, each one
connected to a 2.5MVA, 25KV - 480/277V transformer. Each transformer feeds one side
of double-ended switchgear (3000A, 480/277V). The system provides redundancy of
main feeder and transformer. However, the power source comes from the same
substation.
The PV system consists of Suniva optimus monocrystalline solar modules (model
OPT # 265-60-4-100). There are 378 modules installed in two different roof areas of the
facility. The inverter is Solectria Renewables, model PVI 100KW, 480V. The inverter
output is connected to the double-ended switchgear.
Five (5) diesel generators (1000KVA @ 0.8PF, 480/277V) provide emergency
power for the entire facility in case of loss of power or power quality issues from the
utility. The emergency power supply system (EPSS) also includes three main automatic
transfer switches (ATS) to separate the loads into the different categories for healthcare
facilities: critical, life safety and equipment branches [1].
Information contained in this chapter will significantly contribute to improved
power system designs around the microgrid concept in tribal healthcare facilities. The
simplicity of the concepts exposed and the proposed idea will facilitate the design
process and implementation in industry.
25
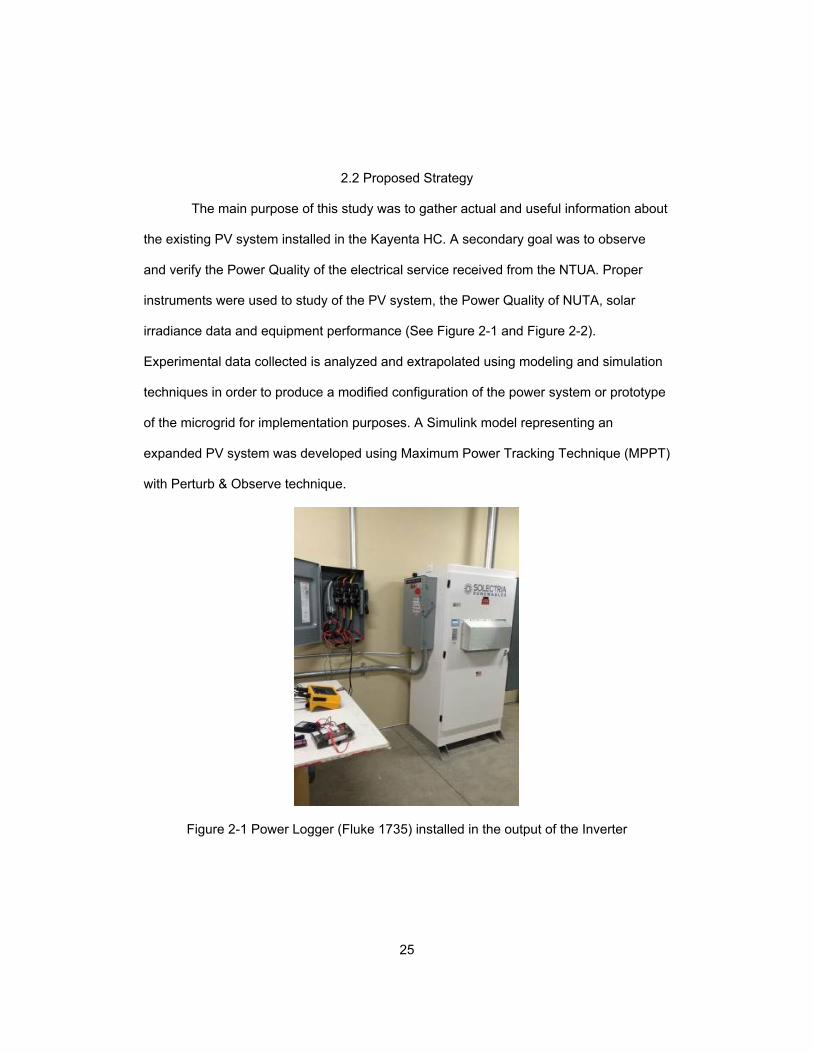
2.2 Proposed Strategy
The main purpose of this study was to gather actual and useful information about
the existing PV system installed in the Kayenta HC. A secondary goal was to observe
and verify the Power Quality of the electrical service received from the NTUA. Proper
instruments were used to study of the PV system, the Power Quality of NUTA, solar
irradiance data and equipment performance (See Figure 2-1 and Figure 2-2).
Experimental data collected is analyzed and extrapolated using modeling and simulation
techniques in order to produce a modified configuration of the power system or prototype
of the microgrid for implementation purposes. A Simulink model representing an
expanded PV system was developed using Maximum Power Tracking Technique (MPPT)
with Perturb & Observe technique.
Figure 2-1 Power Logger (Fluke 1735) installed in the output of the Inverter
26
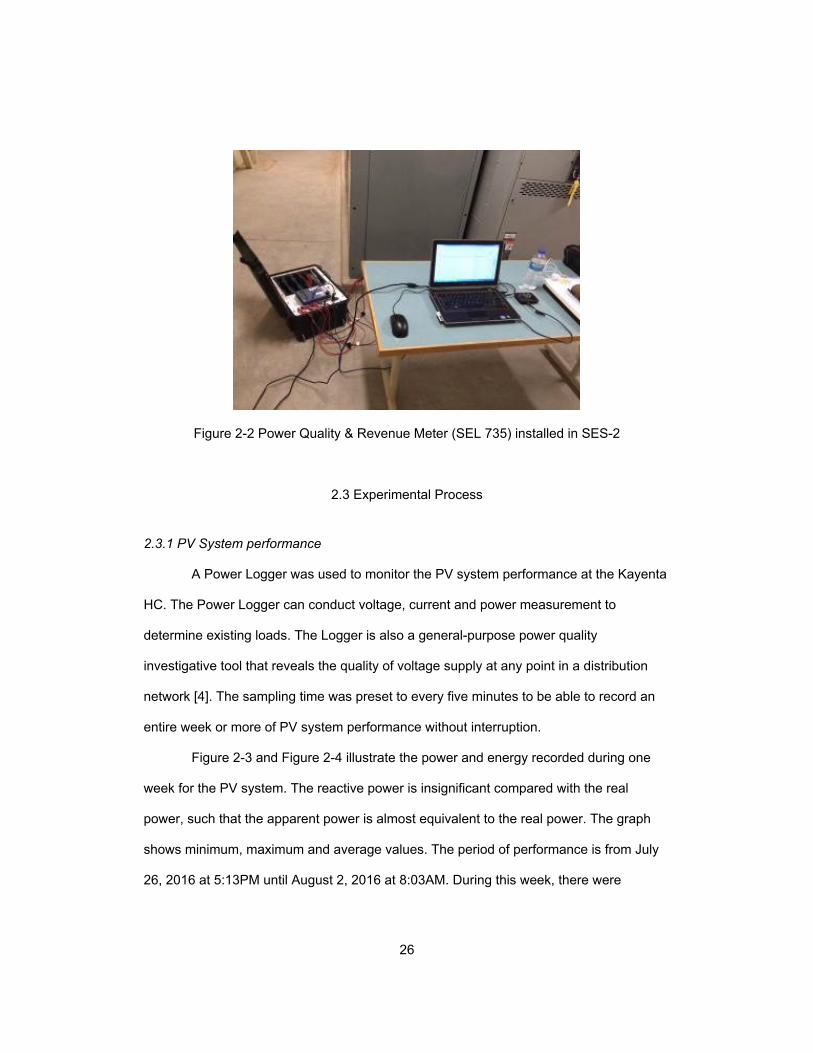
Figure 2-2 Power Quality & Revenue Meter (SEL 735) installed in SES-2
2.3 Experimental Process
2.3.1 PV System performance
A Power Logger was used to monitor the PV system performance at the Kayenta
HC. The Power Logger can conduct voltage, current and power measurement to
determine existing loads. The Logger is also a general-purpose power quality
investigative tool that reveals the quality of voltage supply at any point in a distribution
network [4]. The sampling time was preset to every five minutes to be able to record an
entire week or more of PV system performance without interruption.
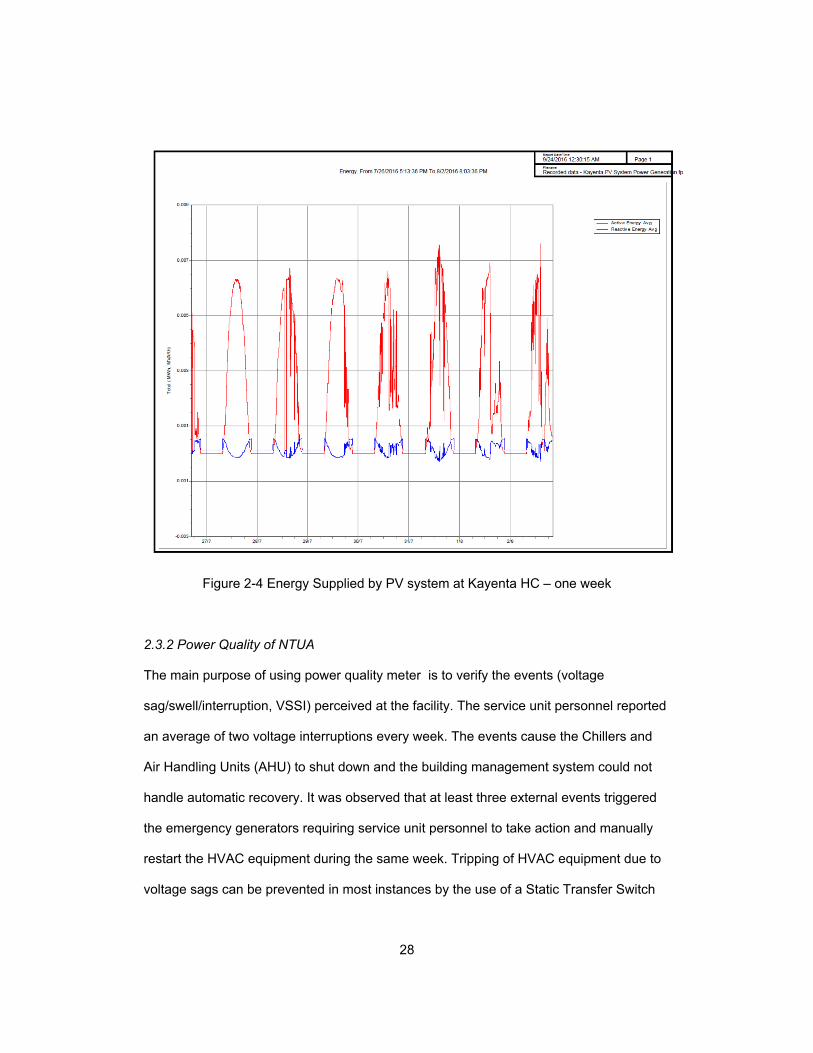
Figure 2-3 and Figure 2-4 illustrate the power and energy recorded during one
week for the PV system. The reactive power is insignificant compared with the real
power, such that the apparent power is almost equivalent to the real power. The graph
shows minimum, maximum and average values. The period of performance is from July
26, 2016 at 5:13PM until August 2, 2016 at 8:03AM. During this week, there were
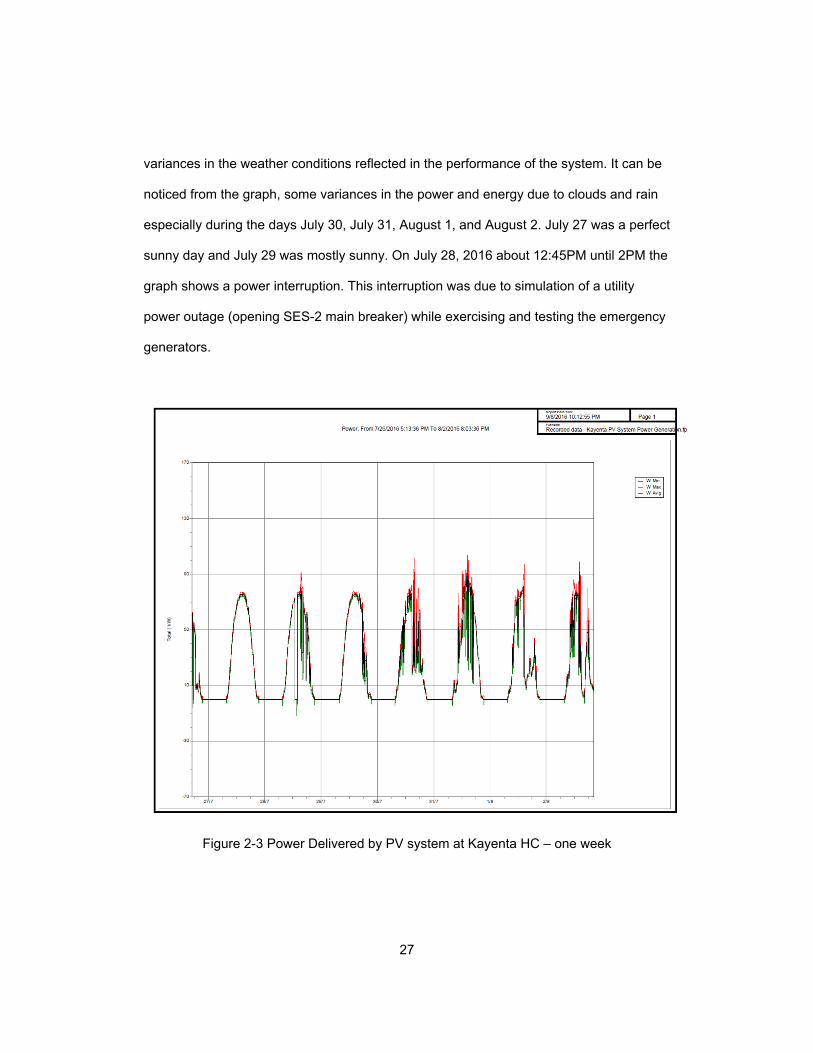
27
variances in the weather conditions reflected in the performance of the system. It can be
noticed from the graph, some variances in the power and energy due to clouds and rain
especially during the days July 30, July 31, August 1, and August 2. July 27 was a perfect
sunny day and July 29 was mostly sunny. On July 28, 2016 about 12:45PM until 2PM the
graph shows a power interruption. This interruption was due to simulation of a utility
power outage (opening SES-2 main breaker) while exercising and testing the emergency
generators.
Figure 2-3 Power Delivered by PV system at Kayenta HC – one week
28
Figure 2-4 Energy Supplied by PV system at Kayenta HC – one week
2.3.2 Power Quality of NTUA
The main purpose of using power quality meter is to verify the events (voltage
sag/swell/interruption, VSSI) perceived at the facility. The service unit personnel reported
an average of two voltage interruptions every week. The events cause the Chillers and
Air Handling Units (AHU) to shut down and the building management system could not
handle automatic recovery. It was observed that at least three external events triggered
the emergency generators requiring service unit personnel to take action and manually
restart the HVAC equipment during the same week. Tripping of HVAC equipment due to
voltage sags can be prevented in most instances by the use of a Static Transfer Switch
29
(STS) [9]. Applying the STS reduce the total duration of a voltage out-of-specifications to
approximately 1/8 cycle and the current out-of-specifications to approximately 1/4 cycle
[10].
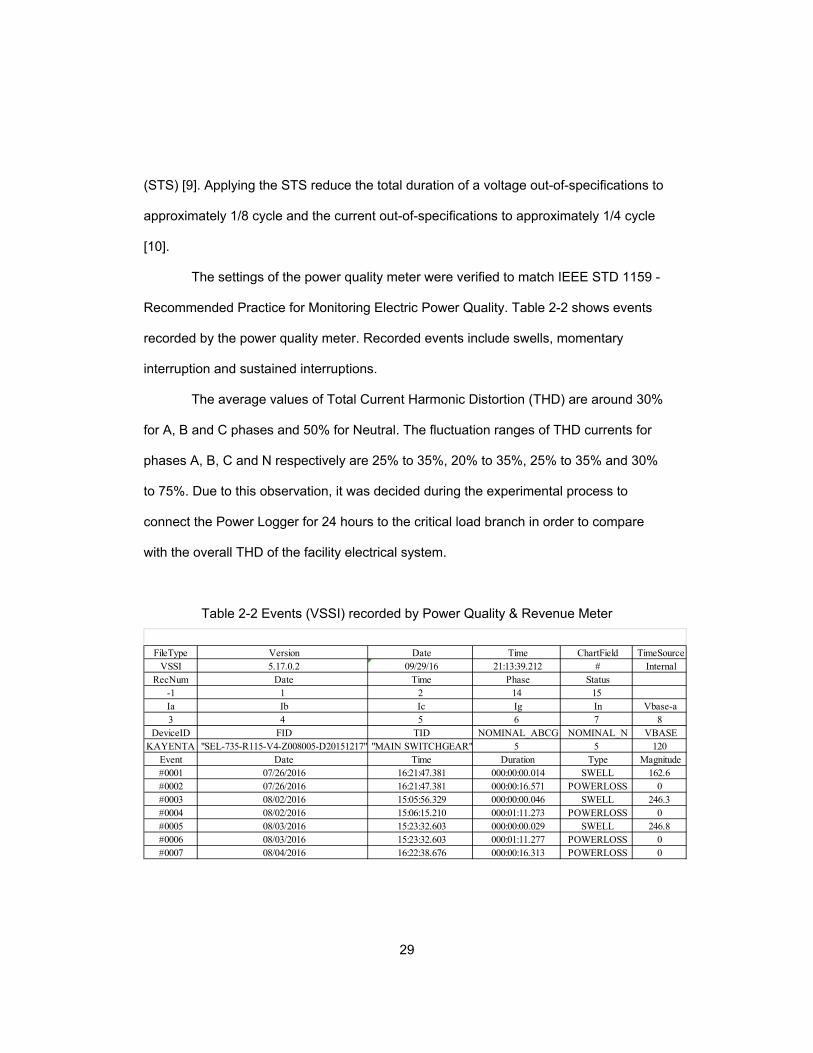
The settings of the power quality meter were verified to match IEEE STD 1159 -
Recommended Practice for Monitoring Electric Power Quality. Table 2-2 shows events
recorded by the power quality meter. Recorded events include swells, momentary
interruption and sustained interruptions.
The average values of Total Current Harmonic Distortion (THD) are around 30%
for A, B and C phases and 50% for Neutral. The fluctuation ranges of THD currents for
phases A, B, C and N respectively are 25% to 35%, 20% to 35%, 25% to 35% and 30%
to 75%. Due to this observation, it was decided during the experimental process to
connect the Power Logger for 24 hours to the critical load branch in order to compare
with the overall THD of the facility electrical system.
Table 2-2 Events (VSSI) recorded by Power Quality & Revenue Meter
FileType Version Date Time ChartField TimeSourceVSSI 5.17.0.2 09/29/16 21:13:39.212 # Internal
RecNum Date Time Phase Status-1 1 2 14 15Ia Ib Ic Ig In Vbase-a3 4 5 6 7 8
DeviceID FID TID NOMINAL_ABCG NOMINAL_N VBASEKAYENTA "SEL-735-R115-V4-Z008005-D20151217" "MAIN SWITCHGEAR" 5 5 120
Event Date Time Duration Type Magnitude#0001 07/26/2016 16:21:47.381 000:00:00.014 SWELL 162.6#0002 07/26/2016 16:21:47.381 000:00:16.571 POWERLOSS 0#0003 08/02/2016 15:05:56.329 000:00:00.046 SWELL 246.3#0004 08/02/2016 15:06:15.210 000:01:11.273 POWERLOSS 0#0005 08/03/2016 15:23:32.603 000:00:00.029 SWELL 246.8#0006 08/03/2016 15:23:32.603 000:01:11.277 POWERLOSS 0#0007 08/04/2016 16:22:38.676 000:00:16.313 POWERLOSS 0

30
2.3.3 Field Observations
On July 27, 2016 dirt was observed on the surface of the PV modules. The dirt is
considered a factor in the overall performance of the system, since it behaves like a
partial shadow, avoiding the full solar irradiation of the PV cells. Cleaning of all the PV
modules was coordinated and performed on July 29, 2016.
A PV module glass was impacted during a hailstorm that occurred a few months
before the experimental process. The performance of this module was questionable,
such that additional voltage and current measurements were necessary. Based on these
measurements, it was verified that the PV module had an acceptable performance even
with the glass damaged.
2.4 Data Analysis
2.4.1 Irradiance data
The light meter was used to take manual readings of the daylight. Daylight, or the
light of day, is the combination of all direct and indirect sunlight during the daytime. The
brightest sunlight is 120,000 lux for direct sunlight [2]. At Earth’s average distance from
the Sun (about 150 million kilometers), the average intensity of solar energy reaching the
top of the atmosphere directly facing the Sun is about 1,360 watts per square meter,
according to measurements made by the most recent NASA satellite missions [3]. After
deep analysis of the data, it was observed that the daylight measurements and
theoretical irradiance curves have the same shape and are proportional. Based on the
above facts and findings, the daylight readings can be normalized to obtain approximate
values of actual irradiance. These values are compared with historical values listed in the
National Renewable Energy Laboratory (NREL).

31
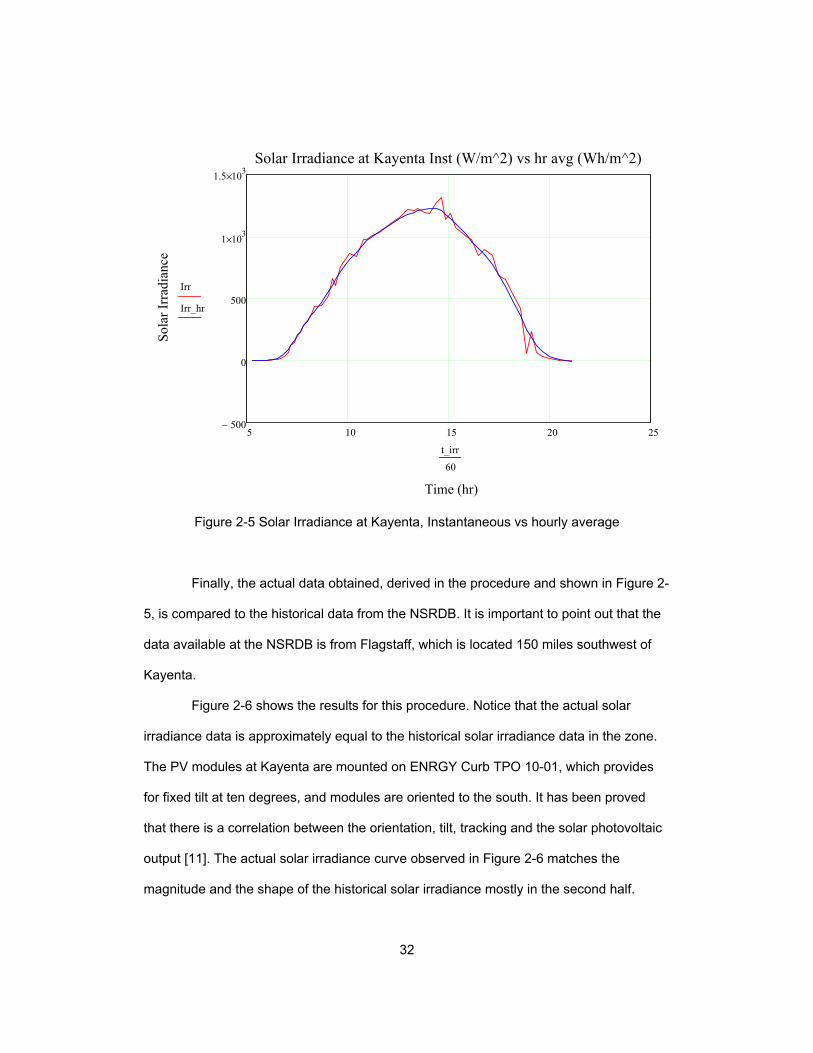
Sample readings of the daylight were taken on different days. On July 28, 2016
the readings were taken from sunrise to sunset with time intervals of approximately ten
(10) minutes. Hence, this data was selected for comparison. These are instantaneous
readings at a specific time during the day, so further conversion is needed to match the
historical data from the NREL, which is in Wh/m2.
Nearly all of the solar data in the National Solar Radiation Database (NSRDB)
are modeled, and only 40 sites have measured solar data—none of them with a complete
period of record [5]. Hence, it is important to be able to compare actual data with the
historical data from NSRDB. According to [5], the hourly extraterrestrial radiation on a
horizontal surface is equal to the amount of solar radiation received on a horizontal
surface at the top of the atmosphere during the 60-minute period ending at the
timestamp. Based on this definition, the hourly extraterrestrial radiation can be obtained
by properly averaging the irradiance over one-hour periods.
Solar irradiance data corresponding to July 28 was analyzed and tested with
various methods of conversion including linear interpolation, smoothing data using
Gaussian Kernel, smoothing data with a median smoother and smoothing data using an
adaptive method. The smoothing data using an adaptive method was selected as it
shows better results for this application. Figure 2-5 shows the results of applying this
method. Notice the effect of smoothing the shape of the curve.
32
Figure 2-5 Solar Irradiance at Kayenta, Instantaneous vs hourly average
Finally, the actual data obtained, derived in the procedure and shown in Figure 2-
5, is compared to the historical data from the NSRDB. It is important to point out that the
data available at the NSRDB is from Flagstaff, which is located 150 miles southwest of
Kayenta.
Figure 2-6 shows the results for this procedure. Notice that the actual solar
irradiance data is approximately equal to the historical solar irradiance data in the zone.
The PV modules at Kayenta are mounted on ENRGY Curb TPO 10-01, which provides
for fixed tilt at ten degrees, and modules are oriented to the south. It has been proved
that there is a correlation between the orientation, tilt, tracking and the solar photovoltaic
output [11]. The actual solar irradiance curve observed in Figure 2-6 matches the
magnitude and the shape of the historical solar irradiance mostly in the second half.
5 10 15 20 25500−
0
500
1 103×
1.5 103×
Solar Irradiance at Kayenta Inst (W/m^2) vs hr avg (Wh/m^2)
Time (hr)
Sol
ar I
rrad
ianc
e
Irr
Irr_hr
t_irr
60
33
Figure 2-6 Historical (2010) vs actual Solar Irradiance in the zone
However, this method was applied to the data collected on August 1, 2016 and it
was proven that it is not useful for cloudy days. Because of the data-filling methods used
to accomplish the goal of serial completeness for the solar data, NSRDB meteorological
data may not be suitable for climatological work. NSRDB-modeled data may introduce
unexpected errors if used for applications that require accurate hourly tracking of true
solar irradiance, such as photovoltaic system performance analyses [5].
2.4.2 PV System data
The dirtiness effect can be measure by comparison of the PV system
performance before and after the cleaning of the PV modules. However, it is also
necessary to consider in the measurements that the PV performance is proportional to
0 10 20 30500−
0
500
1 103×
1.5 103×
Historical (2010) vs actual Solar Irradiance in the Zone
Time (hr)
Sol
ar I
rrad
ianc
e (W
h/m
^2)
Irr_hr
Irr_2010
t_irr
60
t_2010,
34
the solar irradiance. The historical solar irradiance covering the period represented
before and after the cleaning is essentially the same for each day. Hence, in this
particular case, it is only necessary to evaluate the power output performance before and
after the cleaning of the PV modules. Although the shape of the curve is somewhat
distorted due to the clouds on July 30 and 31, some improvement of the maximum power
output in Figure 2-7 can be observed. The difference in the average maximum power
output before and after the cleaning is 7.5KW (82.5KW - 75KW). This implies a decrease
of 9% in the PV system performance due to the dirtiness. Based on the average
commercial electricity rate in the zone and the existing PV system configuration, this
factor represents $1,426.00 per year of energy value [12].
Figure 2-7 Actual PV system Power Output in Kayenta July 27 to July 31

35
An important factor for the Microgrid and sizing the Renewable Energy
components is the electrical load demand for the facility. It is also important to study the
behavior of the load demand over time. Figure 2-8 shows the power load profile recorded
by Power Quality and Revenue meter at SES-2. Notice that the load profile data was
selected to match the same period of the PV system power output from the Power
Logger (Figure 2-7). The power demand shown on Figure 2-8 is supplied by the PV
system plus the NTUA. Based on this load information, it can be determined how many
additional modules can support island mode operation of the Microgrid.
A very interesting detail when comparing Figure 2-7 with Figure 2-8 is that the
power demand increased significantly during the day, matching the time where the solar
energy is available. The solar energy is obviously useful for peak shaving in this type of
application. Even more interesting is the difference between cloudy and sunny days. It is
obvious that the average solar power available during cloudy days is lower. Nevertheless,
notice the peak demand during sunny days (245KVA, 275KVA, 260KVA) is higher than
the peak demand during cloudy days (210KVA, 190KVA). The reason for this is that the
higher electrical load in the facility are the Chillers, which operates lightly at lower
temperatures during cloudy or rainy days. This is good for the usefulness of the solar
power. However, this effect occurs during summer time and further study is necessary
during the winter. In addition, there is a power demand average of about 120KVA during
nighttime.
36
Figure 2-8 Power Load profile at SES-2, July 27 to July 31
A useful tool for planning the PV system resources including the effect of
meteorological analysis is available via an interactive web platform in
www.renewables.ninja. Figure 2-9 shows simulated power output performance for the
existing PV system in the Kayenta HC from July 27, 2014 to July 31, 2014. On average,
the simulated performance is approximate to the actual performance shown in Figure 2-7,
although some variations can be noticed on July 28.
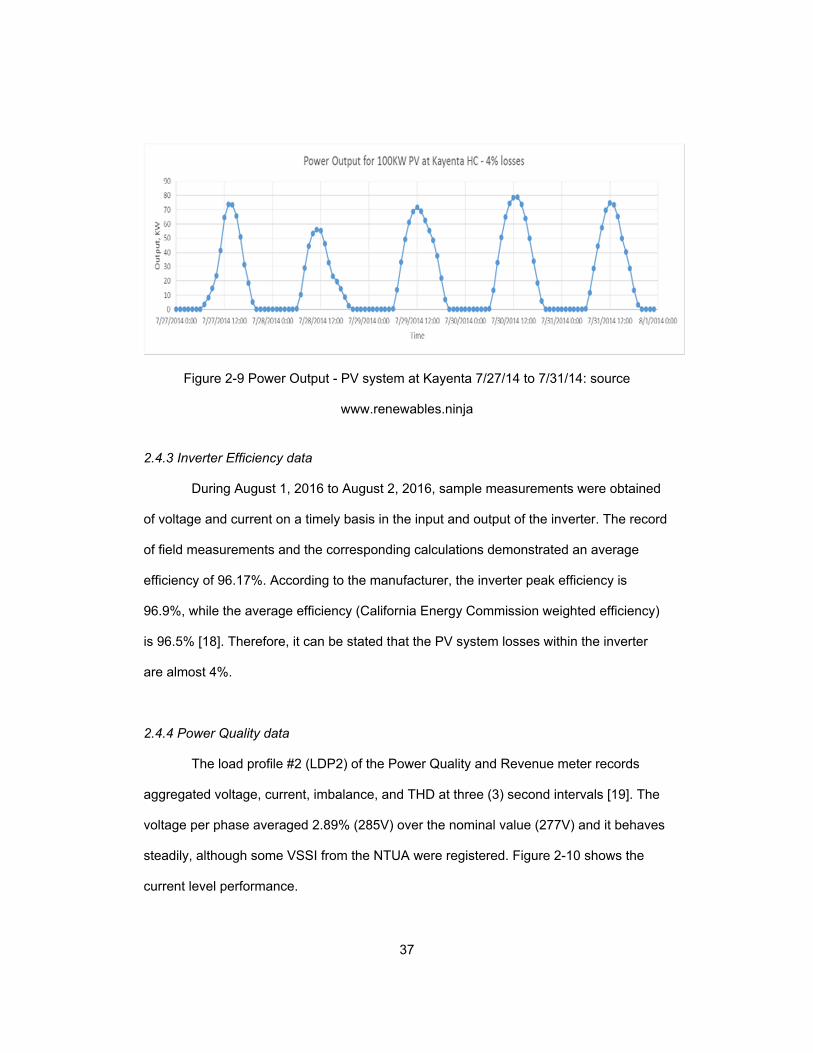
37
Figure 2-9 Power Output - PV system at Kayenta 7/27/14 to 7/31/14: source
www.renewables.ninja
2.4.3 Inverter Efficiency data
During August 1, 2016 to August 2, 2016, sample measurements were obtained
of voltage and current on a timely basis in the input and output of the inverter. The record
of field measurements and the corresponding calculations demonstrated an average
efficiency of 96.17%. According to the manufacturer, the inverter peak efficiency is
96.9%, while the average efficiency (California Energy Commission weighted efficiency)
is 96.5% [18]. Therefore, it can be stated that the PV system losses within the inverter
are almost 4%.
2.4.4 Power Quality data
The load profile #2 (LDP2) of the Power Quality and Revenue meter records
aggregated voltage, current, imbalance, and THD at three (3) second intervals [19]. The
voltage per phase averaged 2.89% (285V) over the nominal value (277V) and it behaves
steadily, although some VSSI from the NTUA were registered. Figure 2-10 shows the
current level performance.

38
Figure 2-10 Current level performance, Kayenta HC
2.4.5 Harmonics
The Power Quality and Revenue meter displayed high content of harmonic
currents, although the harmonic voltages were shown to be very low. The Power Logger
was connected to the critical loads during 24 hours, while the Power Quality and
Revenue meter remained in the main breaker (SES-2).
Total Harmonic Distortion (THD) current average values are 28.2%, 27%, 30.2%,
50.4% for A, B, C and N respectively. The maximum values of THD currents for phases
A, B, C and N respectively are 35.8%, 35.3%, 48.2% and 91.2%. Figure 2-11 shows the
THD current values measured at three (3) second intervals from August 1, 2016 to
August 4, 2016. The THD current values (average and maximum) for the selected 24-
hour period were very close to the values for the entire period. Figure 2-12 show the THD
current values measured to the critical loads branch. The THD current average values
are 14.0%, 12.5%, 14.9%, 26.6% for A, B, C and N respectively. It is not clear how these
THD values at the critical branch can relate to the THD values at SES-2, but some
calculations can be done with the information available. The THD is a measure of the

39
effective value of the harmonic components of a distorted waveform [20]. This index for
current can be calculated:
= ∑ (2 − 1) Where Ih is the rms value of harmonic component h of the current. The THD is related to
the rms value of the current as follows:
= ∗ 1 + = √1 + (2 − 2)
Figure 2-11 THD Currents performance, at SES-2
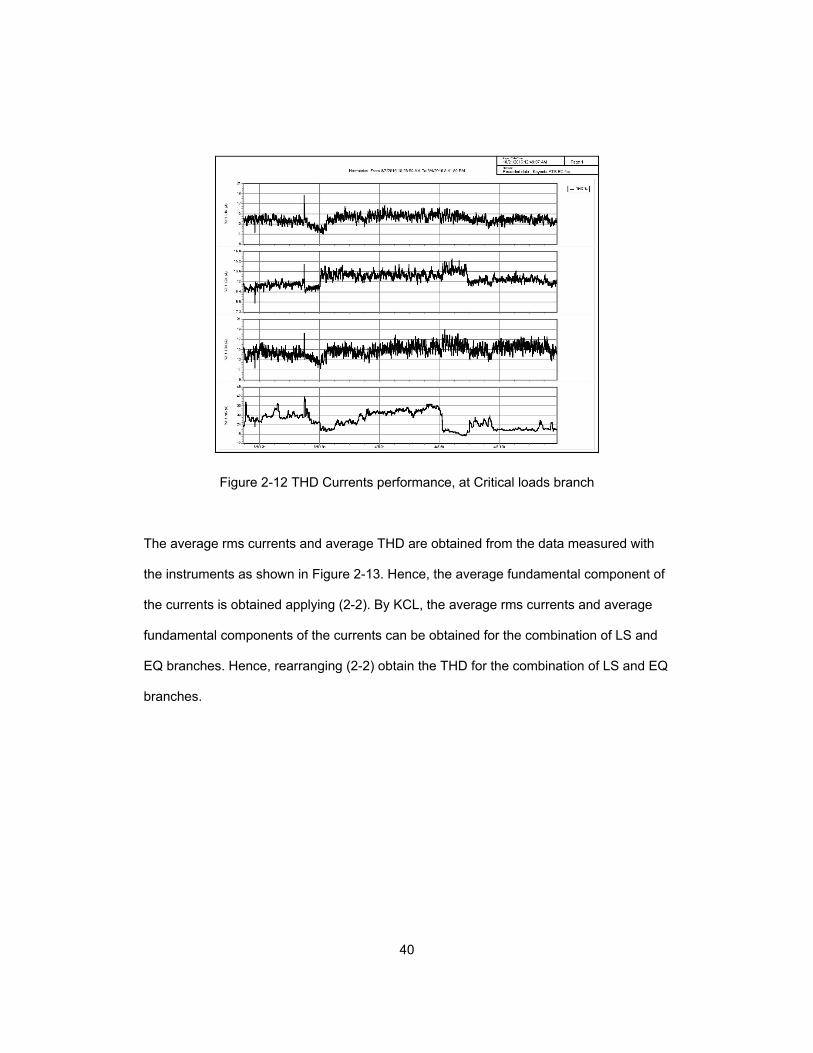
40
Figure 2-12 THD Currents performance, at Critical loads branch
The average rms currents and average THD are obtained from the data measured with
the instruments as shown in Figure 2-13. Hence, the average fundamental component of
the currents is obtained applying (2-2). By KCL, the average rms currents and average
fundamental components of the currents can be obtained for the combination of LS and
EQ branches. Hence, rearranging (2-2) obtain the THD for the combination of LS and EQ
branches.
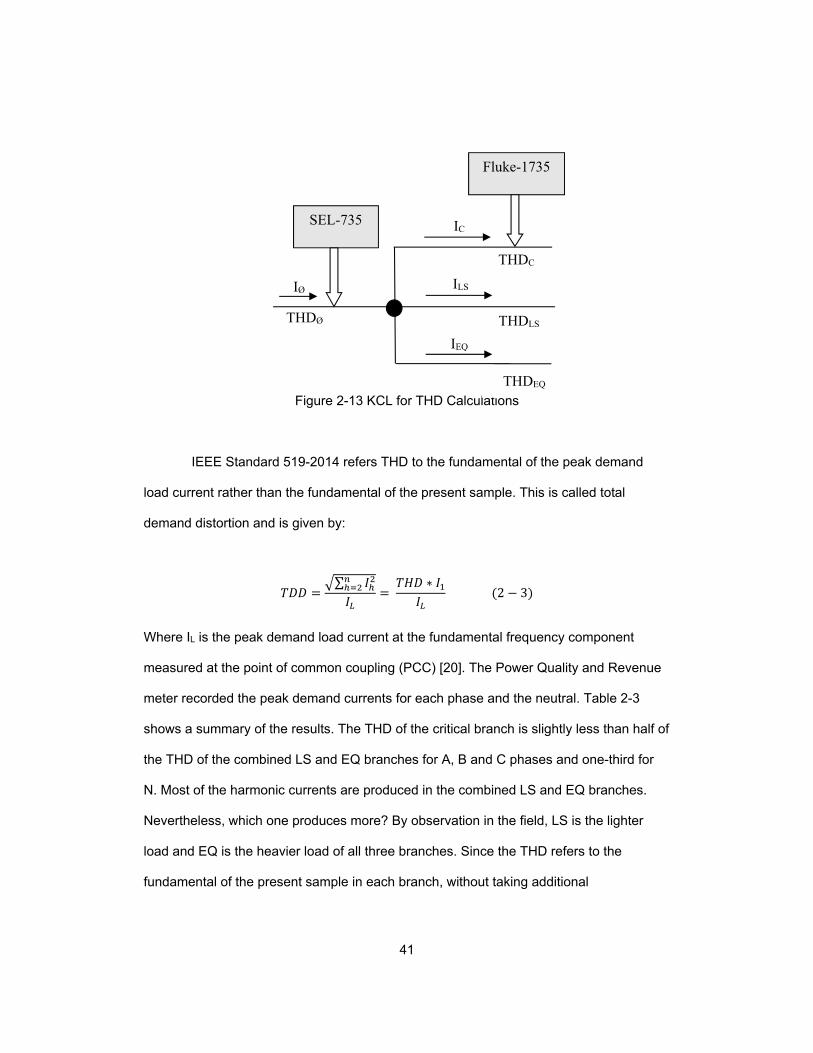
41
Figure 2-13 KCL for THD Calculations
IEEE Standard 519-2014 refers THD to the fundamental of the peak demand
load current rather than the fundamental of the present sample. This is called total
demand distortion and is given by:
= ∑ = ∗ (2 − 3) Where IL is the peak demand load current at the fundamental frequency component
measured at the point of common coupling (PCC) [20]. The Power Quality and Revenue
meter recorded the peak demand currents for each phase and the neutral. Table 2-3
shows a summary of the results. The THD of the critical branch is slightly less than half of
the THD of the combined LS and EQ branches for A, B and C phases and one-third for
N. Most of the harmonic currents are produced in the combined LS and EQ branches.
Nevertheless, which one produces more? By observation in the field, LS is the lighter
load and EQ is the heavier load of all three branches. Since the THD refers to the
fundamental of the present sample in each branch, without taking additional
THDEQ
THDLS
THDC
THDØ
IEQ
ILS
IC
IØ
SEL-735
Fluke-1735

42
measurements, it can be concluded that most of the harmonic currents are produced in
the equipment branch.
Table 2-3 Summary of harmonic current measurements and calculations
IEEE standard 519-2014 establishes current distortion limits for systems rated
120V through 69kV [23]. These limits increase as the ratio of ISC / IL increases, where ISC
is the maximum short-circuit current at PCC. ISC is provided in the submittal for the short
circuit and device coordination study for new healthcare facilities. Calculations show 20 <
ISC/IL = 45.2 < 50 and recommends a limit of TDD = 8.0. It is important to notice that the
Kayenta HC is a single load in a remote location connected to an isolated feeder of
NTUA; however, some energy savings can be achieved by reducing the harmonic
currents.
2.5 Modeling Kayenta PV System
Modeling and simulation is a proven method for research and development of the
PV systems [24]-[27]. The theory of PV system modeling can be combined with
manufacturer datasheets of existing equipment, the data obtained experimentally and
other resources in order to produce accurate simulations of different conditions and
expanded systems. Literature has a lot of research regarding different techniques of
Phase A B C N A B C N A B C NI1 (A) 368.6 370.4 355.7 23.0 71.5 60.3 52.1 15.1 297.1 310.1 303.6 8.0
Irms (A) 383 383.7 371.6 25.8 72.2 60.8 52.7 15.6 310.8 322.9 318.9 10.2THD (%) 28.2 27.0 30.2 50.4 14.0 12.5 14.9 26.6 30.7 29.0 32.1 80.0TDD (%) 12.7 12.6 13.0 22.8
SES-2 Critical branch Combined LS and EQ branches
43
Maximum Power Point Tracking (MPPT) for the control of PV systems [29]-[34]. MPPT
techniques are used to increase or to maximize the output power of photovoltaic system.
2.5.1 Mathematical Model to match Kayenta PV system
The existing PV system in Kayenta can be modeled using the ideal single-diode
model (ISDM) approach, which is represented with a circuit composed of an ideal current
source in parallel with an ideal diode [28]. The ISDM takes advantage of the simplicity of
ideal models and has the capability of extracting accurate estimates of the model
parameters, directly related to manufacturer datasheets. A complete nomenclature and
description of equations is presented in [24]. Input data for the ISDM are temperature and
irradiance. Temperature information is obtained from NREL historical data (during July
Tavg=19.1°C, Tmax=27.7°C, Tmin=10.3°C). Solar irradiance from experimental data during a
sunny day in July can be approximated with a mathematical formula,
( ) = − − (2 − 4) Where Emax is the typical maximum irradiance during a day in July and TF is a time factor
to adjust the data over the daylight period. Notice the irradiance is a function of time
during the day.
Parameters obtained from the datasheet (Suniva Optimus OPT #265-60-4-100)
are: the PV-cell temperature at STC, Irradiation at STC, PV open-circuit voltage at STC,
PV short-circuit current at STC, PV voltage at the maximum power point, PV current at
the maximum power point of STC, Temperature coefficient on PV current, and
Temperature coefficient on PV voltage. The diode ideality factor A can be calculated from
the equation,

44
( ∗∗ ∗ ) − 1( ∗∗ ∗ ) − 1 = 1 − (2 − 5)
The diode reverse bias saturation current (ISS) is calculated and can be used to
reproduce the PV cell solar module I-V characteristic and the power characteristic for
verification against the datasheet. The PV photon current changes with solar irradiation
and cell temperature. Keeping the change in temperature constant and applying (2-4) for
the solar irradiance, the PV photon current is expressed as a function of time during the
day.
( , ) = ( ) ∗ ∗ (1 + ∗ ∆ )(2 − 6) The updated I-V characteristic equation can be written as a function of time
during the day,
( , ) = ( , ) − ( ( ), ) ∗ ∗∗ ∗( ∆ ) − 1 (2 − 7)
Where ∆Ee(t) = Ee(t) - Ee(t-1) monitor the change in irradiance during minor periods and
the value of vPV is determined by the balance between the PV generation and the load.
The shape and size of the load can also be represented mathematically as a function of
time during the day using experimental data shown in Figure 2-8.
2.5.2 Simulation expanded Kayenta PV system in Simulink
Simulink is a widely use tool for modeling and simulation of different MPPT
techniques [30]-[33]. Among the different MPPT techniques are Fractional Short Circuit
Current (FSCC), Fractional Open Circuit Voltage (FOCV), Perturb & Observe (P&O) and
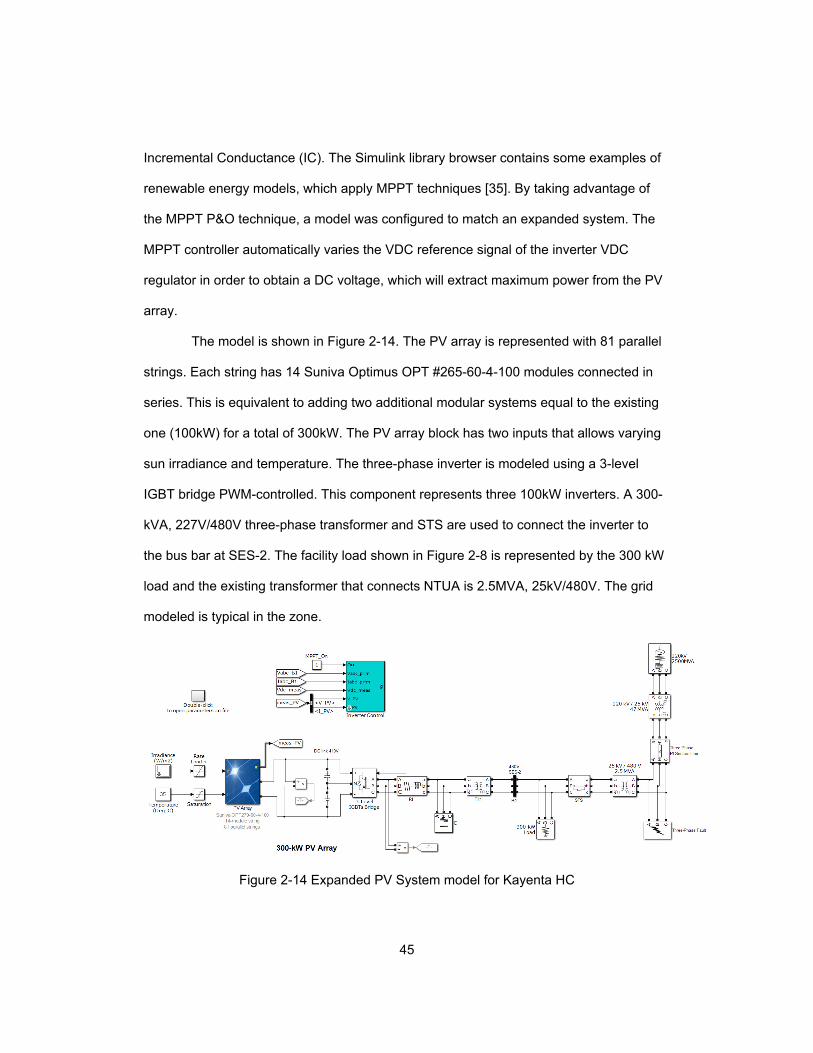
45
Incremental Conductance (IC). The Simulink library browser contains some examples of
renewable energy models, which apply MPPT techniques [35]. By taking advantage of
the MPPT P&O technique, a model was configured to match an expanded system. The
MPPT controller automatically varies the VDC reference signal of the inverter VDC
regulator in order to obtain a DC voltage, which will extract maximum power from the PV
array.
The model is shown in Figure 2-14. The PV array is represented with 81 parallel
strings. Each string has 14 Suniva Optimus OPT #265-60-4-100 modules connected in
series. This is equivalent to adding two additional modular systems equal to the existing
one (100kW) for a total of 300kW. The PV array block has two inputs that allows varying
sun irradiance and temperature. The three-phase inverter is modeled using a 3-level
IGBT bridge PWM-controlled. This component represents three 100kW inverters. A 300-
kVA, 227V/480V three-phase transformer and STS are used to connect the inverter to
the bus bar at SES-2. The facility load shown in Figure 2-8 is represented by the 300 kW
load and the existing transformer that connects NTUA is 2.5MVA, 25kV/480V. The grid
modeled is typical in the zone.
Figure 2-14 Expanded PV System model for Kayenta HC
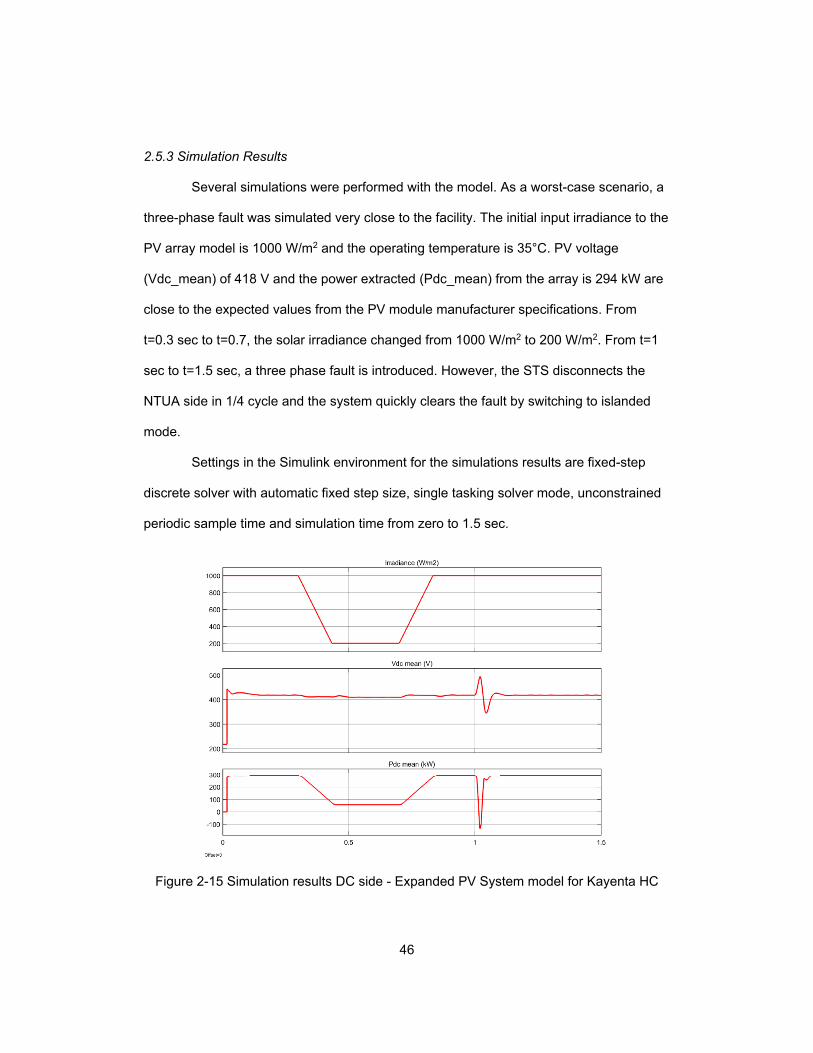
46
2.5.3 Simulation Results
Several simulations were performed with the model. As a worst-case scenario, a
three-phase fault was simulated very close to the facility. The initial input irradiance to the
PV array model is 1000 W/m2 and the operating temperature is 35°C. PV voltage
(Vdc_mean) of 418 V and the power extracted (Pdc_mean) from the array is 294 kW are
close to the expected values from the PV module manufacturer specifications. From
t=0.3 sec to t=0.7, the solar irradiance changed from 1000 W/m2 to 200 W/m2. From t=1
sec to t=1.5 sec, a three phase fault is introduced. However, the STS disconnects the
NTUA side in 1/4 cycle and the system quickly clears the fault by switching to islanded
mode.
Settings in the Simulink environment for the simulations results are fixed-step
discrete solver with automatic fixed step size, single tasking solver mode, unconstrained
periodic sample time and simulation time from zero to 1.5 sec.
Figure 2-15 Simulation results DC side - Expanded PV System model for Kayenta HC
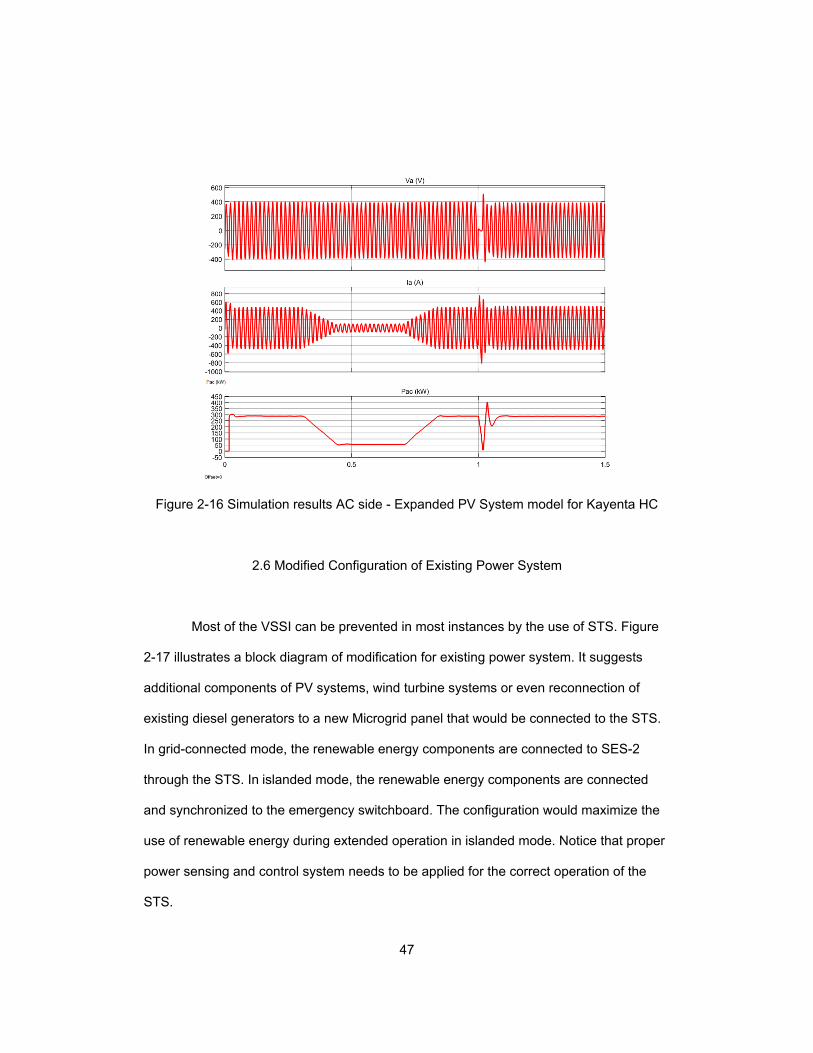
47
Figure 2-16 Simulation results AC side - Expanded PV System model for Kayenta HC
2.6 Modified Configuration of Existing Power System
Most of the VSSI can be prevented in most instances by the use of STS. Figure
2-17 illustrates a block diagram of modification for existing power system. It suggests
additional components of PV systems, wind turbine systems or even reconnection of
existing diesel generators to a new Microgrid panel that would be connected to the STS.
In grid-connected mode, the renewable energy components are connected to SES-2
through the STS. In islanded mode, the renewable energy components are connected
and synchronized to the emergency switchboard. The configuration would maximize the
use of renewable energy during extended operation in islanded mode. Notice that proper
power sensing and control system needs to be applied for the correct operation of the
STS.
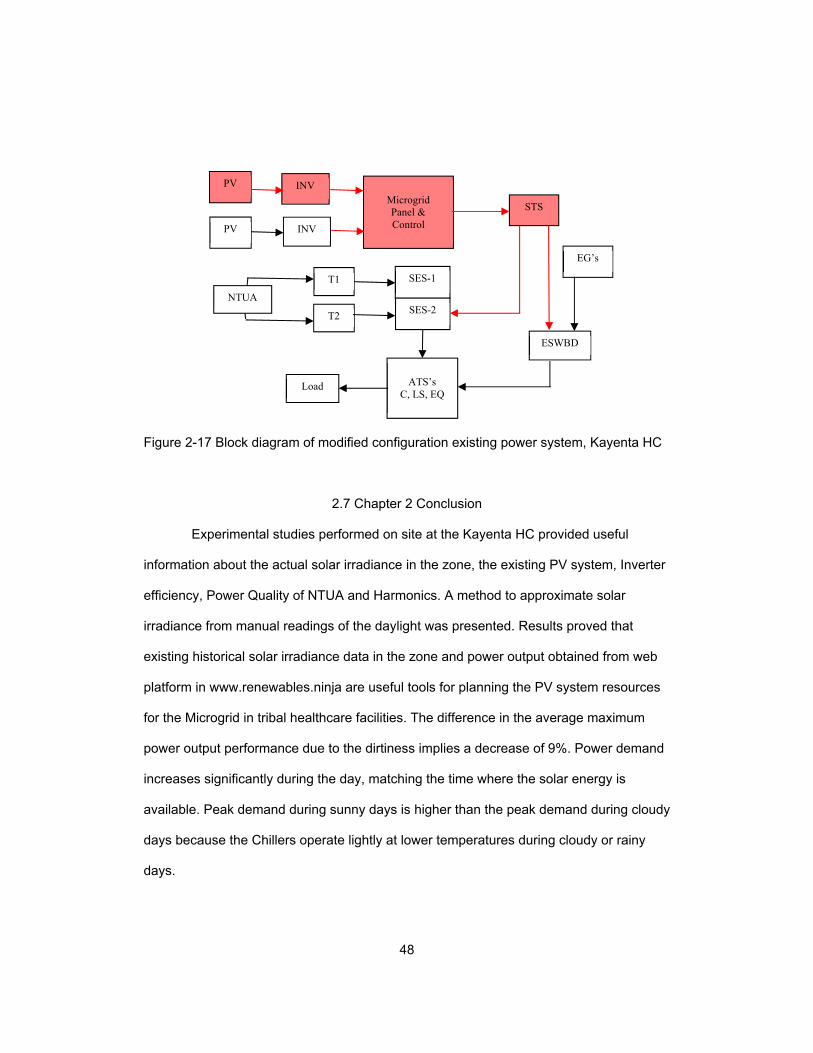
48
Figure 2-17 Block diagram of modified configuration existing power system, Kayenta HC
2.7 Chapter 2 Conclusion
Experimental studies performed on site at the Kayenta HC provided useful
information about the actual solar irradiance in the zone, the existing PV system, Inverter
efficiency, Power Quality of NTUA and Harmonics. A method to approximate solar
irradiance from manual readings of the daylight was presented. Results proved that
existing historical solar irradiance data in the zone and power output obtained from web
platform in www.renewables.ninja are useful tools for planning the PV system resources
for the Microgrid in tribal healthcare facilities. The difference in the average maximum
power output performance due to the dirtiness implies a decrease of 9%. Power demand
increases significantly during the day, matching the time where the solar energy is
available. Peak demand during sunny days is higher than the peak demand during cloudy
days because the Chillers operate lightly at lower temperatures during cloudy or rainy
days.
PV
PV
INV
INV
Microgrid Panel & Control
STS
NTUA
T1
T2
SES-1
SES-2
ESWBD
ATS’s
C, LS, EQ
EG’s
Load

49
Most of the VSSI recorded can be prevented in most instances by the use of a
STS. STS application together with the design around the Microgrid concept can be
considered for new tribal healthcare facilities in the zone. By strategically collocating the
Fluke 735 during 24 hours in one of the three branches of the healthcare facility
combined with some calculations, it was determined that most of the harmonic currents
are produced in the equipment branch.
Theoretical equations were combined with experimental solar irradiance data and
historical temperatures in order to produce a more accurate mathematical representation
of the existing PV system. A Simulink model was used to study the interaction between a
proposed expanded PV system with the existing power system around the Microgrid
concept.

50
Kayenta Health Center used as guidance for concept model for Navajo Nation
3.1 Introduction
The Kayenta Service Unit population of 20,000 is spread across a remote and
sparsely populated area. Kayenta is in a traditional part of the reservation. Services are
provided to 200 patients each day in continuity or walk-in clinics and in a 24 hour/day, 7
day/week emergency room. The clinic has on site lab, x-ray and pharmacy services.
Current medical staff is made up of Family Practice, Pediatrics, Internal Medicine and
Psychiatry specialties. Kayenta Health Center is representative of the average IHS
healthcare facility in terms of location, healthcare services offered, Power Quality of
electrical system, facility size and power system size. Kayenta Health Center began
operations in July 2016 and have new staff quarters facilities on the same campus.
This chapter describes the wintertime experimental process and detailed
information related to a 100KW PV system case study at the Kayenta Health Center,
which is located in the Navajo Nation. Information about the PV system performance, the
load demand of the power system at the facility, and additional field observations during
wintertime supplements previous experimental data obtained during the summertime.
Seasonal experimental data validated with theoretical data available for the zone, the
facility, the systems and the equipment is used to develop a concept model for the actual
implementation. Targeted information about harmonics provides insight about specific
features of the model. Modeling and simulation tools will support the acquisition and
design processes as well as the implementation of the microgrid in a tribal health care
facility on the IHS New Construction Priority List. The concept model is adjusted such
that the actual implementation of the microgrid will enhance the power quality, result in

51
the design of optimum power system, produce energy savings and reduce environmental
pollution.
The Indian Health Service (IHS) has been actively researching the microgrid
concept based on experimental data gathered from existing PV system at the Kayenta
Health Center [1], [2]. The Kayenta Health Center is a new hospital located in the Navajo
Nation that began operations in July 2016. This chapter describes the experimental
process performed at the Kayenta HC during wintertime and compares that data to data
obtained during summertime as well as historical data available. The information is then
analyzed, extrapolated and directed to build a concept model of the microgrid. The
concept model is a modular design with improved power quality, low harmonic content,
code compliance and wide use of renewable energy. It is anticipated that the microgrid
concept model will be used in the acquisition process for a new healthcare facility in the
area.
The Navajo Tribal Utility Authority (NTUA) provided two separate feeders, each
one connected to a 2.5MVA, 25KV - 480/277V transformer. Each transformer feeds one
side of the double-ended switchgear (3000A, 480/277V). The PV system consists of 378
Suniva optimus monocrystalline solar modules (model OPT # 265-60-4-100) for a total
power rating of 100KW. The inverter is Solectria Renewables, model PVI 100KW, 480V.
Five (5) diesel generators (1000KVA @ 0.8PF, 480/277V) provide emergency power for
the entire facility in case of loss of power or power quality issues from the utility. The
emergency power supply system (EPSS) provides emergency power through four
automatic transfer switches (ATS): ATS-LS (600A), ATS-C (800A), ATS-EQ (1200A) and
ATS-EQ1G (2000A). These four ATS are fed from individual breakers connected to the
bus bar energized by the main breaker SES-2. Notice that the equipment branch is

52
divided into two different ATS. There is a fifth ATS connected to SES-1 for non-essential
equipment.
Experimental research shows most of the harmonic currents were generated in
the equipment branch. Harmonic current components were found to be mainly fifth,
seventh and triplen.
3.2 Experimental Data Winter Time
3.2.1 Power System Measurements
The main goal of this experimental process was to obtain wintertime power
system measurements similar to those obtained during summertime. The power logger
was installed in the output of the inverter to get real time performance from Monday
through Friday. The Power Quality and Revenue meter was installed in the main breaker
of the SES-2 side of the double-ended switchgear for the same period in order to get
information about the load demand profile. This equipment can also observe and verify
the Power Quality of the electrical service received from the NTUA. Some sample
readings of actual light intensity were taken by the use of a light meter just to verify the
solar irradiance data during a snowy day.
It was determined from the experimental research during the summer that most
of the harmonic currents originated in the equipment branch of the facility electrical
system. Hence, it was decided to connect the power logger in the load side of the
equipment branch Automatic Transfer Switches. Additional real time measurements were
obtained for one (1) hour successively in ATS-EQ and ATS-EQ1G on Friday (see Figure
3-1).

53
Figure 3-1 Power Logger (Fluke 1735) installed in ATS equipment branch
3.2.2 PV System performance
During summertime and wintertime, the same Power Logger with the same
setting values was used to monitor the PV system performance at the Kayenta HC.
Information and features about the Power Logger can be found in [3]. The period of
performance is from January 23, 2017 at 8:18AM until January 27, 2017 at 11:58AM.
Figure 3-2 and Figure 3-3 illustrate respectively the total power and energy
recorded during one workweek for the PV system during wintertime. The total power in
Figure 3-2 shows minimum, maximum and average values. Figure 3-3 shows energy
levels for reactive and real power. Monday (1/23) and Tuesday (1/24) were snowy and
cloudy days, but Wednesday (1/24) was a clear and sunny day. Temperatures were in
the twenties and thirties during all week.
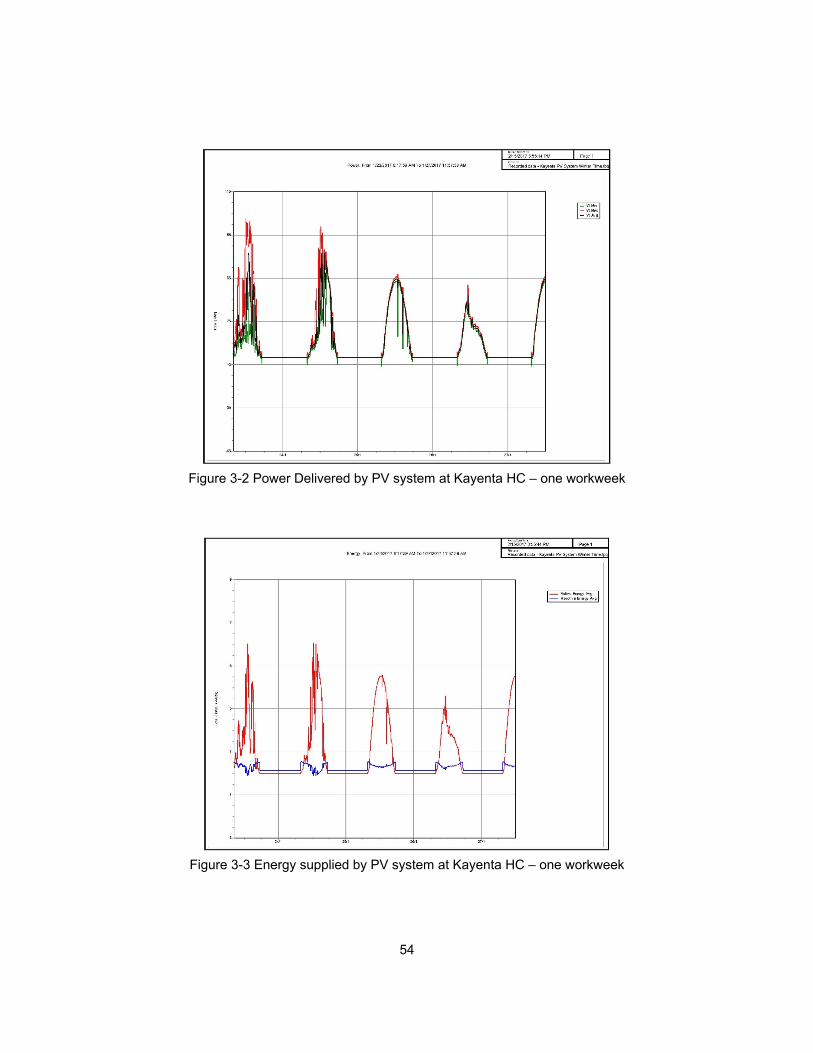
54
Figure 3-2 Power Delivered by PV system at Kayenta HC – one workweek
Figure 3-3 Energy supplied by PV system at Kayenta HC – one workweek
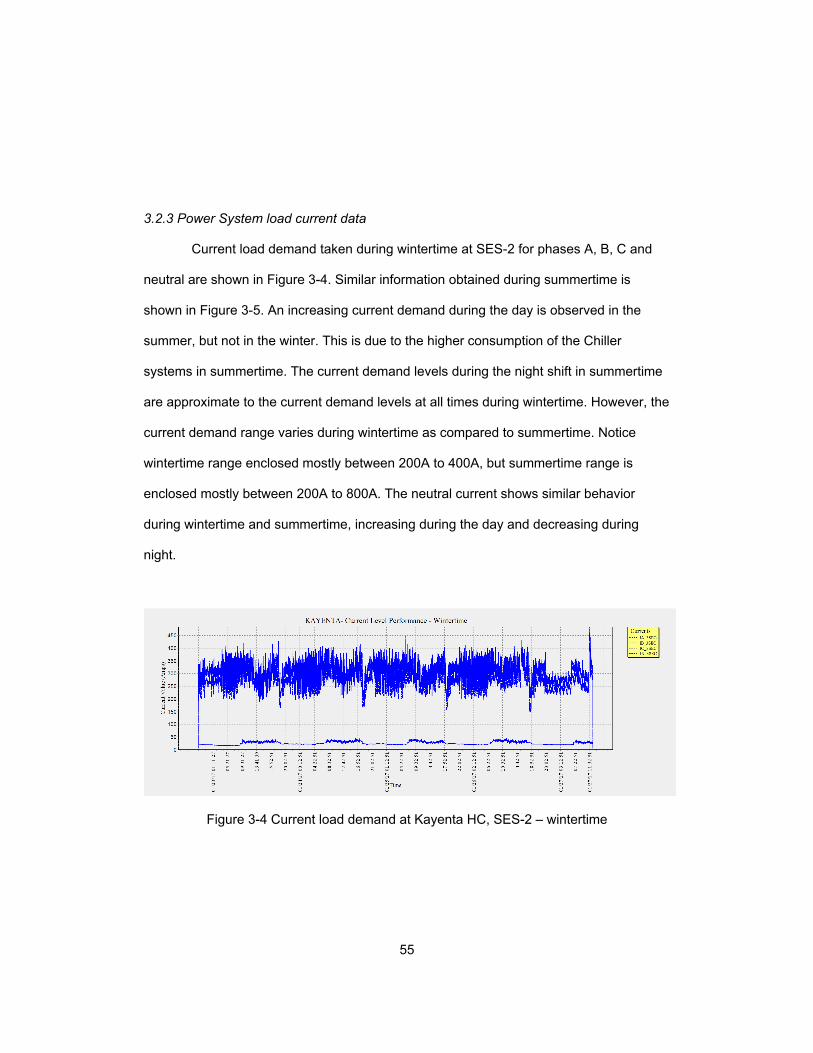
55
3.2.3 Power System load current data
Current load demand taken during wintertime at SES-2 for phases A, B, C and
neutral are shown in Figure 3-4. Similar information obtained during summertime is
shown in Figure 3-5. An increasing current demand during the day is observed in the
summer, but not in the winter. This is due to the higher consumption of the Chiller
systems in summertime. The current demand levels during the night shift in summertime
are approximate to the current demand levels at all times during wintertime. However, the
current demand range varies during wintertime as compared to summertime. Notice
wintertime range enclosed mostly between 200A to 400A, but summertime range is
enclosed mostly between 200A to 800A. The neutral current shows similar behavior
during wintertime and summertime, increasing during the day and decreasing during
night.
Figure 3-4 Current load demand at Kayenta HC, SES-2 – wintertime
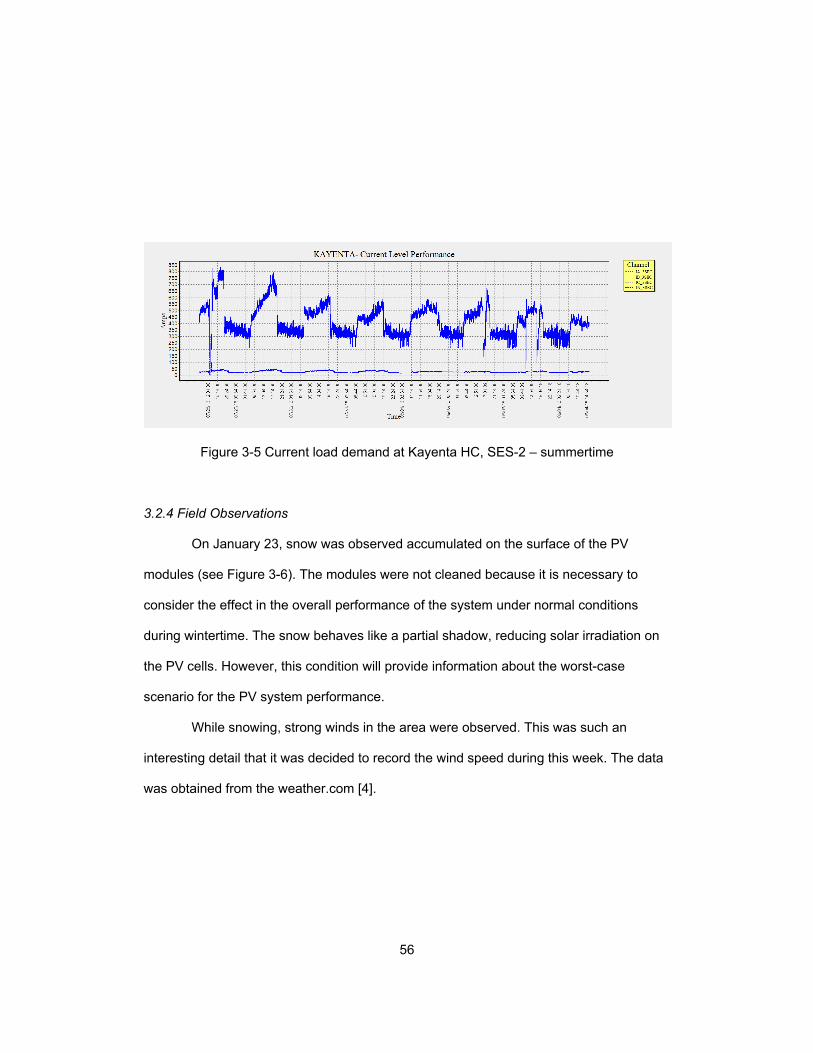
56
Figure 3-5 Current load demand at Kayenta HC, SES-2 – summertime
3.2.4 Field Observations
On January 23, snow was observed accumulated on the surface of the PV
modules (see Figure 3-6). The modules were not cleaned because it is necessary to
consider the effect in the overall performance of the system under normal conditions
during wintertime. The snow behaves like a partial shadow, reducing solar irradiation on
the PV cells. However, this condition will provide information about the worst-case
scenario for the PV system performance.
While snowing, strong winds in the area were observed. This was such an
interesting detail that it was decided to record the wind speed during this week. The data
was obtained from the weather.com [4].
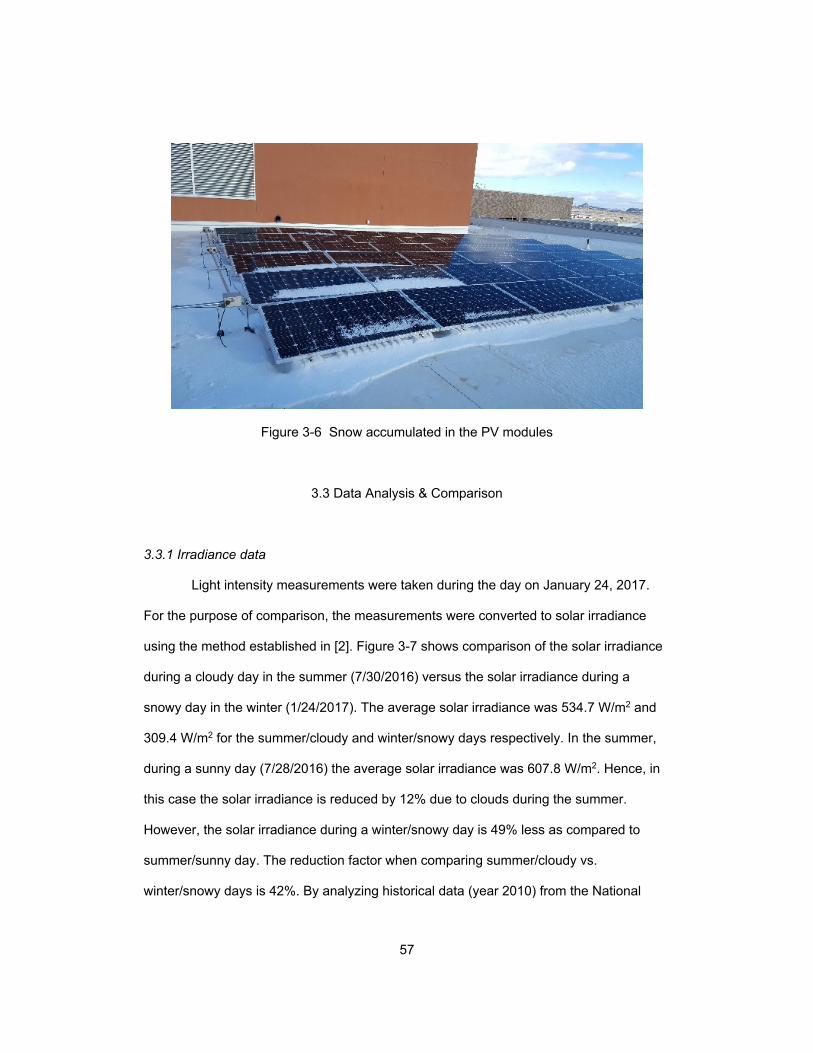
57
Figure 3-6 Snow accumulated in the PV modules
3.3 Data Analysis & Comparison
3.3.1 Irradiance data
Light intensity measurements were taken during the day on January 24, 2017.
For the purpose of comparison, the measurements were converted to solar irradiance
using the method established in [2]. Figure 3-7 shows comparison of the solar irradiance
during a cloudy day in the summer (7/30/2016) versus the solar irradiance during a
snowy day in the winter (1/24/2017). The average solar irradiance was 534.7 W/m2 and
309.4 W/m2 for the summer/cloudy and winter/snowy days respectively. In the summer,
during a sunny day (7/28/2016) the average solar irradiance was 607.8 W/m2. Hence, in
this case the solar irradiance is reduced by 12% due to clouds during the summer.
However, the solar irradiance during a winter/snowy day is 49% less as compared to
summer/sunny day. The reduction factor when comparing summer/cloudy vs.
winter/snowy days is 42%. By analyzing historical data (year 2010) from the National
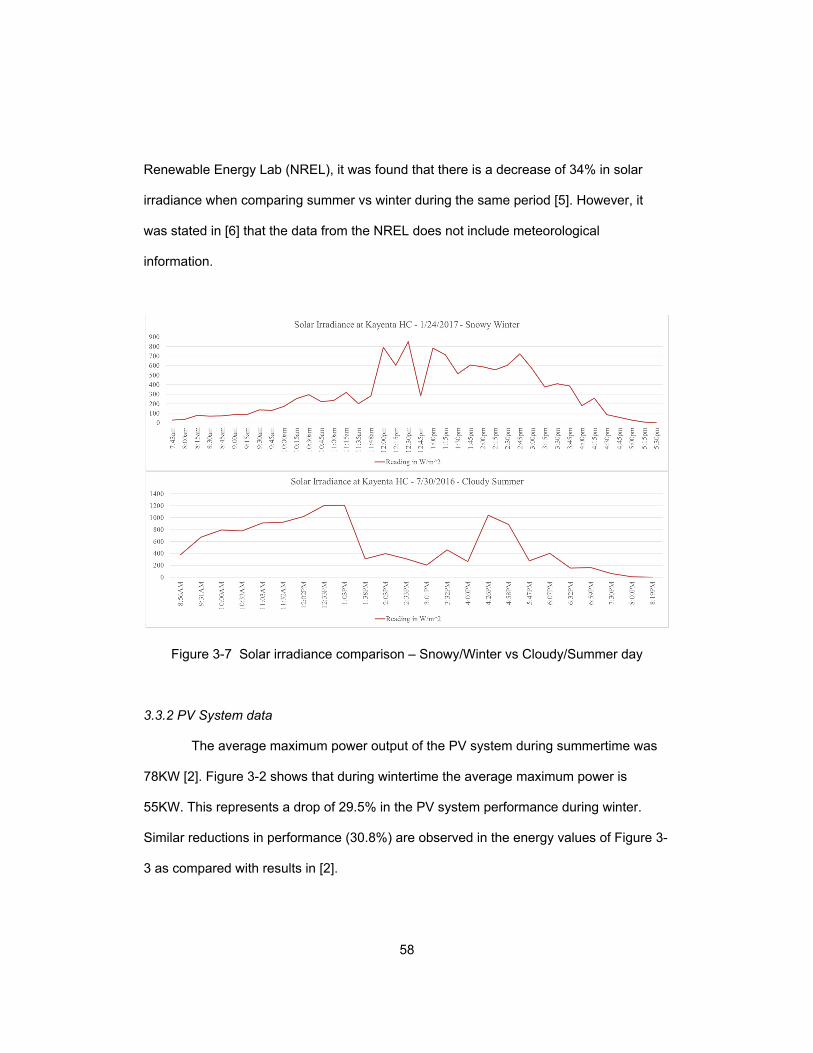
58
Renewable Energy Lab (NREL), it was found that there is a decrease of 34% in solar
irradiance when comparing summer vs winter during the same period [5]. However, it
was stated in [6] that the data from the NREL does not include meteorological
information.
Figure 3-7 Solar irradiance comparison – Snowy/Winter vs Cloudy/Summer day
3.3.2 PV System data
The average maximum power output of the PV system during summertime was
78KW [2]. Figure 3-2 shows that during wintertime the average maximum power is
55KW. This represents a drop of 29.5% in the PV system performance during winter.
Similar reductions in performance (30.8%) are observed in the energy values of Figure 3-
3 as compared with results in [2].
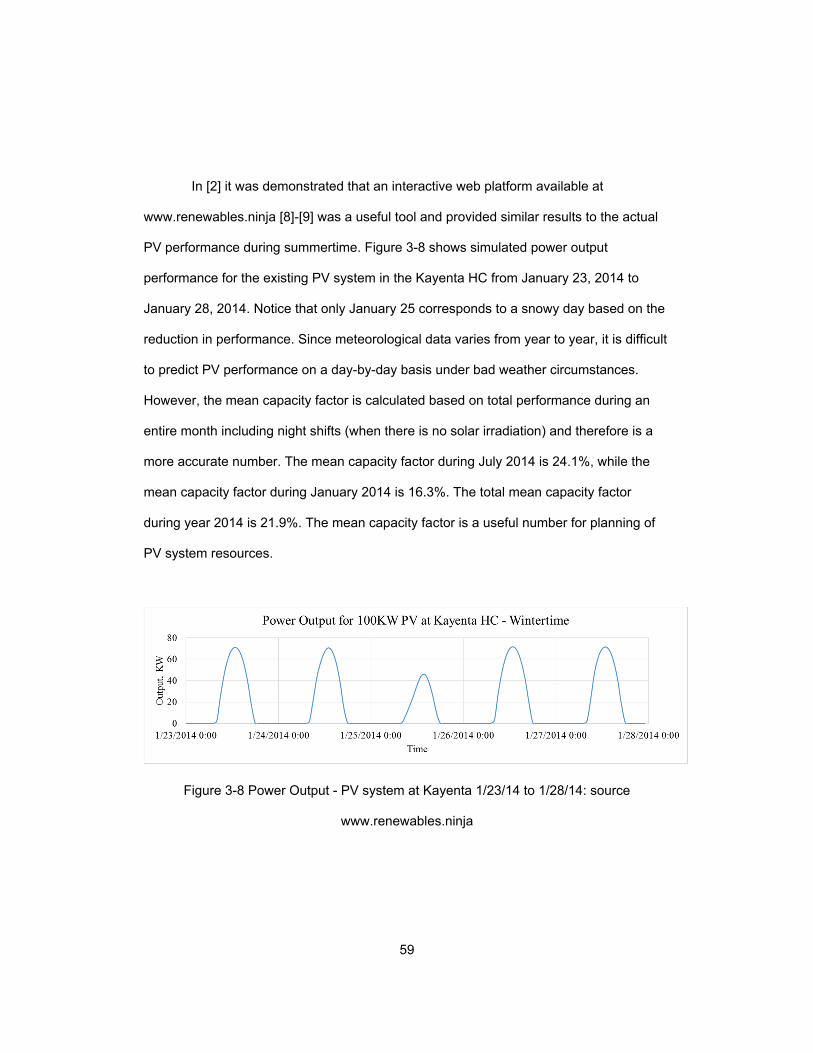
59
In [2] it was demonstrated that an interactive web platform available at
www.renewables.ninja [8]-[9] was a useful tool and provided similar results to the actual
PV performance during summertime. Figure 3-8 shows simulated power output
performance for the existing PV system in the Kayenta HC from January 23, 2014 to
January 28, 2014. Notice that only January 25 corresponds to a snowy day based on the
reduction in performance. Since meteorological data varies from year to year, it is difficult
to predict PV performance on a day-by-day basis under bad weather circumstances.
However, the mean capacity factor is calculated based on total performance during an
entire month including night shifts (when there is no solar irradiation) and therefore is a
more accurate number. The mean capacity factor during July 2014 is 24.1%, while the
mean capacity factor during January 2014 is 16.3%. The total mean capacity factor
during year 2014 is 21.9%. The mean capacity factor is a useful number for planning of
PV system resources.
Figure 3-8 Power Output - PV system at Kayenta 1/23/14 to 1/28/14: source
www.renewables.ninja
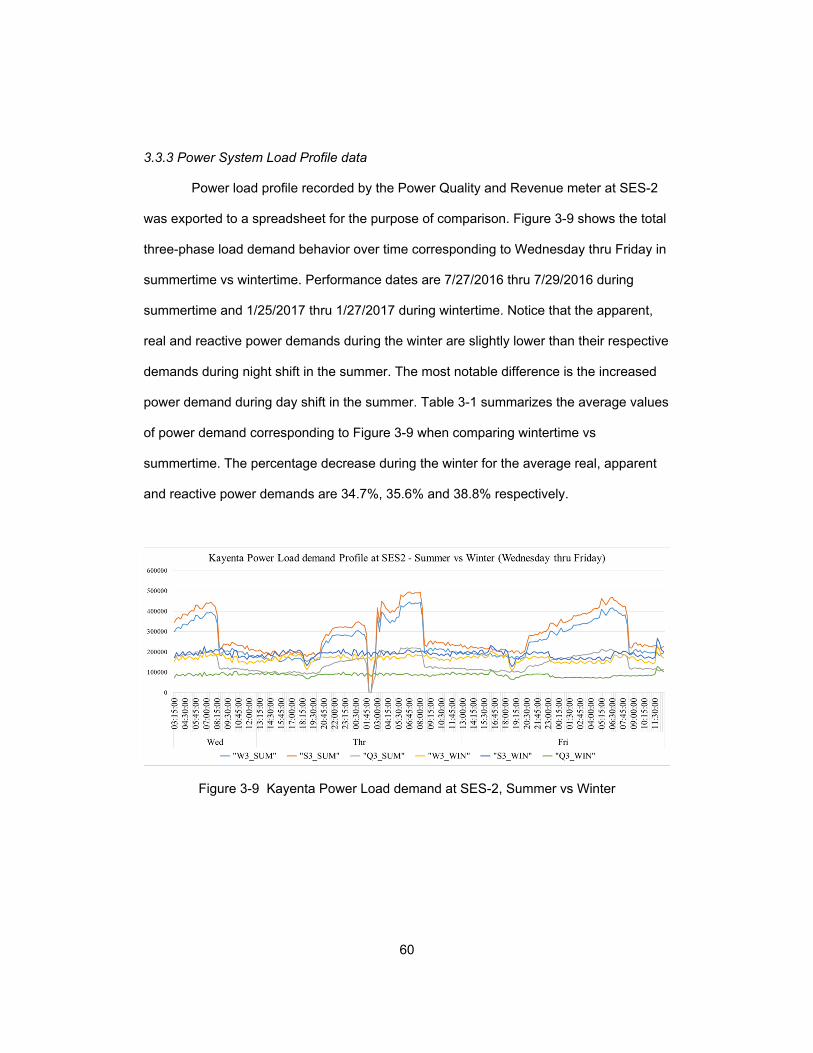
60
3.3.3 Power System Load Profile data
Power load profile recorded by the Power Quality and Revenue meter at SES-2
was exported to a spreadsheet for the purpose of comparison. Figure 3-9 shows the total
three-phase load demand behavior over time corresponding to Wednesday thru Friday in
summertime vs wintertime. Performance dates are 7/27/2016 thru 7/29/2016 during
summertime and 1/25/2017 thru 1/27/2017 during wintertime. Notice that the apparent,
real and reactive power demands during the winter are slightly lower than their respective
demands during night shift in the summer. The most notable difference is the increased
power demand during day shift in the summer. Table 3-1 summarizes the average values
of power demand corresponding to Figure 3-9 when comparing wintertime vs
summertime. The percentage decrease during the winter for the average real, apparent
and reactive power demands are 34.7%, 35.6% and 38.8% respectively.
Figure 3-9 Kayenta Power Load demand at SES-2, Summer vs Winter
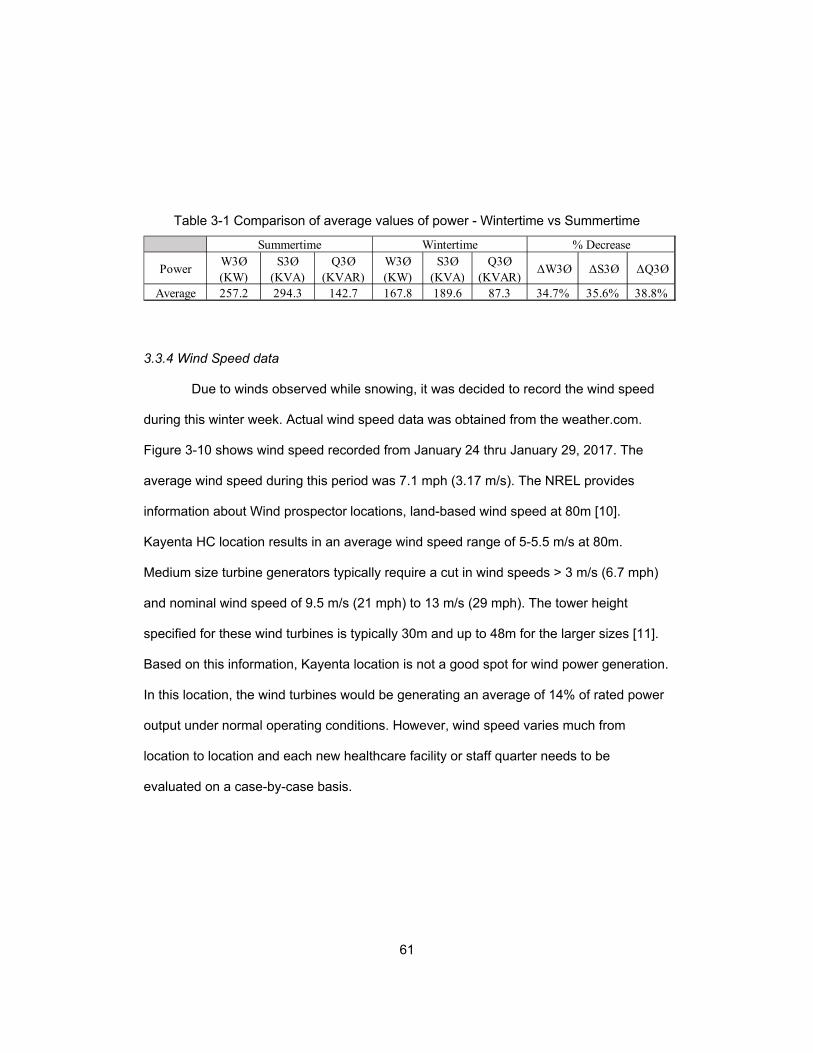
61
Table 3-1 Comparison of average values of power - Wintertime vs Summertime
3.3.4 Wind Speed data
Due to winds observed while snowing, it was decided to record the wind speed
during this winter week. Actual wind speed data was obtained from the weather.com.
Figure 3-10 shows wind speed recorded from January 24 thru January 29, 2017. The
average wind speed during this period was 7.1 mph (3.17 m/s). The NREL provides
information about Wind prospector locations, land-based wind speed at 80m [10].
Kayenta HC location results in an average wind speed range of 5-5.5 m/s at 80m.
Medium size turbine generators typically require a cut in wind speeds > 3 m/s (6.7 mph)
and nominal wind speed of 9.5 m/s (21 mph) to 13 m/s (29 mph). The tower height
specified for these wind turbines is typically 30m and up to 48m for the larger sizes [11].
Based on this information, Kayenta location is not a good spot for wind power generation.
In this location, the wind turbines would be generating an average of 14% of rated power
output under normal operating conditions. However, wind speed varies much from
location to location and each new healthcare facility or staff quarter needs to be
evaluated on a case-by-case basis.
PowerW3Ø (KW)
S3Ø (KVA)
Q3Ø (KVAR)
W3Ø (KW)
S3Ø (KVA)
Q3Ø (KVAR)
ΔW3Ø ΔS3Ø ΔQ3Ø
Average 257.2 294.3 142.7 167.8 189.6 87.3 34.7% 35.6% 38.8%
% DecreaseSummertime Wintertime
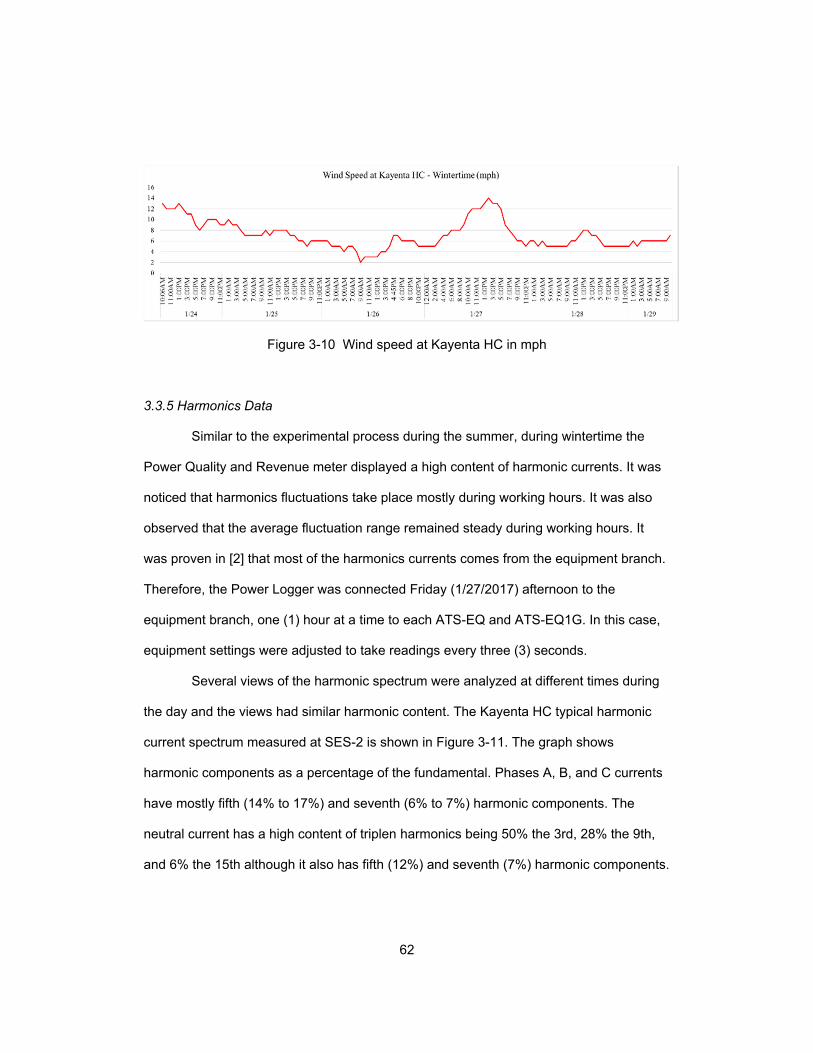
62
Figure 3-10 Wind speed at Kayenta HC in mph
3.3.5 Harmonics Data
Similar to the experimental process during the summer, during wintertime the
Power Quality and Revenue meter displayed a high content of harmonic currents. It was
noticed that harmonics fluctuations take place mostly during working hours. It was also
observed that the average fluctuation range remained steady during working hours. It
was proven in [2] that most of the harmonics currents comes from the equipment branch.
Therefore, the Power Logger was connected Friday (1/27/2017) afternoon to the
equipment branch, one (1) hour at a time to each ATS-EQ and ATS-EQ1G. In this case,
equipment settings were adjusted to take readings every three (3) seconds.
Several views of the harmonic spectrum were analyzed at different times during
the day and the views had similar harmonic content. The Kayenta HC typical harmonic
current spectrum measured at SES-2 is shown in Figure 3-11. The graph shows
harmonic components as a percentage of the fundamental. Phases A, B, and C currents
have mostly fifth (14% to 17%) and seventh (6% to 7%) harmonic components. The
neutral current has a high content of triplen harmonics being 50% the 3rd, 28% the 9th,
and 6% the 15th although it also has fifth (12%) and seventh (7%) harmonic components.
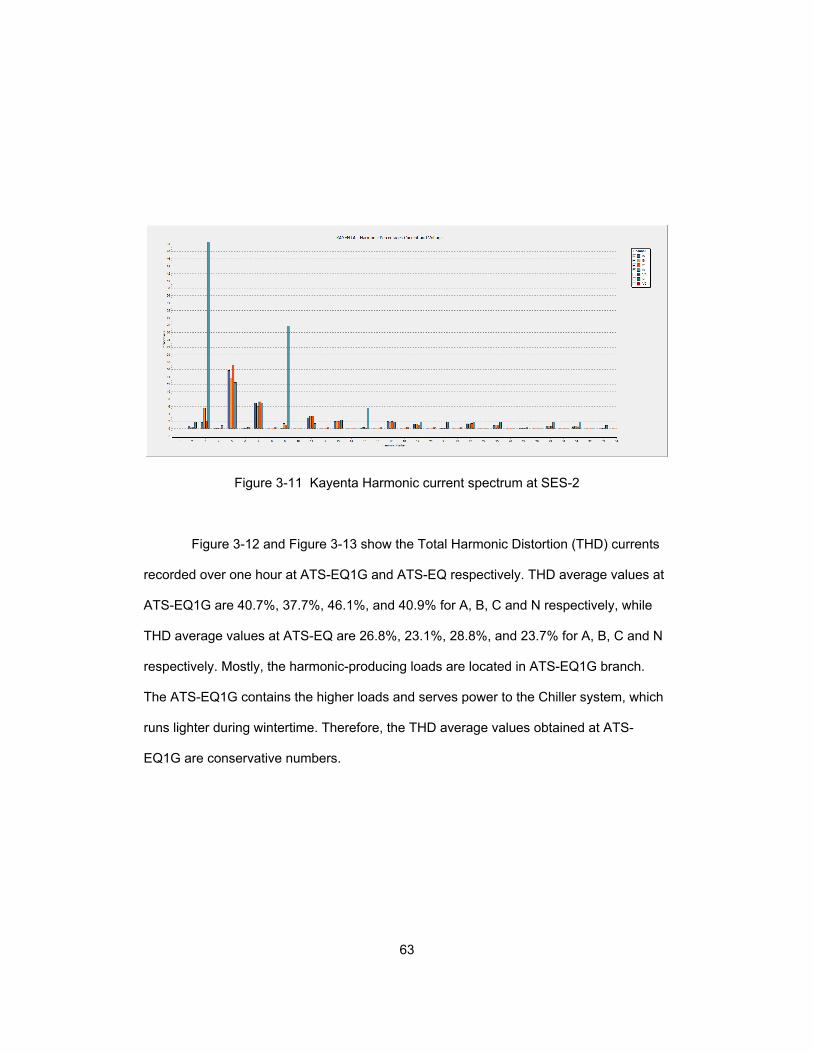
63
Figure 3-11 Kayenta Harmonic current spectrum at SES-2
Figure 3-12 and Figure 3-13 show the Total Harmonic Distortion (THD) currents
recorded over one hour at ATS-EQ1G and ATS-EQ respectively. THD average values at
ATS-EQ1G are 40.7%, 37.7%, 46.1%, and 40.9% for A, B, C and N respectively, while
THD average values at ATS-EQ are 26.8%, 23.1%, 28.8%, and 23.7% for A, B, C and N
respectively. Mostly, the harmonic-producing loads are located in ATS-EQ1G branch.
The ATS-EQ1G contains the higher loads and serves power to the Chiller system, which
runs lighter during wintertime. Therefore, the THD average values obtained at ATS-
EQ1G are conservative numbers.
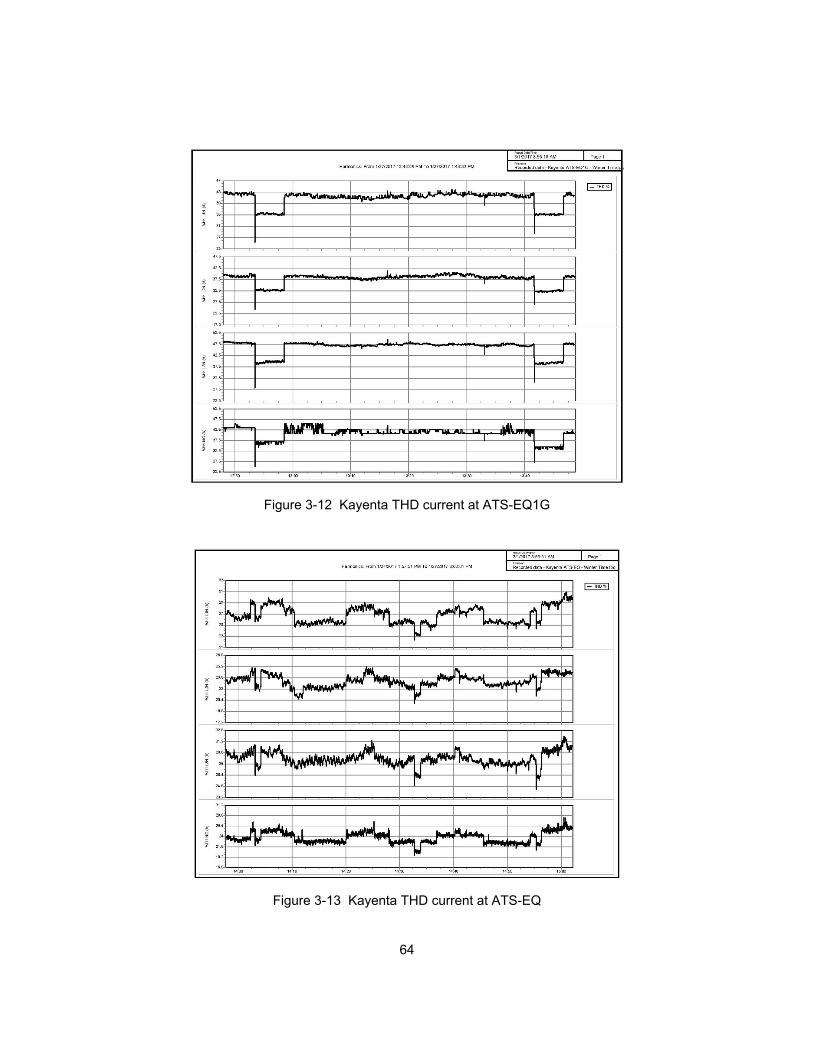
64
Figure 3-12 Kayenta THD current at ATS-EQ1G
Figure 3-13 Kayenta THD current at ATS-EQ

65
The THD is a measure of the effective value of the harmonic components of a
distorted waveform [12]. This index for current can be calculated:
= ∑ (3 − 1) By applying (1) to the results of Figure 3-11, using only the fifth and seventh harmonic
components, it represents 15.2% to 18.4% out of the THD for A, B and C phases. It was
found in [2] that the THD at SES-2 was 27% to 30.2% during summertime for A, B and C
phases. In the case of the neutral, only 13.9% out of the THD represents the fifth and
seventh harmonic components. However, the triplen harmonics represents 57.6% out of
the THD.
3.4 Modeling fifth and seventh Harmonic Filter
Modeling and simulation tools are very useful to obtain valuable information
about the behavior of a proposed solution prior to implementation in the actual power
system. Harmonic filters are widely used for mitigation of harmonic distortion in Power
Systems. This type of filter takes away the harmonic current components at the end user
side such that it will not pass through the utility meter. Fifth and seventh harmonic filters
matching the Kayenta HC power system and load profile are modeled using Simulink.
3.4.1 Simulation fifth and seventh harmonic filters for Kayenta HC power system in
Simulink
A model was configured to match the Kayenta power system’s highest load
based on experimental data obtained during summertime. The system load is 500KVA at
0.87PF. The Simulink model is shown in Figure 3-14. Based on experimental results
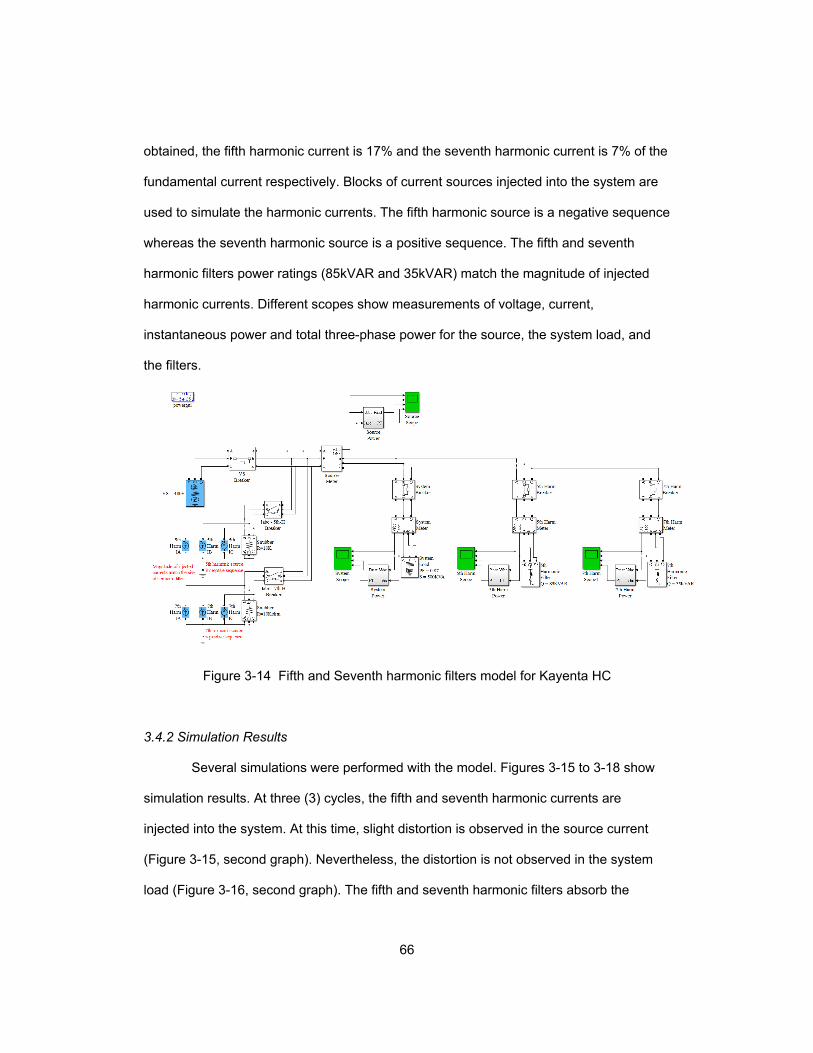
66
obtained, the fifth harmonic current is 17% and the seventh harmonic current is 7% of the
fundamental current respectively. Blocks of current sources injected into the system are
used to simulate the harmonic currents. The fifth harmonic source is a negative sequence
whereas the seventh harmonic source is a positive sequence. The fifth and seventh
harmonic filters power ratings (85kVAR and 35kVAR) match the magnitude of injected
harmonic currents. Different scopes show measurements of voltage, current,
instantaneous power and total three-phase power for the source, the system load, and
the filters.
Figure 3-14 Fifth and Seventh harmonic filters model for Kayenta HC
3.4.2 Simulation Results
Several simulations were performed with the model. Figures 3-15 to 3-18 show
simulation results. At three (3) cycles, the fifth and seventh harmonic currents are
injected into the system. At this time, slight distortion is observed in the source current
(Figure 3-15, second graph). Nevertheless, the distortion is not observed in the system
load (Figure 3-16, second graph). The fifth and seventh harmonic filters absorb the
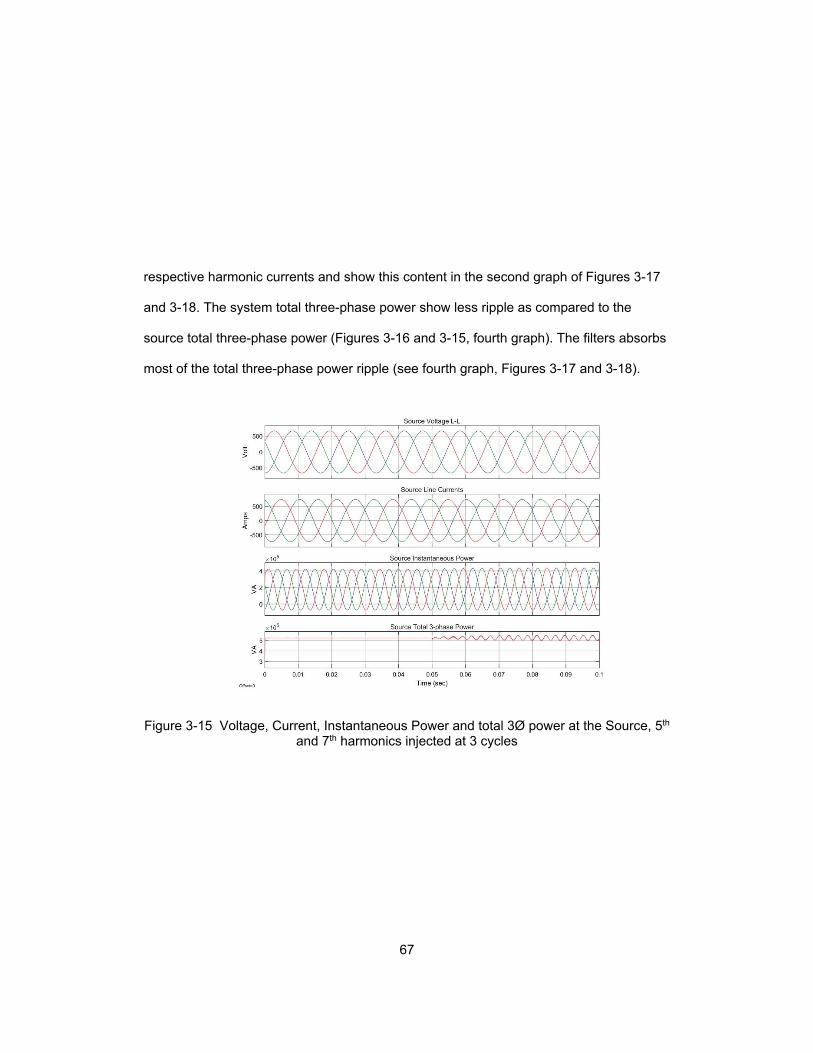
67
respective harmonic currents and show this content in the second graph of Figures 3-17
and 3-18. The system total three-phase power show less ripple as compared to the
source total three-phase power (Figures 3-16 and 3-15, fourth graph). The filters absorbs
most of the total three-phase power ripple (see fourth graph, Figures 3-17 and 3-18).
Figure 3-15 Voltage, Current, Instantaneous Power and total 3Ø power at the Source, 5th and 7th harmonics injected at 3 cycles
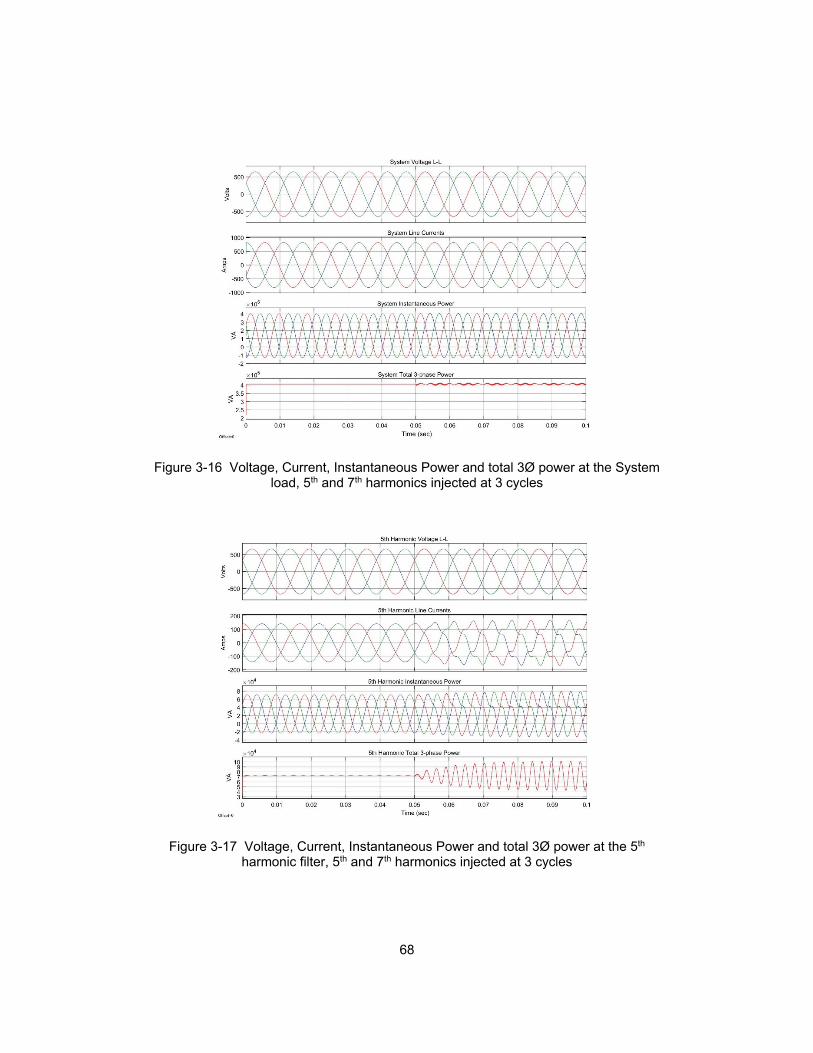
68
Figure 3-16 Voltage, Current, Instantaneous Power and total 3Ø power at the System load, 5th and 7th harmonics injected at 3 cycles
Figure 3-17 Voltage, Current, Instantaneous Power and total 3Ø power at the 5th harmonic filter, 5th and 7th harmonics injected at 3 cycles

69
Figure 3-18 Voltage, Current, Instantaneous Power and total 3Ø power at the 7th harmonic filter, 5th and 7th harmonics injected at 3 cycles
3.5 Microgrid Concept Model for Navajo Nation
The concept model is a general solution intended to be applicable for any tribal
healthcare facility or staff quarter located in the Navajo Nation. It is based on seasonal
experimental data collected in Kayenta HC. The concept model will be adjusted and
expanded in the form of a proposal for a specific new construction tribal healthcare
facility. Figure 3-19 shows a diagram configuration of the concept model for microgrid in
Navajo Nation. Power system components in cyan color are typically installed and
required for tribal healthcare facilities, whereas components in magenta color are new or
optional for the microgrid configuration.
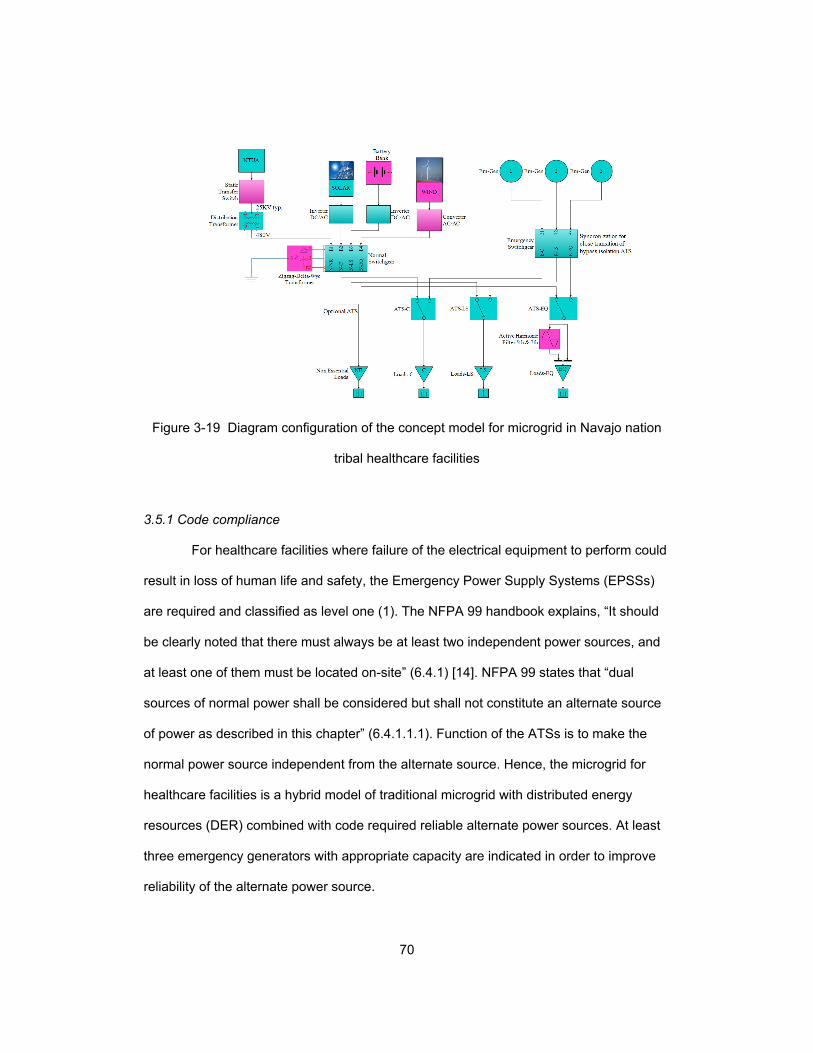
70
Figure 3-19 Diagram configuration of the concept model for microgrid in Navajo nation
tribal healthcare facilities
3.5.1 Code compliance
For healthcare facilities where failure of the electrical equipment to perform could
result in loss of human life and safety, the Emergency Power Supply Systems (EPSSs)
are required and classified as level one (1). The NFPA 99 handbook explains, “It should
be clearly noted that there must always be at least two independent power sources, and
at least one of them must be located on-site” (6.4.1) [14]. NFPA 99 states that “dual
sources of normal power shall be considered but shall not constitute an alternate source
of power as described in this chapter” (6.4.1.1.1). Function of the ATSs is to make the
normal power source independent from the alternate source. Hence, the microgrid for
healthcare facilities is a hybrid model of traditional microgrid with distributed energy
resources (DER) combined with code required reliable alternate power sources. At least
three emergency generators with appropriate capacity are indicated in order to improve
reliability of the alternate power source.

71
3.5.2 Improved Power Quality
The application of the static transfer switch (STS) depends on the sizing and
capacity of the combined DER. Whenever the combined DER can supply enough power
to meet 100% of the healthcare facility electrical loads, the static transfer switch will
operate in case of a power disruption or poor quality of NTUA. In such cases, DER will
provide redundancy to NTUA and the microgrid will enhance the power quality and
continuous operation of equipment. The STS function can be combined with load
shedding and proper operation of the inverter to prioritize the microgrid over the alternate
source. In remote locations where there is no access to the NTUA or the cost of
accessing the NTUA is prohibited, a prime power generator will replace the blocks of
NTUA and distribution transformer and the static transfer switch will not be necessary.
By providing adequate capacity of DER combined with energy storage, the
system will have a smooth transition from NTUA power disruption to islanded mode to
alternate power source connection by means of bypass isolation ATSs.
3.5.3 Low harmonic system
The effects of any harmonic currents on neutral conductors and equipment is a
very important factor required to be considered in the design of the distribution system
(NFPA 99, 6.4.1.1.1.2) [14]. A zigzag transformer is connected through a breaker to the
normal power switchgear bus bar. In addition, an active harmonic filter for fifth and
seventh components is connected to the load side of the equipment branch ATS. It is
necessary to coordinate proper sizing and capacity of the harmonic filter and zigzag
transformer. Low harmonic systems result in the design of optimum power system,
reduce unnecessary equipment oversizing, and produce energy savings.

72
3.5.4 Renewable energy
Solar PV systems and Wind turbine systems are considered in the concept
model for the Navajo Nation. Wind turbine technology is optional and is evaluated on a
case-by-case basis, since feasibility depends on the natural resources available at the
project location. Solar PV systems are applicable in most cases in the Navajo Nation.
The energy storage component will stabilize the power supplied by the DER. This is an
optional feature based on the DES goals for system performance and budget constraints
for the specific project. Renewable energy technologies will produce energy savings and
reduce environmental pollution.
3.5.5 Modular design
The normal power switchgear shall include spaces and/or spare breakers to
connect additional modules of DER in the future. String inverters are used especially
when the PV panels are located in parking carport roof or far from the electrical room.
Due to the smaller size of the String inverters, they are distributed through intermediate
electrical panels connected to the normal power switchgear. Smart inverters with virtual
oscillator control technology will respond faster to sudden load fluctuations [15]. The
microgrid controller will ensure peak performance, stability, reliability and flexibility for
future upgrades of the microgrid.
3.5 Chapter 3 Conclusion
The optimum case for solar irradiance is the summer/sunny day. Solar irradiance
is reduced by 12% due to clouds during the summer, while during a winter/snowy day is
reduced by 49%. Historical data (2010) from the NREL shows a decrease of 34% in solar

73
irradiance when comparing summer vs. winter during the same period. The average
maximum power output of the PV system is reduced by 30% during wintertime with
respect to summertime. Nevertheless, the load demand of Kayenta HC during wintertime
is reduced by 35%. The mean capacity factor is a useful number for planning of PV
system resources.
Additional research is necessary for a detailed study about STS function
combined with load shedding and proper operation of the inverter to prioritize the
microgrid over the alternate source. The inverter system needs to comply with IEEE 1547
and NEC 690.61 and de-energizes when there is an outage from the utility. Nevertheless,
the STS operates very fast compared to the system ATSs and proper device coordination
is necessary.
Fifth and seventh harmonic filters for the phase currents and zigzag transformers
for triplen harmonics in the neutral currents will solve most of the harmonic problems and
will ensure harmonic currents to be within current distortion limits established in IEEE
Standard 519-2014. In Kayenta (or proposed similar facility within the Navajo Nation), the
better location for the zigzag transformer is in the load side of ATS-EQ1G. In addition,
some energy savings can be achieved by reducing the harmonic currents. Modeling and
simulation of fifth and seven harmonic filters demonstrated a feasible solution for this
condition, which is typical for tribal healthcare facilities.
A concept model of microgrid for tribal healthcare facilities in the Navajo nation
was developed. The model is a power system modular design with improved power
quality, low harmonic system, code compliance and wide use of renewable energy. The
concept model contains the necessary features in order to develop a business proposal
with different options.

74
Proposal for Dilkon health center in the Navajo Nation based on Microgrid concept model
4.1 Executive Summary
The U.S. Department of Energy’s (DOE’s) Office of Electricity Delivery and
Energy Reliability defines a “microgrid” as a group of “interconnected loads and
distributed energy resources within clearly defined electrical boundaries that acts as a
single controllable entity with respect to the grid.” A microgrid can connect and
disconnect from the national power grid to enable it to operate in both grid-connected or
“island-mode”. The DOE has identified a number of benefits and challenges to
microgrids:
Microgrid Benefits
• Enables grid modernization
• Integrates multiple Smart Grid Technologies
• Enhances integration of distributed and renewable energy sources
• Meets end-user needs by ensuring energy supply for critical loads, controlling
power quality and reliability at the local level
• Promotes customer participation through demand side management
• Supports the microgrid by handling sensitive loads and supplying ancillary loads
to the bulk power system
Microgrid Technical Challenges
• Reliable Operations and Control
• Energy Storage
• Component Designs and Compatibility
• Analytical Tools

75
• Reliability
• Communications
Because of the demonstrated benefits, the Indian Health Service (IHS) has been
exploring all aspects of the microgrid concept for use at its new healthcare facilities,
including ways to overcome the technical challenges cited above. The IHS’ Division of
Engineering Services (DES) has been gathering experimental data from existing
photovoltaic (PV) systems, solar radiation, and electrical power systems at Kayenta
Healthcare Center and Alternative Rural Hospital in Arizona.
The findings from this on-going research process have been assembled into a series
of three (3) technical documents that are discussed in this proposal, and the data
obtained from the Kayenta facility is summarized herein and utilized to predict
performance of the anticipated power systems at a new IHS facility to be constructed for
the Navajo Nation in Dilkon, Arizona (about to commence under design). As this proposal
discusses, the ultimate goal of the IHS is to utilize microgrid technology to improve the
electrical power quality at all new IHS healthcare facilities, as well as to explore and
maximize the use of renewable energy resources to achieve energy savings.
Multiple options and sub-options were analyzed and compared based on benefit
versus cost. The Expanded solar PV system (500 kW) with the battery bank of
500kW/200kWh (Option III.b in Table 4-6) is recommended as the best alternative for a
combination of energy savings and power quality solutions versus the necessary
investment. This system requires an initial investment of $1,929,890.
4.2 Background
The Indian Health Service (IHS) has been actively researching the microgrid concept
using experimental data gathered from the existing photovoltaic (PV) system, solar

76
radiation and electrical power system and equipment at the Kayenta Health Center (HC).
The research process was documented in a sequence of three (3) papers as stated
below,
1. Challenges and Opportunities: Microgrid Modular Design for Tribal Healthcare
Facilities
a) Presented in North American Power Symposium (conference), Denver CO,
Sept 18-20, 2016.
b) Published in IEEE Xplore Digital Library, November 21, 2016.
2. Microgrid Modular Design for Tribal Healthcare Facilities: Kayenta Health Center
PV system case study
a) Presented in Industrial & Commercial Power System Conference, Niagara
Falls, Ontario, CA, May 8-11, 2017.
b) Published in IEEE Xplore Digital Library, June 12, 2017.
3. Microgrid Modular Design for Tribal Healthcare Facilities: Kayenta Health Center
used as guidance for concept model for Navajo Nation
a) Presented in Industrial Applications Society Annual Meeting 2017, Cincinnati,
OH, October 2-5, 2017.
b) Published in IEEE Xplore Digital Library, November 09, 2017.
The research process provided valuable insight about the concept, advantages,
challenges, feasibility, and requirements for the implementation of microgrid technology
in IHS healthcare facilities and/or staff quarters. The experimental results discovered
useful data related to the behavior of the PV system as well as the power system of a
typical healthcare facility located within the Navajo Nation. Since the research was
targeted to the Navajo Nation, the Dilkon HC is selected as the first facility to be
considered for microgrid implementation. Dilkon happens to be located 87 miles east of

77
Flagstaff. Flagstaff was the nearest city that contains historical data from the National
Renewable Energy Lab (NREL) used for comparison with actual experimental data
recorded at Kayenta HC. Dilkon latitude (35.385° N) is almost the same as Flagstaff
(35.2° N), which provides a good correlation for the solar irradiation resources data.
The Kayenta HC and Ft. Yuma HC (currently under construction) provides some
insight about the sizing of the power and the renewable energy systems for the Dilkon
HC. The Kayenta HC was the subject study for experimental research documented in
the three papers noted above. The Ft. Yuma HC is being built with a significant solar
power system in an effort to get closer to the net zero energy building concept. Table 4-1
shows size comparison for the three (3) facilities. The Kayenta HC actual emergency
load was 30.8% of the design load, while the normal power load (emergency plus
remaining) was around 19.8% of the design load.
Table 4-1 Size comparison of existing facilities with Dilkon HC
Facility Kayenta HC Ft. Yuma HC Dilkon HC Size (GSM) 16,878 7,088 14,307
Normal power load (KVA)
3,530 (700 actual exp.)
1,594
1,575
Emergency load (KVA)
1,623 (500 actual exp.)
PV system (KW) 100 300 TBD
Source
Actual design
Actual design
Site selection and evaluation report (August 2016), DHC RFP 4-25-
2017
4.3 Purpose
The purpose of this proposal is to explore the feasibility and cost effectiveness of
implementing microgrid technology in an IHS healthcare facility. The microgrid

78
technology is intended to improve the electrical power system of the healthcare facility in
terms of power quality, renewable energy resources, and energy savings. The proposal
will provide reliable information related to the research foundation, the process, the
options, and the associated costs for implementation. The information provided shall
facilitate the decision making of IHS management (and/or Tribal authorities) and the
acquisition process for an improved power system in the healthcare facility. This proposal
will extrapolate data from the Kayenta HC power system to predict performance of the
expected power system at the Dilkon HC and suggest different options for improvement.
Based on information from the research, an optimum power system design is proposed
for the Dilkon HC in lieu of a traditional power system design (similar to the Kayenta HC)
which requires overrating of electrical equipment and thereby increasing construction
cost.
The Dilkon HC design is being managed by the Winslow Indian Health Care
Center (WIHCC), as authorized by the Navajo Nation, under the Indian Self-
Determination and Education Assistance Act (Public Law 93-638, Title V Construction
Project Agreement TVCPA). This basically means that IHS disburses government funds
under the terms and conditions of the TVCPA, and the WIHCC uses the funds to manage
the design of the Dilkon healthcare facility. Hence, the information contained in this
proposal can be provided to WIHCC for their consideration to incorporate into the design
process. WIHCC will make the final decision whether or not to require their A/E firm to
apply any features of the microgrid technology or power system improvement
opportunity.

79
4.4 Renewable Energy Resources
Based on the research conducted, the renewable energy resources under
consideration for the application of the microgrid technology in the Navajo Nation are
solar photovoltaic and wind turbine power generation systems.
4.4.1 Review wind power feasibility
The NREL provides information about Wind Prospector locations, land-based
wind speed at 80m [1]. The Dilkon HC location results in an average wind speed range of
5-5.5 m/s at 80m (see Figure 4-1). Medium size turbine generators typically require a cut-
off in wind speeds > 3 m/s (6.7 mph) and nominal wind speed of 9.5 m/s (21 mph) to 13
m/s (29 mph). The tower height specified for these wind turbines is typically 30m and up
to 48m for the larger sizes. In this location, the wind turbines would be generating an
average of 14% of rated power output under normal operating conditions.
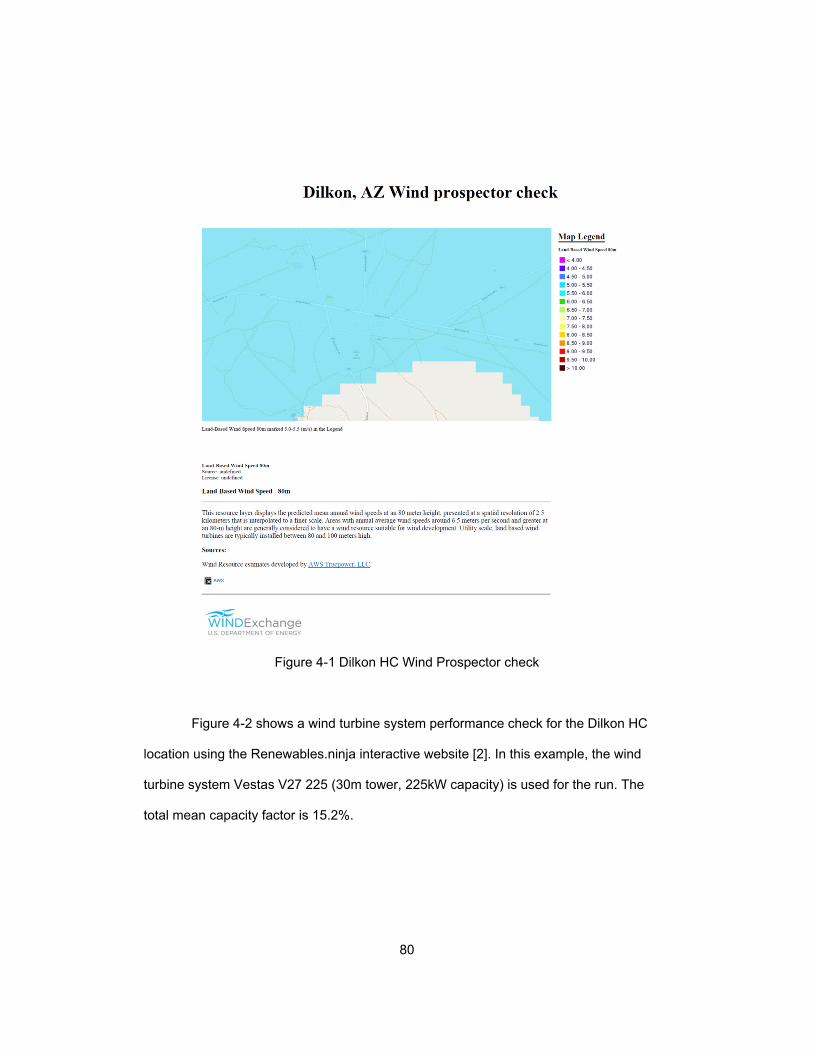
80
Figure 4-1 Dilkon HC Wind Prospector check
Figure 4-2 shows a wind turbine system performance check for the Dilkon HC
location using the Renewables.ninja interactive website [2]. In this example, the wind
turbine system Vestas V27 225 (30m tower, 225kW capacity) is used for the run. The
total mean capacity factor is 15.2%.
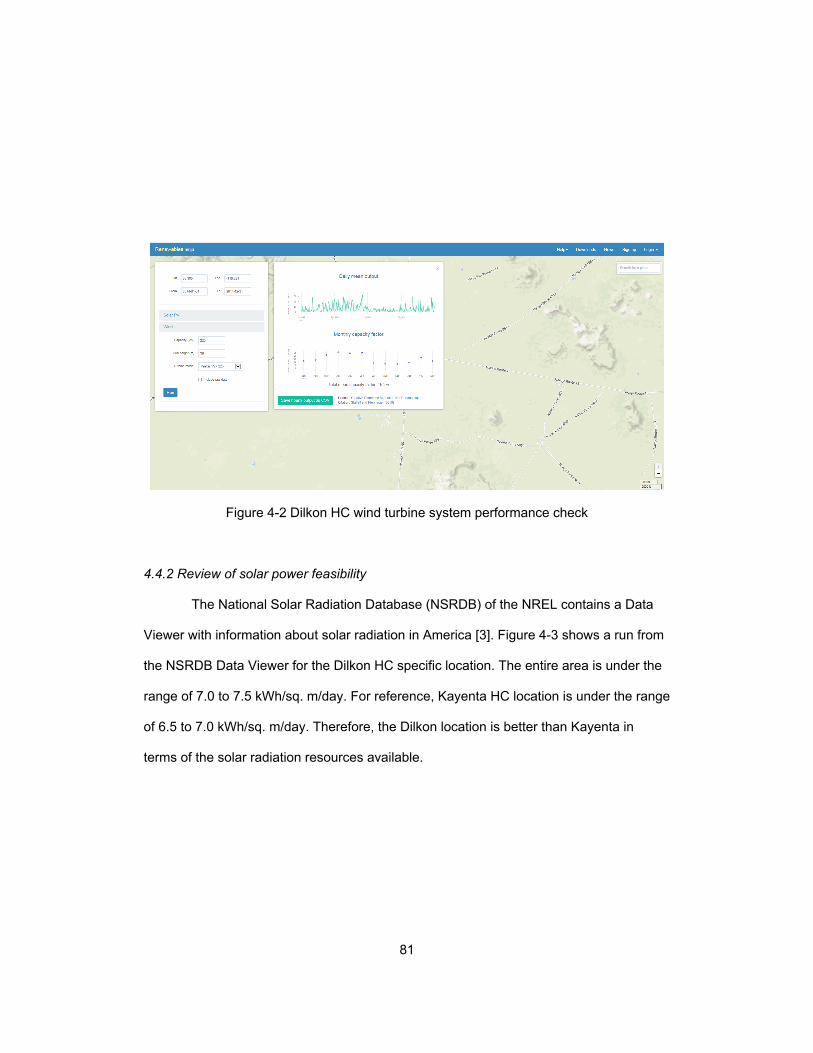
81
Figure 4-2 Dilkon HC wind turbine system performance check
4.4.2 Review of solar power feasibility
The National Solar Radiation Database (NSRDB) of the NREL contains a Data
Viewer with information about solar radiation in America [3]. Figure 4-3 shows a run from
the NSRDB Data Viewer for the Dilkon HC specific location. The entire area is under the
range of 7.0 to 7.5 kWh/sq. m/day. For reference, Kayenta HC location is under the range
of 6.5 to 7.0 kWh/sq. m/day. Therefore, the Dilkon location is better than Kayenta in
terms of the solar radiation resources available.

82
Figure 4-3 Dilkon HC location solar irradiance resources check
Figure 4-4 shows a PV system performance check for the Dilkon HC location
using the Renewables.ninja interactive website [4]. In this example, a PV system is
selected with 4% system loss, 10 degrees tilt, 180 degrees azimuth and 225kW capacity
for the run. The total mean capacity factor is 22.2%. Notice that the performance of the
PV system is higher than that of the wind turbine system.
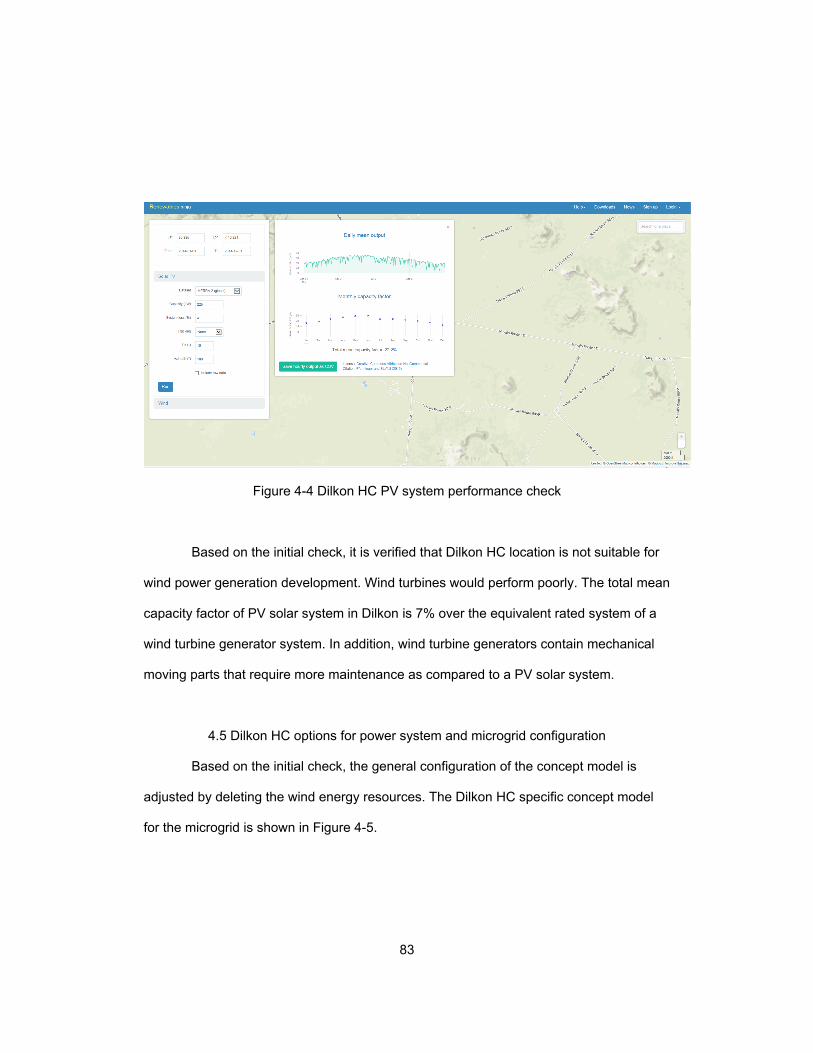
83
Figure 4-4 Dilkon HC PV system performance check
Based on the initial check, it is verified that Dilkon HC location is not suitable for
wind power generation development. Wind turbines would perform poorly. The total mean
capacity factor of PV solar system in Dilkon is 7% over the equivalent rated system of a
wind turbine generator system. In addition, wind turbine generators contain mechanical
moving parts that require more maintenance as compared to a PV solar system.
4.5 Dilkon HC options for power system and microgrid configuration
Based on the initial check, the general configuration of the concept model is
adjusted by deleting the wind energy resources. The Dilkon HC specific concept model
for the microgrid is shown in Figure 4-5.
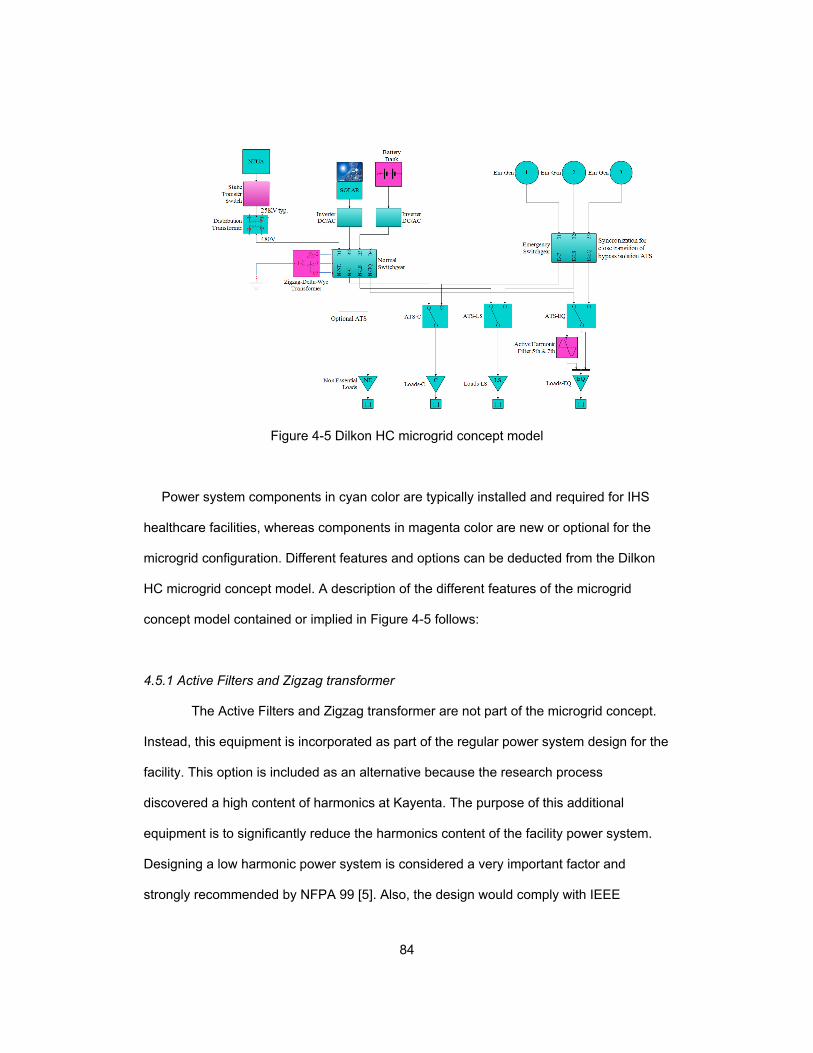
84
Figure 4-5 Dilkon HC microgrid concept model
Power system components in cyan color are typically installed and required for IHS
healthcare facilities, whereas components in magenta color are new or optional for the
microgrid configuration. Different features and options can be deducted from the Dilkon
HC microgrid concept model. A description of the different features of the microgrid
concept model contained or implied in Figure 4-5 follows:
4.5.1 Active Filters and Zigzag transformer
The Active Filters and Zigzag transformer are not part of the microgrid concept.
Instead, this equipment is incorporated as part of the regular power system design for the
facility. This option is included as an alternative because the research process
discovered a high content of harmonics at Kayenta. The purpose of this additional
equipment is to significantly reduce the harmonics content of the facility power system.
Designing a low harmonic power system is considered a very important factor and
strongly recommended by NFPA 99 [5]. Also, the design would comply with IEEE

85
standard 519-2014 regarding the current distortion limits [6]. Another advantage includes
some energy savings.
The extra equipment implies additional costs. However, it can be used as a strategy
for optimizing the power system design instead of the traditional over-sizing of equipment
as was the case in the Kayenta HC.
4.5.2 Augmented PV system
The augmented PV system can significantly contribute to the next generation of
goals for IHS healthcare facilities enhancing the ability to achieve LEED Platinum
certification, net zero energy, and carbon neutrality. The solar PV system array can
qualify for incentives and assistance as the DOE Office of Indian Energy directs efforts
toward grants and programs that assist tribes in the implementation of energy
development which include hospitals. Solar PV systems are used normally for new
healthcare facilities in the zone as part of the efforts to reach energy saving goals. The
latest IHS project, Ft. Yuma (currently under construction), includes a 300KW PV system
with string inverters localized close to the PV module arrays on the parking carports and
on the roof.
This option contemplates the provision of additional capacity for the PV system that
can produce net zero energy at the Dilkon HC as opposed to the IHS requirement of
7.5% of the annual energy load. In simple terms, it adds more PV modules to increase
the renewable energy capacity and evaluate the additional costs and energy savings. If
the main focus goes toward power quality improvement, this option can be combined with
the energy storage system option. In such a case the PV system can be derated
accordingly.

86
4.5.3 Energy storage system (battery bank)
The energy storage system is a preferred feature in cases where the power
quality of the electrical system is poor, common to remote locations like Kayenta and
Dilkon. It is possible to use the battery bank for loads that must run without interruption,
such as critical systems and equipment in the healthcare facility. The battery bank can be
combined with a static transfer switch, solar PV system, and a microgrid controller if it is
desired to be able to operate the microgrid in islanded mode for improvement of power
quality purposes. It is difficult to assess the value of power quality in monetary terms, but
the power system must be reliable for healthcare facilities where failure of the electrical
equipment to perform could result in harm and loss of human life.
Another option is to combine the battery bank and charge controller with the PV
system. Experimental results at the Kayenta HC demonstrated that none of the voltage
sag, swell and interruptions (VSSI) events occurred during night shift. Also, the load was
significantly lower during night shift. Hence, the battery bank combined with the PV
system can target power quality issues.
However, solar PV systems have a much higher return on investment when batteries
are omitted. The battery bank, static transfer switch, and microgrid controller (or charge
controller) increase the initial investment and O&M expenses considerably.
4.5.4 Microgrid Controller
The microgrid controller is not directly illustrated in Figure 4-5, but it is the brain that
allows all different components of the microgrid to interact with each other and function
effectively and efficiently. The microgrid controller is designed to manage, automate,
communicate, and control the distributed power generation plant and loads that use
renewable and non-renewable energy resources. The PV control and monitoring feature
87
provides information about the status of the PV array and is able to schedule and control
the amount of power it is producing. Features of the microgrid controller are more cost
effective in applications with diversified energy sources. The microgrid controller adds
cost to the system.
4.5.5 Static Transfer Switch
Voltage sag, swell, and interruption (VSSI) are undesired power quality
disruptions or events that in most instances can be prevented by the use of a Static
Transfer Switch (STS). The STS provides superior switching time such that if one power
source fails, the STS switches to the back-up power source so quickly that the load never
recognizes the transfer made. This equipment uses solid-state power electronics
technology. In this case, the STS feature needs to be combined with enough capacity of
power in islanded mode operation. The capacity would come from energy storage
(battery bank), solar renewable energy, or combination of both. In this option the islanded
mode operation would be just a transition mode for the configuration shown in Figure 4-5,
since code compliance (NFPA 99) requires an alternate independent power source [5]. If
the system is properly designed, the transition islanded mode combined with the
alternate independent power source will reduce power quality disruptions close to zero.
The main drawback about this option is the additional cost of the equipment for the
islanded mode operation.
For healthcare facilities with power supplied from an alternate feeder from a
different substation transformer, the advantage of fast switching of an STS to an alternate
feeder will solve many of the power quality disruptions. In such cases, the STS option by
itself represents a cost effective solution.

88
4.5.6 Combination of different features
A combination of different features can be proposed for the Dilkon HC design
project in order to get the best value regarding the power system implementation. The
five (5) different features listed above can be combined to produce different options that
can be implemented (see Table 4-2). These options can be evaluated in terms of the
expected benefit versus cost implications for the project. The cost analysis will be based
mainly on optimum power system design instead of traditional oversizing of equipment.
Notice that optimum power system design is not the same as Value Engineering (VE) or
a reduction in scope during the acquisition process.
Table 4-2 Combination of features to form different options for power system - Dilkon HC
Features Option Advantages Disadvantages
1. Active Filters and Zigzag Transformer
I
• Reduce harmonics • Low cost compared to other options
• Very low energy savings • Additional equipment in system - requires maintenance • No immediate response for VSSI
2. Augmented PV System
II
• High energy savings • Supports LEED Gold certification • Carbon neutrality, environmental friendly • PV modules low maintenance (clean up twice per year).
• Increase cost/investment • Additional equipment requires some maintenance. • Foot print availability is a design constraint • No immediate response for VSSI
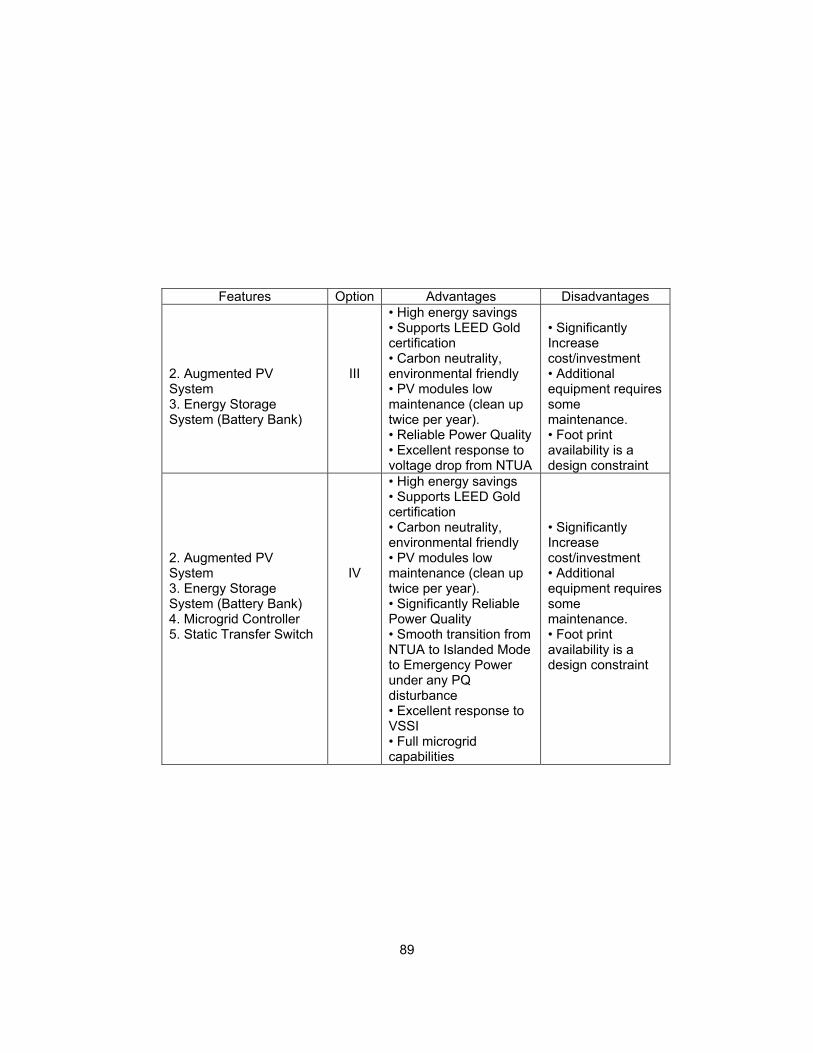
89
Features Option Advantages Disadvantages 2. Augmented PV System 3. Energy Storage System (Battery Bank)
III
• High energy savings • Supports LEED Gold certification • Carbon neutrality, environmental friendly • PV modules low maintenance (clean up twice per year). • Reliable Power Quality • Excellent response to voltage drop from NTUA
• Significantly Increase cost/investment • Additional equipment requires some maintenance. • Foot print availability is a design constraint
2. Augmented PV System 3. Energy Storage System (Battery Bank) 4. Microgrid Controller 5. Static Transfer Switch
IV
• High energy savings • Supports LEED Gold certification • Carbon neutrality, environmental friendly • PV modules low maintenance (clean up twice per year). • Significantly Reliable Power Quality • Smooth transition from NTUA to Islanded Mode to Emergency Power under any PQ disturbance • Excellent response to VSSI • Full microgrid capabilities
• Significantly Increase cost/investment • Additional equipment requires some maintenance. • Foot print availability is a design constraint
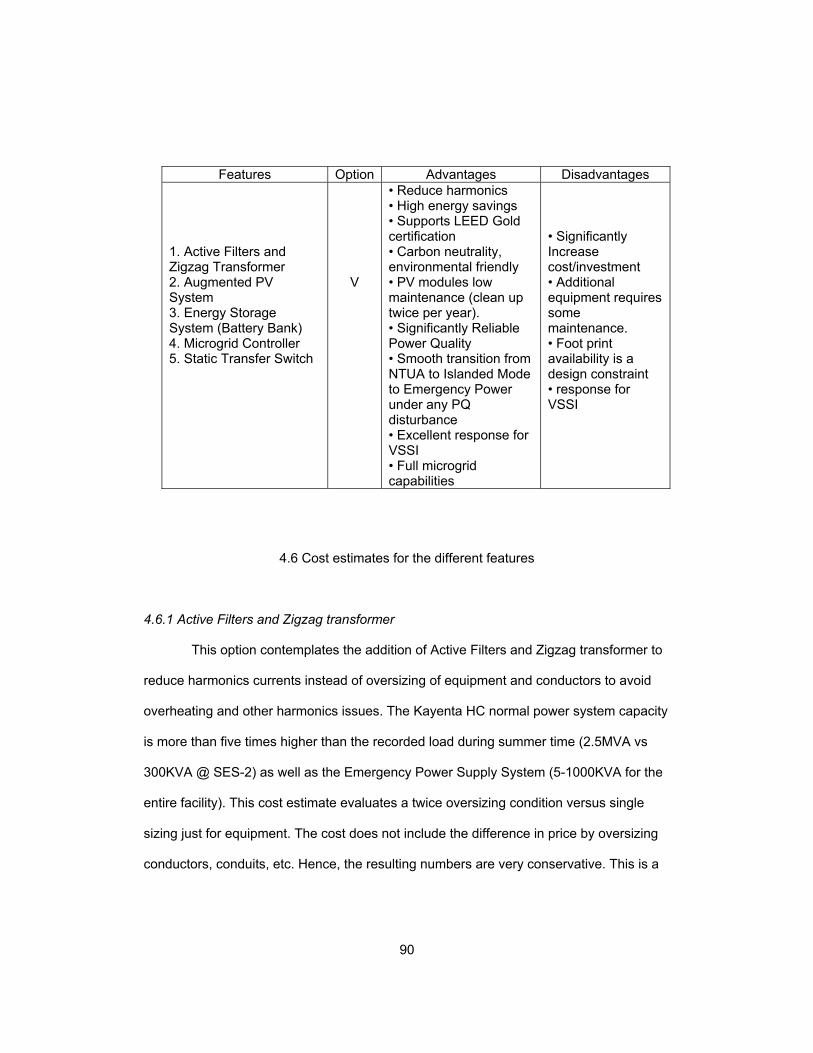
90
Features Option Advantages Disadvantages 1. Active Filters and Zigzag Transformer 2. Augmented PV System 3. Energy Storage System (Battery Bank) 4. Microgrid Controller 5. Static Transfer Switch
V
• Reduce harmonics • High energy savings • Supports LEED Gold certification • Carbon neutrality, environmental friendly • PV modules low maintenance (clean up twice per year). • Significantly Reliable Power Quality • Smooth transition from NTUA to Islanded Mode to Emergency Power under any PQ disturbance • Excellent response for VSSI • Full microgrid capabilities
• Significantly Increase cost/investment • Additional equipment requires some maintenance. • Foot print availability is a design constraint • response for VSSI
4.6 Cost estimates for the different features
4.6.1 Active Filters and Zigzag transformer
This option contemplates the addition of Active Filters and Zigzag transformer to
reduce harmonics currents instead of oversizing of equipment and conductors to avoid
overheating and other harmonics issues. The Kayenta HC normal power system capacity
is more than five times higher than the recorded load during summer time (2.5MVA vs
300KVA @ SES-2) as well as the Emergency Power Supply System (5-1000KVA for the
entire facility). This cost estimate evaluates a twice oversizing condition versus single
sizing just for equipment. The cost does not include the difference in price by oversizing
conductors, conduits, etc. Hence, the resulting numbers are very conservative. This is a
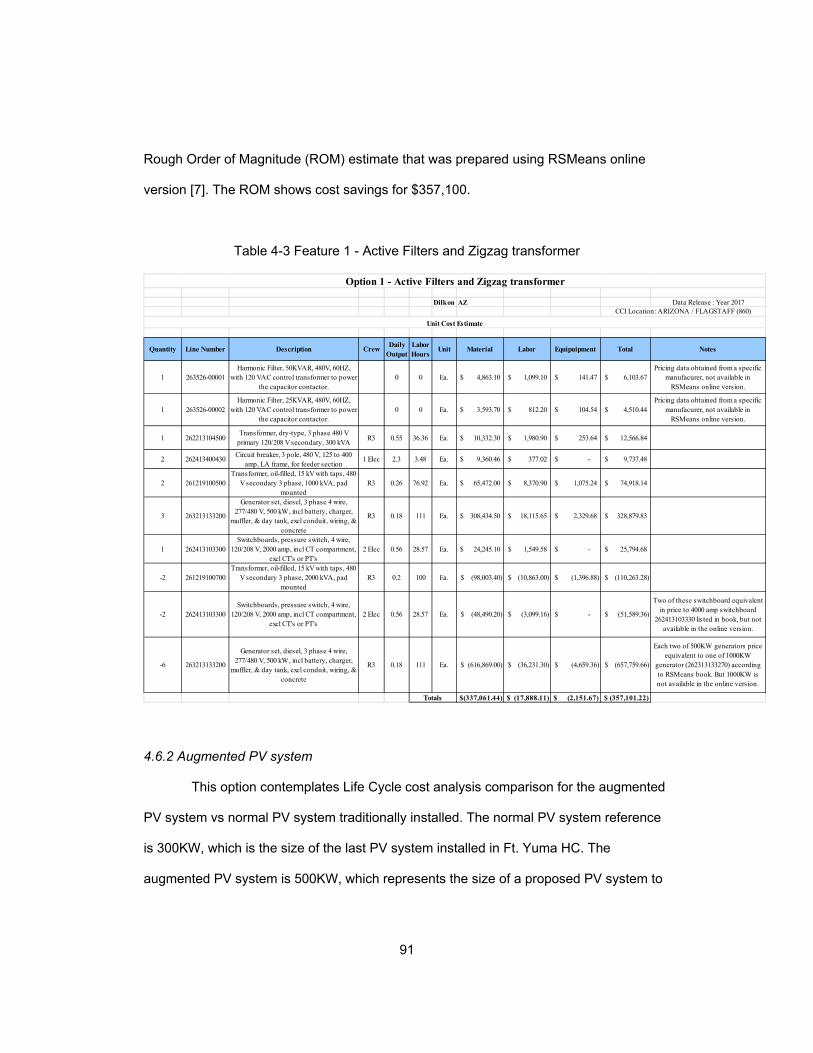
91
Rough Order of Magnitude (ROM) estimate that was prepared using RSMeans online
version [7]. The ROM shows cost savings for $357,100.
Table 4-3 Feature 1 - Active Filters and Zigzag transformer
4.6.2 Augmented PV system
This option contemplates Life Cycle cost analysis comparison for the augmented
PV system vs normal PV system traditionally installed. The normal PV system reference
is 300KW, which is the size of the last PV system installed in Ft. Yuma HC. The
augmented PV system is 500KW, which represents the size of a proposed PV system to
Dilkon AZ Data Release : Year 2017
Quantity Line Number Description Crew Daily
Output Labor Hours
Unit Material Labor Equipuipment Total Notes
1 263526-00001Harmonic Filter, 50KVAR, 480V, 60HZ,
with 120 VAC control transformer to power the capacitor contactor.
0 0 Ea. 4,863.10$ 1,099.10$ 141.47$ 6,103.67$ Pricing data obtained from a specific
manufacurer, not available in RSMeans online version.
1 263526-00002Harmonic Filter, 25KVAR, 480V, 60HZ,
with 120 VAC control transformer to power the capacitor contactor.
0 0 Ea. 3,593.70$ 812.20$ 104.54$ 4,510.44$ Pricing data obtained from a specific
manufacurer, not available in RSMeans online version.
1 262213104500Transformer, dry-type, 3 phase 480 V
primary 120/208 V secondary, 300 kVAR3 0.55 36.36 Ea. 10,332.30$ 1,980.90$ 253.64$ 12,566.84$
2 262413400430Circuit breaker, 3 pole, 480 V, 125 to 400
amp, LA frame, for feeder section1 Elec 2.3 3.48 Ea. 9,360.46$ 377.02$ -$ 9,737.48$
2 261219100500Transformer, oil-filled, 15 kV with taps, 480
V secondary 3 phase, 1000 kVA, pad mounted
R3 0.26 76.92 Ea. 65,472.00$ 8,370.90$ 1,075.24$ 74,918.14$
3 263213133200
Generator set, diesel, 3 phase 4 wire, 277/480 V, 500 kW, incl battery, charger,
muffler, & day tank, excl conduit, wiring, & concrete
R3 0.18 111 Ea. 308,434.50$ 18,115.65$ 2,329.68$ 328,879.83$
1 262413103300Switchboards, pressure switch, 4 wire,
120/208 V, 2000 amp, incl CT compartment, excl CT's or PT's
2 Elec 0.56 28.57 Ea. 24,245.10$ 1,549.58$ -$ 25,794.68$
-2 261219100700Transformer, oil-filled, 15 kV with taps, 480
V secondary 3 phase, 2000 kVA, pad mounted
R3 0.2 100 Ea. (98,003.40)$ (10,863.00)$ (1,396.88)$ (110,263.28)$
-2 262413103300Switchboards, pressure switch, 4 wire,
120/208 V, 2000 amp, incl CT compartment, excl CT's or PT's
2 Elec 0.56 28.57 Ea. (48,490.20)$ (3,099.16)$ -$ (51,589.36)$
Two of these switchboard equivalent in price to 4000 amp switchboard
262413103330 listed in book, but not available in the online version.
-6 263213133200
Generator set, diesel, 3 phase 4 wire, 277/480 V, 500 kW, incl battery, charger,
muffler, & day tank, excl conduit, wiring, & concrete
R3 0.18 111 Ea. (616,869.00)$ (36,231.30)$ (4,659.36)$ (657,759.66)$
Each two of 500KW generators price equivalent to one of 1000KW
generator (262313133270) according to RSMeans book. But 1000KW is not available in the online version.
$(337,061.44) $ (17,888.11) $ (2,151.67) $ (357,101.22)
Option 1 - Active Filters and Zigzag transformer
CCI Location: ARIZONA / FLAGSTAFF (860)
Unit Cost Estimate
Totals

92
reach almost net zero energy consumption and support the achievement of LEED Gold
certification.
A run in PVWatts® calculator from NREL shows total energy savings of 895,424
kWh per year, which is equivalent to $95,184.00 (see Figure 4-6) [8]. It also shows the
energy savings and energy value by month. Notice that the closest location to Dilkon
available in PVWatts® is Flagstaff and a capacity factor of 20.4% is used. For this run,
$0.11 per kWh are used, which is consistent with the energy price as stated in NTUA
website [9].
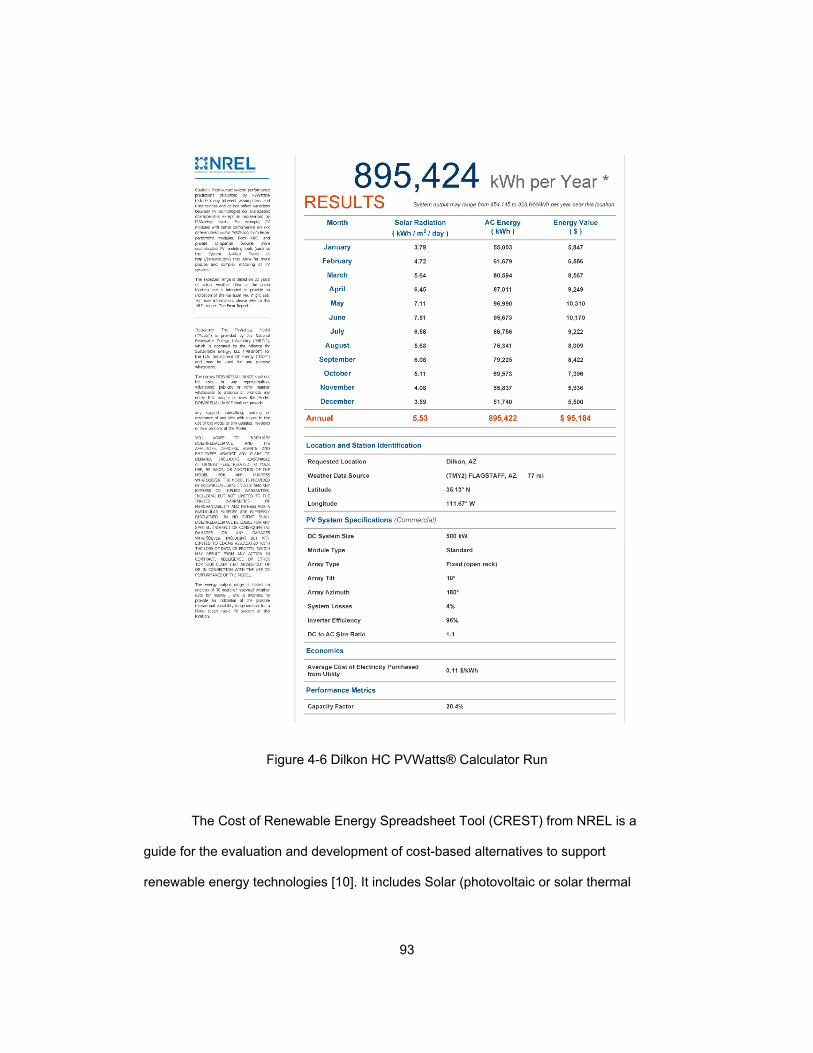
93
Figure 4-6 Dilkon HC PVWatts® Calculator Run
The Cost of Renewable Energy Spreadsheet Tool (CREST) from NREL is a
guide for the evaluation and development of cost-based alternatives to support
renewable energy technologies [10]. It includes Solar (photovoltaic or solar thermal

94
electric), Wind, Geothermal, Anaerobic Digestion and Fuel Cell. Table 4 shows results for
the expanded PV system and other sub-options at Dilkon HC using CREST. Notice that
net capacity factor (19.4%) is based on the state average, which is lower than the
capacity factor at Dilkon (22.2% from Renewables.Ninja). Therefore, the numbers
obtained are conservative for the PV solar sub-options. However, a capacity factor of
15.2% is included for the Wind Turbine sub-option, which is the same as determined from
Renewables.Ninja (Figure 4-2).
Calculations with the Spreadsheet compare five (5) different sub-options:
• Super Expanded (SE) PV System (750kW),
• Expanded PV (E) System (500kW),
• Normal PV (N) System (300kW),
• Low Value PV (LV) System (100kW), and
• Wind Turbine (WT) System.
The Expanded PV System sub-option shows an energy production of 847,567
kWh per year, Table 4 below are $2,700,000, $1,800,000, $1,080,000, $360,000 and
$1,250,000 for the Super Expanded PV (SE), Expanded PV (E), Normal PV (N), Low
Value PV (LV) and Wind Turbine (WT) Systems respectively. The project useful life is 25
years and the paid off period is 18 years for each PV sub-option. The WT sub-option
project useful life is 20 years and the paid off period is 15 years. The Net Nominal
Levelized Cost of Energy (NLCE) is reduced if increasing the PV System capacity. By
combining option 2 with optimum system design instead of traditional overdesign, the net
investment is reduced to $2,309,980, $1,409,980, $689,980, $-30,020 and $859,980 for
the SE, E, N and LV and WT Systems respectively (see Table 4-4 below).
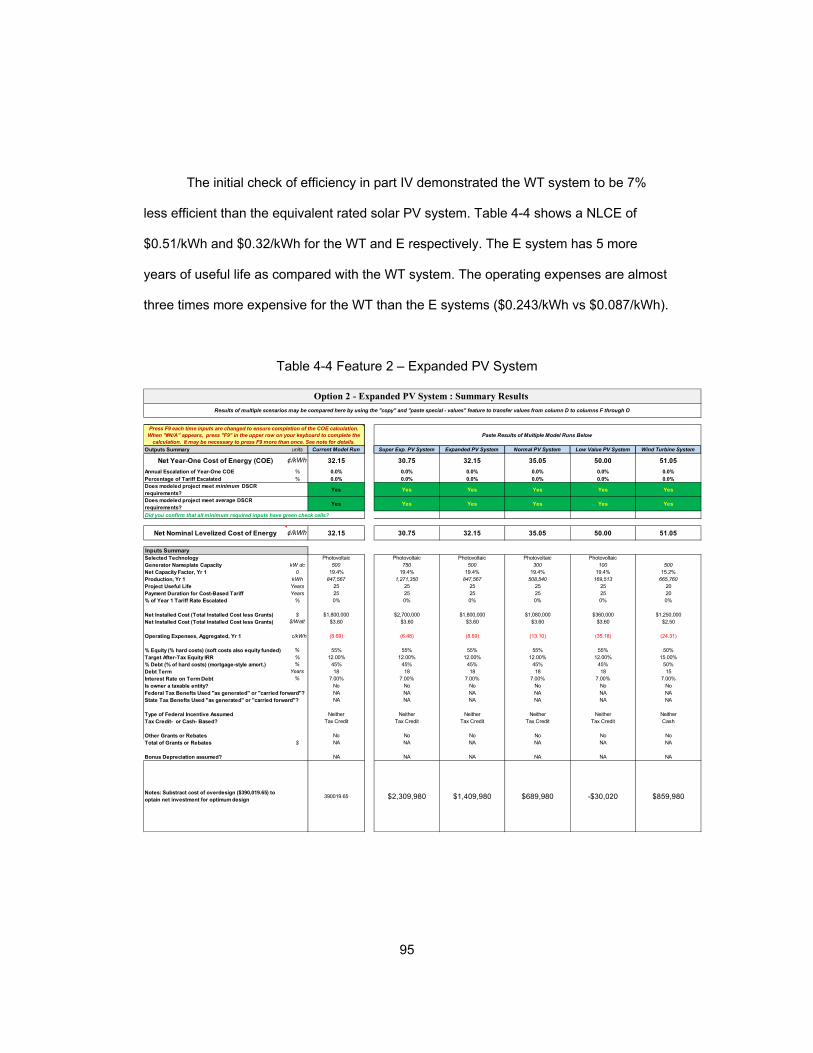
95
The initial check of efficiency in part IV demonstrated the WT system to be 7%
less efficient than the equivalent rated solar PV system. Table 4-4 shows a NLCE of
$0.51/kWh and $0.32/kWh for the WT and E respectively. The E system has 5 more
years of useful life as compared with the WT system. The operating expenses are almost
three times more expensive for the WT than the E systems ($0.243/kWh vs $0.087/kWh).
Table 4-4 Feature 2 – Expanded PV System
Outputs Summary units Current Model Run Super Exp. PV System Expanded PV System Normal PV System Low Value PV System Wind Turbine System
Net Year-One Cost of Energy (COE) ¢/kWh 32.15 30.75 32.15 35.05 50.00 51.05
Annual Escalation of Year-One COE % 0.0% 0.0% 0.0% 0.0% 0.0% 0.0%Percentage of Tariff Escalated % 0.0% 0.0% 0.0% 0.0% 0.0% 0.0%Does modeled project meet minimum DSCR requirements?
Yes Yes Yes Yes Yes Yes
Does modeled project meet average DSCR requirements?
Yes Yes Yes Yes Yes Yes
Did you confirm that all minimum required inputs have green check cells?
Net Nominal Levelized Cost of Energy ¢/kWh 32.15 30.75 32.15 35.05 50.00 51.05
Inputs SummarySelected Technology Photovoltaic Photovoltaic Photovoltaic Photovoltaic PhotovoltaicGenerator Nameplate Capacity kW dc 500 750 500 300 100 500Net Capacity Factor, Yr 1 0 19.4% 19.4% 19.4% 19.4% 19.4% 15.2%Production, Yr 1 kWh 847,567 1,271,350 847,567 508,540 169,513 665,760Project Useful Life Years 25 25 25 25 25 20Payment Duration for Cost-Based Tariff Years 25 25 25 25 25 20% of Year 1 Tariff Rate Escalated % 0% 0% 0% 0% 0% 0%
Net Installed Cost (Total Installed Cost less Grants) $ $1,800,000 $2,700,000 $1,800,000 $1,080,000 $360,000 $1,250,000Net Installed Cost (Total Installed Cost less Grants) $/Watt $3.60 $3.60 $3.60 $3.60 $3.60 $2.50
Operating Expenses, Aggregated, Yr 1 ¢/kWh (8.69) (6.48) (8.69) (13.10) (35.18) (24.31)
% Equity (% hard costs) (soft costs also equity funded) % 55% 55% 55% 55% 55% 50%Target After-Tax Equity IRR % 12.00% 12.00% 12.00% 12.00% 12.00% 15.00%% Debt (% of hard costs) (mortgage-style amort.) % 45% 45% 45% 45% 45% 50%Debt Term Years 18 18 18 18 18 15Interest Rate on Term Debt % 7.00% 7.00% 7.00% 7.00% 7.00% 7.00%Is owner a taxable entity? No No No No No NoFederal Tax Benefts Used "as generated" or "carried forward"? NA NA NA NA NA NAState Tax Benefts Used "as generated" or "carried forward"? NA NA NA NA NA NA
Type of Federal Incentive Assumed Neither Neither Neither Neither Neither NeitherTax Credit- or Cash- Based? Tax Credit Tax Credit Tax Credit Tax Credit Tax Credit Cash
Other Grants or Rebates No No No No No NoTotal of Grants or Rebates $ NA NA NA NA NA NA
Bonus Depreciation assumed? NA NA NA NA NA NA
Notes: Substract cost of overdesign ($390,019.65) to optain net investment for optimum design
390019.65 $2,309,980 $1,409,980 $689,980 -$30,020 $859,980
Option 2 - Expanded PV System : Summary Results Results of multiple scenarios may be compared here by using the "copy" and "paste special - values" feature to transfer values from column D to columns F through O
Paste Results of Multiple Model Runs BelowPress F9 each time inputs are changed to ensure completion of the COE calculation. When "#N/A" appears, press "F9" in the upper row on your keyboard to complete the
calculation. It may be necessary to press F9 more than once. See note for details.
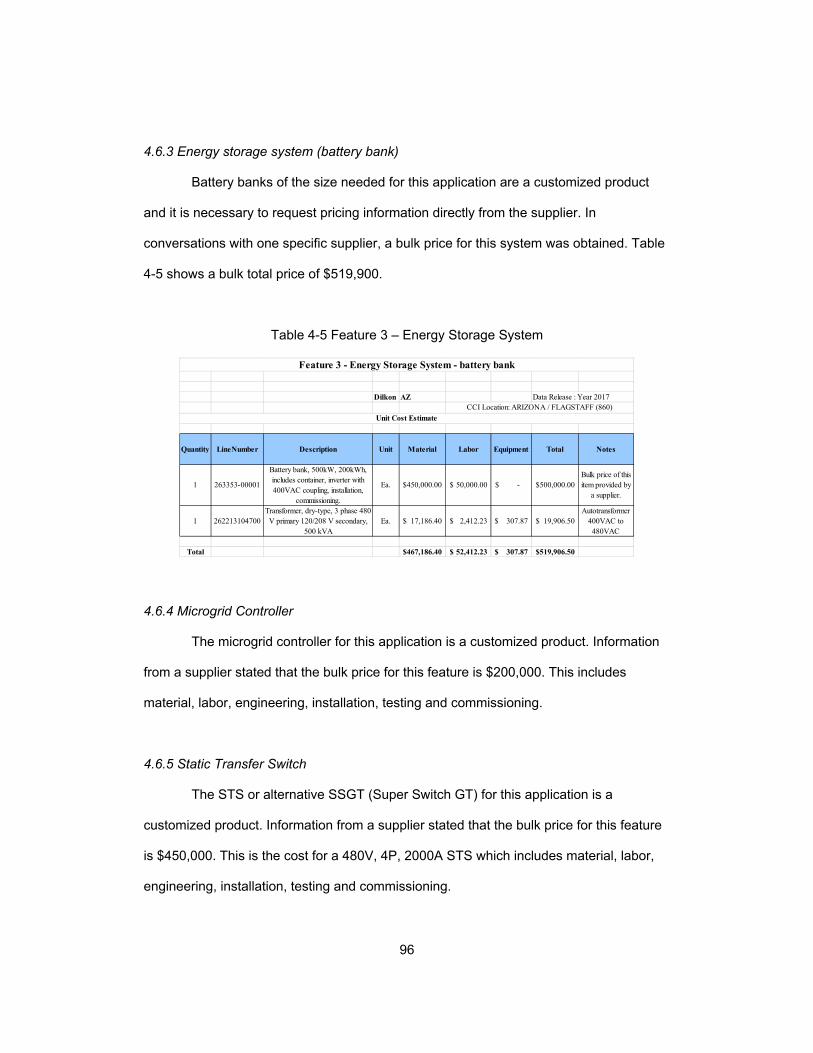
96
4.6.3 Energy storage system (battery bank)
Battery banks of the size needed for this application are a customized product
and it is necessary to request pricing information directly from the supplier. In
conversations with one specific supplier, a bulk price for this system was obtained. Table
4-5 shows a bulk total price of $519,900.
Table 4-5 Feature 3 – Energy Storage System
4.6.4 Microgrid Controller
The microgrid controller for this application is a customized product. Information
from a supplier stated that the bulk price for this feature is $200,000. This includes
material, labor, engineering, installation, testing and commissioning.
4.6.5 Static Transfer Switch
The STS or alternative SSGT (Super Switch GT) for this application is a
customized product. Information from a supplier stated that the bulk price for this feature
is $450,000. This is the cost for a 480V, 4P, 2000A STS which includes material, labor,
engineering, installation, testing and commissioning.
Dilkon AZ Data Release : Year 2017
Quantity LineNumber Description Unit Material Labor Equipment Total Notes
1 263353-00001
Battery bank, 500kW, 200kWh, includes container, inverter with 400VAC coupling, installation,
commissioning.
Ea. 450,000.00$ 50,000.00$ -$ 500,000.00$ Bulk price of this item provided by
a supplier.
1 262213104700Transformer, dry-type, 3 phase 480
V primary 120/208 V secondary, 500 kVA
Ea. 17,186.40$ 2,412.23$ 307.87$ 19,906.50$ Autotransformer
400VAC to 480VAC
Total 467,186.40$ 52,412.23$ 307.87$ 519,906.50$
CCI Location: ARIZONA / FLAGSTAFF (860)
Unit Cost Estimate
Feature 3 - Energy Storage System - battery bank

97
4.7 Analysis of Options
It was verified in 4.4 that the wind turbine alternative is not cost effective when
compared to the PV solar alternative at the Dilkon HC location. Also, there is a concern
about the maintenance costs and burden to be created for service unit personnel.
Different sub-options of PV solar and WT are compared in 4.6.2 (see Table 4-4). Table 4-
6 compares costs for the options listed in Table 4-2. A rank is included based on benefit
versus cost evaluation. Option I alone provides very little benefit in energy savings and
power quality solutions, so this is ranked as #5. Options IV and V include full microgrid
capabilities, but added significant cost for the STS and the microgrid controller (ranked #3
and #4). The feature of the microgrid controller is more cost effective in applications with
diversified distributed energy resources. Option III provides the best combination of
energy savings and power quality solutions versus the necessary investment and is
ranked as #1. Option II provides energy savings but does not directly address power
quality solutions and is ranked as #2. The solar PV 500kW system is selected as the best
one among the sub-options.
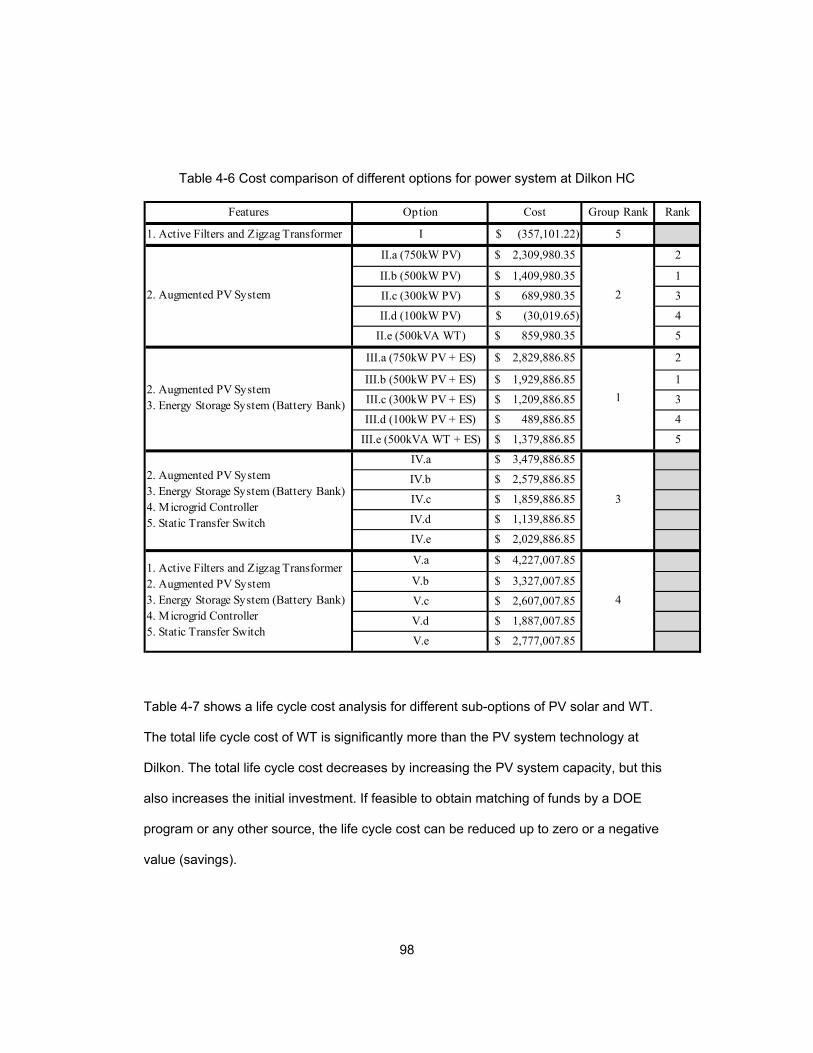
98
Table 4-6 Cost comparison of different options for power system at Dilkon HC
Table 4-7 shows a life cycle cost analysis for different sub-options of PV solar and WT.
The total life cycle cost of WT is significantly more than the PV system technology at
Dilkon. The total life cycle cost decreases by increasing the PV system capacity, but this
also increases the initial investment. If feasible to obtain matching of funds by a DOE
program or any other source, the life cycle cost can be reduced up to zero or a negative
value (savings).
Features Option Cost Group Rank Rank
1. Active Filters and Zigzag Transformer I (357,101.22)$ 5
II.a (750kW PV) 2,309,980.35$ 2
II.b (500kW PV) 1,409,980.35$ 1
II.c (300kW PV) 689,980.35$ 3
II.d (100kW PV) (30,019.65)$ 4
II.e (500kVA WT) 859,980.35$ 5
III.a (750kW PV + ES) 2,829,886.85$ 2
III.b (500kW PV + ES) 1,929,886.85$ 1
III.c (300kW PV + ES) 1,209,886.85$ 3
III.d (100kW PV + ES) 489,886.85$ 4
III.e (500kVA WT + ES) 1,379,886.85$ 5
IV.a 3,479,886.85$
IV.b 2,579,886.85$
IV.c 1,859,886.85$
IV.d 1,139,886.85$
IV.e 2,029,886.85$
V.a 4,227,007.85$
V.b 3,327,007.85$
V.c 2,607,007.85$
V.d 1,887,007.85$
V.e 2,777,007.85$
2. Augmented PV System
2. Augmented PV System 3. Energy Storage System (Battery Bank)
2. Augmented PV System 3. Energy Storage System (Battery Bank) 4. Microgrid Controller 5. Static Transfer Switch
1. Active Filters and Zigzag Transformer 2. Augmented PV System 3. Energy Storage System (Battery Bank) 4. Microgrid Controller 5. Static Transfer Switch
1
2
3
4
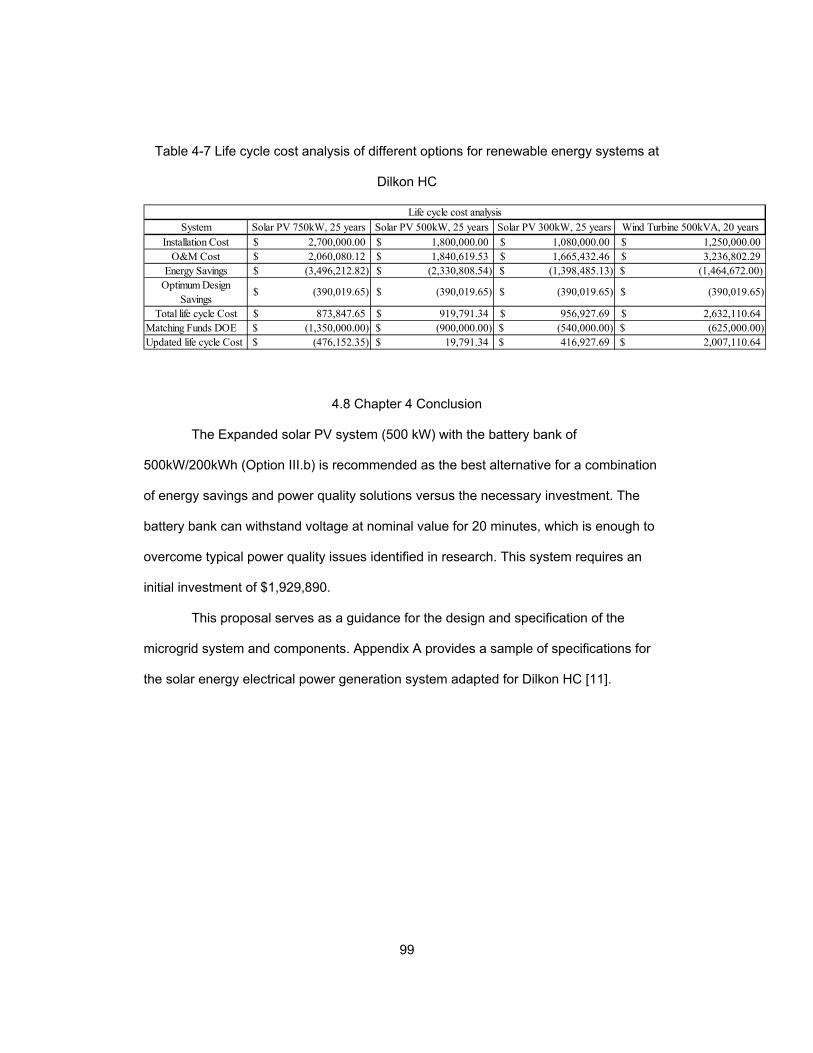
99
Table 4-7 Life cycle cost analysis of different options for renewable energy systems at
Dilkon HC
4.8 Chapter 4 Conclusion
The Expanded solar PV system (500 kW) with the battery bank of
500kW/200kWh (Option III.b) is recommended as the best alternative for a combination
of energy savings and power quality solutions versus the necessary investment. The
battery bank can withstand voltage at nominal value for 20 minutes, which is enough to
overcome typical power quality issues identified in research. This system requires an
initial investment of $1,929,890.
This proposal serves as a guidance for the design and specification of the
microgrid system and components. Appendix A provides a sample of specifications for
the solar energy electrical power generation system adapted for Dilkon HC [11].
System Solar PV 750kW, 25 years Solar PV 500kW, 25 years Solar PV 300kW, 25 years Wind Turbine 500kVA, 20 yearsInstallation Cost 2,700,000.00$ 1,800,000.00$ 1,080,000.00$ 1,250,000.00$
O&M Cost 2,060,080.12$ 1,840,619.53$ 1,665,432.46$ 3,236,802.29$ Energy Savings (3,496,212.82)$ (2,330,808.54)$ (1,398,485.13)$ $ (1,464,672.00)
Optimum Design Savings
(390,019.65)$ (390,019.65)$ (390,019.65)$ (390,019.65)$
Total life cycle Cost 873,847.65$ 919,791.34$ 956,927.69$ 2,632,110.64$ Matching Funds DOE (1,350,000.00)$ (900,000.00)$ (540,000.00)$ (625,000.00)$ Updated life cycle Cost (476,152.35)$ 19,791.34$ 416,927.69$ 2,007,110.64$
Life cycle cost analysis

100
General Conclusions and Future work
1. Tribal healthcare facilities of American Indian and Alaska natives have specific
and unique challenges and opportunities for improvement the power system, such that it
deserved additional research. A facility was selected (Kayenta HC) with a well-defined
criteria that is representative of many typical healthcare facilities in the Navajo Nation.
This process warranty that a significant population of tribal members will benefit from the
improvements achieved through this study.
2. Experimental data of a full scale system on a specific location provided a
reliable source of information about the actual results and typical problems of the PV
system and the power system. It also provides insight from field observations and
demonstrate the advantages, disadvantages and feasibility of the particular healthcare
power system.
3. A modified configuration of existing power system (Kayenta) around microgrid
concept was presented. In most cases is not cost effective to upgrade the existing power
to have full microgrid capabilities. However, some improvements of the power system
can be achieved by applying certain features of the microgrid on existing facilities.
4. Since the work in the construction of new healthcare facilities and staff
quarters is an ongoing process at IHS, is necessary to select proper techniques to gather
reliable information. Seasonal experiments validated with theoretical data available for
the zone, the facility, the systems and the equipment is a useful and cost effective
technique in the research process. Wintertime and summertime extremes provides
reliable information in order to extrapolate the behavior of the system under different
conditions. In this application, modeling and simulation tools also demonstrated to be

101
very useful to discover additional information, process and methodology not readily
available at full scale level.
5. A concept model was presented for the design of the power system for tribal
healthcare facilities in Navajo Nation. The concept model ensures that the actual
implementation of the microgrid will enhance the power quality, result in optimum power
system design, produce energy savings and reduce environmental pollution. The concept
model of microgrid architecture lead to the development of a proposal for the
implementation of the microgrid at Dilkon Health Center. The Microgrid proposal was
accepted and adopted by the management of Division of Engineering Services from
Indian Health Services.
6. The proposal for Dilkon HC basically use previous research information and
the concept model and apply a procedure and cost estimates for a specific facility. It was
necessary to include different type of language (cost vs benefits instead of highly
technical) in the proposal because it have the intent of convince the different
stakeholders. It was proved that the proposal is a necessary stage between the research
and the actual implementation. The proposal serves as a guidance for the power system
design around the microgrid concept for Dilkon HC.
It was important to present, analyze and compare multiple options and sub-
options based on benefit versus cost. The Expanded solar PV system with the battery
bank was recommended as the best alternative for a combination of energy savings and
power quality solutions versus the necessary investment.
7. The research foundation and procedures presented can be applied not only for
Dilkon HC, but also to develop additional proposals of Microgrid implementation or power
system improvements in other healthcare facilities and staff quarter projects.

102
8. The concept model can be adjusted and adapted to include the full capabilities
of the microgrid implementation for a staff quarters project of the IHS new construction
priority list. In this case, there is more flexibility regarding the code compliance features of
the model. Full capabilities are more cost effective for staff quarter projects as compared
to healthcare facilities in the Navajo Nation.
9. Once the microgrid is implemented, additional research and experimental
studies can be applied for the full scale system. These studies will verify expectancies
and will identify additional opportunities for improvement of the efficiency and
effectiveness of the microgrid.
10. Future work includes development accurate models and perform simulation
studies for different conditions of microgrid system and components applicable for tribal
healthcare facilities and staff quarter projects.
The scope of this study is applicable for the Navajo Nation, but the health care
facilities and staff quarters are located in twelve (12) different tribal areas. Due to the
size, location and configuration of the facilities, the climate, transportation and other
factors, certain areas (e.g. Alaska) deserve separate future studies. The renewable
energy resources, the power quality issues and hence the solutions for the power system
improvement will vary significantly from different areas. For example, efficient Combined
Heat and Power (CHP) solution alternatives would receive stronger consideration in
some areas.
103
Appendix A
Sample specification for solar energy electrical power generation system

104
SECTION 48 14 00
SOLAR ENERGY ELECTRICAL POWER GENERATION SYSTEM
PART 1 - GENERAL
1.1 DESCRIPTION
A. This section specifies the furnishing, installation, connection, testing, and
commissioning of solar energy electrical power generation systems.
B. The requirements of this Section apply to all sections of Division 48 related to solar
energy electrical power generation systems.
1.2 RELATED WORK
A. Section 01 00 00, GENERAL REQUIREMENTS: General construction practices.
B. Section 01 33 23, SHOP DRAWINGS, PRODUCT DATA, AND SAMPLES: Submittals.
C. Section 01 91 00, GENERAL COMMISSIONING REQUIREMENTS: General
requirements for commissioning.
D. Section 26 05 11, REQUIREMENTS FOR ELECTRICAL INSTALLATIONS:
Requirements that apply to all sections of Division 26.
E. Section 26 05 19, LOW-VOLTAGE ELECTRICAL POWER CONDUCTORS AND
CABLES: Requirements for low-voltage conductors.
F. Section 26 05 26, GROUNDING AND BONDING FOR ELECTRICAL SYSTEMS:
Requirements for personnel safety and requirements for providing a low impedance
path for possible ground fault currents.
G. Section 26 05 33, RACEWAYS AND BOXES FOR ELECTRICAL SYSTEMS:
Requirements for boxes, conduits, and raceways.
H. Section 26 08 00, COMMISSIONING OF ELECTRICAL SYSTEMS: Requirements for
commissioning the electrical system, subsystems, and equipment.
I. Section 26 29 21, DISCONNECT SWITCHES: Requirements for disconnect switches.

105
1.3 DEFINITIONS
A. Unless otherwise specified or indicated, electrical and electronics terminology used in
these specifications, and on the drawings, shall be as defined in IEEE 100 CD.
B. Unless otherwise specified or indicated, solar energy conversion and solar photovoltaic
energy system terminology used in these specifications, and on the drawings, shall be
as defined in ASTM E772.
1.4 QUALITY ASSURANCE
A. Solar Energy Electrical Power Generation System installer(s) shall demonstrate that
they have successfully installed at least four projects within the past five years that, in
aggregate, equal or exceed the size of the proposed project. References shall be
provided for each of the referenced qualified projects.
B. Refer to Paragraph, QUALIFICATIONS, in Section 26 05 11, REQUIREMENTS FOR
ELECTRICAL INSTALLATIONS.
C. Supports and racking for solar photovoltaic system designs shall be prepared under the
seal of a licensed Professional Structural Engineer (PE). Where applicable, such as
roof top installations, the engineer shall also provide adequate review and structural
analysis of the existing structure that will be supporting the proposed solar photovoltaic
system. Among the documents that shall be submitted by the engineer are
environmental loading analyses (including wind, snow, hail, and where applicable,
seismic) and the rack and substrate’s ability to withstand these environmental forces.
In the instance where the rack is installed on the ground, adequate information shall be
presented to demonstrate the earth’s ability to support the proposed design.
D. If the system will be a tracking system, the mechanical and control systems shall be
approved by the using entity. Preference shall be given to closed or hybrid-open/closed
logic control for the tracking system.

106
E. If paralleling arrangement is desired, the system shall have anti-islanding capability
such that it is incapable of exporting power to the utility distribution system in the
absence of utility power. Paralleling must be approved by serving electric utility.
Provide written correspondence from the utility confirming its requirements.
F. Investigate whether the COR or local environmental entities require environmental
impact studies which may include, but are not limited to, effects upon wildlife. The
Contractor shall determine which entity has jurisdiction over environmental matters and
shall make appropriate inquiry and comply with all applicable regulations.
G. Investigate any other local ordinances that may apply to installation of a solar energy
electrical generating system in the proposed location. Bring any conflicts with the
drawings and specifications to the attention of the COR.
H. Warranties: The solar energy electrical generating system shall be subject to the terms
of FAR Clause 52.246-21, except that the warranty period shall be as noted for the
items below:
1. Solar photovoltaic modules and inverter: 10 year manufacturer’s warranty against
defects in materials and workmanship.
2. Power output: 25 year manufacturer’s power output warranty, with the first 10 years
at 90% minimum rated power output and the balance of the 25 years at 80%
minimum rated power output.
1.5 SUBMITTALS
A. Where proposed system shall be a Net Meter project, prepare appropriate applications
and submittals to the Contracting Officer’s Representative (COR). Where proposed
system shall be connected before the serving electric utility’s meter and tied directly to
the grid, prepare appropriate applications and submittals to the COR. In all cases, the
serving electric utility may have a requirement for further electrical studies, which may
include or not be limited to power factor analysis, short circuit protection studies, grid

107
wiring adequacy, or capacities of upstream equipment. If such requirements exist and
are required by the serving electric utility, these requirements shall be fulfilled by the
Contractor. Provide written documentation confirming the utility’s approval of the
interconnection of the solar energy electrical power generation system with the utility
system.
B. Submit six copies of the following to the COR in accordance with Section 26 05 11,
REQUIREMENTS FOR ELECTRICAL INSTALLATIONS.
1. Shop Drawings:
a. Submit sufficient information to demonstrate compliance with drawings and
specifications.
b. Include electrical ratings, dimensions, mounting details, materials, required
clearances, terminations, weight, wiring and connection diagrams, accessories,
and nameplate data.
c. Include shop drawings for foundations and other support structures.
2. Product Data:
a. Include detailed information for components of the solar energy electrical
generation system.
1. Wiring.
2. Inverter.
3. Photovoltaic modules.
4. Rack and support assemblies.
5. Instrumentation.
6. Switchgear.
7. DC and AC disconnects.
8. Combiner boxes.
9. Monitoring systems.

108
3. Manuals:
a. Submit, simultaneously with the shop drawings, complete maintenance and
operating manuals including technical data sheets, wiring diagrams, and
information for ordering replacement parts.
1. Safety precautions.
2. Operator restart.
3. Startup, shutdown, and post-shutdown procedures.
4. Normal operations.
5. Emergency operations.
6. Environmental conditions.
7. Preventive maintenance plan and schedule.
8. Troubleshooting guides and diagnostic techniques.
9. Wiring and control diagrams.
10. Maintenance and repair procedures.
11. Removal and replacement instructions.
12. Tracking systems (where applicable).
13. Spare parts and supply list.
14. Parts identification.
15. Testing equipment and special tool information.
16. Warranty information.
17. Testing and performance data.
18. Contractor information.
b. If changes have been made to the maintenance and operating manuals
originally submitted, then submit updated maintenance and operating manuals
two weeks prior to the final inspection.
4. Certifications: Two weeks prior to final inspection, submit the following.
109
a. Certification by the manufacturers of all major items of the solar energy
electric generation system that the system conforms to the requirements of the
drawings and specifications, and that they have jointly coordinated and properly
integrated their equipment and controls to provide a complete and functional
installation.
b. Certification by the Contractor that the solar energy electric generation system
has been properly installed, adjusted, tested, commissioned, and warrantied.
Contractor shall make all necessary field measurements and investigations to
ensure that the equipment and assemblies meet contract requirements.
5. Estimated Annual Power Output: Submit calculated annual power output for each of
the proposed solar photovoltaic systems. Provide independent calculations for
each fixed, single-axis tracking, or double-axis tracking system.
C. If equipment submitted differs in arrangement from that shown on the drawings, provide
drawings that show the rearrangement of all associated systems. Approval will be
given only if all features of the equipment and associated systems, including
accessibility, are equivalent to that required by the contract and acceptable to the COR.
D. Submittals and shop drawings for independent but related items shall be furnished
together and complete in a group. Coordinate and properly integrate materials and
equipment in each group. Final review and approval will be made only by groups.
1.6 APPLICABLE PUBLICATIONS
A. Publications listed below (including amendments, addenda, revisions, supplements and
errata) form a part of this specification to the extent referenced. Publications are
referenced in the text by the basic designation only.
B. American Society for Testing and Materials (ASTM):
E772-15 ...................................... Standard Terminology of Solar Energy Conversion
110
E1038-15 .................................... Standard Test Method for Determining Resistance of
Photovoltaic Modules to Hail by Impact with Propelled
Ice Balls
C. Institute of Electrical and Electronics Engineers (IEEE):
100 CD-13 .................................. The Authoritative Dictionary of IEEE Standards Terms
519-14 ........................................ Recommended Practices and Requirements for
Harmonic Control in Electric Power Systems
937-07 ........................................ Recommended Practice for Installation and
Maintenance of Lead-Acid Batteries for Photovoltaic
(PV) Systems
1013-07 ...................................... Recommended Practice for Sizing Lead-Acid Batteries
for Stand-Alone Photovoltaic (PV) Systems
1361-14 ...................................... Guide for Selection, Charging, Test and Evaluation of
Lead-Acid Batteries Used in Stand-Alone Photovoltaic
(PV) Systems
1526-03 ...................................... Recommended Practice for Testing the Performance of
Stand-Alone Photovoltaic Systems
1547-03 ...................................... Standard for Interconnecting Distributed Resources
with Electric Power Systems
1561-07 ...................................... Guide for Optimizing the Performance and Life of
Lead-Acid Batteries in Remote Hybrid Systems
1562-07 ...................................... Guide for Array and Battery Sizing in Stand-Alone
Photovoltaic (PV) Systems
1661-07 ...................................... Guide for Test and Evaluation of Lead-Acid Batteries
Used in Photovoltaic (PV) Hybrid Power Systems
D. International Code Council (ICC):

111
IBC-15 ........................................ International Building Code
IFC-15 ........................................ International Fire Code
E. National Electrical Manufacturer’s Association (NEMA):
250-14 ........................................ Enclosures for Electrical Equipment (1,000 Volts
Maximum)
F. National Fire Protection Association (NFPA):
70-14 .......................................... National Electrical Code (NEC)
G. Underwriters Laboratories (UL):
6-07 ............................................ Electrical Rigid Metal Conduit – Steel
94-13 .......................................... Tests for Flammability of Plastic Materials for Parts in
Devices and Appliances; Ed 6
797-07 ........................................ Electrical Metallic Tubing – Steel
969-95 ........................................ Standard for Marking and Labeling Systems
1242-06 ...................................... Standard for Electrical Intermediate Metal Conduit –
Steel
1703-02 ...................................... Standard for Flat-Plate Photovoltaic Modules and
Panels
1741-10 ...................................... Standard for Inverters, Converters, Controllers and
Interconnection System Equipment for Use with
Distributed Energy Resources
PART 2 - PRODUCTS
2.1 GENERAL
A. Provide materials to fabricate functioning photovoltaic system in accordance with
ASTM, IEEE, NEMA, NFPA, and UL, as specified in this section, and as shown on the
drawings.

112
B. Factory-prefabricated solar equipment packages which include photovoltaic modules,
batteries or other energy storage, inverters, and controls and which meet the
requirements of this section are acceptable.
2.2 GROUNDING
A. All applicable components of the solar energy electrical power generating system must
be grounded per latest NEC requirements.
B. DC Ground-Fault Protector:
1. Shall be listed per UL 1703.
2. Shall comply with requirements of the NEC.
2.3 PHOTOVOLTAIC ARRAY CIRCUIT COMBINER BOX
A. Shall be listed to UL 1741.
B. Shall include internal overcurrent protection devices with dead front.
C. Shall be contained in non-conductive NEMA Type 4X enclosure.
D. Up to 48 volts DC: Shall use UL-listed DC breakers that meet NEC requirements for
overcurrent protection.
E. Up to 600 volts DC, paralleling system: Shall use fuses instead of breakers.
F. Ground and pole-mounted arrays shall have a separate combiner box mounted to the
pole itself.
G. Where applicable, combiner box shall be a disconnecting combiner box.
2.4 SWITCH/DISCONNECTING MEANS
A. Shall be UL-listed, in accordance with the NEC, as shown on the drawings, and as
specified.
B. Utility External Disconnect Switch (UEDS): Refer to COR, as several states do not
require UEDS for small solar photovoltaic systems if the inverter provides the same
function per NEC. Coordinate requirements with serving electric utility.

113
2.5 WIRING SPECIALTIES
A. Direct Current Conductors:
1. If Exposed: Shall be USE-2, UF (inadequate at 60°C [140°F]), or SE, 90°C [194°F]
wet-location rated and sunlight-resistant (usually for tracking modules).
2. If in Conduit: Shall be RHW-2, THWN-2, or XHHW-2 90°C [194°F], wet-location
rated.
B. Conduits and Raceways:
1. Shall use steel conduit listed per UL 6, UL 1242, UL 797 (as appropriate), except
for tracking modules. Weathertight EMT installations shall be allowed for DC wiring
in weather-protected areas.
2. Shall use expansion joints on long conduit runs.
3. Shall not be installed on photovoltaic modules.
C. Enclosures subject to weather shall be rated NEMA 3R or better.
D. Cable Assemblies and Junction Boxes:
1. Shall be UL-listed.
2. Shall be rated to 5VA flammability per UL 94.
E. Prohibited Wiring Materials: Those which are not UL-listed, or listed materials used in
environments outside those covered in their listing.
2.6 DC-AC INVERTER
A. Shall be listed to UL 1741.
B. Shall comply with IEEE 519 and IEEE 1547.
C. Shall be listed per FCC Part 15 Class A.1.
D. Shall have stand-alone, utility-interactive, or combined capabilities.
E. Shall include maximum power point tracking (MPPT) features.
F. Shall include anti-islanding protection if paralleling arrangement is required.

114
2.7 SOLAR PHOTOVOLTAIC (PV) MODULES
A. Minimum Performance Parameters as per IBC 1509.7.4, IRC M2302.3, UL 1703.
B. Photovoltaic Panel Types:
1. Monocrystalline: Listed to UL 1703.
2. Polycrystalline: Listed to UL 1703.
3. Thin-Film/Flexible: Listed to UL 1703.
4. Building-Integrated & Solar Shingles: Listed to UL 1703.
C. Module and System Identification
1. Module or Panel:
a. Listed to UL 969 for weather resistance.
b. Listed to UL 1703 for marking contents and format.
2. Main Service Disconnect: per NEC.
3. Identification Content and Format: per NEC.
4. Identification for DC Conduit, Raceways, Enclosures, Cable Assemblies, and
Junction Boxes: IFC 605.
5. Identification for Inverter: per NEC.
D. Bypass diodes shall be built into each PV module either between each cell or each
string of cells.
E. Other Components: per UL 1703.
F. Hail Protection: Compliant with testing procedure per ASTM E-1038.
G. Lightning Protection: Shall ground according to manufacturer instructions per UL 1703.
H. Access, Pathways, and Smoke Ventilation: Per IFC 605.3, access and spacing
requirements must be observed in order to: ensure access to the roof, provide
pathways to specific areas of the roof, provide for smoke ventilation opportunities area,
and, where applicable, provide emergency access egress from the roof.
I. Fire Classification:

115
1. IBC 1505.8 for building-integrated photovoltaic and solar shingles.
2. IBC 1509.7.2: Although not technically enforceable, every effort shall be made to
ensure the solar photovoltaic module is not combustible.
2.8 BATTERY CHARGE CONTROLLER
A. Listed per UL 1741.
B. Charge controller or self-regulating system shall be required for a stand-alone system
with battery storage. Charge controller’s adjusting mechanism shall be accessible only
to qualified persons.
C. Shall be capable of withstanding 25% over-amperage while charging for limited time per
the NEC.
D. Charge controller shall include maximum power point tracking (MPPT) and temperature
compensation.
2.9 BATTERY
A. General: Comply with NEC. Flooded lead-acid, captive electrolyte lead acid and nickel-
cadmium are acceptable. Consider climate when selecting battery type.
B. Off-Grid: Always use high-quality, industrial-grade, deep-cycle batteries.
C. Grid-Interactive with Battery Backup: Best to use sealed-absorbed glass mat (AGM)
batteries specifically designed for emergency standby or float service.
D. Sizing: For stand-alone systems, size per IEEE 1013 and/or 1562.
E. Installation and Maintenance: Follow practices per IEEE 937.
F. Test and Evaluation:
1. Stand-Alone System: Follow procedures per IEEE 1361.
2. Hybrid System: Follow procedures per IEEE 1661.
G. Optimize Performance and Life: Follow practices per IEEE 1561.
H. Safety and Ventilation:
1. Use protective enclosure and proper ventilation per the NEC.

116
2. Exposed battery terminals and cable connections shall be protected, and live parts
of batteries shall be guarded. Batteries should be accessible only to a qualified
person via locked room, battery box, or other container.
3. Spacing around battery enclosures and boxes and other equipment shall be at least
915 mm [36 inches]; batteries shall not be installed in living areas, or below
enclosures, panelboards, or load centers.
4. Prohibited are conductive cases for flooded, lead-acid batteries operating above 48-
volt nominal. Battery racks shall have no conductive parts within 155 mm [6 inches]
of the tops of cases.
5. To reduce risk of electric shock, storage batteries in dwellings shall operate at less
than 50 volts (48-volt nominal battery bank). Live parts of any battery bank shall be
guarded.
I. Interconnection:
1. Per NEC, battery cables shall be a standard building wire type conductor. Welding
and automobile “battery” cables (listed and non-listed) are prohibited.
2. Flexible cables, listed for hard service use and moisture resistance, are permitted
(not required) from battery terminals to nearby junction box and between battery
cells. Flexible, highly-stranded building-wire type cables (USE/RHW and THW) are
available. Battery terminals shall be compatible with flexible cables.
2.10 COLLECTOR SUPPORTS
A. Wind Resistance Requirement:
1. For rack-mounted: per IBC 1509.7.1.
2. For building-integrated photovoltaic and solar shingles: IBC 1507.17.3.
B. Mechanical Load Requirement: per UL 1703.
C. Ground and Pole Mount:
1. Foundations shall be designed by a licensed Professional Structural Engineer (PE).

117
2. Where possible, combiner boxes shall be mounted directly to the pole itself.
2.10 INSTRUMENTATION
A. Meters: If applicable and system is grid-connected, use net smart meter provided by the
serving electric utility.
B. Sensors:
1. Temperature sensor shall be a component in the MPPT control system.
2. May install additional data acquisition sensors to measure irradiance, wind speed,
and ambient and PV module temperatures. Any additional sensors shall require a
conduit separate from the current conductor conduit.
C. Data logger/Monitoring System: Shall be a packaged system capable of string-level
monitoring or in the case of micro-inverters, capable of monitoring and logging an
individual module’s information.
PART 3 – EXECUTION
3.1 INSTALLATION
A. Install the solar photovoltaic system in accordance with the NEC, this section, and the
printed instructions of the manufacturer.
B. Prior to system start-up, ensure no copper wire remains exposed with the exception of
grounding wire as allowed in certain circumstances per manufacturer’s instructions.
C. Wiring Installation: Workers shall be made aware that photovoltaic modules will be live
and generating electricity when there is any ambient light source and shall take
appropriate precautions. Utilize on-site measurements in conjunction with engineering
designs to accurately cut wires and layout before making permanent connections.
Locate wires out of the way of windows, doors, openings, and other hazards. Ensure
wires are free of snags and sharp edges that have the potential to compromise the wire
insulation. All cabling shall be mechanically fastened. If the system is roof-mounted it

118
shall have direct current ground fault protection according to NEC. Ensure breakers in
combiner box are in the off position (or fuses removed) during combiner box wiring.
D. Instrumentation: Install instruments as recommended by the manufacturer. Locate
control panels inside a room accessible only to qualified persons.
E. Building-Integrated Photovoltaic Installations: Building-integrated photovoltaic
modules/shingles shall be installed in accordance with the manufacturer’s installation
instructions.
F. Rack-Mounted Photovoltaic Installations: Rack-mounted photovoltaic modules shall be
installed in accordance with the manufacturer’s installation instructions.
G. Ground and Pole-Mounted Photovoltaic Installations: If structure is used as equipment
grounding conductor, ensure compliance with NEC. Wiring shall not be readily
accessible.
H. Tracking System Installations: Disconnect shall be within sight of the tracking motor.
I. Provide safety signage per NEC.
3.2 FIELD QUALITY CONTROL
A. Field Inspection: Perform in accordance with manufacturer’s recommendations. Prior to
initial operation, inspect the solar energy electrical power generation system for
conformance to drawings, specifications, and NEC. In addition, include the following:
1. Visual Inspection and Tests:
a. Compare equipment nameplate data with specifications and approved shop
drawings.
b. Inspect physical, electrical, and mechanical condition.
c. Verify required area clearances.
d. Verifying tightness of accessible bolted electrical connections by calibrated
torque-wrench method, or performing thermographic survey after energization.

119
e. Verify the correct operation of all sensing devices, alarms, and indicating
devices.
f. Verify that all cable entries from top of junction boxes are sealed per junction
box rating.
g. Verify all connections and integrity of printed circuit boards in all applicable
junction boxes.
B. Tests: Provide equipment and apparatus required for performing tests. Correct defects
disclosed by the tests and repeat tests. Conduct tests in the presence of the COR.
1. Module String Voltage Test: Prior to connecting wiring to the combiner box, use a
digital multi-meter to ensure each series string’s polarity is correct.
2. Operational Tests: Perform tests in accordance with the manufacturer’s written
recommendations. Tests for stand-alone systems shall be performed per IEEE
1526.
3.3 FOLLOW-UP VERIFICATION
A. Upon completion of acceptance checks, settings, and tests, the Contractor shall show
by demonstration in service that the solar photovoltaic electrical power generation
system is in good operating condition and properly performing the intended function.
3.4 COMMISSIONING
A. Comply with the requirements of Section 01 91 00, GENERAL COMMISSIONING
REQUIREMENTS.
B. If the system is grid-tied, the Contractor shall coordinate with the serving electric utility
to establish an interconnection agreement.
C. Connect the solar photovoltaic electrical power generation system to the serving electric
utility grid only after receiving prior approval from the utility company.
D. Only qualified personnel shall connect the solar photovoltaic electrical power generation
system to the serving electric utility grid.

120
3.5 INSTRUCTION
A. A complete set of operating instructions for the solar photovoltaic electrical power
generation system shall be laminated or mounted under acrylic glass and installed in a
frame near the equipment.
B. Furnish the services of a factory-trained technician for one, 4-hour training period for
instructing personnel in the maintenance and operation of the solar photovoltaic
electrical power generation system, on the date requested by the COR.
---END---

121
References by Chapter
Chapter 1
[1] National Renewable Energy Laboratory (NREL) database. [Online]. Available:
http://rredc.nrel.gov/solar/
[2] US Energy Information Administration. [Online]. Available:
http://www.eia.gov/renewable/
[3] US Department of Health and Human Services (DHHS), Indian Health Service (IHS).
[Online]. Available: http//www.ihs.gov
[4] US DHHS, IHS, Office of Environmental Health & Engineering (OEHE), Division of
Engineering Services (DES), “Architect/Engineer Design Guide”, 2013.
[5] P. Barker, B. Johnson, A. Maitra, “Investigation of the technical and economic
feasibility of micro-grid-based power systems”, EPRI PEAC Corporation; final report,
December 2001.
[6] Peng Li, Xiaochun Li, Jinxin Liu, Jing Chen, Jianjie Chen, “Analysis of acceptable
capacity of microgrid connected to the main power grid”, IEEE; 2011, pp. 1799-1802
[7] Ali Keyhani, Mohammad N. Marwali, Min Dai, “Integration of green and renewable
energy in electric power systems”, Wiley; 2010
[8] Majid Ahmadi, Jay M. Rosenberger, Wei-Jen Lee, Asama Kulvanitchaiyanunt,
“Optimizing load control in a collaborative residential microgrid environment”, IEEE
Transactions on smart grid, 2015, vol. 6, issue 3.
[9] Wikipedia, the free encyclopedia. [Online]. Available:
https://en.wikipedia.org/wiki/Navajo_Generating_Station
[10] Navajo Tribal Utility Authority. [Online]. Available: http://www.ntua.com/news.html
122
[11] Energy.gov, Office of Energy & Renewable Energy. [Online]. Available:
http://energy.gov/eere/articles/energy-department-announces-4-million-projects-
launching-orange-button-solar-energy.
[12] Mahesh S. Illindala, Hussam J. Khasawneh, Ajit A. Renjit, “Flexible distribution of
energy and storage resources”, IEEE Industry applications magazine, sept/oct 2015, vol.
21, No 5.
[13] K. C. McIntyre, C. Clancey-Rivera, M. C. Tobin, M. D. Erickson, X. Zhang, “The
feasibility of an environmentally friendly microgrid”, IEEE NAPS, 2010.
[14] Y. Nian, S. Liu, D. Wu, J. Liu, “A method for optimal sizing of stand-alone hybrid
PV/wind/battery system”, IEEE Renewable power generation conference (RPG 2013),
2nd IET.
[15] Robert H. Lasseter, “Extended CERTS microgrid”, IEEE Power and energy society
general meeting-conversion and delivery of electrical energy in the 21st century, 2008.
[16] Peng Li, Xubin Wang, Wei-Jen Lee, Duo Xu, “Dynamic power conditioning method of
microgrid via adaptive inverse control”, IEEE Transactions on power delivery, 2015, vol.
30, issue 2.
[17] Giuseppe Parise, Luigi Parise, Luigi Martirano, Antonino Germole, “Service
continuity safety by design, the relevance of electrical power-system architectures in
hospitals”, IEEE Industry applications magazine, jan/feb 2016, vol. 22, No 1.
[18] Duotong Yang, Haniph A. Latchman, Dave Trigling, Anim Adrian Amarsingh, “Design
and return on investment analysis of residential solar photovoltaic systems”, IEEE
potentials magazine, jul/aug 2015, vol. 34, No 4.
[19] Weidong Xiao, Fonkwe Fongang Edwin, Giovanni Spagnuolo, Juri Jatskevich,
“Efficient approaches for modeling and simulating photovoltaic power systems”, IEEE
journal of photovoltaics, jan 2013, vol. 3, No. 1.

123
[20] Jan T. Bialasiewicz, “Renewable energy systems with photovoltaic power
generators: operation and modeling”, IEEE transactions on industrial electronics, jul
2008, vol. 55, No. 7.
[21] P.I. Muoka, M.E. Haque, A. Gargoom, M. Negnevitsky, “Modeling, simulation and
hardware implementation of a PV power plant in a distributed energy generation system”,
IEEE PES, 2013.
[22] Amirnaser Yazdani, Anna Rita Di Fazio, Hamidreza Ghoddami, Mario Russo,
Mehrdad Kazerani, Juri Jatskevich, Kai Strunz, Sonia Leva, Juan A. Martinez, “Modeling
guidelines and benchmark for power system simulation studies of three-phase single-
stage photovoltaic systems”, IEEE transactions on power delivery, apr 2011, vol. 26, No.
2.
[23] S. Tamalouzt, N. Benyahia, T. Rekioua, R. Abdessemed, “A doubly fed induction
generator wind turbine and fuel cell hybrid power sources system for micro-grid
applications”, IEEE 2015 3rd international conference on control, engineering &
information technology (CEIT).
[24] Robert H. Lasseter, “CERTS microgrid”, IEEE International conference on system of
system engineering, 2007.
[25] Paulo F. Ribeiro, Brian K. Johnson, Mariesa L. Crow, Aysen Arsoy, Yuli Liu, “Energy
storage systems for advance power applications”, Proceedings of IEEE, vol. 89, No. 12,
Dec 2001.
[26] Kathie Zipp, Solar power world, May 5, 2016. [Online]. Available:
http://www.solarpowerworldonline.com/2015/08/what-is-the-best-type-of-battery-for-solar-
storage.
[27] Indian Health Service, “The 2016 Indian Health Service and Tribal Health Care
Facilities’ Needs Assessment Report to Congress”, 2016.

124
Chapter 2
[1] Samuel Vega-Cotto, Wei-Jen Lee, “Challenges and opportunities: Microgrid modular
design for Tribal Healthcare facilities”, 2016 North American Power Symposium (NAPS),
Denver, CO, 2016, pp. 1-6.
[2] Wikipedia [Online]. Available: https://en.wikipedia.org/wiki/Daylight
[3] NASA Earth Observatory website [Online]. Available:
http://earthobservatory.nasa.gov/Features/EnergyBalance/page2.php
[4] Fluke® Corporation, “Fluke 1735 Power Logger User’s Manual”, March 2006 Rev. 2,
3/10
[5] Stephen Wilcox, “National Solar Radiation Database 1991–2010 Update: User’s
Manual,” Technical Report, NREL/TP-5500-54824, August 2012
[6] National Renewable Energy Laboratory (NREL) database. [Online]. Available:
http://rredc.nrel.gov/solar/
[7] SEL-735 Guideform Specification. [Online]. Available: https://selinc.com/
[8] IEEE Std 1159™-2009 - IEEE Recommended Practice for Monitoring Electric Power
Quality, The Institute of Electrical and Electronics Engineers, Inc., IEEE Power & Energy
Society, 26 June 2009.
[9] Phillip W. Hall, Bill B. Bailey, Ernst H. Camm, “Power Quality Evaluation at Medical
Center,” Transmission and Distribution Conference, 1999 IEEE, Pages: 560 - 565 vol.2.
[10] Milind M. Bhanoo, “Static Transfer Switch: Advances in High Speed Solid-State
Transfer Switches for Critical Power Quality and Reliability Applications,” Textile, Fiber
and Film Industry Technical Conference, 1998 IEEE Annual, Pages: 5/1 - 5/8.
[11] US Energy Information Administration [Online]. Available:
http://www.eia.gov/todayinenergy/detail.php?id=18871

125
[12] NREL's PVWatts® Calculator [Online]. Available: http://pvwatts.nrel.gov/
[13] Abd Salam AI-Ammri, Areej Ghazi, Falah Mustafa, “Dust Effects on the Performance
of PV Street Light in Baghdad City,” Renewable and Sustainable Energy Conference
(IRSEC), 2013 International, P. 18 – 22.
[14] Adria E. Brooks; Daniella N. DellaGiustina; Scott M. Patterson; Alexander D. Cronin,
“The consequence of soiling on PV system performance in Arizona; Comparing three
study methods,” 2013 IEEE 39th Photovoltaic Specialists Conference (PVSC), Pages:
0754 – 0758.
[15] Shaharin A. Sulaiman; Mohamad Nur Hidayat Mat; Fiseha M. Guangul; Mohammed
A. Bou-Rabee, “Real-time study on the effect of dust accumulation on performance of
solar PV panels in Malaysia,” International Conference on Electrical and Information
Technologies (ICEIT), 2015, Pages: 269 – 274.
[16] Mohammad Naeem; Govindasamy TamizhMani, “Cleaning frequency optimization
for soiled photovoltaic modules,” 2015 IEEE 42nd Photovoltaic Specialist Conference
(PVSC), Pages: 1 – 5.
[17] Hirotoshi Nakagawa; Kouhei Mathuoka; Hironobu Yonemori, “A study about the self-
cleaning of a PV module surface using photocatalyst,” Humanitarian Technology
Conference (R10-HTC), 2014 IEEE Region 10, Pages: 82 – 87.
[18] Yaskawa Solectria Solar, Product Datasheet & Specifications [Online] Available:
https://www.solectria.com/pv-inverters/commercial-central-inverters/pvi-50-100kw/
[19] SEL-735 Portable Operating Instructions. [Online]. Available: https://selinc.com/
[20] Roger C. Dugan, Mark F. McGranaghan, Surya Santoso, H. Wayne Beaty, “Electrical
Power Systems Quality 3rd Ed,” McGraw-Hill 2012.

126
[21] Stefan Pfenninger, Iain Staffell, “Long-term patterns of European PV output using 30
years of validated hourly reanalysis and satellite data,” Copyright © 2016 Elsevier B.V. or
its licensors or contributors.
[22] Iain Staffell, Stefan Pfenninger, “Using bias-corrected reanalysis to simulate current
and future wind power output,” Copyright © 2016 Elsevier B.V. or its licensors or
contributors.
[23] IEEE Std 519™-2014 - IEEE Recommended Practice and Requirements for
Harmonic Control in Electric Power Systems, The Institute of Electrical and Electronics
Engineers, Inc., IEEE Power & Energy Society, 27 March 2014.
[24] Weidong Xiao, Fonkwe Fongang Edwin, Giovanni Spagnuolo, Juri Jatskevich,
“Efficient approaches for modeling and simulating photovoltaic power systems,” IEEE
journal of photovoltaics, jan 2013, vol. 3, No. 1.
[25] Jan T. Bialasiewicz, “Renewable energy systems with photovoltaic power
generators: operation and modeling,” IEEE transactions on industrial electronics, jul
2008, vol. 55, No. 7.
[26] P.I. Muoka, M.E. Haque, A. Gargoom, M. Negnevitsky, “Modeling, simulation and
hardware implementation of a PV power plant in a distributed energy generation system,”
IEEE PES, 2013.
[27] Amirnaser Yazdani, Anna Rita Di Fazio, Hamidreza Ghoddami, Mario Russo,
Mehrdad Kazerani, Juri Jatskevich, Kai Strunz, Sonia Leva, Juan A. Martinez, “Modeling
guidelines and benchmark for power system simulation studies of three-phase single-
stage photovoltaic systems,” IEEE transactions on power delivery, apr 2011, vol. 26, No.
2.

127
[28] Yousef Mahmoud; W. Xiao; H. H. Zeineldin, “A Simple Approach to Modeling and
Simulation of Photovoltaic Modules,” IEEE Transactions on Sustainable Energy, Year:
2012, Volume: 3, Issue: 1, Pages: 185 – 186.
[29] Moacyr A. G. de Brito; Leonardo P. Sampaio; G. Luigi; Guilherme A. e Melo;
Carlos A. Canesin, “Comparative analysis of MPPT techniques for PV applications,” 2011
International Conference on Clean Electrical Power (ICCEP), Pages: 99 – 104.
[30] Ali F Murtaza; Hadeed Ahmed Sher; Marcello Chiaberge; Diego Boero; Mirko
De Giuseppe; Khaled E Addoweesh, “Comparative analysis of maximum power point
tracking techniques for PV applications,” 2013 16th International Multi Topic Conference
(INMIC), Pages: 83 – 88.
[31] Soubhagya Kumar Dash; Deepak Verma; Savita Nema; R. K. Nema,
“Comparative analysis of maximum power point (MPP) tracking techniques for solar PV
application using MATLAB Simulink,” 2014 Recent Advances and Innovations in
Engineering (ICRAIE), Pag.: 1 – 7.
[32] R. Boukenoui; R. Bradai; A. Mellit; M. Ghanes; H. Salhi, “Comparative analysis
of P&O, modified hill climbing-FLC, and adaptive P&O-FLC MPPTs for microgrid
standalone PV system,” 2015 International Conference on Renewable Energy Research
and Applications (ICRERA), Pages: 1095 – 1099.
[33] Babita Panda; Bhagabat Panda; P. K. Hota; Sujit Kumar Bhuyan, “A comparative
analysis of Maximum Power Point techniques for photovoltaic system,” 2015 IEEE
Power, Communication and Information Technology Conference (PCITC), Pages: 732 –
737.
[34] Abhishek Kumar Gupta; Ravi Saxena, “Review on widely-used MPPT techniques
for PV applications,” 2016 International Conference on Innovation and Challenges in
Cyber Security (ICICCS-INBUSH), Pages: 270 – 273.

128
[35] Matlab & Simulink student version [Online]. Available:
https://www.mathworks.com/academia/student_version/
[36] Samuel Vega-Cotto, Wei-Jen Lee, “Microgrid modular design for Tribal Healthcare
facilities: Kayenta Health Center PV System case study”, 2017 IEEE-IAS Industrial &
Commercial Power Systems Conference (I&CPS), Niagara Falls, ON, Canada.
Chapter 3
[1] Samuel Vega-Cotto, Wei-Jen Lee, “Challenges and opportunities: Microgrid modular
design for Tribal Healthcare facilities”, 2016 North American Power Symposium (NAPS),
Denver, CO, 2016, pp. 1-6.
[2] Samuel Vega-Cotto, Wei-Jen Lee, “Microgrid modular design for Tribal Healthcare
facilities: Kayenta Health Center PV System case study”, 2017 IEEE-IAS Industrial &
Commercial Power Systems Conference (I&CPS), Niagara Falls, ON, Canada.
[3] Fluke® Corporation, “Fluke 1735 Power Logger User’s Manual”, March 2006 Rev. 2,
3/10
[4] The Weather Company, [Online]. Available: https://weather.com/
[5] National Renewable Energy Laboratory (NREL) database. [Online]. Available:
http://rredc.nrel.gov/solar/old_data/nsrdb
[6] Stephen Wilcox, “National Solar Radiation Database 1991–2010 Update: User’s
Manual”, Technical Report, NREL/TP-5500-54824, August 2012
[7] SEL-735 Guide form Specification. [Online]. Available: https://selinc.com/
[8] Stefan Pfenninger, Iain Staffell, “Long-term patterns of European PV output using 30
years of validated hourly reanalysis and satellite data”, Copyright © 2016 Elsevier B.V. or
its licensors or contributors.

129
[9] Iain Staffell, Stefan Pfenninger, “Using bias-corrected reanalysis to simulate current
and future wind power output”, Copyright © 2016 Elsevier B.V. or its licensors or
contributors.
[10] National Renewable Energy Laboratory (NREL) Wind Prospector. [Online]. Available:
https://maps.nrel.gov/wind-prospector/
[11] Wind Energy Solutions, WES [Online]. Available:
http://windenergysolutions.nl/portfolio-item/wes-80/
[12] Roger C. Dugan, Mark F. McGranaghan, Surya Santoso, H. Wayne Beaty, “Electrical
Power Systems Quality 3rd Ed”, McGraw-Hill 2012.
[13] Matlab & Simulink student version [Online]. Available:
https://www.mathworks.com/academia/student_version/
[14] Richard P. Bielen, James K. Lathrop, “NFPA 99 – 2012 Edition, Health care facilities
code handbook”, National Fire Protection Association, 2011.
[15] Benjamin Kroposki, “Can solar save the grid?, using a new technique called virtual
oscillator control, solar PV systems can help stabilize the power grid”, IEEE Spectrum
magazine, Nov. 2016.
[16] IEEE Std 1159™-2009 - IEEE Recommended Practice for Monitoring Electric Power
Quality, The Institute of Electrical and Electronics Engineers, Inc., IEEE Power & Energy
Society, 26 June 2009.
[17] IEEE Std 519™-2014 - IEEE Recommended Practice and Requirements for
Harmonic Control in Electric Power Systems, The Institute of Electrical and Electronics
Engineers, Inc., IEEE Power & Energy Society, 27 March 2014.
[18] NREL's PVWatts® Calculator [Online]. Available: http://pvwatts.nrel.gov/
[19] Yaskawa Solectria Solar, Product Datasheet & Specifications [Online] Available:
https://www.solectria.com/pv-inverters/commercial-central-inverters/pvi-50-100kw/

130
[20] SEL-735 Portable Operating Instructions. [Online]. Available: https://selinc.com/
[21] Yang Du, Dylan Dah-Chuan Lu, David Cornforth, Geoffrey James, “A Study on the
Harmonic Issues at CSIRO Microgrid”, IEEE PEDS 2011, Singapore, 5 - 8 December
2011.
Chapter 4
[1] National Renewable Energy Laboratory (NREL). [Online]. Available:
https://maps.nrel.gov/wind-prospector.
[2] Iain Staffell, Stefan Pfenninger, “Using bias-corrected reanalysis to simulate current
and future wind power output”, Copyright © 2016 Elsevier B.V. or its licensors or
contributors.
[3] National Renewable Energy Laboratory (NREL). [Online]. Available:
https://nsrdb.nrel.gov/nsrdb-viewer.
[4] Stefan Pfenninger, Iain Staffell, “Long-term patterns of European PV output using 30
years of validated hourly reanalysis and satellite data”, Copyright © 2016 Elsevier B.V. or
its licensors or contributors.
[5] National Fire Protection Association, Codes and Standards, NFPA 99 Health Care
Facilities Code, 2015 Edition.
[6] IEEE Std 519™-2014 - IEEE Recommended Practice and Requirements for Harmonic
Control in Electric Power Systems, The Institute of Electrical and Electronics Engineers,
Inc., IEEE Power & Energy Society, 27 March 2014.
[7] RSMeans Online, ® 2017 RSMeans from Gordian, [Online]. Available:
https://www.rsmeansonline.com/.
[8] National Renewable Energy Laboratory (NREL). [Online]. Available:
http://pvwatts.nrel.gov/.

131
[9] Navajo Tribal Utility Authority, Copyright © 2016 NTUA. [Online]. Available:
http://www.ntua.com/.
[10] National Renewable Energy Laboratory (NREL). [Online]. Available:
https://financere.nrel.gov/finance/content/crest-model.
[11] VA Master Constructions specifications. [Online]. Available:
https://www.cfm.va.gov/til/spec.asp

132
Biographical Information
Samuel Vega-Cotto is currently Sr. Electrical Engineer at the Indian Health
Service and has being registered as a Professional Engineer for 23 years. He have vast
experience in the Research and Development, design, maintenance and construction for
power equipment within different industries. Areas of expertise includes: Modeling &
Simulation, Power System Studies, Electrical Engineering Design, Project Management,
Staff development, Quality Control, Research & Development, Corrective actions, and
redesign. Mr. Vega-Cotto have a BSEE from University of P.R., Mayaguez Campus,
MEEE from University of Idaho and a PhD in Electrical Engineering from University of
Texas at Arlington. His research efforts are conducted over the microgrid architecture
application in order to improve the power system of existing and new healthcare facilities
for American Indian and Alaska natives.
Samuel Vega-Cotto experience is diversified in different industries that includes
education, communications, pharmaceuticals, aviation, military, shipbuilding and
healthcare. Areas of electrical engineering includes maintenance, design, construction,
consultant, teaching, research and development.
In the near future, Samuel plans to continue doing research in power systems for
the US government and support research efforts of other students from the Energy
Systems Research Center with the same area of interest.