Embed Size (px)
Citation preview
Citation: Salem H, Omar MA, Derayea SM and Khalil AA. Application of TLC-Spectrodensitometric and Chemometric Methods for Determination of Momenta® Cream: A Comparative Study Applied on Ternary Mixture. Austin J Anal Pharm Chem. 2021; 8(1): 1131.
Austin J Anal Pharm Chem - Volume 8 Issue 1 - 2021ISSN : 2381-8913 | www.austinpublishinggroup.com Salem et al. © All rights are reserved
Austin Journal of Analytical and Pharmaceutical Chemistry
Open Access
Abstract
A comparative study for the validation and advancement of two analytical approaches applied for the simultaneous determination of Mometasone Furoate (MF), Miconazole Nitrate (MIC) and Gentamicin (GM) formulated in Momenta® cream. The first approach was TLC-spectrodensitometric method, which was advanced by separating the three components on TLC aluminum plates coated with silica gel 60 F254 using chloroform: methanol: formic acid (4:0.3:0.15, v/v/v) as a mobile phase, then scanned at 254nm using Camage TLC scanner 3 operated in reflectance-absorbance mode. The second approach was the chemometric method using two models: Partial Least Squares (PLS) and Principle Component Regression Model (PCR). The proposed approaches were validated according to ICH guidelines and were applied for the determination of the ternary mixtures in their analytical mixtures and pharmaceutical preparation.
Keywords: Mometasone furoate; Miconazole nitrate; Gentamicin; Momenta® cream; TLC-spectrodensitometry; PLS; PCR
IntroductionMometasone Furoate (MF) is a glucocorticoid or corticosteroid
used topically to reduce inflammation of the skin or in the airways; inflammatory skin disorders (such as eczema and psoriasis) (topical form), allergic rhinitis (such as hay fever) (topical form), and asthma (inhalation form). A review of the literature showed that methods reported for the determination of (MF) alone or in combinations were spectrophotometry [1-3], HPLC [4-15], HPTLC [7,16-18], electrochemical method [19], and LC [20]. Miconazole Nitrate (MIC) an imidazole antifungal agent that is used topically and by intravenous infusion, miconazole nitrate is the nitrate salt form of miconazole, an antifungal synthetic derivative of imidazole and used in the treatment of candidal skin infections. A review of the literature showed that methods reported for the determination of (MIC) alone or in combinations were spectrophotometry [21-28], HPLC [29-35], HPTLC [31,36-38], gas chromatography [39,40], and electrochemical methods [41]. Gentamicin (GM) is a mixture of isomeric aminoglycoside antibiotics (gentamicin C1, gentamicin C1A, and gentamicin C2) produced by Micromonospora purpurea or M. echinospora. They are broad-spectrum antibiotics, but may cause ear and kidney damage. They act to inhibit protein synthesis [42]. GM was determined alone or in combinations by variety of methods as electrochemical methods [43-47], spectrophotometry [48-51], HPLC [52-59], and LC [60-67]. There is no reported method for the determination of the three drugs together either in their ternary mixture or in the presence of their degradation products.
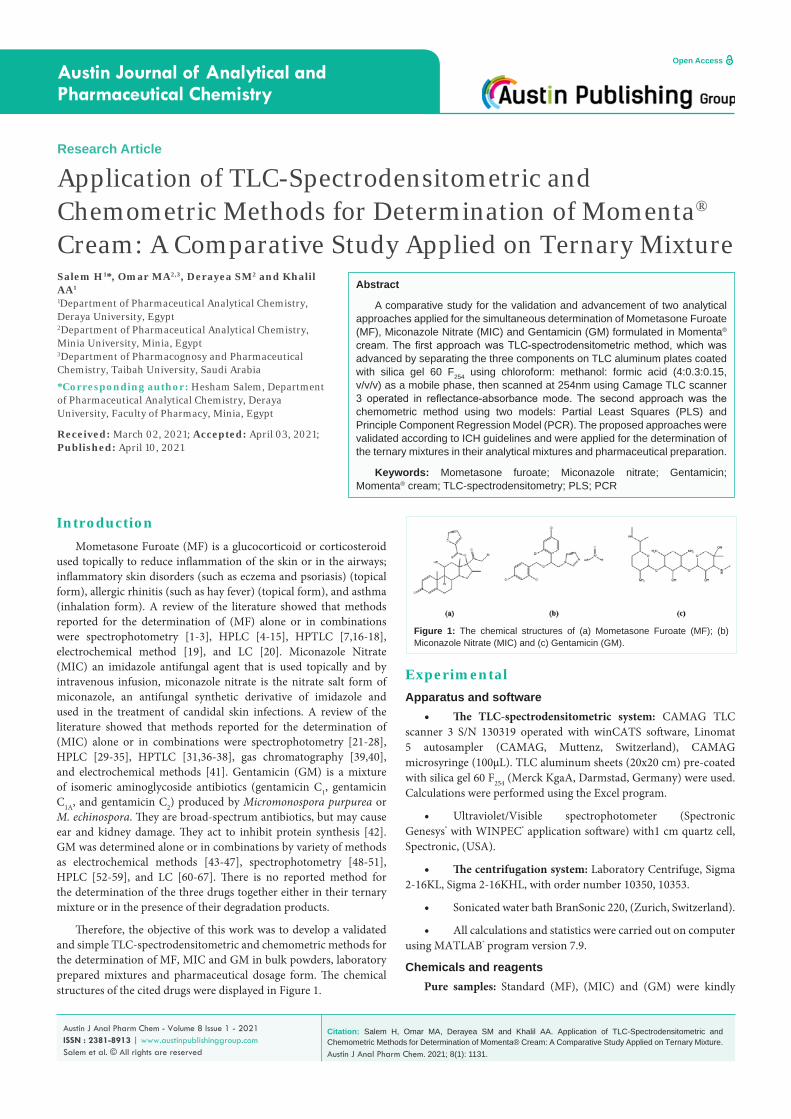
Therefore, the objective of this work was to develop a validated and simple TLC-spectrodensitometric and chemometric methods for the determination of MF, MIC and GM in bulk powders, laboratory prepared mixtures and pharmaceutical dosage form. The chemical structures of the cited drugs were displayed in Figure 1.
Research Article
Application of TLC-Spectrodensitometric and Chemometric Methods for Determination of Momenta® Cream: A Comparative Study Applied on Ternary MixtureSalem H1*, Omar MA2,3, Derayea SM2 and Khalil AA1
1Department of Pharmaceutical Analytical Chemistry, Deraya University, Egypt2Department of Pharmaceutical Analytical Chemistry, Minia University, Minia, Egypt3Department of Pharmacognosy and Pharmaceutical Chemistry, Taibah University, Saudi Arabia
*Corresponding author: Hesham Salem, Department of Pharmaceutical Analytical Chemistry, Deraya University, Faculty of Pharmacy, Minia, Egypt
Received: March 02, 2021; Accepted: April 03, 2021; Published: April 10, 2021
ExperimentalApparatus and software
• The TLC-spectrodensitometric system: CAMAG TLC scanner 3 S/N 130319 operated with winCATS software, Linomat 5 autosampler (CAMAG, Muttenz, Switzerland), CAMAG microsyringe (100µL). TLC aluminum sheets (20x20 cm) pre-coated with silica gel 60 F254 (Merck KgaA, Darmstad, Germany) were used. Calculations were performed using the Excel program.
• Ultraviolet/Visible spectrophotometer (Spectronic Genesys® with WINPEC® application software) with1 cm quartz cell, Spectronic, (USA).
• Thecentrifugationsystem:Laboratory Centrifuge, Sigma 2-16KL, Sigma 2-16KHL, with order number 10350, 10353.
• Sonicated water bath BranSonic 220, (Zurich, Switzerland).
• All calculations and statistics were carried out on computer using MATLAB® program version 7.9.
Chemicals and reagentsPure samples: Standard (MF), (MIC) and (GM) were kindly
Figure 1: The chemical structures of (a) Mometasone Furoate (MF); (b) Miconazole Nitrate (MIC) and (c) Gentamicin (GM).

Austin J Anal Pharm Chem 8(1): id1131 (2021) - Page - 02
Salem H Austin Publishing Group
Submit your Manuscript | www.austinpublishinggroup.com
donated by SIGMA Pharma Co., Quesna, Egypt. Their purity was found to be 100.08±0.39 [2], 100.17±0.13 [36], and 100.02±0.30 [48] according to reported methods, respectively.
Market sample: Momenta® cream (Jamjoom pharmaceuticals Co., Ltd., Jeddah, Saudi Arabia), labeled to contain 1mg (MF), 20mg (MIC), and 1mg (GENTA) per one gm cream (batch No. TH0101) were purchased from the Egyptian local market.
Solvents: Methanol and chloroform (Analar grade) and formic acid solution was supplied from (Adwic, El Nasr pharmaceutical Chemicals Co., Egypt).
Standard solutionsStock solutions: Solutions were prepared in methanol of
concentrations: 1mgmL-1 MF, 2mgmL-1 MIC mL-1 and in methanol and water of concentration 4mgmL-1 GM.
Working solutions: Working solutions were freshly prepared by further dilution of suitable volumes from each stock solutions with methanol to get solutions of final concentration for TLC-spectrodensitometric method, 0.5mgmL-1 MF, 1mgmL-1 MIC, and 2mgmL-1 GM; for chemometric method, 100μgmL-1 MF, 200μgmL-1 MIC, and 2000μgmL-1 GM.
ProcedureForTLC-densitometricmethod:
Chromatographic conditions: TLC aluminum sheets 20 x 20 cm pre-coated with 0.25mm silica gel 60 F254 were used. The samples were applied as bands (bandwidth: 6mm, bands were spaced 1cm apart from each other and 1.5cm from the bottom edge of the plate). The developing system used was chloroform: methanol: formic acid (4:0.3:0.15, v/v/v) as a mobile phase of total volume approximately 10 milliliters. Linear ascending development was done in a chromatographic tank previously saturated with the developing system for 15min. at room temperature (25±2 ºC) to a distance of approximately 8cm from the lower edge (approximately 10min). The developed plates were dried in air for approximately 5min. and scanned at 254nm. The detection was done using Camage TLC scanner 3 operated in the reflectance-absorbance mode. The slit dimension was kept at 3mm x 0.45mm and the scanning speed was 20mm/s. All measurements were performed by winCATS software.
Application to pharmaceutical preparation: A four-gram portion of cream was transferred to a 50mL volumetric flask, taking care to avoid sticking cream to the walls of the volumetric flask. A 30mL portion of methanol and 10mL portion of water was added to the flask, and the cream was allowed to melt by warming at 60oC in a water bath with constant shaking. The solution was allowed to cool to room temperature. The volume was made up to the mark with methanol and mixed. The solution was centrifuged at 10000rpm for 10min, and a clear supernatant solution was obtained. A portion of the supernatant was diluted with methanol to obtain a final concentration 40μgmL-1 of MF, 800μgmL-1 of MIC, and 40μgmL-1 of GM.
Linearity and construction of calibration curves: Aliquot volumes (1-12 μg band-1) of MF, (20-45 μg band-1) of MIC and (1-6 μg band-1) of GM were separately transferred from their working solutions into 10mL volumetric flasks and diluted to volume with methanol. Aliquot of 10μL of each solution was applied to the TLC
plate using a 100μL syringe. The chromatographic conditions were applied and the chromatograms were recorded. The calibration curves were constructed by plotting the recorded peak area versus the corresponding drug concentrations, from which the regression equations were calculated. The calibration curves were made from the average of three experiments.
Forchemometricmethod:
Construction of calibration Set: Multilevel partial factorial design [68] was used for the construction of the calibration and validation sets. A five-level, five-factor calibration design was used. Thirteen mixtures were used for building the calibration model. The laboratory-prepared mixtures of MF, MIC and GM were prepared within their corresponding concentration ranges. The absorption spectra of the prepared mixtures were recorded in the range of 200-400 nm and transferred to Matlab® for subsequent data manipulation.
Applicationtovalidationset: Into a series of 10mL volumetric flask, accurate aliquots of each component were transferred from their working solutions to prepare twelve mixtures containing different ratios of the cited drugs. The spectra of the prepared solutions from 200 to 400 nm were recorded and transferred to Matlab®. The concentration of each component was calculated using the constructed model.
Application to pharmaceutical preparation: As described before, then the solution was centrifuged at 10000rpm for 10min, and a clear supernatant solution was obtained. Further dilution was done to obtain a final concentration 40μgmL-1 of MF, 800μgmL-1 of MIC, and 40μgmL-1 of GM.
The concentration of each component was calculated using the constructed PCR and PLS models. When carrying out the standard addition technique, different known concentrations of the pure standard of each drug were added to the pharmaceutical dosage form before proceeding in the previously mentioned procedure.
Results and DiscussionThis work was aimed to develop, and validate simple, accurate,
selective, and precise analytical approaches which were TLC-spectrodensitometric and chemometric methods, for the simultaneous assessment of the ternary mixture of MF, MIC, and GM in their pure form and pharmaceutical dosage form.
TLC-densitometryThis approach offers a simple manner for quantification directly
on TLC plate by calculating the optical density of the separated bands. The amounts of compounds are determined by comparing to a standard curve from reference materials chromatographed simultaneously under the same circumstances.
Optimization of the method: To optimize the approach conditions, it was necessary to test the effect of different variables. In order to separate the three drugs from each other’s, several ratios of different developing systems were investigated. Certainly, it was established that the best separation of the cited drugs was achieved by applying the developing system using chloroform: methanol: formic acid (4:0.3:0.15, v/v/v). Rf for MF, MIC, and GENTA were 0.30 ± 0.01, 0.52±0.02, and 0.03±0.01, respectively. Different scanning

Austin J Anal Pharm Chem 8(1): id1131 (2021) - Page - 03
Salem H Austin Publishing Group
Submit your Manuscript | www.austinpublishinggroup.com
wavelengths were tried; on using 245 nm where the separated peaks were sharp and symmetrical with minimum noise, as shown in Figure 2.
Methodvalidation:Method validation was performed according to the International Conference on Harmonization (ICH) guidelines [69] regarding linearity, range, precision, and accuracy, limit of detection and limit of quantitation.
Range and linearity: The linearity of the suggested method was assessed by preparing different calibration curves. Analysis was carried out on a series of standard drug solutions, the calibration curves were constructed between AUC and corresponding concentrations of bands. Linear regression analysis was applied and
analytical parameters were calculated. The linear ranges were found to be 1-12 μg band-1, 20-45 μg band-1, and 1-6 μg band-1 for MF, MIC, and GM, respectively. The method at a good linearity and indicated by the values of correlation coefficient. The linear concentration ranges and other statistical parameters for the proposed method were listed in Table 1.
Limits of detection and quantitation: The Limit of Detection (LOD) and Limit of Quantitation (LOQ) of the proposed method were calculated, for drugs using a ratio of 3.3 and 10 standard deviations of the blank and the slope of the calibration line, Table 1. The limits of detection were calculated as SD×3.3/slope. Whereas, Limits of quantitation were calculated as SD×10/slope.
Accuracy: For the study of the accuracy of the suggested method, repeated analysis (three times) of different concentrations of MF, MIC, and GM within the linearity range were performed. The accuracy asserted as percentage recoveries and Standard Deviations (SD) (Table 1). By applying standard addition technique to the pharmaceutical formulation, the conflict of excipients was studied. The acceptable accuracy demonstrated that the excipients in the pharmaceutical formulation did not interfere in the analysis of these compounds in the pharmaceutical formulation (Table 2).
Figure 2: (A) 2D-TLC chromatogram; (B) 3D-TLC chromatogram of (a) 0.4μg band-1 of GM, (b) 24μg band-1 of MF, and (c) 4μg band-1 of MIC, using chloroform: methanol: formic acid (4:0.3:0.15, v/v/v) as the developing system.
Parameter MF MIC GM
Concentration range (μg band-1) 1 - 12 20 - 45 1 - 6
Slope 4.7103 1.9829 5.0829Standard deviation of the slope (SDb)
0.0664 0.0201 0.0327
Intercept 157.7 290.39 69.76Standard deviation of the intercept (SDa)
0.4764 0.6743 0.1274
Standard deviation of the residuals (SDy/x) 0.5968 0.4198 0.1368
Number of determinations 6 6 6
Accuracy 100.34 ± 1.48
100.00 ± 0.34
100.29 ± 0.97
Correlation coefficient (r) 0.9996 0.9998 0.9999
Determination coefficient (r2) 0.9992 0.9996 0.9998
Limit of detection, LOD (μg band-1) 0.3338 1.1222 0.0827Limit of quantitation, LOQ (μg band-1) 1.0114 3.4006 0.2506
Table 1: Assay parameters and method validation sheet obtained by applying the proposed TLC-spectrodensitometric method for determination of MF, MIC, and GM in ternary mixture.
Figure 3: RMSECV of the calibration set of MF, MIC, and GM as a function of latent variables of (a) PCR and (b) PLS models.

Austin J Anal Pharm Chem 8(1): id1131 (2021) - Page - 04
Salem H Austin Publishing Group
Submit your Manuscript | www.austinpublishinggroup.com
Precision: The inter-day and intra-day precision of the proposed method were determined by the analysis of three distinct concentrations of each component, within the linearity range, by three replicate analyses of three pure samples of both drugs on a single day and three ensuing days, for the inter-day and intra-day precisions, respectively. The results expressed as mean percentage recoveries and RSD (Table 3).
Selectivity: Selectivity was confirmed by analyzing different mixtures containing drugs in different ratios within the linearity range. Satisfactory results were shown in Table 4. The conflict of excipients in the pharmaceutical formulations were studied by applying
standard addition method to the pharmaceutical formulation Table 2; which did not interfere in the analysis of these compounds in the pharmaceutical formulation.
Systemsuitability:System suitability was checked by calculating different parameters (Table 5). The obtained values were in the acceptable ranges when compared to the reference values [70].
TLC–densitometry PLS
Taken in μg band-1 Found in μg band-1 Recovery%* Taken in μg band-1 Found in μg band-1 Recovery%*
MF 5 5.02 100.35 20 20.03 100.15
MIC 25 24.88 99.5 40 40 100
GM 4 4 100.11 30 30.01 100.03
Table 2: Application of standard addition technique to the analysis of Momenta® cream by applying the proposed methods.
*Average of three experiments.
Drug Conc. Level (µg mL-1) *% Recovery ± SD %RSD
Inter-day
MF
5 99.67 ± 0.59 0.59
7 99.85 ± 0.60 0.6
9 100.67 ± 0.18 0.18
MIC
25 99.74 ± 0.54 0.54
30 100.58 ± 0.22 0.22
35 99.55 ± 0.30 0.3
GM
3 99.32 ± 1.19 1.2
4 100.13 ± 0.41 0.41
5 99.87 ± 0.59 0.59
Intra-day
MF
5 99.69 ± 0.55 0.55
7 100.32 ± 0.31 0.31
9 99.93 ± 0.39 0.39
MIC
25 99.55 ± 0.68 0.68
30 100.18 ± 0.26 0.26
35 99.71 ± 0.54 0.54
GM
3 100.45 ± 0.40 0.4
4 99.53 ± 0.49 0.49
5 100.08 ± 0.31 0.31
Table 3: Application of Intra-day and Inter-day technique to the analysis of MF, MIC, and GM in Momenta® cream by the proposed TLC–spectrodensitometric method.
*Average of three experiments.
Mix ratio MF MIC GM
1 1:10:02 99.75 ± 0.57 100.54 ± 1.20 99.90 ± 0.98
2 1:04:01 99.75 ± 0.69 99.97 ± 0.98 100.09 ± 1.05
3 2:05:01 99.00 ± 1.05 99.95 ± 0.95 99.59 ± 0.79
4 1:20:1* 99.51 ± 0.77 100.59 ± 0.95 99.90 ± 1.05
5 3:05:01 100.54 ± 0.77 99.89 ± 0.89 99.00 ± 0.99
Table 4: Determination of MF, MIC, and GM in laboratory prepared mixtures by the proposed TLC-spectrodensitometric method.
*Ratio in Momenta® cream.
Parameter MF MIC GM Reference value
Rf value 0.30 ± 0.01 0.52 ± 0.02 0.03 ± 0.01
T (tailing factor) 0.91 0.9 0.87T≤ 1.15 - 0.95 & T = 1 for symmetric
peakRs (experimental
resolution) 2.66 3.42 1.72 Rs >1.5
Table 5: System suitability parameters of the proposed TLC-spectrodensitometric method of MF, MIC and GM in Momenta® cream.
Experimental No.Concentration (µg mL-1)
MF MIC GM
1 6 12 6
2 10 10 4
3 4 14 10
4 6 14 4
5 4 12 4
6 8 11 10
7 10 13 8
8 6 13 10
9 10 12 10
10 2 14 8
11 8 10 2
12 6 10 8
13 8 12 8
14 4 13 2
15 4 10 6
Table 6: Concentration of MF, MIC, and GM in the calibration set using PCR and PLS models.
Validation parametersPCR PLS
MF MIC GM MF MIC GM
Slope 0.9997 1.0541 0.9701 0.9351 0.9054 1.0451
Intercept 0.2534 0.0981 0.1535 0.1234 0.2157 0.7311Correlation coefficient
(r) 0.9999 0.9996 0.9997 0.9995 0.9999 0.9999
RMSEP 0.259 0.095 0.141 0.053 0.155 0.094
Table 7: Summary of results obtained by applying the diagnostic tools for model validation of the PCR and PLS models with MF, MIC, and GM.

Austin J Anal Pharm Chem 8(1): id1131 (2021) - Page - 05
Salem H Austin Publishing Group
Submit your Manuscript | www.austinpublishinggroup.com
Chemometric methodAmong the different regression methods existing for multivariate
calibration, the factor analysis based on Principal Component Regression Model (PCR) and Partial Least Squares (PLS) regression have received considerable attention in the chemometrics literature [71]. PCR predates PLS. In cases where only partial knowledge of components is present, PCR and PLS can work well. PCR assumes that error is only in the instrumental response and concentration matrix is error-free, while PLS assumes that error is equally distributed between concentration matrix and instrumental response (spectral) matrix. Thus, PLS produces more robust model as it removes noise from both absorbance and concentration data [72].
The calibration set was constructed using the absorption spectra set of 15 mixtures, as listed in Table 6. The initial models were found to give bad results, so the regions below 205 and above 300nm were rejected. Cross-validation methods leaving out one sample at a time was employed. The Root Mean Squares Error of Cross-Validation (RMSECV) was calculated which is used as a diagnostic test for examining the errors in the predicted concentrations. It indicated both precision and accuracy of predictions. The selected model was that with the smallest number of factors such that RMSECV for that model was not significantly greater than RMSECV from the model with additional factor. Four factors were found to be optimum for the mixture, as shown in Figure 3 for PCR and PLS.
Modelvalidation: To assess the prediction ability of the suggested models, an external validation set of 12 mixtures was used as listed in Table 6. The predicted concentrations were compared with the true concentrations of each component in each sample. The Root Mean Squared Errors of Prediction (RMSEP) and the regression equations for the predicted versus actual concentration are listed in Table 7 as diagnostic tools for model validation. The results indicated the higher predictive ability of the PLS model than that of PCR model to analyze the laboratory-prepared mixtures (validation set) within the accepted range, as shown in Table 7, where PCR was unable to interpret this complex model, as it might require a larger number of samples for accurate calibration. The proposed model was also applied for the determination of Momenta® cream, and the validity of the proposed procedures was further assessed by applying the standard addition technique showing no excipients interference. The results obtained are shown in Table 2.
Statistical analysisTable 8 showed statistical comparison of the results obtained by
the proposed methods and reported methods for MF [7], MIC [36], and GM [48] for TLC-spectrodensitometric method, and official method {-} for chemometric method. The calculated t and F values were less than the theoretical ones indicating that there was no significant difference between the proposed and the official methods with respect to accuracy and precision.
ConclusionThis work presented a comparative study on two analytical
techniques based on UV spectrophotometry which were TLC-densitometric method and chemometric-assisted spectrophotometric method (PLS) and (PCR). Both techniques were successfully applied for the simultaneous estimation of the ternary mixture of MF, MIC, and GM in their pure form and topical pharmaceutical formulation. The TLC-densitometric method has the advantage over HPLC methods as it minimizes the usage of reagents which supports the eco-friendly behavior of green chemistry, it minimizes the time required for analysis, and it utilizes the merit of applying several sample bands on TLC plate, which may be more advantageous for regulatory quality control laboratories. In addition, the method is inexpensive and does not require certain types of stationary phases, but still, the method fulfills the same validation parameters and efficiency when compared to reported HPLC method. Meanwhile, the chemometric method has the advantage of being simpler as it does not require special reagents or chemicals, and it is considered to be time- and cost-saving, but it requires a special software (Matlab). It was found that PLS preceded PCR in the analysis of such complex mixtures. As a final conclusion, the results obtained by the two proposed methods were reliable, accurate, and precise. Hence, both methods can be employed for routine quality control analysis as alternative methods to different HPLC techniques in quality control laboratories lacking the required facilities for those expensive techniques.
References1. HA Merey, SS El-Mosallamy, NY Hassan, BA El-Zeany. Spectrophotometric
and Chemometric Study for the Simultaneous Determination of Mometasone Furoate and Miconazole Nitrate in the presence of Pharmaceutical Dosage Form Additive. Analytical Chemistry Letters. 2016; 6: 70-85.
2. HD Patel, MM Patel. Development and validation of UV spectrophotometric method for simultaneous estimation of terbinafine hydrochloride and mometasone furoate in combined dosage form. Asian Journal of Research in Chemistry. 2013; 6: 29-34.
3. El-Bagary R, Fouad MA, El-Shaal MA, Enas HT. Derivative, derivative of the ratio spectrophotometric and stability-indicating RP-HPLC methods for the determination of mometasonefuroate and miconazole nitrate in cream. J Chem Pharm. Res. 2013; 5: 368.
ParameterMF MIC GM
Reported Method TLC PLS Reported Method TLC PLS Reported Method TLC PLS
Mean 100.1 100.34 - 100.17 100 - 100.02 100.29 -
Standard Deviation (SD) 1.039 1.48 - 0.13 0.34 - 0.3 0.97 -
N 7 0 - 3 6 - 3 6 -
Variance 1.08 2.19 - 0.0169 0.1156 - 0.09 0.94 -
Student, t 0.33(2.228) - 1.08
(2.306) - 0.62(2.306) -
F 2.03(4.39) - 6.84
(19.3) - 10.44(19.3) -
Table 8: Statistical comparison between the results obtained by the proposed TLC-spectrodensitometric method and the reported methods for the determination of MF, MIC and GM in pure powder form.
Austin J Anal Pharm Chem 8(1): id1131 (2021) - Page - 06
Salem H Austin Publishing Group
Submit your Manuscript | www.austinpublishinggroup.com
4. AG Arintowibowo, R Sumiyani, K Hendrajaya. Validation of Mometasone furoate and CIP100 Residue Analysis Methods after Cleaning of Production Equipment in the “XYZ” Pharmaceutical Industry. Journal Kimia Sains dan Aplikasi. 2019; 22: 150-156.
5. AS Coelho, RG Arribada, E Lages. Cleaning validation for residual estimation of mometasone furoate on stainless steel surface of pharmaceutical manufacturing equipment using a UHPLC-UV method. PDA journal of pharmaceutical science and technology. 2020; 74: 41-48.
6. RI El-Bagary, MA Fouad, A Manal, EH Tolba. Forced degradation of mometasone furoate and development of two RP-HPLC methods for its determination with formoterol fumarate or salicylic acid. Arabian Journal of Chemistry. 2016; 9: 493-505.
7. HA Merey, SS El-Mosallamy, NY Hassan, BA El-Zeany. Validated chromatographic methods for the simultaneous determination of Mometasone furoate and Formoterol fumarate dihydrate in a combined dosage form. Bulletin of Faculty of Pharmacy, Cairo University. 2016; 54: 99-106.
8. PB Modi, NJ Shah. DoE Approach: A Stability Indicating RP-HPLC Method for Simultaneous Estimation of Methylparaben, Mometasone furoate and Eberconazole nitrate in Topical Formulations. Journal of Applied Pharmaceutical Science. 2014; 4: 020-025.
9. C Roy, J Chakrabarty. Stability-indicating validated novel RP-HPLC method for simultaneous estimation of methylparaben, ketoconazole, and mometasone furoate in topical pharmaceutical dosage formulation. ISRN Analytical Chemistry. 2013; 2013.
10. C Roy, J Chakrabarty. Development and validation of a stability-indicating RP-HPLC method for the simultaneous determination of phenoxyethanol, methylparaben, propylparaben, mometasone furoate, and tazarotene in topical pharmaceutical dosage formulation. Scientia pharmaceutica. 2013; 81: 951-968.
11. KA Shaikh, AT Patil. Stability-indicating HPLC method for the determination of mometasone furoate, oxymetazoline, phenyl ethanol and benzalkonium chloride in nasal spray solution. Journal of Trace Analysis in Food and Drugs. 2013; 1: 14-21.
12. RI El-Bagary, EF Elkady, MH Tammam, AA Elmaaty. Simultaneous determination of miconazole and hydrocortisone or mometasone using reversed phase liquid chromatography. European Journal of Chemistry. 2012; 3: 421-425.
13. K Srinivasarao, V Gorule, R Chvenkata. Validated method development for estimation of formoterol fumarate and mometasone furoate in metered dose inhalation form by high performance liquid chromatography. J Anal Bioanal Tech. 2012; 3: 1e4.
14. S Shaikh, M Muneera, O Thusleem, M Tahir, AV Kondaguli. A simple RP-HPLC method for the simultaneous quantitation of chlorocresol, mometasone furoate, and fusidic acid in creams. Journal of chromatographic science. 2009; 47: 178-183.
15. XW Teng, K Foe, KF Brown, DJ Cutler, NM Davies. High-performance liquid chromatographic analysis of mometasone furoate and its degradation products: Application to in vitro degradation studies. Journal of pharmaceutical and biomedical analysis. 2001; 26: 313-319.
16. V Vichare, VP Choudhari, MV Reddy. Study of Intrinsic Stability of Mometasone Furoate in Presence of Salicylic Acid by HPTLC and Characterization, Cytotoxicity Testing of Major Degradation Product of Mometasone Furoate. Current Pharmaceutical Analysis. 2019; 15: 592-603.
17. KG Patel, PM Shah, PA Shah, TR Gandhi. Validated high-performance thin-layer chromatographic (HPTLC) method for simultaneous determination of nadifloxacin, mometasone furoate, and miconazole nitrate cream using fractional factorial design. Journal of food and drug analysis. 2016; 24: 610-619.
18. KA Shah, JB Dave. Development and Validation of RP-HPLC and HPTLC Methods for Simultaneous Estimation of Mometason Furoate and Miconazole Nitrate in Cream Formulation. World j. pharm. and Pharm. Sci. 2015; 4: 1156-1172.
19. RN Goyal, D Kaur, B Agrawal, SK Yadav. Electrochemical investigations of mometasone furoate, a topical corticosteroid, in micellar medium. Journal of
Electroanalytical Chemistry. 2013; 695: 17-23.
20. S Wu, A Jia, KD Daniels, M Park, SA Snyder. Trace analysis of corticosteroids (CSs) in environmental waters by liquid chromatography-tandem mass spectrometry. Talanta. 2019; 195: 830-840.
21. T Eticha, G Kahsay, T Hailu, T Gebretsadikan, F Asefa, H Gebretsadik, et al. Development and Validation of an Extractive Spectrophotometric Method for Miconazole Nitrate Assay in Pharmaceutical Formulations. Journal of analytical methods in chemistry. 2018; 2018.
22. AA Gouda, RE Sheikh, AS Amin, SH Ibrahim. Optimized and validated spectrophotometric determination of two antifungal drugs in pharmaceutical formulations using an ion-pair complexation reaction. Journal of Taibah University for Science. 2016; 10: 26-37.
23. Abou-elkheir A, Saleh HM, El-Henawee MM, Ghareeb BS. Spectrophotometric determination of miconazole nitrate and betamethasone valerate in bulk powder and in topical cream. Indo American J Pharm Res. 2014; 4: 5507-5519.
24. HM Heneedak, I Salama, S Mostafa, M El-Sadek. HPLC and chemometric methods for the simultaneous determination of miconazole nitrate and nystatin. Journal of chromatographic science. 2012; 50: 855-861.
25. N Alizadeh, R Ansari, RN Khaledi. Extractive spectrophotometric determination of miconazole nitrate in pure and pharmaceutical preparation. Journal of Pharmaceutical & Health Sciences. 2012; 1: 45-52.
26. S Kadam, MV Janjale, S Akole, S Bhosale. Application of mixed hydrotropic solubilization technique for simultaneous spectrophotometric estimation of metronidazole and miconazole nitrate from different pharmaceutical dosage forms, Int. J. Pharm. Biol. Arch. 2012; 3: 383-390.
27. RJ Ekiert, J Krzek. Determination of azole antifungal medicines using zero-order and derivative UV spectrophotometry. Acta Pol. Pharm. 2009; 66: 19-24.
28. N Erk, ML Altun. Spectrophotometric resolution of metronidazole and miconazole nitrate in ovules using ratio spectra derivative spectrophotometry and RP-LC, Journal of pharmaceutical and biomedical analysis. 2001; 25: 115-122.
29. N Bounoua, K Sekkoum, M Gumustas, N Belboukhari, SA Ozkan. Development of stability indicating HPLC method for the separation and validation of enantiomers of miconazole. Chirality. 2018; 30: 807-815.
30. S Kumaravel, P Shanmugapandiyan. New validated stability indicating gradient RP-HPLC method for the assay & related substances of miconazole nitrate and assay of benzoic acid in miconazole nitrate 2.0% w/w gel. International Journal of Pharma and Bio Sciences. 2017; 8: 308-312.
31. Salama I, Gomaa MS. Comparative determination of miconazole, nystatin, hydrocortisone and neomycin by HPTLC/HPLC-DAD. European Journal of Chemistry. 2013; 4: 29-34.
32. TS Belal, RS Haggag. Gradient HPLC-DAD stability indicating determination of miconazole nitrate and lidocaine hydrochloride in their combined oral gel dosage form. Journal of chromatographic science. 2012; 50: 401-409.
33. MM De Zan, MS Cámara, JC Robles, SV Kergaravat, HC Goicoechea. Development and validation of a simple stability-indicating high performance liquid chromatographic method for the determination of miconazole nitrate in bulk and cream formulations. Talanta. 2009; 79: 762-767.
34. S Yan-ling. Simultaneous determination of two main components in compound miconazole nitrate cream by RP-HPLC. Chinese Journal of Antibiotics. 2005; 30: 597.
35. C Akay, SA Özkan, Z Şentürk, Ş Cevheroğlu. Simultaneous determination of metronidazole and miconazole in pharmaceutical dosage forms by RP-HPLC. Il Farmaco. 2002; 57: 953-957.
36. PS Malani, HA Raj, VC Jain. Development and validation of analytical method for simultaneous estimation of miconazole nitrate and clobetasol propionate in cream by HPTLC method. Pharma Science Monitor. 2014; 5: 386-399.
37. DB Meshram, SB Bagade, MR Tajne. Simultaneous determination of metronidazole and miconazole nitrate in gel by HPTLC. Pakistan journal of pharmaceutical sciences. 2009; 22: 323-328.
Austin J Anal Pharm Chem 8(1): id1131 (2021) - Page - 07
Salem H Austin Publishing Group
Submit your Manuscript | www.austinpublishinggroup.com
38. BA Mousa, NM El-Kousy, RI El-Bagary, NG Mohamed. Stability indicating methods for the determination of some anti-fungal agents using densitometric and RP-HPLC methods. Chemical and Pharmaceutical Bulletin. 2008; 56: 143-149.
39. S Ashour, N Kattan. Simultaneous determination of miconazole nitrate and metronidazole in different pharmaceutical dosage forms by gas chromatography and flame ionization detector (GC-FID). International journal of biomedical science: IJBS. 2010; 6: 13-18.
40. R Ekiert, J Krzek, J Czekaj, U Hubicka. Evaluation of a CGC-FID method for qualitative and quantitative analysis of azole antifungal drugs. Acta Chromatographica. 2009; 21: 273-282.
41. FC Pereira, NR Stradiotto, MVB Zanoni. Voltammetric characteristics of miconazole and its cathodic stripping voltammetric determination. Anais da Academia Brasileira de Ciências. 2002; 74: 425-432.
42. LS Goodman, A Gilman, LL Brunton. Goodman & Gilman’s manual of pharmacology and therapeutics. McGraw-Hill Medical, New York. 2008.
43. JM Almeida, CA Toloza, BS Machado, AR da Silva, RQ Aucelio. Determination of gentamicin sulfate by batch-injection amperometry after solid-phase extraction using a kanamycin-template imprinted polymer. Microchemical Journal. 2019; 145: 187-195.
44. M Ghasemi, A Khataee, P Gholami, RDC Soltani. Template-free microspheres decorated with Cu-Fe-NLDH for catalytic removal of gentamicin in heterogeneous electro-Fenton process. Journal of environmental management. 2019; 248: 109236.
45. Z Shen, L He, Y Cao, F Hong, K Zhang, F Hu, et al. Multiplexed electrochemical aptasensor for antibiotics detection using metallic-encoded apoferritin probes and double stirring bars-assisted target recycling for signal amplification. Talanta. 2019; 197: 491-499.
46. O Petrukhin, M Kostitsyna, T Dzherayan, E Shipulo, E Vladimirova, A Dunaeva. Complexation of aminoglycoside antibiotics with metal cations as a derivatization reaction: Determination of gentamicin by equilibrium electrochemical and spectrophotometric methods. Journal of Analytical Chemistry. 2009; 64: 951-957.
47. C Ghinami, V Giuliani, A Menarini, F Abballe, S Travaini, T Ladisa. Electrochemical detection of tobramycin or gentamicin according to the European Pharmacopoeia analytical method. Journal of Chromatography A. 2007; 1139: 53-56.
48. J Krzek, H Woltyńska, U Hubicka. Determination of gentamicin sulphate in injection solutions by derivative spectrophotometry. Analytical Letters. 2009; 42: 473-482.
49. AM El-Didamony, AS Amin, AK Ghoneim, AM Telebany. Indirect spectrophotometric determination of gentamicin and vancomycin antibiotics based on their oxidation by potassium permanganate. Central European Journal of Chemistry. 2006; 4: 708-722.
50. JM Fernández-Ramos, AM García-Campaña, F Alés-Barrero, JM Bosque-Sendra. Determination of gentamicin in pharmaceutical formulations using peroxyoxalate chemiluminescent detection in flow-injection analysis. Talanta. 2006; 69: 763-768.
51. P Frutos, S Torrado, M Perez-Lorenzo, G Frutos. A validated quantitative colorimetric assay for gentamicin. Journal of pharmaceutical and biomedical analysis. 2000; 21: 1149-1159.
52. SL Chauhan. Analysis of aminoglycoside residues in milk by high performance liquid chromatography. 2019; 8.
53. X Sun, Y Yang, Q Tian, D Shang, J Xing, Y Zhai. Determination of gentamicin C components in fish tissues through SPE-Hypercarb-HPLC-MS/MS. Journal of Chromatography B. 2018; 1093: 167-173.
54. X Wang, S Yang, Y Li, J Zhang, Y Jin, W Zhao, et al. Optimization and application of parallel solid-phase extraction coupled with ultra-high performance liquid chromatography-tandem mass spectrometry for the determination of 11 aminoglycoside residues in honey and royal jelly. Journal of Chromatography A. 2018; 1542: 28-36.
55. C Zhang, J Hu, F Sun, M Jia, G Chen, C Wu, et al. Determination of four main
components of gentamicin in animal tissues after solid-phase extraction by high-performance liquid chromatography/tandem mass spectrometry. Rapid Communications in Mass Spectrometry. 2018; 32: 1766-1772.
56. Joseph A, Rustum A. Development and validation of a RP-HPLC method for the determination of gentamicin sulfate and its related substances in a pharmaceutical cream using a short pentafluorophenyl column and a charged aerosol detector. Journal of pharmaceutical and biomedical analysis. 2010; 51: 521-531.
57. L Zupančič-Kralj. Identification of gentamicin impurities by liquid chromatography tandem mass spectrometry. Journal of pharmaceutical and biomedical analysis. 2009; 50: 1037-1043.
58. IT Somé, R Semde, O Moustapha, K Amighi, PI Guissou, P Duez, et al. Validation of gentamicin congeners using HPLC with electrochemical detection: comparison with fluorimetric detection. Comptes Rendus Chimie. 2004; 7: 1087-1093.
59. BH Kim, SC Lee, HJ Lee, JH Ok. Reversed-phase liquid chromatographic method for the analysis of aminoglycoside antibiotics using pre-column derivatization with phenylisocyanate. Biomedical Chromatography. 2003; 17: 396-403.
60. MC Gaudiano, L Valvo, AL Rodomonte. A Q-TOF LC/MS method for identification and quantitation of Histamine in the antibiotic Gentamicin at ppm level: Validation and uncertainty evaluation. Journal of pharmaceutical and biomedical analysis. 2019; 162: 158-163.
61. S Chopra, V Manyanga, J Hoogmartens, E Adams. LC with electrochemical and UV detection for analysis of a formulation containing gentamicin and parabens. Analytical Methods. 2013; 5: 2491-2496.
62. B Li, A Van Schepdael, J Hoogmartens, E Adams. Mass spectrometric characterization of gentamicin components separated by the new European Pharmacopoeia method. Journal of pharmaceutical and biomedical analysis. 2011; 55: 78-84.
63. K Vučićević-Prčetić, R Cservenak, N Radulović. Development and validation of liquid chromatography tandem mass spectrometry methods for the determination of gentamicin, lincomycin, and spectinomycin in the presence of their impurities in pharmaceutical formulations. Journal of pharmaceutical and biomedical analysis. 2011; 56: 736-742.
64. V Manyanga, K Kreft, B Divjak, J Hoogmartens, E Adams. Improved liquid chromatographic method with pulsed electrochemical detection for the analysis of gentamicin. Journal of Chromatography A. 2008; 1189: 347-354.
65. DN Heller, JO Peggins, CB Nochetto, ML Smith, OA Chiesa, K Moulton. LC/MS/MS measurement of gentamicin in bovine plasma, urine, milk, and biopsy samples taken from kidneys of standing animals. Journal of Chromatography B. 2005; 821: 22-30.
66. D Löffler, TA Ternes. Analytical method for the determination of the aminoglycoside gentamicin in hospital wastewater via liquid chromatography-electrospray-tandem mass spectrometry. Journal of Chromatography A. 2003; 1000: 583-588.
67. Posyniak, J Zmudzki, J Niedzielska. Sample preparation for residue determination of gentamicin and neomycin by liquid chromatography. Journal of Chromatography A. 2001; 914: 59-66.
68. RG Berereton. Chemometrics: Data Analysis for the Laboratory and Chemical Plant, USA: John Wiley & Sons, Ltd. 2003.
69. IHT. Guideline, Validation of analytical procedures: text and methodology Q2 (R1), in: International conference on harmonization, Geneva, Switzerland. 2005: 11-12.
70. Validation of Chromatographic Methods - Reviewer Guidance. Center for Drug Evaluation and Research - FDA. 1994.
71. AS Fayed, MA Shehata, A Ashour, NY Hassan, SA Weshahy. Validated stability-indicating methods for determination of cilostazol in the presence of its degradation products according to the ICH guidelines. Journal of pharmaceutical and Biomedical Analysis. 2007; 45: 407-416.
72. B Hemmateenejad, M Akhond, F Samari. Spectrochimica Acta Part A: Molecular and Biomolecular Spectroscopy. 2007; 67: 958-965.