Embed Size (px)
Citation preview
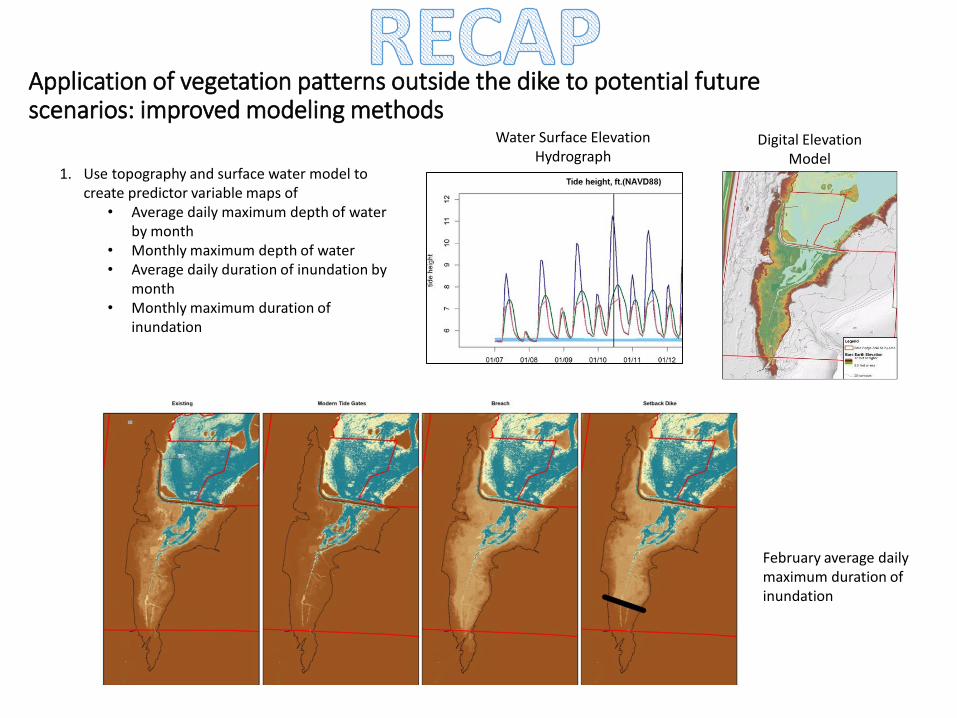
Application of vegetation patterns outside the dike to potential future scenarios: improved modeling methods
1. Use topography and surface water model to create predictor variable maps of
• Average daily maximum depth of water by month
• Monthly maximum depth of water• Average daily duration of inundation by
month• Monthly maximum duration of
inundation
Water Surface Elevation Hydrograph
Digital Elevation Model
February average daily maximum duration of inundation

Application of vegetation patterns outside the dike to potential future scenarios: results… 7 class predictions

Duration of inundation… multiple tide gate closure settings

Frequency of tidal inundation… multiple tide gate closure settings
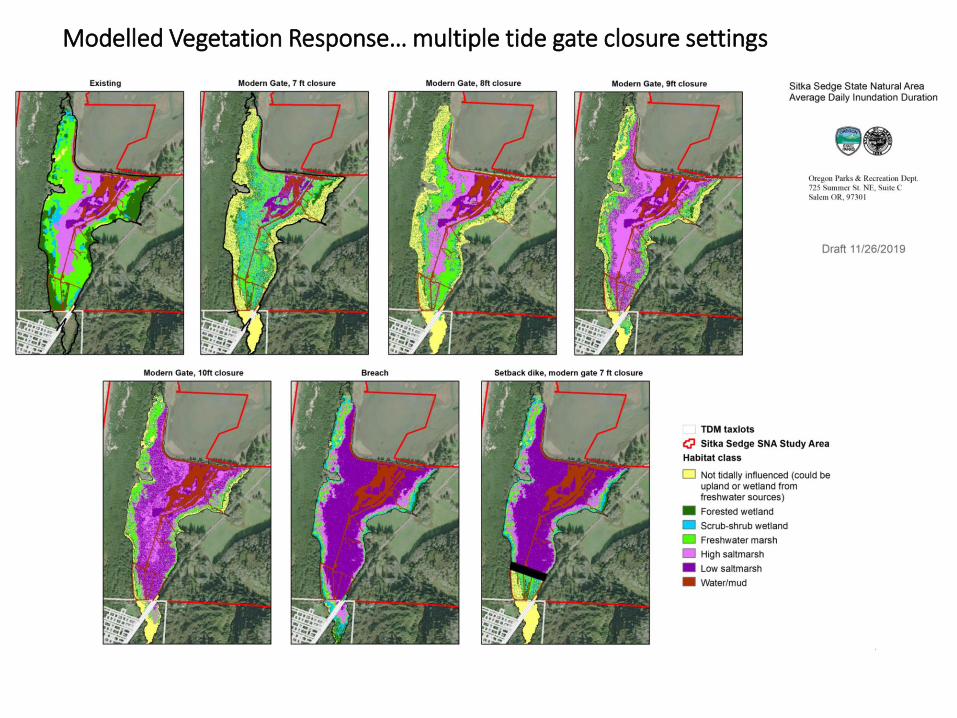
Modelled Vegetation Response… multiple tide gate closure settings

Application of vegetation patterns outside the dike to potential future scenarios: results
0.0
5.0
10.0
15.0
20.0
25.0
30.0
35.0
40.0
45.0
50.0
Mu
d/w
ater
Low
sal
tmar
sh
Hig
h s
altm
arsh
Fres
hw
ate
r m
arsh
Scru
b-s
hru
b
Fore
sted
we
tlan
d
No
t ti
dal
ly in
flu
en
ced
Acr
es
Habitat quantity comparisons
Existing Modern gates 7ft Modern gates 8ft Modern gates 9ft
Modern gates 10ft Breach Setback

Application of vegetation patterns outside the dike to potential future scenarios: results

Study Limitations
• This is just an approximation to give an idea of potential change
• Surface water model based only – does not incorporate currently unknown groundwater discharge locations
• Cannot predict locations or abundance of potential future influences like beaver dams, woody debris, etc.
• Based on LiDAR, not absolute elevation of the rooted area of vegetation
• Relatively short-term – does not explicitly incorporate sea level rise, accretion, subsidence, erosion
• Succession – habitats change over time through colonization and competition. Things won’t be static. The predictions depicted in the maps for freshwater habitats are approximately mid-successional (which is often the average condition in areas prone to periodic disturbances).
• Model improvement would be expected by incorporating:• A longer period of record for water surface
elevation data with relative salinity at each time series point
• Flow accumulation modeling and topographic moisture for approximating freshwater and groundwater contribution hotspots

After the scheduled portion of the presentation, comments and questions led to pulling up the following materials as discussion points (shown here as additional slides)

Modern gates: average amount of time closed per day
• These numbers add together total time per day that the gates are closed – OVER BOTH HIGH TIDES.
• There will be an ebb tide somewhere in the middle of these durations (on most days, except when the lower high tide doesn’t reach the tide gate closure point), and the longest closure time per day for any single high tide might be half or more of the total

Modelled water surface elevation… 7 foot closure setting, 50 Year Storm/ King Tide
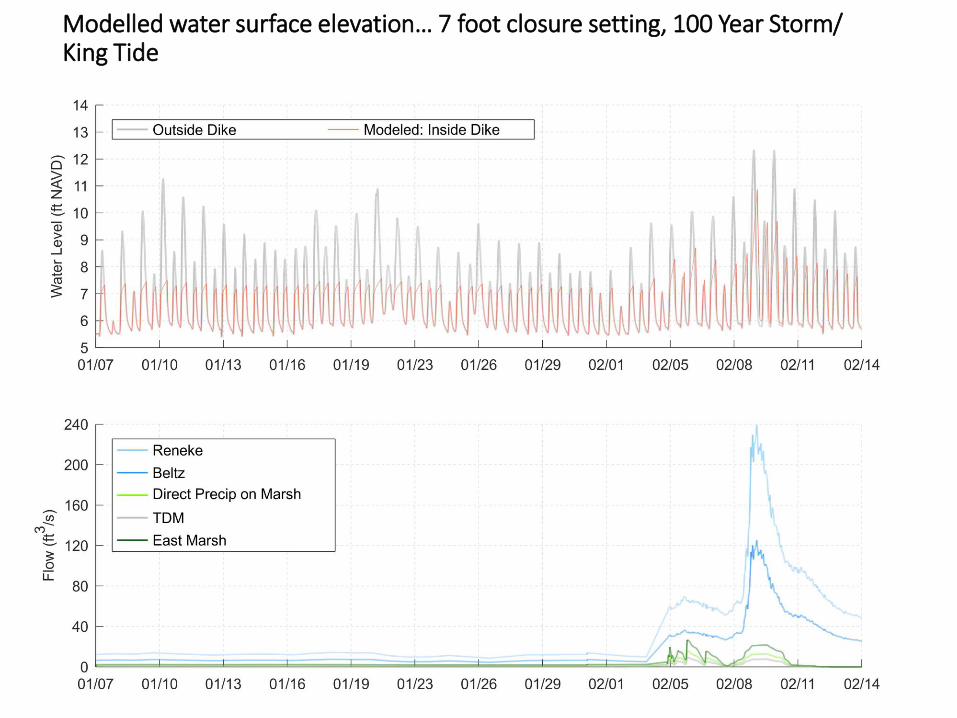
Modelled water surface elevation… 7 foot closure setting, 100 Year Storm/ King Tide

Modelled water surface elevation… 8 foot closure setting, 50 Year Storm/ King Tide

Modelled water surface elevation… 8 foot closure setting, 100 Year Storm/ King Tide

Modelled water surface elevation… 9 foot closure setting, 100 Year Storm/ King Tide
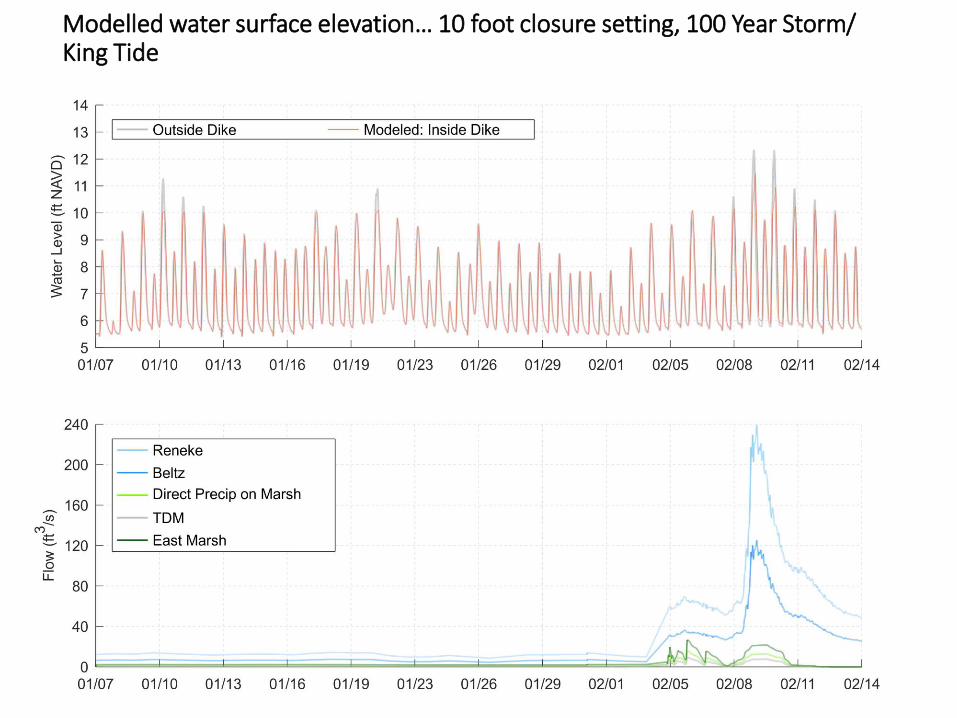
Modelled water surface elevation… 10 foot closure setting, 100 Year Storm/ King Tide

Modelled water surface elevation… Breach 50/100 Year Storm/ King Tide

Modelled water surface elevation… Existing Gate 50 Year Storm/ King Tide
Low point in dike
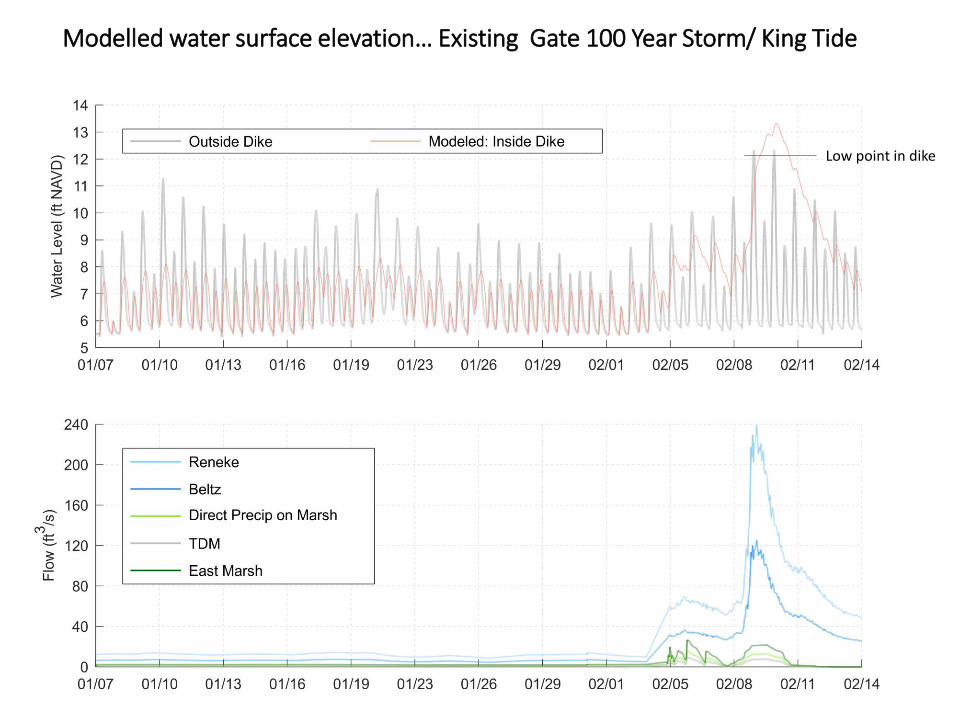
Modelled water surface elevation… Existing Gate 100 Year Storm/ King Tide
Low point in dike