Embed Size (px)
Citation preview

Application Performance Diagnostics
Application Performance DiagnosticsReferenceVersion 1.1
���


Application Performance Diagnostics
Application Performance DiagnosticsReferenceVersion 1.1
���

Note
Before using this information and the product it supports, read the information in “Notices” on page 155.
Edition Notice
This edition applies to version 1.1 of Application Performance Diagnostics and to all subsequent releases andmodifications until otherwise indicated in new editions.
© Copyright IBM Corporation 2013.US Government Users Restricted Rights – Use, duplication or disclosure restricted by GSA ADP Schedule Contractwith IBM Corp.

Contents
About this publication . . . . . . . . ixIntended audience . . . . . . . . . . . . ixPublications . . . . . . . . . . . . . . ix
Application Performance Diagnostics library . . ixRelated publications . . . . . . . . . . ixAccessing terminology online. . . . . . . . xAccessing publications online. . . . . . . . xOrdering publications . . . . . . . . . . x
Accessibility . . . . . . . . . . . . . . xApplication Performance Management communityon Service Management Connect . . . . . . . xiTivoli technical training . . . . . . . . . . xiTivoli user groups . . . . . . . . . . . . xiSupport information . . . . . . . . . . . xiConventions used in this publication . . . . . . xi
Typeface conventions . . . . . . . . . . xiiOperating system-dependent variables and paths xii
Chapter 1. Overview . . . . . . . . . 1
Chapter 2. Troubleshooting . . . . . . 3Collecting information about agent status. . . . . 3Agent installation fails with permission errors undera non-root user . . . . . . . . . . . . . 4Data collector configuration fails with networkinterface error . . . . . . . . . . . . . . 4WebSphere Application Server Liberty does not startafter it was configured for monitoring . . . . . . 4Reconfiguring the agent to monitor an applicationserver using only resource monitoring . . . . . . 5After reconfiguring the agent for a WebSphere Portalserver, a duplicate server appears in the userinterface . . . . . . . . . . . . . . . . 5Uninstallation of the agent fails on a Windowsplatform . . . . . . . . . . . . . . . . 5Empty fields are displayed on the Events tab . . . 5Errors and Warnings KPIs show normal status whenno data is available . . . . . . . . . . . . 6Resource monitoring does not work . . . . . . 6'Unknown' is displayed for the application name in agroup widget . . . . . . . . . . . . . . 6Monitoring does not work in a cluster when thecluster name includes white space . . . . . . . 7Some information missing from dashboards after aserver alias is changed . . . . . . . . . . . 7Non-ASCII characters are unreadable on the LogMessages dashboard . . . . . . . . . . . . 7The configuration utility displays some wrongslashes in file paths . . . . . . . . . . . . 8Several ssl.client*.props files are created in the/tmp directory . . . . . . . . . . . . . . 8Simple configuration process does not work onWebSphere Portal Server . . . . . . . . . . 8Server not monitored when it has the same alias asanother server . . . . . . . . . . . . . . 9
Application that is assigned to a single server islisted for all servers . . . . . . . . . . . . 9Agent uninstallation and installation fails under aWindows system . . . . . . . . . . . . . 9Uninstallation on a Linux system usingsmai-agent.sh uninstall_all shows a "Failed" messageon RPM removal . . . . . . . . . . . . 10Uninstallation on a Linux system usingsmai-agent.sh uninstall_all shows a "No match forargument" message . . . . . . . . . . . . 10Erroneous server start failed message displayedwhen WebSphere Liberty server restarts . . . . . 10IllegalArgumentException errors in the datacollector log files. . . . . . . . . . . . . 11Feature appears not to be enabled in the server.xmlfile . . . . . . . . . . . . . . . . . 11WebSphere Application Servers with duplicatenodes names and host names are not displayed onthe UI . . . . . . . . . . . . . . . . 11English strings are displayed on non-English userinterfaces . . . . . . . . . . . . . . . 11Unexpected error during reconfiguration of the datacollector . . . . . . . . . . . . . . . 12Servers missing from the managed systems list onthe Agent Configuration page . . . . . . . . 12Erroneous WebService events in the RequestSequence group widget . . . . . . . . . . 12Some information in the group widget help on theuser interface is incorrect or missing . . . . . . 12Some information in the non-English help on theuser interface is incorrect or missing . . . . . . 13
Chapter 3. Group widget help . . . . . 15Operational monitoring dashboards . . . . . . 15
WAS Status group widget in the Status Overviewtab . . . . . . . . . . . . . . . . 15WebSphere Application Server resource statusgroup widgets . . . . . . . . . . . . 17WebSphere Applications dashboard . . . . . 24EJB Container dashboard . . . . . . . . . 26Messaging Engine dashboard . . . . . . . 31Web Services dashboard . . . . . . . . . 34Web Applications dashboard . . . . . . . 36JVM GC dashboard. . . . . . . . . . . 38DB Connection Pools dashboard . . . . . . 41Thread Pools dashboard . . . . . . . . . 43Log Messages dashboard . . . . . . . . . 45
Diagnostics dashboards . . . . . . . . . . 46Request Summary dashboard . . . . . . . 46Request Instances dashboard . . . . . . . 50Request Sequence dashboard . . . . . . . 53WebSphere Application Servers dashboard . . . 56
© Copyright IBM Corp. 2013 iii

Chapter 4. Attribute Groups. . . . . . 61
Chapter 5. Dashboard attributes . . . . 75WAS Status group widget . . . . . . . . . 75WAS Dashboard . . . . . . . . . . . . . 75EJB Container dashboard . . . . . . . . . . 76Messaging Engine dashboard . . . . . . . . 78Web Services dashboard . . . . . . . . . . 79Web Applications dashboard . . . . . . . . 80DB Connection Pools dashboard . . . . . . . 81Thread Pools dashboard . . . . . . . . . . 81
Chapter 6. Historical data collections 83
Chapter 7. Thresholds . . . . . . . . 85
Chapter 8. System Messages . . . . . 91CFG Messages: Data Collector installation andconfiguration utilities . . . . . . . . . . . 91
CFG1002E:Unexpected exception detected inconfig.py. . . . . . . . . . . . . . . 91CFG1003E:Logging routine failed, tracebackfollows.. . . . . . . . . . . . . . . 91CFG1004E:Some substitution values were notreplaced in the input.properties file: . . . . . 91CFG1005E:Directory directory does not exist, willattempt to create. . . . . . . . . . . . 92CFG1038E:Unable to create the directory -directory. . . . . . . . . . . . . . . 92CFG1039E:The directory is not empty - directory. 92CFG1050E:Some substitution values were notreplaced in the itcam_wsBundleMetaData.xmlfile: . . . . . . . . . . . . . . . . 92CFG1055E:**ERROR** Error in creating runtimedirectories. . . . . . . . . . . . . . 92CFG1057E:Property property has no value or doesnot exist -input.properties. . . . . . . . 93CFG1058E:Server list is empty or serious erroroccurred. . . . . . . . . . . . . . . 93CFG1059E:No matching property or missingproperty found in - file. . . . . . . . . . 93CFG1064E:ITCAM_MIGRATEHOME variable isnot set. . . . . . . . . . . . . . . 93CFG1065E:Error occurred while checking forupgrade version - version. . . . . . . . . 93CFG1066E:Invalid path to version.properties -path. . . . . . . . . . . . . . . . 94CFG1068E:Invalid version property -version_property. . . . . . . . . . . . . 94CFG1069E:Invalid current version property -version_property. . . . . . . . . . . . . 94CFG1070E:Invalid version number -version_number. . . . . . . . . . . . . 94CFG1072E:Can not upgrade from a higherversion to lower or equal version - higher_versionlower_or_equal_version. . . . . . . . . . . 94CFG1073E:Can not discover profiles. Make surethere is a local application server profile created. 95CFG1076E:Required files not processed formigration. . . . . . . . . . . . . . 95
CFG1078I:There are application serversconfigured by older version of the data collector.Run migrate.bat/sh for details. . . . . . . 95CFG1081E:Unable to create custom directorydirectory. . . . . . . . . . . . . . . 95CFG1082E:Unable to copy custom property filefile to location. . . . . . . . . . . . . 95CFG1087I:Configuration process has failed.Check data collector configuration log files tofind error messages. . . . . . . . . . . 96CFG1091E:WAS admin connection type: propertyhas no port number specified. . . . . . . . 96CFG1092E:WAS admin user: property has nopassword. . . . . . . . . . . . . . . 96CFG1093E:Error found during data collectorconfiguration process for server(s): servers. Nextline has the error description. . . . . . . . 96CFG1104E:FAILED. . . . . . . . . . . . 96CFG1107E:Error(s) occurred during theinstallation of the service programs. Please checkthe log for more information. . . . . . . . 97CFG1109E:WebSphere version is not set, unableto continue. . . . . . . . . . . . . . 97CFG1110E:Unable to discover WebSphereinstallation directory under location. . . . . . 97CFG1111E:Prompt failed for TCP/IP interface. . . 97CFG1112E:Unexpected line in findServers outputoutput. . . . . . . . . . . . . . . . 97CFG1113E:Unexpected line in findServers outputoutput. . . . . . . . . . . . . . . . 97CFG1114E:Invalid path path - loadPropertiesfailed. . . . . . . . . . . . . . . . 98CFG1115E:Unable to continue without these files:files. . . . . . . . . . . . . . . . . 98CFG1116E:Unable to remove subComponentNamesymlink symbolicLinkName. . . . . . . . . 98CFG1117E:Parameter is required if TTAPIintegration is configured. . . . . . . . . 98CFG1118E:Failed to copy properties file: file. . . 98CFG1119E:log.properties copy and asciiconversion failed. . . . . . . . . . . . 99CFG1122E:directory home exists but file file ismissing. . . . . . . . . . . . . . . 99CFG1123E:Failed to create subComponentNamesymlink symbolicLinkName. . . . . . . . . 99CFG1124E:Failed to copy file file. . . . . . . 99CFG1125E:TTAPI Configuration failed for serversservers. . . . . . . . . . . . . . . . 99CFG1128E:Unable to copy file file to destination. 99CFG1129E: Server Server program program failedto install properly. Please check the log for moredetails log. . . . . . . . . . . . . . 100CFG1134E:Unable to discover WebSphereinstallation directory on the system. . . . . 100CFG1139E:-reconfig option is not supported insilent mode. . . . . . . . . . . . . 100CFG1141E:Unable to discover WebSphere homedirectory under directory. . . . . . . . . 100CFG1147E:Unable to locate NodeSync for nodenode. Make sure nodeagent for the node isstarted. . . . . . . . . . . . . . . 101
iv Application Performance Diagnostics: Application Performance Diagnostics Reference

CFG1148E:No server has been specified. . . . 101CFG1149E:No valid server name has beenspecified. . . . . . . . . . . . . . 101CFG2002E:Unexpected exception detected inunconfig.py. . . . . . . . . . . . . 101CFG2003E:Logging routine failed, tracebackfollows. . . . . . . . . . . . . . . 101CFG2006E:Migration of the Data Collector didnot complete successfully with return codereturn code. . . . . . . . . . . . . . 102CFG2007E:Copying the custom files or migrateunconfiguring failed, Migration of the DataCollector did not completed successfully. . . . 102CFG2008E:Copying the custom file file to filefailed. . . . . . . . . . . . . . . 102CFG2009E:Migration of the Data Collector didnot completed successfully with return codereturn_code. . . . . . . . . . . . . . 102CFG2012E:Failed to create websphere backupbackup. . . . . . . . . . . . . . . 102CFG2016E:Error occurred while processing findservers - servers. . . . . . . . . . . . 103CFG2017E:Error occurred while processing findprobes - probes. . . . . . . . . . . . 103CFG2018E:Error occurred while processingcheck probes - probes. . . . . . . . . . 103CFG2019E:Error found during program callprocess for Cell: cell Node: node Profile: profile.Next line has the error description. . . . . . 103CFG2020E:Error found during wsadminexecution for program call process for Cell: cellNode: node Profile: profile. . . . . . . . . 104CFG2027E:Dynamic reconfiguration process didnot complete successfully. . . . . . . . . 104CFG2029E:Error occurred while processing findservers - servers. . . . . . . . . . . . 104CFG2030E:Error occurred while processingmbean call, failed to open file. . . . . . . 104CFG2031E:Error found during wsadminexecution for program call process for Profile:profile. . . . . . . . . . . . . . . 104CFG2033E:Connection to profile profile failed. 105CFG2034E:Error found during program callprocess for Cell: cell Node: node Profile: profile. . 105CFG2037E:Could not connect to the MS -Managing_Server. . . . . . . . . . . . 105CFG2038E:Error occurred while program call -call. . . . . . . . . . . . . . . . . 105CFG2041E:Profile registry file not found file. . . 105CFG2042E:Profile path not found for profileprofile. . . . . . . . . . . . . . . . 106CFG2043E:dc.operation.mode has no parametersetting. . . . . . . . . . . . . . . 106CFG2044E:Unable to locate property in file. . . 106CFG2047E:XD Template creation did notcomplete successfully. . . . . . . . . . 106CFG2049E:Creation of XD template did notcomplete successfully. . . . . . . . . . 106CFG2054E:Discovery data file does not exist. 106CFG2056E:Unexpected exception detected inconfigtemplatexd.py. . . . . . . . . . . 107
CFG2057E:Unexpected exception detected indeletetemplatexd.py. . . . . . . . . . . 107CFG2059E:Deletion of XD template did notcomplete successfully. . . . . . . . . . 107CFG2061E:Discovery of XD template did notcomplete successfully. . . . . . . . . . 107CFG2079E:Error found during wsadminexecution for Configuration call process forProfile: <profile> . . . . . . . . . . . 107CFG2080E:Error found during wsadminexecution for Reconfiguration call process forProfile: <profile> . . . . . . . . . . . 108CFG2081E:Error found during wsadminexecution for Unconfiguration call process forProfile: <profile> . . . . . . . . . . . 108CFG2082E:Error found during wsadminexecution for migration call process for Profile:<profile> . . . . . . . . . . . . . 108CFG2083E:Error found during wsadminexecution for Find Servers call process forProfile: <profile> . . . . . . . . . . . 108CFG2084E:Error found during wsadminexecution for XD template configuration callprocess for Profile: <profile> . . . . . . . 109CFG2085E:Error found during wsadminexecution for XD template deletion call processfor Profile: <profile> . . . . . . . . . . 109CFG2086E:Error found during wsadminexecution for XD template discovery call processfor Profile: <profile> . . . . . . . . . . 109CFG2087E:Error found during wsadminexecution for Configuration call process for Cell:<cell> Node: <node> Profile: <profile> . . . . 109CFG2088E:Error found during wsadminexecution for Reconfiguration call process forCell: <cell> Node: <node> Profile: <profile> . . 110CFG2089E:Error found during wsadminexecution for Unconfiguration call process forCell: <cell> Node: <node> Profile: <profile> . . 110CFG2090E: Error found during wsadminexecution for Migration call process for Cell:<cell> Node: <node> Profile: <profile> . . . . 110CFG2091E:Error found during wsadminexecution for Find Servers call process for Cell:<cell> Node: <node> Profile: <profile> . . . 110CFG2092E:Error found during wsadminexecution for XD template configuration callprocess for Cell: <cell> Node: <node> Profile:<profile> . . . . . . . . . . . . . . 111CFG2093E:Error found during wsadminexecution for XD template deletion call processfor Cell: <cell> Node: <node> Profile: <profile> . 111CFG2094E:Error found during wsadminexecution for XD template discovery call processfor Cell: <cell> Node: <node> Profile: <profile> . 111CFG3022E:Invalid installation home directoryspecified: directory. . . . . . . . . . . 111CFG5003E:Error: Maximum number of retrieshave been reached. . . . . . . . . . . 112CFG5007E:Invalid response: response Please tryagain. . . . . . . . . . . . . . . . 112
Contents v

CFG5011E:Warning - Note that not all NodeAgents connected to the Deployment Managerare running. . . . . . . . . . . . . 112CFG5012E:Error - Failed to discover servers forthe profile. . . . . . . . . . . . . . 112CFG5013E:Invalid response: . . . . . . . 112CFG5015E:Data element element is not present inthe PDL. . . . . . . . . . . . . . . 112CFG5016E:Data element element of PDL is not alist, superfluous index index specified. . . . . 113CFG5017E:Data element element of PDL has noentries. . . . . . . . . . . . . . . 113CFG5018E:Data element for PCL is not presentin the PDL. . . . . . . . . . . . . . 113CFG5019E:Unexpected value type type for PDLkey key. . . . . . . . . . . . . . . 113CFG5020E:Invalid PDL key format from: formatto: format, unable to prompt. . . . . . . . 113CFG5021E:Failed to create directory. . . . . . 114CFG5022E:Internal program error detected inlocation. . . . . . . . . . . . . . . 114CFG5023E:Command line option option is not aknown flag. . . . . . . . . . . . . . 114CFG5024E:Missing parameter for optioncommand line option. . . . . . . . . . 114CFG5025E:Unexpected value value forenvironment variable environment_variableformat format for variable. . . . . . . . . 114CFG5026E:Critical error in program. . . . . . 114CFG5028E:Configuration home is not set fromeither ITCAM_CONFIG nor -config and currentdirectory is not a valid config_home. . . . . 115CFG5030E:The file directory in the file name: filedoes not exist. The file must be under anexisting directory. . . . . . . . . . . . 115CFG5032E:Cannot access file: file. . . . . . 115CFG5033E:The silent input file cannot beaccessed. . . . . . . . . . . . . . . 115CFG5034E:Invalid value specified by program foroption: keyword for dataEntry - badValue. . . . . 115CFG5035E:This combination of profile profile,cell name cell, node name node, server nameserver is not a valid combination. . . . . . 116CFG5036E:This combination of profile profile,cell name cell, node name node, server nameserver is already unconfigured. . . . . . . 116CFG5037E:Cannot connect to WebSphere. Makesure the WebSphere server or the node agent isup and running. . . . . . . . . . . . 116CFG5038E:The value of parameter which is: valuein the silent configuration file is invalid. . . . 116CFG5039E:[SERVER] is uncommented for serverserver, but was.appserver.server.name is notdefined. . . . . . . . . . . . . . . 117CFG5040E:Managing Server home is not set inthe silent configuration file and we cannotconnect to the Managing Server, so exitingConfiguration Utility. . . . . . . . . . 117
CFG5041E:Cannot connect to Managing Server,so we are using the Managing Server Homedetails provided in the silent configuration file:file. . . . . . . . . . . . . . . . . 117CFG5042E:This value: value is not currentlysupported in the silent configuration file. . . . 117CFG5044E:Parameter: parameter is missing fromthe silent input file. . . . . . . . . . . 118CFG5045E:The configuration process is beingterminated due to errors listed above. . . . . 118CFG5046E:AdminTask object is required tocomplete the configuration, but is unavailable.Unable to continue. . . . . . . . . . . 118CFG5047E:Invalid Profile:profile , Cellname:cell ,nodename:node , servername:server combinationin the silent input file. . . . . . . . . . 118CFG5049E:The ProbeUnconfigurator failed:kernel.rfs.address is not set. . . . . . . . 118CFG5050E:The ProbeUnconfigurator failed:invalid rfs port. . . . . . . . . . . . 119CFG5054E:Failure in Jython bootstrap. . . . . 119CFG5056E:Specified response file not found onthe system. . . . . . . . . . . . . . 119CFG5057E:Extraction of gdc_extract.py failed 119CFG5058E:Specify archive file to extract from. 119CFG5059E:No temporary directory. . . . . . 120CFG5060E:Failure in Java bootstrap. . . . . . 120CFG5061E:Parameter conflict, both -d and -rflags may not be used together . . . . . . 120CFG5062E:Failed to get the value ofITCAM_CONFIGHOME . . . . . . . . . . . 120CFG5063E:Specified archive file doesn't exist. 120CFG5064E:Unknown PDL format . . . . . 120CFG5065E: Path does not exist: <path> . . . . 121CFG5066E: Path is not a valid WebSphere homedirectory: <directory> . . . . . . . . . . 121CFG5069E:The WebSphere product fileWAS.product was not found in <location> . . 121CFG5070E:No WebSphere properties/versionpath found under <location> . . . . . . . 121CFG5071E:No WebSphere Liberty homeproperties file found in lib/versions under<location> . . . . . . . . . . . . . 122CFG5072E: No WebSphere Libertylib/properties path found under <location> . 122
CYND Messages: Data Collector . . . . . . . 122CYND1002E:Custom Service initialization failedas JVMPI could not be initialized . . . . . 122CYND1006E:The am.home system property isundefined. . . . . . . . . . . . . . 122CYND1012E:Failed to start ProbeManager. . . 123CYND1013F:JVMPI was not initialized by nativeprobe start exiting. . . . . . . . . . . 123CYND1015F:JVMPI initialization failed. . . . 123CYND1017E:Failed to initialize JVMMI. . . . 123CYND1019E: Error occurred during encryption. 123CYND1020E:Invalid file name. . . . . . . 124CYND1021E:Invalid userID or password. . . . 124CYND1022E: Invalid file name. . . . . . . 124CYND1023E: Invalid userID or password. . . . 124CYND1024E:Could not open the file: filename 124
vi Application Performance Diagnostics: Application Performance Diagnostics Reference

CYND1025E:No data in the file: filename . . . 124CYND1026E:Invalid file name, userID orpassword. . . . . . . . . . . . . . 125CYND1027E:Could not open the file for writing:filename . . . . . . . . . . . . . . 125CYND1028E:The input string is corrupt. . . . 125CYND1029E:UID, PASSWORD or filename isNULL. . . . . . . . . . . . . . . 125CYND1030E:Your actual password anddecrypted password don't match . . . . . . 125CYND1031E:The userID read from the file is notthe same as UID entered. . . . . . . . . 126CYND1032E:Password read from the file is notthe same as the password entered. . . . . . 126CYND1034E:Encrypted password string iscorrupt. . . . . . . . . . . . . . . 126CYND1035E:Error occurred during decryption. 126CYND1036E:The password is too long. It shouldbe less than max_len characters. . . . . . . 126CYND1037E: JVMPI could not create a RawMonitor for GlobalLock. . . . . . . . . 127CYND1038E:Global lock was created beforeinitialization of JVMPI. . . . . . . . . . 127CYND1040E:The EventAgent was not startedand cannot manage ThreadData. . . . . . . 127CYND1042E:Event Queue is NULL for Thread,TID: tid . . . . . . . . . . . . . . 127CYND1048E:Class file is corrupt. . . . . . 127CYND1049E:Bad class file magic number: . . 128CYND1050E:Failed to open library: libName . . 128CYND1068E:am.home was not found; failed toinitialize the Property Manager. . . . . . . 128CYND1069E:Default property file <file> notfound. . . . . . . . . . . . . . . 128CYND1074E:Failed to retrieve the commandarguments for WAS. . . . . . . . . . . 128CYND1075E:Failed to retrieve command linearguments for Stand Alone Java. . . . . . . 128CYND1076E:Failed to construct ThreadDumpInfoobject. . . . . . . . . . . . . . . 129CYND1083E:Cannot findcom.cyanea.bcm.bootstrap.BcmBootstrap.class.. 129CYND1086E:Unable to send CTRL+BREAKevent to JVM process. . . . . . . . . . 129CYND1087E:Unable to send SIGQUIT to JVMprocess. . . . . . . . . . . . . . . 129CYND1088E:Cannot get Java system propertycyanea.probe.stdout. . . . . . . . . . 129CYND1068E:am.home was not found; failed toinitialize the Property Manager. . . . . . . 130CYND1069E:Default property file <file> notfound. . . . . . . . . . . . . . . 130CYND1074E:Failed to retrieve the commandarguments for WAS. . . . . . . . . . . 130CYND1075E:Failed to retrieve command linearguments for Stand Alone Java. . . . . . . 130CYND1076E:Failed to construct ThreadDumpInfoobject. . . . . . . . . . . . . . . 130CYND1083E:Cannot findcom.cyanea.bcm.bootstrap.BcmBootstrap.class.. 131
CYND1086E:Unable to send CTRL+BREAKevent to JVM process. . . . . . . . . . 131CYND1087E:Unable to send SIGQUIT to JVMprocess. . . . . . . . . . . . . . . 131CYND1088E:Cannot get Java system propertycyanea.probe.stdout. . . . . . . . . . 131CYND0220E:generateThreadDump failed. . . . 131CYND0222E:Can't get ThreadDumpInfo class . . 132CYND0223E:Cannot find method Method . . . 132CYND0224E:Failed to allocate memory.. . . . 132CYND0225E:The Event Agent already started. 132CYND0226E:Failed to obtain jvmmi handle forheap dump . . . . . . . . . . . . . 132CYND0227E:No javacore is generated. . . . . 132CYND0228E: Unable to get RAS. . . . . . . 133CYND0219E:Failed to GetStringUTFChars . . . 133CYND0230E: Error in getting number of cpuwith return code Error code . . . . . . . . 133CYND0079E:Error in getting stack trace forthread Thread ID . . . . . . . . . . . 133CYND1112E:Unable to open counter file, File 133CYND1104E:Cannot get the server commonstorage with error number Error . . . . . . 133Byte Code Modification Messages . . . . . 134Generic Probe Engine . . . . . . . . . 135
KYN Messages: Tivoli Enterprise Monitoring Agent 135KYNA0002E: ITCAM for ApplicationDiagnostics monitoring agent initializationfailed: errorMessage. . . . . . . . . . . 135KYNA0004E: Agent configuration file file wasnot found. . . . . . . . . . . . . . 135KYNA0005E: Agent configuration file fileloading error: errorMessage. . . . . . . . . 136KYNA0013E: The Application server connectionconnectionInfo failed: errorMessage . . . . . . 136KYNA0022E: Application server log scrappingstopped for the application server serverId witherror: errorMsg. . . . . . . . . . . . . 136KYNA0024E: Take action tactId failed for theapplication server serverId: tactReason. . . . . 136KYNA0026E: Take sample table failed forapplication server serverId: errorMsg. . . . . . 137KYNA0039E:Application dashboard monitoringfailed to start on the application server serverId . 137KYNA0103E: Unsupported number cast inattribute attrName with type attrType from typeactualType. . . . . . . . . . . . . . 137KYNA0104E:Unsupported type cast in attributeattrName with type attrType from typeactualType. . . . . . . . . . . . . . 137KYNA0034E:Application appName baseliningfailed on the application server serverId. . . . 137
KYND Messages: ITCAM for ApplicationDiagnostics Secondary Data Collector . . . . . 138
KYND0001E: AgentConnection class initializernot able to load native library: Library Name . . 138KYND0003E: Unable to write to MVS console -Console Name . . . . . . . . . . . . 138KYND0004E: Unable to check native librarybuild level because native library not available . 138
Contents vii

KYND0005E: Incompatibility detected betweenJava library Java Library and Native LibraryNative Library. Java library build level is JavaLibrary Level Native library build level is NativeLibrary Level . . . . . . . . . . . . . 138KYND0006E: Incompatibility detected betweenNative library Native Library and Java LibraryJava Library. Native library build level is NativeLibrary Level Java library build level is JavaLibrary Level . . . . . . . . . . . . . 139KYND0007E: Error Error caught attempting toverify Native library compatibility . . . . . 139KYND0008E: Unable to obtain current workingdirectory - Working Directory . . . . . . . 139KYND0011E: Data collector has caughtexception Exception during sample collectionand communication . . . . . . . . . . 139KYND0012E: The data collector has becomedisconnected from the monitoring agent . . . 140KYND0013E: Exception: Exception caught inDataGatherer thread . . . . . . . . . . 140KYND0014E: Exception: Exception caughtprocessing Poll request . . . . . . . . . 140
KYND0015E: Incompatible Agent build leveldetected. Actual = Actual Level Required =Required Level. Agent session disconnected. . . 140KYND0022E: I/O error encountered writing logfile Log File . . . . . . . . . . . . . 141KYND0023E: Unable to capture records for DDname Reason: Reason . . . . . . . . . . 141
Chapter 9. Glossary for Agent forWebSphere Applications . . . . . . 143
Appendix. Accessibility . . . . . . . 149
Index . . . . . . . . . . . . . . . 151
Trademarks . . . . . . . . . . . . 153
Notices . . . . . . . . . . . . . . 155
viii Application Performance Diagnostics: Application Performance Diagnostics Reference

About this publication
This publication provides information about using IBM Application PerformanceDiagnostics.
Intended audience
This publication is for personnel who use the Agent for WebSphere® Applicationsto monitor application servers.
Users of this publication must be familiar with the following topics:v Monitoring conceptsv Cloud computing conceptsv WebSphere Application Serverv The monitored application environment
Publications
This section lists publications in the product library and related documents. It alsodescribes how to access Tivoli® publications online and how to order Tivolipublications.
Application Performance Diagnostics library
The following publications are included in the Application PerformanceDiagnostics library, available on the IBM® web site:v Agent for WebSphere Applications Installation and Configuration Guide
Provides the planning information and procedures you need to install andconfigure Agent for WebSphere Applications, including the agent and thesupport files for the infrastructure node.
v Agent for WebSphere Applications User's Guide
Provides the information on monitoring and diagnosing application serversusing Agent for WebSphere Applications.
Reference and troubleshooting information for Application PerformanceDiagnostics is available on Service Management Connect.
Related publications
The following documentation also provides useful information:v IBM Tivoli Documentation Central:
Information about IBM Tivoli Documentation is provided on the followingwebsite:https://www.ibm.com/developerworks/community/wikis/home?lang=en#!/wiki/Tivoli Documentation Central
v IBM WebSphere Application Server:Information about IBM WebSphere Application Server is provided on thefollowing website:
© Copyright IBM Corp. 2013 ix

http://www.ibm.com/software/webservers/appserv/was/library/v IBM SmartCloud® Monitoring - Application Insight.
The IBM SmartCloud Monitoring - Application Insight Installation and Setup Guide isavailable from the SmartCloud Monitoring - Application Insight informationcenter at the following URL:http://publib.boulder.ibm.com/infocenter/tivihelp/v63r1/topic/com.ibm.scmai.doc_1.2/welcome.htm
Accessing terminology online
The IBM Terminology website consolidates the terminology from IBM productlibraries in one convenient location. You can access the Terminology website athttp://www.ibm.com/software/globalization/terminology.
Accessing publications online
The documentation CD contains the publications that are in the product library.The format of the publications is PDF, HTML, or both.
IBM posts publications for this and all other Tivoli products, as they becomeavailable and whenever they are updated, to the Tivoli Documentation Centralwebsite at https://www.ibm.com/developerworks/community/wikis/home?lang=en#!/wiki/Tivoli Documentation Central
Important: If you print PDF documents on other than letter-sized paper, set theoption in the File → Print window that allows Adobe Reader to print letter-sizedpages on your local paper.
Ordering publications
You can order many Tivoli publications online at: http://www.ibm.com/e-business/weblink/publications/servlet/pbi.wss.
You can also order by telephone by calling one of these numbers:v In the United States: 800-879-2755v In Canada: 800-426-4968
In other countries, contact your software account representative to order Tivolipublications. To locate the telephone number of your local representative, performthe following steps:1. Go to http://www.ibm.com/e-business/weblink/publications/servlet/pbi.wss2. Select your country from the list and click Go.3. Click About this site in the main panel to see an information page that
includes the telephone number of your local representative.
Accessibility
Accessibility features help users with a physical disability, such as restrictedmobility or limited vision, to use software products successfully. With this product,you can use assistive technologies to hear and navigate the interface. You can alsouse the keyboard instead of the mouse to operate all features of the graphical userinterface.
x Application Performance Diagnostics: Application Performance Diagnostics Reference

For additional information, see “Accessibility,” on page 149.
Application Performance Management community on ServiceManagement Connect
Connect, learn, and share with Service Management professionals: product supporttechnical experts who provide their perspectives and expertise.
Access Service Management Connect at https://www.ibm.com/developerworks/servicemanagement/apm/index.html. Use Service Management Connect in thefollowing ways:v Become involved with transparent development, an ongoing, open engagement
between other users and IBM developers of Tivoli products. You can access earlydesigns, sprint demonstrations, product roadmaps, and prerelease code.
v Connect one-on-one with the experts to collaborate and network about Tivoliand the (enter your community name here) community.
v Read blogs to benefit from the expertise and experience of others.v Use wikis and forums to collaborate with the broader user community.
Tivoli technical training
For Tivoli technical training information, refer to the following IBM TivoliEducation website:
http://www.ibm.com/software/tivoli/education/
Tivoli user groups
Tivoli user groups are independent, user-run membership organizations thatprovide Tivoli users with information to assist them in the implementation ofTivoli Software solutions. Through these groups, members can share informationand learn from the knowledge and experience of other Tivoli users. For moreinformation about Tivoli Users Group, see www.tivoli-ug.org.
Support information
If you have a problem with your IBM software, you want to resolve it quickly. IBMprovides the following ways for you to obtain the support you need:
OnlineAccess the IBM Software Support site at http://www.ibm.com/software/support/probsub.html.
Troubleshooting referenceFor more information about resolving problems, see the troubleshootingreference information in Service Management Connect.
Conventions used in this publication
This publication uses several conventions for special terms and actions, operatingsystem-dependent commands and paths, and margin graphics.
About this publication xi

Typeface conventions
This publication uses the following typeface conventions:
Bold
v Lowercase commands and mixed case commands that are otherwisedifficult to distinguish from surrounding text
v Interface controls (check boxes, push buttons, radio buttons, spinbuttons, fields, folders, icons, list boxes, items inside list boxes,multicolumn lists, containers, menu choices, menu names, tabs, propertysheets), labels (such as Tip:, and Operating system considerations:)
v Keywords and parameters in text
Italic
v Citations (examples: titles of publications, diskettes, and CDsv Words defined in text (example: a nonswitched line is called a
point-to-point line)v Emphasis of words and letters (words as words example: "Use the word
that to introduce a restrictive clause."; letters as letters example: "TheLUN address must start with the letter L.")
v New terms in text (except in a definition list): a view is a frame in aworkspace that contains data.
v Variables and values you must provide: ... where myname represents....
Monospace
v Examples and code examplesv File names, programming keywords, and other elements that are difficult
to distinguish from surrounding textv Message text and prompts addressed to the userv Text that the user must typev Values for arguments or command options
Operating system-dependent variables and paths
This guide refers to the following variables:v DC_home: the home directory of ITCAM Data Collector for WebSphere, which is
a component of the Agent for WebSphere Applications. The default location isC:\IBM\ITM\dchome\7.3.0.0.0 on Windows systems and /opt/ibm/ccm/agent/install-images/kyn/dchome/7.3.0.0.0 on Linux systems.
xii Application Performance Diagnostics: Application Performance Diagnostics Reference

Chapter 1. Overview
Use the reference material when you are installing, troubleshooting, or usingApplication Performance Diagnostics.
The following agent-specific reference information is provided:v Troubleshooting informationv Group widget helpv Attributes groupsv PMI attribute mapping for dashboard attributesv Historical data collectionsv Thresholdsv System messages
For information about installing, configuring, or using Application PerformanceDiagnostics, see the IBM Application Performance Diagnostics Information Center.
© Copyright IBM Corp. 2013 1

2 Application Performance Diagnostics: Application Performance Diagnostics Reference

Chapter 2. Troubleshooting
The following issues are known for the Agent for WebSphere Applications.
Collecting information about agent statusWhen the Agent for WebSphere Applications is not working correctly, you need tocollect information about it status in order to troubleshoot the issue or to passinformation to IBM Software Support.
Determining if the monitoring agent is running
To check if the monitoring agent is running, run the following commands from acommand line:v On a Windows system:
cd C:\IBM\ITM\binwas-agent.bat status
v On a Linux system:cd /opt/ibm/ccm/agent/bin./was-agent.sh status
If the monitoring agent is not running, you can start it with the followingcommands:v On a Windows system:
cd C:\IBM\ITM\binwas-agent.bat start
v On a Linux system:cd /opt/ibm/ccm/agent/bin./was-agent.sh start
Gathering log files
You can use a script to gather all agent log files. You can then pass the files to IBMSoftware Support when necessary.
The name of the script is:v on Windows systems, C:\IBM\ITM\TMAITM6_x64\kyncollect.cmdv on Linux and UNIX systems, /opt/ibm/ccm/agent/lx8266/yn/bin/kyncollect.sh
The script takes no parameters.
Restriction: On Windows systems, if JAVA_HOME includes spaces and doublequotation marks, the kyncollect.cmd will not start. Verify that JAVA_HOME doesnot include double quotation marks before you run the script.set JAVA_HOME=C:\Progra~1\IBM\WebSphere\AppServer\java
The output file will be located in the following directory:v on Windows, %TEMP%\KYNv on Linux and UNIX systems, /opt/ibm/ccm/agent/logs/kyn/tmp/
© Copyright IBM Corp. 2013 3

Agent installation fails with permission errors under a non-root userThe problem: on Linux systems, under a non-root user account, installation of theAgent for WebSphere Applications fails. "Permission denied" error messages aredisplayed.
The reason: Installation under a non-root user account is not supported. Use theroot account to install the agent.
Data collector configuration fails with network interface errorThe problem: Data collector configuration script fails with an error message thatincludes a failure in the java.net.NetworkInterface.getNetworkInterfacesmethod.
The reason: This error happens with certain versions of the IBM JDK, including the32-bit version that was shipped with WebSphere Application Server 8.0. It happensonly when the host name is not set on the computer.
The solution: Use one of the following workarounds:v Upgrade WebSphere Application Server to a recent fix pack. The versions of the
IBM JDK included in recent fix packs do not have this issue.v Set the JAVA_HOME environment variable to a different version of the IBM
JVM. Version 1.5 or later is required.v Configure the TCP/IP settings to set a valid host name.
WebSphere Application Server Liberty does not start after it wasconfigured for monitoring
The problem: After you configure the data collector to monitor a WebSphereApplication Server Liberty instance, the instance fails to start.Server <server_name> start failed. Check server logs for details.
The symptoms: The server fails to start with the following message:Server server_name start failed. Check server logs for details
The console.log file, or the console if the server is started using the run option,contails a line with the following error message:JVMJ9TI001E Agent library am_ibm_16 could not be opened
The cause: This error message indicates that the version of JRE used to start theWebSphere Liberty server is different from the version of JRE used to run theconfiguration utility. As a WebSphere Liberty server does not provide its own JRE,you must use the same version of JRE (bitness and vendor) for running theconfiguration utility and running the WebSphere Liberty server.
The solution: In order to fix the problem, set the JAVA_HOME environment variableto the version of the JRE that is used to run the Liberty server, and then rerun theconfiguration utility.
4 Application Performance Diagnostics: Application Performance Diagnostics Reference
Reconfiguring the agent to monitor an application server using onlyresource monitoring
The problem: The agent is configured to monitor an application server instancewith operational monitoring. You need to reconfigure the agent to monitor theserver instance using PMI resource monitoring. However, the advancedreconfiguration utility does not make this change.
The solution: Use the unconfiguration utility to unconfigure the data collector forthe application server instance. Then restart the application server instance and themonitoring agent component of the agent. For instructions, see the IBM ApplicationPerformance Diagnostics Installation and Configuration Guide
After reconfiguring the agent for a WebSphere Portal server, aduplicate server appears in the user interface
The problem: The agent is configured to monitor a WebSphere Portal server. Youuse the reconfiguration utility to change monitoring settings for this server. Aduplicate server appears in the user interface.
The solution: Unconfigure monitoring for the affected server and configure itagain.
Note: To avoid this issue, do not use the reconfiguration utility to change settingsfor a WebSphere Portal server. Instead, use the advanced configuration utility/This utility warns that the server is already configured, but still makes anyrequired changes.
Uninstallation of the agent fails on a Windows platformThe problem: When you uninstall the Agent for WebSphere Applications on aWindows platform and you either do not stop the agent before uninstalling or aJMXServer process is still running, a message similar to the following message isdisplayed:*Info* Stopping existing JMXServer instance nnnCannot delete "C:\IBM\ITM\dchome"Please exit any windows or files open under here.
The solution: To uninstall the agent, complete these steps:1. Stop the agent using the following commands:
a. cd C:\IBM\ITM\bin
b. was-agent.bat stop
2. Issue the uninstall command:was-agent.bat uninstall
Empty fields are displayed on the Events tabThe problem: On the Events tab of the Application Performance Managementconsole, the Display Item and Node fields are empty.
The reason: The fields are not populated and can be ignored.
Chapter 2. Troubleshooting 5

Errors and Warnings KPIs show normal status when no data isavailable
The problem: The Errors in log and Warnings in log key performance indicators(KPIs) on the dashboards in the Application Performance Management consoleshow a status of normal (that is, green) when the Agent for WebSphereApplications is unconfigured. The KPIs should display “No data available”.
The reason: When there is no data available, the count of errors and warningsreturns a value of zero.
The solution: When the agent is unconfigured, ignore that normal status that isdisplayed for the Errors in log and Warnings in log KPIs.
Resource monitoring does not workWhen an application server instance is configured for PMI resource monitoring,without configuring the data collector within the application server, no data isdisplayed.
The log files for the data collector might contain the following message:ADMC0016E: The system cannot create a SOAP connector
Solution:
1. Ensure that the application server is running.2. Ensure that the DNS server is available and working properly.3. Run the data collector configuration script again to configure resource
monitoring for the server instance. Do not configure the data collector withinthe application server.
4. Restart the monitoring agent component of Agent for WebSphere Applications.To restart the component, run the following commands from the command line:v On a Windows system:
cd C:\IBM\ITM\binwas-agent.bat stopwas-agent.bat start
v On a Linux system:cd /opt/ibm/ccm/agent/bin./was-agent.sh stop./was-agent.sh start
5. Wait 10 minutes and check the monitoring again.6. If no data is displayed, collect log file information using the kyncollect script
and and contact IBM support. For instructions about collecting log fileinformation, see “Collecting information about agent status” on page 3.
'Unknown' is displayed for the application name in a group widgetThe problem: In the WebSphere Applications group widget, the value 'unknown'might be displayed as the application name.
The reason: The value 'unknown' might be displayed as the application name forone of the following reasons:v Some background requests were triggered that do not belong to any application.
6 Application Performance Diagnostics: Application Performance Diagnostics Reference

v The data collector is unable to determine the application name from theapplication module.
v An exception occurred while the data collector was retrieving the applicationname.
v You are monitoring a WebSphere Liberty server. For WebSphere Liberty, theapplication name is not available.
Monitoring does not work in a cluster when the cluster name includeswhite space
The problem: When monitoring application servers within a cluster, if the clustername includes white space, the monitoring agent does not work and no data isdisplayed.
The solution: Remove the white space from the cluster name and configure thedata collector. To start the data collector configuration utility, run the followingcommands from the command line:On a Windows system:cd C:\IBM\ITM\binconfig.bat
On a Linux system:cd /opt/ibm/ccm/agent/binconfig.sh
Some information missing from dashboards after a server alias ischanged
The problem: You use the advanced reconfiguration procedure to change the aliasfor a monitored application server. After this change, some information in thedashboards for this server is missing. The metrics that require historical data areaffected.
The solution: Restart the monitoring agent component of Agent for WebSphereApplications. To restart the component, run the following commands from thecommand line:v On a Windows system:
cd C:\IBM\ITM\binwas-agent.bat stopwas-agent.bat start
v On a Linux system:cd /opt/ibm/ccm/agent/bin./was-agent.sh stop./was-agent.sh start
Non-ASCII characters are unreadable on the Log Messages dashboardThe problem: If the WebSphere Application Server is enabled for a multibyte localeand log messages include non-ASCII characters, the characters are not readable onthe Log Messages dashboard.
The cause: A limitation in the current version of the agent.
Chapter 2. Troubleshooting 7

The solution: Use other means to view the log messages that include non-ASCIIcharacters.
The configuration utility displays some wrong slashes in file pathsThe problem: The configuration utility displays some wrong slashes in file paths,for example, on Windows systems, / instead of \. The same path might havecorrect and wrong slashes, for example, C:/IBM/ITM\yn_dc_config.log.
The solution: Use the slashes correct for the operating system to view and openfiles.
Several ssl.client*.props files are created in the /tmp directoryProblem: When some application server instances are configured for only PMIresource monitoring (the data collector is not configured within the applicationserver) and the server instances are not running, ssl.client*.props files might becreated under <tmp> directory on Windows and Linux systems. As the number offiles being created grows, the file system can be impacted.
Solution: Complete one of the following 3 solutions to either prevent thessl.client*.props files from being created or to reduce the number of files.v Ensure that all servers on the node that are enabled for resource monitoring are
running.v Remove the servers that are not running from the connection.properties file
and restart the agent:1. Open the connection.properties file in a text editor. On Linux systems, the
file is located in the /opt/ibm/ccm/agent/install-images/kyn/dchome/7.3.0.0.0/runtime/custom directory. On Windows systems, the file is locatedin the C:\IBM\ITM\dchome\7.3.0.0.0\runtime\custom directory.
2. Locate the lines for the servers that are not running and remove these lines.3. Save the file.4. Restart the agent. On Windows systems:
cd C:\IBM\ITM\binwas-agent.bat stopwas-agent.bat start
On Linux systems:cd /opt/ibm/ccm/agent/bin./was-agent.sh stop./was-agent.sh start
v Create a cron script on Linux systems and a scheduled task on Windowssystems to remove the ssl.client*.props files periodically.
Simple configuration process does not work on WebSphere PortalServer
Problem: In a WebSphere Portal Server V7 environment, you cannot use the simpleconfiguration process (that is, simpleconfig.bat/sh) when server1 is not started.
Solution: Either start server1 before you start the simple configuration procedureor configure the data collector using the advanced configuration utility (that isconfig.bat/sh). On Windows systems:C:\IBM\ITM\dchome\7.3.0.0.0\bin\config.bat
8 Application Performance Diagnostics: Application Performance Diagnostics Reference

On Linux systems:/opt/ibm/ccm/agent/install-images/kyn/dchome/7.3.0.0.0/bin/config.sh
Server not monitored when it has the same alias as another serverThe problem: When you use the advanced Data Collector Configuration Utility(config.sh/bat) to configure the data collector and you assign the same alias nameto different servers, only one server is monitored.
The error occurs if you have assigned the aliases within a single execution of theconfiguration utility and when you run the utility multiples times to configureservers on the same node. The problem does not occur when you assign the samealias to servers on different nodes.
The solution: Run the configuration utility and assign a unique alias to servers onthe same node. To start the data collector configuration utility, run the followingcommands from the command line:On a Windows system:cd C:\IBM\ITM\dchome\7.3.0.0.0\binconfig.bat
On a Linux system:cd /opt/ibm/ccm/agent/install-images/kyn/dchome/7.3.0.0.0/binconfig.sh
Application that is assigned to a single server is listed for all serversThe problem: When you deploy a new application to a single server in aWebSphere Network Deployment environment, in the WebSphere Applicationsdashboard, the application is associated with all of the servers on the node that areconnected to the Agent for WebSphere Applications.
The solution: The application list is corrected after the application server isrestarted.
Agent uninstallation and installation fails under a Windows systemThe problem: On a Windows system, uninstallation of the Agent for WebSphereApplications fails, or the agent installation directory is corrupted. Subsequently,attempts to install or uninstall the agent or any other SmartCloud Monitoring -Application Insight agent fail. Complete uninstallation of all agents using theuninstallation utility (smai_agent.bat uninstall_all) fails.
The solution: Run the agent_cleanup.bat script. You can find this script in thefollowing locations:v In the uncompressed agent installation bundle, in the INST\core-framework
directory.v On a host where any SmartCloud Monitoring - Application Insight monitoring
agent is installed, in the C:\IBM\ITM\InstallITM directory.
The script removes the Agent for WebSphere Applications and all otherSmartCloud Monitoring - Application Insight monitoring agents and IBM TivoliMonitoring agents from the host. All services, directories, and registry keys for theagents are removed. You can then install the agents again.
Chapter 2. Troubleshooting 9

If the script fails with an error message while removing some directories, stop allinstances of WebSphere Application Server on the host and run the script again.
Uninstallation on a Linux system using smai-agent.sh uninstall_allshows a "Failed" message on RPM removal
The problem: When you uninstall the Agent for WebSphere Applications and allother SmartCloud Monitoring - Application Insight agents on a Linux system usingthe ./smai-agent.sh uninstall_all command, you get a Failed message forremoving the smai-apd-was package. The uninstallation is reported as complete.
The solution: Check for reasons why an uninstallation might have failed:v Review the full output of the smai-agent.sh script.v Review the /opt/ibm/ccm/agent/logs/uninstall-yn-DATESTAMP.log log file.v Ensure that the data collector is unconfigured for all application server instances
by running the DC_home/bin/unconfig.sh script. If the script shows any serverinstances, select unconfiguration of these instances.
Then run the ./smai-agent.sh uninstall_all command again. After running thecommand, delete the /opt/ibm/ccm directory.
Uninstallation on a Linux system using smai-agent.sh uninstall_allshows a "No match for argument" message
The problem: When you uninstall the Agent for WebSphere Applications and allother SmartCloud Monitoring - Application Insight agents on a Linux system usingthe ./smai-agent.sh uninstall_all command, you get a No match for argumentmessage.
The solution: To ensure the uninstallation is completed, delete the /opt/ibm/ccmdirectory.
Erroneous server start failed message displayed when WebSphereLiberty server restarts
The problem: A message similar to the following message is displayed on theconsole after a WebSphere Liberty server version 8.5.5.0, which has beenconfigured for data collection, is restarted.Server <server_name> start failed. Check server logs for details.
The solution: The error message is displayed in error. For more information aboutthe WebSphere Liberty defect that causes this error, see http://www-01.ibm.com/support/docview.wss?uid=swg1PM91596.
To verify the status of a WebSphere Liberty server, complete these steps:1. Navigate to <WebSphere_liberty_profle_home>/bin.2. Issue the command server <server_name> status.
The problem is fixed in WebSphere Liberty version 8.5.5.1.
10 Application Performance Diagnostics: Application Performance Diagnostics Reference

IllegalArgumentException errors in the data collector log filesThe problem: When you enable diagnostics mode or method trace from the AgentConfiguration page of the Application Performance Management console, someIllegalArgumentException errors might be seen in the data collector log files.
The errors are logged each time you perform an action from the AgentConfiguration page. The errors are created in the trace-dc-ParentLast.log file.The file is in DC_home\7.3.0.0.0\logs\CYN\logs\ on Windows systems and inDC_home/7.3.0.0.0/logs/CYN/logs/ on Linux systems.
The solution: You can ignore the errors.
Feature appears not to be enabled in the server.xml fileThe problem: In WebSphere Liberty environments, an error message similar to thefollowing message might appear in the default console log file (console.log) afterthe configuration of the data collector updates the server.xml file.[ERROR] CWWKE0702E: The bundle "com.ibm.tivoli.itcam.liberty.classloader.feature_72.0.6.qualifier [241]" could not be resolved. Reason: Missing Constraint:Import-Package:<class>; version="0.0.0"
Where class is one of the following:v javax.servlet
v javax.servlet.http
v javax.servlet.jsp
v javax.jms
v javax.sql
The solution: The configuration of the data collector is not impacted. However, toresolve the issue, update the server.xml to include the missing packages.
WebSphere Application Servers with duplicate nodes names and hostnames are not displayed on the UI
The problem: In WebSphere Liberty environments, when the same node name andhost name is used for WebSphere Applications Servers across multiple virtualmachines (VMs), only one node is displayed on the Application PerformanceManagement console.
The solution: In WebSphere Liberty environments, verify that the node name andhost name that are used for each WebSphere Application Server across VMs areunique.
English strings are displayed on non-English user interfacesProblem: On the EJB Containers (Last 2 Hours) group widget that is displayed theEJB Containers dashboard on non-English user interfaces, English strings aredisplayed for the following KPIs:v Entity bean load countv Entity bean store count
Chapter 2. Troubleshooting 11

Unexpected error during reconfiguration of the data collectorProblem: When you reconfigure the data collector using the ITCAM Data Collectorfor Reconfiguration utility (reconfig.sh/bat), if you enter an incorrect user nameor password for the WebSphere administrator, a message similar to the followingmessage is displayed.Error occurred while processing configurationTraceback (most recent call last):File "<string>", line 4369, in ?Exception:CFG5046E AdminTask object is required to complete the configuration, but is unavailable.Unable to continue.
The utility then detects that an incorrect user name or password was entered andprompts you to correct the error:Incorrect user or password if global security is activatedDo you want to correct the error and retry.
Solution: Reenter the correct user name and password.
Servers missing from the managed systems list on the AgentConfiguration page
Problem: After you enable or disable method trace from the Agent Configurationpage, occasionally, one or several of the servers disappear from the managedsystems list. When the page refreshes, the servers reappear in the list.
Erroneous WebService events in the Request Sequence group widgetProblem: In a WebSphere Liberty environment where you enabled diagnosticsmode, you might see some erroneous events in the event type column of theRequest Sequence group widget. The events have an event type of WebService.
Solution: You can ignore any event of event type WebService.
Some information in the group widget help on the user interface isincorrect or missing
Problem: Some information in group widgets is not as documented.
Cause: The Group Widget help is incorrect for some group widgets. The followingcorrections apply:
Busiest Thread Pools (Last 2 Hours)Data is displayed in this group widget even when you do not configurethe data collector within the JVM of the application server.
The Percent of thread pool used KPI on this group widget refers to themaximum percentage of the thread pool in use during the previous 2hours.
Business DB Connection Pools (Last 2 Hours)Data is displayed in this group widget even when you do not configurethe data collector within the JVM of the application server.
12 Application Performance Diagnostics: Application Performance Diagnostics Reference

EJB Container (Last 2 Hours)Data is displayed in this group widget even when you do not configurethe data collector within the JVM of the application server.
No data is available if PMI is not enabled or not set high enough.
WebSphere Applications (Last 24 hours)The group widget displays the throughput per second rather than thethroughput per minute.
Some information in the non-English help on the user interface isincorrect or missing
Problem: Some information in non-English group widgets is not as documented.
Cause: The Group Widget help is incorrect for some group widgets for languagesother than English. The following corrections apply:
Requests with Slowest Response Time group widgetThe group widget displays the URL of the request. The table and columnnames for this KPI are KYNREQUEST.NAME.
Requests with Slowest Response Time group widgetHistorical data collection must be enabled for the Web Applicationsattribute group to see data in the group widget.
Busiest Thread Pools (Last 2 Hours) group widgetThe Busiest Thread Pools (Last 2 Hours) group widget displays thePercent of thread pool used, which refers to the average percentage ofthe thread pool in use during the previous 2 hours.
Requests with Slowest Response Time and Lowest Completion Rate groupwidget
Historical data collection must be enabled for the Web Services attributegroup to see data in the group widget.
Web Container Usage (Last 24 Hours) group widgetThe Time pool at max (%) KPI is not displayed on this group widget.
Chapter 2. Troubleshooting 13

14 Application Performance Diagnostics: Application Performance Diagnostics Reference

Chapter 3. Group widget help
The Agent for WebSphere Applications provides several dashboards for monitoringthe underlying resources of WebSphere Application Servers and for performingdeep-dive diagnostics.
Operational monitoring dashboardsThe Agent for WebSphere Applications provides several dashboards for monitoringthe underlying resources of WebSphere Application Servers.
WAS Status group widget in the Status Overview tabWhen you select a group in the navigator that contains a WebSphere ApplicationServer instance, the Status Overview tab is populated with a WAS Status groupwidget for each application server instance in the group.
WAS StatusThe WAS Status group widget displays a snapshot of the WebSphere ApplicationsServer status.
Tip:
v Click the group widget to drill down to the WebSphere Application Serverresource status group widgets.
v If your user role is apdadmin, you can modify the threshold values for this groupwidget in the Threshold tab of the Settings dialog.
The WAS Status group widget provides the information in the following table:
KPI Description Definition
Server status The status of the WebSphereApplication Server. Thefollowing are the serverstates:
v Disconnected=0
v Connected=1
v Unconfigured=100
Thresholds:
v Normal is Connected=1
v Critical is Disconnected=0or Unconfigured=100
KYNAPSRV.STATUS
Slowest responsetime (ms)
The slowest average responsetime from the averageresponse times of all requeststhat were captured.Thresholds:
v Normal is less than 50
v Warning is greater than orequal to 50
v Critical is greater than orequal to 200
KYNREQUEST.C10
© Copyright IBM Corp. 2013 15

KPI Description Definition
JVM memoryused (KB)
The JVM memory that isused.Thresholds:
v Normal is less than 500000
v Warning is greater than orequal to 500000
v Critical is greater than orequal to 1000000
KYNAPSRV.MEM_SIZE_K WHEREKYNAPSRV.STATUS=1
JVM memorytotal (KB)
The total amount of JVMmemory.Thresholds:
v Normal is less than 500000
v Warning is greater than orequal to 500000
v Critical is greater than orequal to 1000000
KYNAPSRV.MEM_TTL_K WHEREKYNAPSRV.STATUS=1
JVM CPU used(%)
The percentage of the JVMprocessor that is used.Thresholds:
v Normal is less than 50
v Warning is greater than orequal to 50
v Critical is greater than orequal to 80
KYNAPSRV.AS_CPUP WHEREKYNAPSRV.STATUS=1
Highest DB Connpool used (%)
The average percentage ofthe connection pool in use.
The data is displayed for thebusiest pool.Thresholds:
v Normal is between 0 and69
v Warning is between 70 and89
v Critical is greater than orequal to 90
KYNDBCONP.PCT_USED
Heap used (%) The percentage of heap thatis used.Thresholds:
v Normal is between 0 and64
v Warning is between 65 and94
v Critical is greater than orequal to 95
KYNGCACT.HEAP_USPCT
16 Application Performance Diagnostics: Application Performance Diagnostics Reference

KPI Description Definition
Error rate (%) The percentage of requeststhat resulted in errors duringthe collection interval. Alower error rate (%) ispreferable.Thresholds:
v Normal is between 0 and64
v Warning is between 65 and94
v Critical is greater than orequal to 95
comp_req =TOP(KYNREQUEST.COMPL_PCT,ASC,1)Error rate % = (100 - comp_req)
Errors in log Number of error messagesout of the most recent 100 logmessages in theSystemOut.log file, or in thecase of WebSphere Liberty,the messages.log file.Thresholds:
v Normal is greater than orequal to equal to 0
v Critical is greater than orequal to 1
Remember: The thresholdsthat you set are based on thelast 100 messages in the logfile.
COUNT(KYNLOGANAL.SEVERITY)WHERE KYNLOGANAL.SEVERITY=22
Warnings in log Number of warningmessages out of the mostrecent 100 log messages inthe SystemOut.log file, or inthe case of WebSphereLiberty, the messages.log file.
v Normal is equal to 0
v Warning is greater than orequal to 1
Remember: The thresholdsthat you set are based on thelast 100 messages in the logfile.
COUNT(KYNLOGANAL.SEVERITY)WHERE KYNLOGANAL.SEVERITY=21
WebSphere Application Server resource status group widgetsWhen you select a WebSphere Application Server instance in the navigator, theStatus Overview tab is populated with group widgets for monitoring the resourcesof the application server instance. Use the group widgets to identify how yourapplications are performing.
The group widgets help you isolate problems to specific areas of your applicationserver environment. You can use the group widgets to compare the applicationperformance with the performance of the underlying resource. You can determineif a problem with an application relates to an underlying resource or if it relates tothe application code.
Chapter 3. Group widget help 17

You can view the WAS Information group widget to see the details of theWebSphere Application Server, for example, server name and server type.
Group Widgets
When you select a WebSphere Application Server instance in the navigator, theStatus Overview tab shows the following group widgets:v Requests with Slowest Response Timev WAS Informationv WebSphere Applicationsv JVM GC (Last 2 Hours)v Busiest DB Connection Pools (Last 2 Hours)v Busiest Thread Pools (Last 2 Hours)v EJB Container (Last 2 Hours)v Log Messagesv Slowest Web Services (Last 2 Hours)v Slowest Web Applications (Last 2 Hours) from PMIv Slowest Messaging Engines (Last 2 Hours)
To view group widget help, click the online help icon ( ) on the group widget.
Requests with Slowest Response TimeThe Requests with Slowest Response Time group widget displays the 5 requests onthe WebSphere Application Server with the slowest average response times.
Tip:
v If diagnostics mode is enabled, click Diagnose to open the Request Summarydashboard. From this dashboard, you see which requests have slow responsetimes. For these requests, you can determine where the request is spending mostof its time.
v Select a request in the table to open the Request Instances dashboard. Thedashboard shows the request instances for the request. From this dashboard, yousee the average response times for each request instance. (This feature is notavailable for WebSphere Portal Server).
v Unless you configure the data collector within the JVM of the application server,data is not available. You cannot drill down to the diagnostics dashboards.
The Requests with Slowest Response Time group widget group provides theinformation in the following table.
KPI Description Definition
URL The URL of the request. KYNREQUEST.NAME
Request name The name of the request. KYNREQUEST.REQ_DETAIL
Average response time (ms) The average response time(in milliseconds).
KYNREQUEST.C10
WAS InformationTheWAS Information group widget displays summary information about theWebSphere Application Server.
18 Application Performance Diagnostics: Application Performance Diagnostics Reference

The WAS Information group widget provides the information in the followingtable.
KPI Description Definition
PID The process ID of the JVM. KYNAPSRV.PID
Server name The name of the applicationserver.
KYNAPSRV.SERVER_NAM
Node name The name of the WebSphereApplication Server nodegroup to which theapplication server belongs.
KYNAPSRV.WAS_NNAM
Cell name The name of the WebSphereApplication Server cell towhich the application serverbelongs.
KYNAPSRV.WAS_CNAM
Monitoring modes The monitoring level forrequest data. Valid valuesare:
v N/A
v JMX Monitoring
v Data Collector Monitoring
KYNAPSRV.REQ_MON
Server type The type of server. Validvalues are:
v Traditional_WebSphere
v Liberty
KYNAPSRV.SRV_TYPE
PMI level (runtime) The PMI instrumentationlevel. Valid values are:
v N/A
v None
v Low
v Medium
v High
v Basic
v Extended
v All
v Custom
KYNAPSRV.JVM_IL
WebSphere ApplicationsThe WebSphere Applications group widget displays the applications on theWebSphere Application Server, sorted by average response time for the currentinterval.
Tip:
v Some data is not available if you are monitoring WebSphere Liberty.v Unless you configure the data collector within the JVM of the application server,
data is not available.v Click an application on the group widget to drill down to the WebSphere
Applications dashboard and to filter the WebSphere Applications (Last 24 Hours)- [Application] and the Requests - [Application] for the specified application.
Chapter 3. Group widget help 19
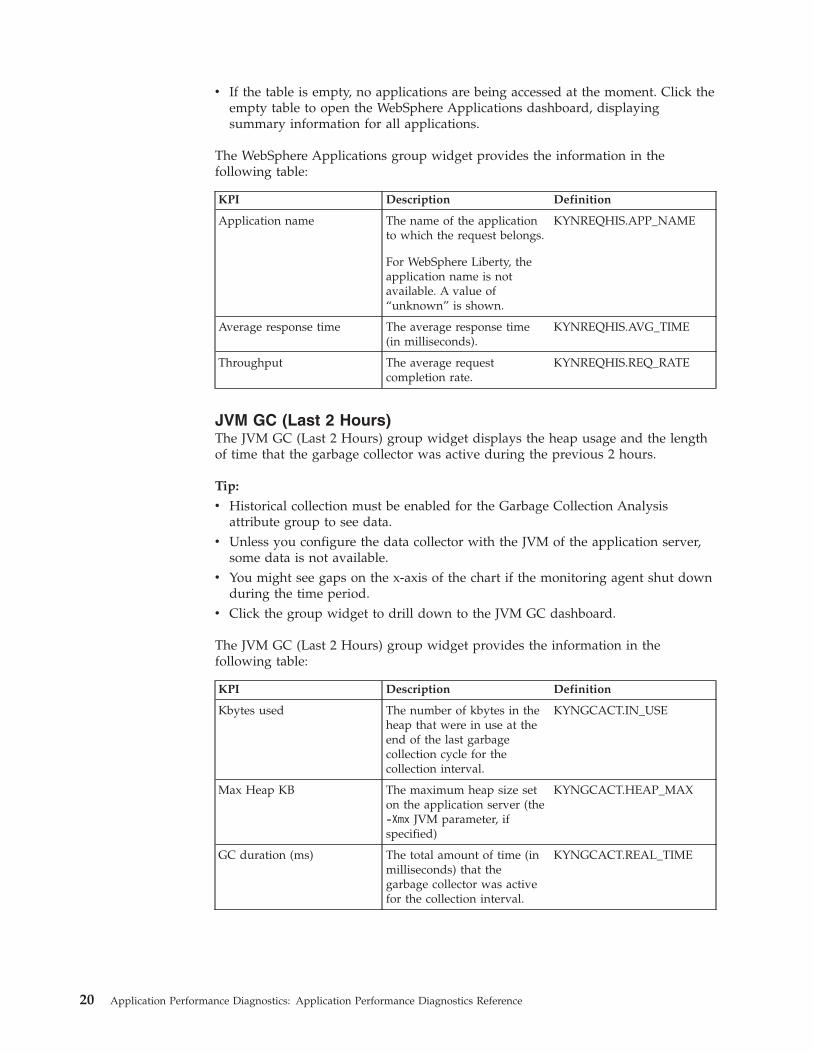
v If the table is empty, no applications are being accessed at the moment. Click theempty table to open the WebSphere Applications dashboard, displayingsummary information for all applications.
The WebSphere Applications group widget provides the information in thefollowing table:
KPI Description Definition
Application name The name of the applicationto which the request belongs.
For WebSphere Liberty, theapplication name is notavailable. A value of“unknown” is shown.
KYNREQHIS.APP_NAME
Average response time The average response time(in milliseconds).
KYNREQHIS.AVG_TIME
Throughput The average requestcompletion rate.
KYNREQHIS.REQ_RATE
JVM GC (Last 2 Hours)The JVM GC (Last 2 Hours) group widget displays the heap usage and the lengthof time that the garbage collector was active during the previous 2 hours.
Tip:
v Historical collection must be enabled for the Garbage Collection Analysisattribute group to see data.
v Unless you configure the data collector with the JVM of the application server,some data is not available.
v You might see gaps on the x-axis of the chart if the monitoring agent shut downduring the time period.
v Click the group widget to drill down to the JVM GC dashboard.
The JVM GC (Last 2 Hours) group widget provides the information in thefollowing table:
KPI Description Definition
Kbytes used The number of kbytes in theheap that were in use at theend of the last garbagecollection cycle for thecollection interval.
KYNGCACT.IN_USE
Max Heap KB The maximum heap size seton the application server (the-Xmx JVM parameter, ifspecified)
KYNGCACT.HEAP_MAX
GC duration (ms) The total amount of time (inmilliseconds) that thegarbage collector was activefor the collection interval.
KYNGCACT.REAL_TIME
20 Application Performance Diagnostics: Application Performance Diagnostics Reference

Busiest Thread Pools (Last 2 Hours)The Busiest Thread Pools (Last 2 Hours) group widget displays the 5 busiestthread pools during the previous 2 hours.
Tip:
v No data is available if the PMI is not enabled or is not set high enough on theapplication server.
v Historical collection must be enabled for the Thread Pools attribute group to seedata.
v Data is unavailable if you are monitoring WebSphere Liberty until a thread poolis used by a request.
v Click the group widget to drill down to the Thread Pools dashboard.
The Busiest Thread Pools (Last 2 Hours) group widget provides the information inthe following table. The table is sorted by the thread consumption percent.
KPI Description Definition
Thread pool name The name of the thread pool. KYNTHRDP.THRDP_NAME
Percent of thread pool used The maximum percentage ofthe thread pool in use duringthe previous 2 hours.
Percent of thread pool used= (KYNTHRDP.POOL_SIZE/ KYNTHRDP.MAX_SIZE) *100
The Busiest Thread Pools (Last 2 Hours) group widget references the followingKPI:
Referenced KPI Description
KYNTHRDP.MAX_SIZE The maximum number of threads in the pool.
KYNTHRDP.POOL_SIZE The average number of connections in use.
Busiest DB Connection Pools (Last 2 Hours)The Busiest DB Connection Pools (Last 2 Hours) group widget displays the 5busiest DB connection pools during the previous 2 hours. For each DB connectionpool that is displayed, the highest percentage of pool that was used during theprevious 2 hours is displayed.
Tip:
v Historical collection must be enabled for the DB Connection Pools attributegroup to see data.
v If an application does not use DB connection pools, data is not displayed.v Some data is not available if you are monitoring WebSphere Liberty.v Click the group widget to drill down to the DB Connection Pools dashboard.
The Busiest DB Connection Pools (Last 2 Hours) group widget provides theinformation in the following table.
KPI Description Definition
Datasource name The name of the datasource. KYNDBCONP.NAME
Percent of pool used The average percentage ofthe connection pool in use.
KYNDBCONP.PCT_USED
Chapter 3. Group widget help 21

Slowest Web Services (Last 2 Hours)The Slowest Web Services (Last 2 Hours) group widget displays the 5 web serviceswith the slowest average response time during the previous 2 hours.
Tip:
v No data is available if the PMI is not enabled or is not set high enough on theapplication server.
v Some PMI data is only available after the application server is restarted.v No data is displayed if an application does not use web services.v Click the group widget to drill down to the Web Services dashboard.
The Slowest Web Services (Last 2 Hours) group widget provides the information inthe following table:
KPI Description Definition
Web service The name of the web service. KYNWEBSVC.WEB_SVC
Average response time (ms) The average response time(in milliseconds) for arequest during the previous2 hours.
KYNWEBSVC.RESP_TIME
Slowest Web Applications (Last 2 Hours) from PMIFore WebSphere Application Servers, the Slowest Web Applications (Last 2 Hours)from PMI group widget displays the 5 web applications with the slowest averageresponse time during the previous 2 hours.
For WebSphere Portal Servers, the group widget displays data for all webapplications that were discovered during the current interval. The data is limited tothe slowest 100 web applications.
Tip:
v No data is available if the PMI is not enabled or is not set high enough on theapplication server.
v Historical collection must be enabled for the Web Applications attribute group tosee data.
v Click the group widget to drill down to the Web Applications dashboard.
The Slowest Web Applications (Last 2 Hours) from PMI group widget provides theinformation in the following table:
KPI Description Definition
Application name The name of the application. KYNAPP.APPL_NAME
Average response time (ms) The worst average responsetime (in milliseconds) that ittook a servlet or JSP tocomplete a task during theprevious 2 hour.
KYNAPP.AVG_RT
Log MessagesThe Log Messages group widget displays the number of error and warningmessages out of the most recent 100 log messages in the SystemOut.log file, or inthe case of WebSphere Liberty, the messages.log file.
22 Application Performance Diagnostics: Application Performance Diagnostics Reference

Tip:
v Unless you configure the data collector within the application server, data is notavailable.
v Click the group widget to drill down to the Log Messages dashboard.v When you increase the levels of logging and tracing, the log file and the group
widget are updated more frequently. If the log file updates too quickly, nomessages are displayed in the group widget.
The Log Messages group widget provides the information in the following table:
KPI Description Definition
Errors in log Number of errors in themost recent 100 messages inthe log file.Thresholds:
v Normal is equal to 0
v Critical is greater than orequal to 1
Remember: The thresholdsthat you set are based onthe last 100 messages in thelog file.
COUNT(KYNLOGANAL.SEVERITY)WHERE KYNLOGANAL.SEVERITY=22
Warnings in log Number of warnings in themost recent 100 messages inthe log file.Thresholds:
v Normal is equal to 0
v Warning is greater thanor equal to 1
Remember: The thresholdsthat you set are based onthe last 100 messages in thelog file.
COUNT(KYNLOGANAL.SEVERITY)WHERE KYNLOGANAL.SEVERITY=21
EJB Container (Last 2 Hours)The EJB Container (Last 2 Hours) group widget displays the average response timeand method invocation rate for the Enterprise Java™ Beans (EJBs) in the containerduring the previous 2 hours.
Tip:
v Historical collection must be enabled for the EJB containers attribute group tosee data.
v No data is available if you are monitoring WebSphere Liberty.v No data is available if the application does not use EJBs.v No data is available if PMI is not enabled or is not set high enough.v Click the group widget to drill down to the EJB Container dashboard.
The EJB Container (Last 2 Hours) group widget provides the information in thefollowing table:
Chapter 3. Group widget help 23

KPI Description Definition
Method average responsetime (ms)
The average response time(in milliseconds) on remoteinterface methods for allbeans at each collectioninterval.
KYNCONTNR.MTHD_RT
Method invocation rate (persec)
The rate of invocations (persecond) at each collectioninterval.
KYNCONTNR.RTE_MT_CAL
Slowest Messaging Engines (Last 2 Hours)The Slowest Messaging Engines (Last 2 Hours) group widget displays the 5message engines with the highest local wait time during the previous 2 hours.
Tip:
v No data is available if the PMI is not enabled or is not set high enough on theapplication server.
v Some PMI data is only available after the application server is restarted.v No data is available if the application does not use Messaging Engines.v Historical collection must be enabled for the Messaging Engines attribute group
to see data.v Some data is not available if you are monitoring WebSphere Liberty.v Click the group widget to drill down to the Messaging Engines dashboard.
The Slowest Messaging Engines (Last 2 Hours) group widget provides theinformation in the following table. The table is sorted by the average local waittime.
KPI Description Definition
Messaging engine name The message engine name. KYNMSGENG.MSGE_NAME
Average local wait time(ms)
The average local wait time(in milliseconds) during theprevious 2 hours.
KYNMSGENG.AVG_LOC_WT
WebSphere Applications dashboardUse the WebSphere Applications dashboard to identify trends in the applicationsand in requests during the previous 24 hours.
Group Widgets
The WebSphere Applications dashboard shows the following group widgets:v WebSphere Applications (Last 24 Hours) - [Application]v Requests - [Application]v Request - [Request Name] (Last 24 Hours)
To view group widget help, click the online help icon ( ) on the group widget.
WebSphere Applications (Last 24 Hours) - [Application]The WebSphere Applications (Last 24 Hours) - [Application] group widget displaysthe average request response time and average request throughput for the specifiedapplication during the previous 24 hours.
24 Application Performance Diagnostics: Application Performance Diagnostics Reference

Tip:
v Historical collection must be enabled for the Request Times and Rates attributegroup to see data.
v Some data is not available if you are monitoring WebSphere Liberty.v Unless you configure the data collector within the JVM of the application server,
data is not available.v The chart is filtered for the application you selected in the WebSphere
Applications group widget.
The WebSphere Applications (Last 24 Hours) - [Application] group widgetprovides the information in the following table:
KPI Description Definition
Sample date and time The date and time that theagent collected the data.
KYNREQHIS.SDATE_TIME
Average response time (ms) The average request responsetime (in milliseconds) at eachcollection interval.
KYNREQHIS.AVG_TIME
Throughput (per second) The average requestthroughput (per second) atthe collection interval.
KYNREQHIS.REQ_RATE
Requests - [Application]The Requests - [Application] group widget displays the average response time andthe number of times the requests ran for the specified application during thecurrent interval.
Tip:
v Some data is not available if you are monitoring WebSphere Liberty.v The table is filtered for the application you selected in the WebSphere
Applications group widget.v Select a request in this table to filter the Request - [Request Name] (Last 24
Hours) group widgets for the request. To remove the filtering, click ClearSelection.
v If you have IBM Application Performance Diagnostics, click Diagnose to openthe Request Summary dashboard. From this dashboard, you see which requestshave slow response times. For these requests, you can determine where therequest is spending most of its time.
v If you have IBM Application Performance Diagnostics, click View Instance dataon a row to view the request instances that are associated with a request. Thisfeature is not available for WebSphere Portal Server.
The Requests - [Application] group widget provides the information in thefollowing table:
KPI Description Definition
URL The URL of the request. KYNREQUEST.REQ_NAME
Request name The name of the request. KYNREQUEST.REQ_DETAIL
Average response time (ms) The average response time(in milliseconds) of therequest during the currentinterval.
KYNREQUEST.C10
Chapter 3. Group widget help 25

KPI Description Definition
Request count The number of times that therequest ran during thecurrent interval.
KYNREQUEST.C7
Important: The Action column does not display a KPI. In this column, if you haveIBM Application Performance Diagnostics, you can click View Instance data toview the request instances that are associated with a request. This feature is notavailable for WebSphere Portal Server.
Request - [Request Name] (Last 24 Hours)The Request - [Request Name] (Last 24 Hours) group widget displays the averageresponse time and the throughput for the selected request during the previous 24hours.
Tip:
v Some data is not available if you are monitoring WebSphere Liberty.v Historical collection must be enabled for the Request Analysis attribute group to
see data.v Select a request in the Requests - [Application] table to filter the chart for a
specific request.
The Request - [Request Name] (Last 24 Hours) group widget provides theinformation in the following table:
KPI Description Definition
Sample date and time The date and time that theagent collected the data.
KYNREQUEST.C2
Average response time (ms) The average response time(in milliseconds) at thecollection interval.
KYNREQUEST.C10
Throughput (per sec) The average throughput (persecond) at the collectioninterval.
KYNREQUEST.C8
EJB Container dashboardUse the EJB Container dashboard to identify problems with the performance ofEnterprise Java Beans (EJBs) or with the underlying infrastructure that supportsyour EJBs.
Group Widgets
The EJB Container dashboard shows the following group widgets:v Enterprise Java Beansv EJB Containers (Last 2 Hours)v Container Object Pools (Last 24 Hours)v Container Transactions
To view group widget help, click the online help icon ( ) on the group widget.
26 Application Performance Diagnostics: Application Performance Diagnostics Reference

EJB Containers (Last 2 Hours)The EJB Containers (Last 2 Hours) group widget displays information about theperformance of the container during the previous 2 hours.
Tip:
v No data is available if the PMI is not enabled or is not set high enough on theapplication server.
v Some PMI data is only available after the application server is restarted.v Historical collection must be enabled for the EJB Containers and Enterprise Java
Beans attribute groups to see data.v No data is available if you are monitoring WebSphere Liberty.
The EJB Containers (Last 2 Hours) group widget provides the information in thefollowing table:
KPI Description Definition
Method average responsetime (ms)
The average response time(in milliseconds) on remoteinterface methods for allbeans at the collectioninterval.
KYNCONTNR.MTHD_RT
Method invocation count The number of methodinvocations during the at thecollection interval.
KYNCONTNR.MTHD_CALLS
Method invocation rate (persec)
The rate of invocations (persecond) during the at thecollection interval.
KYNCONTNR.RTE_MT_CAL
Average concurrently livebeans
The average number of beanobjects concurrently live atthe collection interval.
KYNCONTNR.AVG_TO_LIV
Create count The number of bean createcalls at the collectioninterval.
KYNCONTNR.NUM_TO_CR
Destroy count The number of times beanobjects were destroyed bygarbage collection at thecollection interval.
KYNCONTNR.NUM_TO_DS
Activate count The number of times a beaninstance was activated at thecollection interval.
KYNCONTNR.NUM_TO_ACT
Entity bean load count The number of times anentity bean data was loadedat the collection interval. TheKPI is only available forWebSphere Liberty.
KYNEJB.NUM_LOAD
Entity bean store count The number of times entitybean data was written to thedatabase at the collectioninterval. The KPI is onlyavailable for WebSphereLiberty.
KYNEJB.NUM_STORE
Chapter 3. Group widget help 27

Container Object Pools (Last 24 Hours)The Container Object Pools (Last 24 Hours) group widget displays informationabout the performance of the container object pools that are associated withEnterprise Java Beans (EJBs) during the previous 24 hours.
Tip:
v No data is available if the PMI is not enabled or is not set high enough on theapplication server.
v Some PMI data is only available after the application server is restarted.v Historical collection must be enabled for the Container Object Pools attribute
group to see data.v No data is available if you are monitoring WebSphere Liberty.
The Container Object Pools (Last 24 Hours) group widget provides the informationin the following table:
KPI Description Definition
Time The date and time that theagent collected the data.
KYNCNTROP.SDATE_TIME
Average objects in pool The average number ofobjects in the bean objectpool at the collectioninterval.
KYNCNTROP.POOL_SIZE
Average objects discarded The average number ofobjects that were discardedeach time the bean objectpool was emptied of idleobjects at the collectioninterval.
KYNCNTROP.AVG_DR_SZ
Find count The number of times aretrieval call found anunavailable object in thebean object pool at thecollection interval.
KYNCNTROP.NUM_GET_FN
Get count The number of calls thatwere made to retrieve anobject from the bean objectpool at the collectioninterval.
KYNCNTROP.NUM_GETS
Discard count The number of times thereturning object wasdiscarded at the collectioninterval because the pool wasfull.
KYNCNTROP.NUM_PUT_DS
Container TransactionsThe Container Transactions group widget displays information about the activitiesand transactions on the application server during the current interval.
Tip:
v No data is available if the PMI is not enabled or is not set high enough on theapplication server.
v Some PMI data is only available after the application server is restarted.
28 Application Performance Diagnostics: Application Performance Diagnostics Reference

v No data is available if you are monitoring WebSphere Liberty.
The Container Transactions group widget provides the information in thefollowing table:
KPI Description Definition
Begin rate global transactions(per sec)
The number of times globaltransactions were started(per second) during thecurrent interval.
KYNTRANS.RTE_GT_BEG
Begin rate local transactions(per sec)
The number of times localtransactions were started(per second) during thecurrent interval.
KYNTRANS.RTE_LT_BEG
Active global transactions The number of concurrentlyactive global transactionsrunning in the containerduring the current interval.
KYNTRANS.ACT_GL_TRN
Active local transactions The number of concurrentlyactive local transactionsrunning in the containerduring the current interval.
KYNTRANS.ACT_LC_TRN
Committed globaltransactions
The number of globaltransactions that werecompleted during the currentinterval.
KYNTRANS.GL_TR_COM
Committed local transactions The number of localtransactions that werecompleted during the currentinterval.
KYNTRANS.LC_TR_COM
Rolled back globaltransactions
The total number of globaltransactions that wereundone because they couldnot complete during thecurrent interval.
KYNTRANS.GL_TR_RB
Rolled back local transactions The total number of localtransactions that wereundone because they couldnot complete during thecurrent interval.
KYNTRANS.LC_TR_RB
Timeouts global transaction The number of globaltransactions that timed outduring the current interval.
KYNTRANS.GL_TR_TO
Timeouts local transaction The number of localtransactions that timed outduring the current interval.
KYNTRANS.LC_TR_TO
Duration global transaction(ms)
The average duration (inmilliseconds) for globaltransactions during thecurrent interval.
KYNTRANS.GL_TR_DUR
Duration local transaction(ms)
The average duration (inmilliseconds) of localtransactions during thecurrent interval.
KYNTRANS.LC_TR_DUR
Chapter 3. Group widget help 29

Enterprise Java BeansThe Enterprise Java Beans group widget displays performance information abouteach Enterprise Java Beans (EJB) that are deployed to the application server duringthe current interval.
Tip:
v No data is available if the PMI is not enabled or is not set high enough on theapplication server.
v Some PMI data is only available after the application server is restarted.v No data is available if you are monitoring WebSphere Liberty.
The Enterprise Java Beans group widget provides the information in the followingtable:
KPI Description Definition
Application EJB modulename
The name of the WebApplication or EJB Module.
KYNEJB.CONT_NAME
Bean name The name of the EJB. KYNEJB.BEAN_NAME
Bean type The type of bean. Beans canbe stateless, stateful, entity,and message driven.
KYNEJB.BEAN_TYPE
Method invocations The number of methodinvocations during thecurrent interval.
KYNEJB.MTHD_CALLS
Method invocation rate (persec)
The method invocation rate,per second, for all methodsduring the current interval.
KYNEJB.RTE_MT_CAL
Method average responsetime (ms)
The average response time(in milliseconds) for allmethods of the remoteinterface for this bean duringthe current interval.
KYNEJB.MTHD_RT
Create count The number of times that abean instance was createdduring the current interval.
KYNEJB.NUM_CREATE
Activate count The number of times a beaninstance was activatedduring the current interval.
KYNEJB.NUM_ACTIV
Passivate count The number of times that abean instance was passivatedduring the current interval.
KYNEJB.NUM_PASSIV
Entity bean load count The number of times anentity bean data was loadedduring the current interval.The KPI is only available forWebSphere Liberty.
KYNEJB.NUM_LOAD
Entity bean store count The number of times entitybean data was written to thedatabase during the currentinterval. The KPI is onlyavailable for WebSphereLiberty.
KYNEJB.NUM_STORE
30 Application Performance Diagnostics: Application Performance Diagnostics Reference

KPI Description Definition
Destroy count The number of times beanobjects were destroyed bygarbage collection during thecurrent interval.
KYNEJB.NUM_DSTRY
Average concurrently livebeans
The average number of beanobjects concurrently liveduring the current interval.
KYNEJB.NUM_BLIVE
Messaging Engine dashboardUse the Messaging Engines dashboard to identify bottlenecks at the messaginglayer. The dashboard helps you determine if bottlenecks are due to improperlysized queues. With improperly sized queues, there is a disparity between the rateof inbound messages and the rate at which subscriber applications are consumingmessages. You can also use this dashboard to determine if any of the subscribersare either not consuming messages or are slow to consume messages.
Group Widgets
The Messaging Engines dashboard shows the following group widgets:v [Summary] - Average Local Wait Time (Last 24 Hours)v [Summary] - Expired Messages (Last 24 Hours)v [Summary] - Incomplete Topic Publications (Last 24 Hours)v [Summary] - Total Published (Last 24 Hours)v Messaging Engines
To view group widget help, click the online help icon ( ) on the group widget.
[Summary] - Average Local Wait Time (Last 24 Hours)The [Summary] - Average Local Wait Time (Last 24 Hours) group widget displaysthe average local wait time of the messaging engines that are supported by theWebSphere Application Server during the previous 24 hours.
Tip:
v No data is available if the PMI is not enabled or is not set high enough on theapplication server.
v Some PMI data is only available after the application server is restarted.v Historical collection must be enabled for the Messaging Engines attribute group
to see data.v Some data is not available if you are monitoring WebSphere Liberty.v Unless you configure the data collector within the JVM of the application server,
data is not available.v The chart displays the average local wait time for all messaging engines. Select a
messaging engine in the Messaging Engines table to filter the chart for a specificmessaging engine.
The [Summary] - Average Local Wait Time (Last 24 Hours) group widget providesthe information in the following table:
Chapter 3. Group widget help 31

KPI Description Definition
Sample date and time The date and time that theagent collected the data.
KYNMSGENG.SDATE_TIME
Average local wait time The time spent by messageson this durable subscriptionat consumption at thecollection interval.
KYNMSGENG.AVG_LOC_WT
[Summary] - Expired Messages (Last 24 Hours)The [Summary] - Expired Messages (Last 24 Hours) widget displays the number ofreport-enabled messages that expired during the previous 24 hours.
Tip:
v No data is available if the PMI is not enabled or is not set high enough on theapplication server.
v Some PMI data is only available after the application server is restarted.v Historical collection must be enabled for the messaging engines attribute group
to see data.v Some data is not available if you are monitoring WebSphere Liberty.v Unless you configure the data collector within the JVM of the application server,
data is not available.v The chart displays the number of report-enabled messages that expired for all
messaging engines. Select a messaging engine in the Messaging Engines table tofilter the chart for a specific messaging engine.
The [Summary] - Expired Messages (Last 24 Hours) group widget provides theinformation in the following table:
KPI Description Definition
Sample date and time The date and time that theagent collected the data.
KYNMSGENG.SDATE_TIME
Expired messages The number ofreport-enabled messages thatexpired at the collectioninterval.
KYNMSGENG.EXP_MSG
[Summary] - Incomplete Topic Publications (Last 24 Hours)[Summary] - Incomplete Topic Publications (Last 24 Hours) group widget displaysthe number of incomplete topic publications made during the previous 24 hours.
Tip:
v No data is available if the PMI is not enabled or is not set high enough on theapplication server.
v Some PMI data is only available after the application server is restarted.v Historical collection must be enabled for the Messaging Engines attribute group
to see data.v No data is available if you are monitoring WebSphere Liberty.v Unless you configure the data collector within the JVM of the application server,
data is not available.
32 Application Performance Diagnostics: Application Performance Diagnostics Reference

v The chart displays the number of incomplete topic publications for all messagingengines. Select a messaging engine in the Messaging Engines table to filter thechart for a specific messaging engine.
The [Summary] - Incomplete Topic Publications (Last 24 Hours) group widgetprovides the information in the following table:
KPI Description Definition
Sample date and time The date and time that theagent collected the data.
KYNMSGENG.SDATE_TIME
Incomplete topic publications The number of publicationsthat were not yet received byall current subscribers at thecollection interval.
KYNMSGENG.INCOM_TOPI
[Summary] - Total Published (Last 24 Hours)The [Summary] - Total Published (Last 24 Hours) widget displays the number ofmessages published to the messaging engines during the previous 24 hours.
Tip:
v No data is available if the PMI is not enabled or is not set high enough on theapplication server.
v Some PMI data is only available after the application server is restarted.v Historical collection must be enabled for the Messaging Engines attribute group
to see data.v No data is available if you are monitoring WebSphere Liberty.v Unless you configure the data collector within the JVM of the application server,
data is not available.v The chart displays the number of publications to the messaging engines. Select a
messaging engine in the Messaging Engines table to filter the chart for a specificmessaging engine.
The [Summary] - Total Published (Last 24 Hours) group widget provides theinformation in the following table:
KPI Description Definition
Sample date and time The date and time that theagent collected the data.
KYNMSGENG.SDATE_TIME
Total published The total number ofmessages published to themessaging engines duringthe current interval.
KYNMSGENG.TOT_PUB
Messaging EnginesThe Messaging Engines group widget displays information about the performanceof the messaging engines that are supported by the WebSphere Application Serverduring the current interval.
Tip:
v No data is available if the PMI is not enabled or is not set high enough on theapplication server.
v Some PMI data is only available after the application server is restarted.
Chapter 3. Group widget help 33

v Historical collection must be enabled for the messaging engines attribute groupto see data.
v Some data is not available if you are monitoring WebSphere Liberty.v Select a messaging engine in the table to filter the [Summary] - Average Local
Wait Time (Last 24 Hours), the [Summary] - Expired Messages (Last 24 Hours),the [Summary] - Incomplete Topic Publications (Last 24 Hours), and [Summary]- Total Published (Last 24 Hours) group widgets for the messaging engine. Toremove the filtering, click Clear Selection.
The Messaging Engines group widget provides the information in the followingtable:
KPI Description Definition
Messaging engine name The name of the messagingengine.
KYNMSGENG.MSGE_NAME
Sample date and time The date and time that theagent collected the data.
KYNMSGENG.SDATE_TIME
Average local wait time(ms)
The time spent by messageson this durable subscriptionat consumption during thecurrent interval.
KYNMSGENG.AVG_LOC_WT
Expired messages The number ofreport-enabled messagesthat expired during thecurrent interval.
KYNMSGENG.EXP_MSG
Incomplete topicpublications
The number of publicationsnot yet received by allcurrent subscribers duringthe current interval.
KYNMSGENG.INCOM_TOPI
Total published The total number ofmessages published to themessaging engine duringthe current interval.
KYNMSGENG.TOT_PUB
Web Services dashboardUse the Web Services dashboard to identify the most used web services and anyproblems with the performance of your web services. The dashboard helps you todetermine whether a performance problem lies with the code or an underlyingresource. The dashboard also helps you identify bottlenecks at the Web ServiceGateway that have an impact on the performance of all web services. You canleverage this data to do future capacity analysis, partitioning the systems properlyfor projected growth.
Group Widgets
The Web Services dashboard shows the following group widgets:v Web Service (Last 24 Hours) - [Service]v Web Servicesv Web Services Gateway
To view group widget help, click the online help icon ( ) on the group widget.
34 Application Performance Diagnostics: Application Performance Diagnostics Reference

Web Service (Last 24 Hours) - [Service]The Web Service (Last 24 Hours) - [Service] group widget displays the requestresponse time and number of requests received for the specified web serviceduring the previous 24 hours.
Tip:
v Historical collection must be enabled for the Web Services attribute group to seedata.
v Some data is not available if you are monitoring WebSphere Liberty.v Unless you configure the data collector within the JVM of the application server,
data is not available.v The chart is filtered for the service you selected in the Web Services group
widget.
The Web Service (Last 24 Hours) - [Service] group widget provides the informationin the following table:
KPI Description Definition
Sample date and time The date and time that theagent collected the data.
KYNWEBSVC.SDATE_TIME
Response time (ms) The average request responsetime (in milliseconds) at eachcollection interval.
KYNWEBSVC.RESP_TIME
Received requests The number of requests theservice received.
KYNWEBSVC.RCV_REQ
Web ServicesThe Web Services group widget displays information about the performance of theweb services during the current interval.
Tip:
v No data is available if the PMI is not enabled or is not set high enough on theapplication server.
v Some PMI data is only available after the application server is restarted.v Some data is not available if you are monitoring WebSphere Liberty.v Select a service in this table to filter the Web Service (Last 24 Hours) - [Service]
group widgets for the service name. To remove the filtering, click ClearSelection.
The Web Services group widget provides the information in the following table.
KPI Description Definition
Web service The name of the web service. KYNWEBSVC.WEB_SVC
Received requests The number of requestsreceived during the currentinterval.
KYNWEBSVC.RCV_REQ
Processed requests The number of requests theservice successfullyprocessed during the currentinterval.
KYNWEBSVC.PROC_REQ
Chapter 3. Group widget help 35

KPI Description Definition
Response time The average response time(in milliseconds) for arequest during the currentinterval.
KYNWEBSVC.RESP_TIME
Request payload size The average payload size (inbytes) of a received requestor reply during the currentinterval.
KYNWEBSVC.PAYLOAD
Web Services GatewayThe Web Services Gateway group widget displays information about the WebServices Gateway, including synchronous requests, asynchronous requests,synchronous responses, and asynchronous responses.
The Web Services Gateway group widget provides the information in the followingtable:
KPI Description Definition
Web Service The name of the web service. KYNWEBSGW.WEB_SVC
Synchronous requests The number of synchronousrequests made.
KYNWEBSGW.SYN_REQ
Synchronous responses The number of synchronousresponses made.
KYNWEBSGW.SYN_RESP
Asynchronous requests The number of asynchronousrequests made.
KYNWEBSGW.ASYN_REQ
Asynchronous responses The number of asynchronousresponses made.
KYNWEBSGW.ASYN_RESP
Web Applications dashboardUse the Web Applications dashboard to identify problems with the performance ofyour web applications.
Group Widgets
The Web Applications dashboard shows the following group widgets:v Web Applications (Last 24 Hours) - [Application]v Servlets/JSPs - [Application]v Servlet/JSP (Last 24 Hours) - [Servlet/JSP Name]
To view group widget help, click the help icon ( ) on the group widget.
Web Applications (Last 24 Hours) - [Application]The Web Applications (Last 24 Hours) - [Application] group widget displays theaverage response time and the average throughput of the selected applicationduring the previous 24 hours.
Tip:
v Historical collection must be enabled for the Web Applications attribute group tosee data.
36 Application Performance Diagnostics: Application Performance Diagnostics Reference

v The chart is filtered for the application you selected in the Slowest WebApplications (Last 2 Hours) from PMI group widget.
The Web Applications (Last 24 Hours) - [Application] group widget provides theinformation in the following table:
KPI Description Definition
Average response time (ms) The average response time(in milliseconds) at thecollection interval.
KYNAPP.AVG_TIME
Throughput (per sec) The average throughput atthe collection interval.
KYNAPP.REQ_RATE
Servlets/JSPs - [Application]The Servlets/JSPs - [Application] group widget displays the average response timeand the number of requests for JSP or servlets associated with the specifiedapplication during the current interval.
Tip:
v The table is filtered for the application you selected in the Slowest WebApplications (Last 2 Hours) from PMI group widget.
v Select a servlet or JSP in this table to filter the Servlet/JSP (Last 24 Hours) -[Servlet/JSP Name] group widgets for the servlet or JSP. To remove the filtering,click Clear Selection.
The Servlets/JSPs - [Application] group widget provides the information in thefollowing table:
KPI Description Definition
Servlet/JSP name The name of the servlet orJSP.
KYNSERVLT.SVLT_NAME
Average response time (ms) The average response time(in milliseconds) for theservlets or JSPs during thecollection interval.
KYNSERVLT.AVG_RT
Request count The number of requests forthe servlets or JSPs duringthe current interval.
KYNSERVLT.NUM_REQ
Servlet/JSP (Last 24 Hours) - [Servlet/JSP Name]The Servlet/JSP (Last 24 Hours) - [Servlet/JSP Name] group widget displays theaverage response time and the average throughput for the selected servlet or JSPduring the previous 24 hours.
Tip:
v Historical collection must be enabled for the Servlets JSPs attribute group to seedata.
v Select a request in the Servlets/JSPs - [Application] table to filter the chart for aspecific servlet or JSP.
The Servlet/JSP (Last 24 Hours) - [Servlet/JSP Name] group widget provides theinformation in the following table:
Chapter 3. Group widget help 37

KPI Description Definition
Sample date and time The date and time that theagent collected the data.
KYNSERVLT.SDATE_TIME
Average response time (ms) The average response time(in milliseconds) for theservlets or JSPs during thecollection interval.
KYNSERVLT.AVG_RT
Throughput (per sec) The average throughput atthe collection interval.
KYNSERVLT.RTE_REQ
JVM GC dashboardUse the JVM GC dashboard to determine if memory leaks are occurring on theserver and if the heap is poorly structured.
Group Widgets
The JVM GC dashboard shows the following group widgets:v Heap Usage (Last 24 Hours)v JVM CPU Usage (Last 24 Hours)v GC Count and GC Duration (Last 2 Hours)v Throughput and Average Response Time (Last 24 Hours)v Garbage Collection Analysis
To view group widget help, click the online help icon ( ) on the group widget.
JVM CPU Usage (Last 24 Hours)The JVM CPU Usage (Last 24 Hours) group widget displays the number ofmilliseconds of CPU that was used by the JVM during the previous 24 hours.
Tip:
v Historical collection must be enabled for the Application Server attribute groupto see data.
v You might see gaps on the time axis of the chart if the application server wasshut down during the time period.
v Unless you configure the data collector within the JVM of the application server,data is not available.
The JVM CPU Usage (Last 24 Hours) group widget provides the information in thefollowing table:
KPI Description Definition
Sample date and time The date and time that theagent collected the data.
KYNAPSRV.SDATE_TIME
CPU used (ms) The number of millisecondsof the JVM CPU used at thecollection interval.
KYNAPSRV.AS_CPU
Throughput and Average Response Time (Last 24 Hours)The Throughput and Average Response Time (Last 24 Hours) group widgetdisplays the throughput and average response time during the previous 24 hours.
38 Application Performance Diagnostics: Application Performance Diagnostics Reference

Tip:
v Historical collection must be enabled for the Request Times and Rates attributegroup to see data.
v Unless you configure the data collector within the JVM of the application server,data is not available.
The Throughput and Average Response Time (Last 24 Hours) group widgetprovides the information in the following table:
KPI Description Definition
Sample date and time The time and date that theagent collected the data.
KYNREQHIS.SDATE_TIME
Throughput The throughput of requestsat the collection interval.
KYNREQHIS.REQ_RATE
Average response time (ms) Average response time (inmilliseconds) at the collectioninterval.
KYNREQHIS.AVG_TIME
GC Count and GC Duration (Last 2 Hours)The GC Count and GC Duration (Last 2 Hours) group widget displays theduration of garbage collection during the previous 2 hours. The group widget alsodisplays the number of times that the JVM started the garbage collector during theprevious 2 hours.
Tip:
v Data might not be available if you are monitoring WebSphere Liberty.v Historical collection must be enabled for the Garbage Collection Analysis
attribute group to see data.v Unless you configure the data collector within the JVM of the application server,
data is not available.
KPI Description Definition
Sample date and time The date and time that theagent collected the data.
KYNGCACT.SDATE_TIME
GC duration (ms) The duration of time (inmilliseconds) that garbagecollection took at thecollection interval.
KYNGCACT.REAL_TIME
GC count The number of times that thegarbage collection had run atthe collection interval.
KYNGCACT.NUM_RUN
Heap Usage (Last 24 Hours)The Heap Usage (Last 24 Hours) group widget displays the size of free memoryand used memory in the WebSphere Application Server heap during the previous24 hours.
Tip:
v Historical collection must be enabled for the Garbage Collection Analysisattribute group to see data.
Chapter 3. Group widget help 39

The Heap Usage (Last 24 Hours) group widget provides the information in thefollowing table:
KPI Description Definition
Sample date and time The date and time that theagent collected the data.
KYNGCACT.SDATE_TIME
Kbytes used The number of kilobytes inthe heap that were in usefollowing thegarbage-collection cycle atthe collection interval.
KYNGCACT.IN_USE
Kbytes free The total number of freekilobytes in the heapfollowing thegarbage-collection cycle atthe collection interval.
KYNGCACT.NUMB_FREE
Garbage Collection AnalysisThe Garbage Collection Analysis group widget displays the number of times thegarbage collector ran during the current interval and the resulting number ofobjects that the collector freed.
Tip:
v Unless you configure the data collector within the JVM of the application server,data is not available.
v Data might not be available if you are monitoring WebSphere Liberty.
The Garbage Collection Analysis group widget provides the information in thefollowing table:
KPI Description Definition
Server name The name of the WebSphereApplication Server.
KYNGCACT.SERVER_NAM
Process ID The unique identifier of theJVM process (the class ID ofthe JVM).
KYNGCACT.PID
Times run The number of times thegarbage collector ran duringthe current interval.
KYNGCACT.NUM_RUN
KB Total Freed by GC The total number ofkilobytes freed by thegarbage collector during thecurrent interval.
KYNGCACT.BYTE_FREE
GC duration (ms) The total real time (inmilliseconds) the garbagecollector required during themost recent cycle of thecurrent interval.
KYNGCACT.REAL_TIME
GC duration (%) The percentage of real timethat the garbage collectorwas active during the currentinterval.
KYNGCACT.REAL_TPCT
40 Application Performance Diagnostics: Application Performance Diagnostics Reference

KPI Description Definition
GC rate (per min) The rate (per minute) atwhich the Java virtualmachine is starting itsgarbage-collection routineduring the current interval.
KYNGCACT.GC_RATE
DB Connection Pools dashboardUse the DB Connection Pools dashboard to identify if any of your DB connectionpools are to small to handle the load that is placed on them.
Group Widgets
The DB Connection Pools dashboard shows the following group widgets:v DB Connection Pools with Highest Wait Timev DB Connection Pools with Highest Allocation Ratev [Summary] Pool Used (Last 24 Hours)v DB Connection Pools
To view group widget help, click the online help icon ( ) on the group widget.
[Summary] Pool Used (Last 24 Hours)The [Summary] Pool Used (Last 24 Hours) group widget displays the averagepercentage of all connection pools in use at each interval during the previous 24hours.
Tip:
v Historical collection must be enabled for the DB Connection Pools attributegroup to see data.
v No data is available if you are monitoring WebSphere Liberty.v The chart displays the average percentage of all connection pools in use at each
interval during the previous 24 hours. Select a pool in the DB connection poolstable to filter the chart for that pool.
The [Summary] Pool Used (Last 24 Hours) group widget provides the informationin the following table:
KPI Description Definition
Sample date and time The date and time that theagent collected the data.
KYNDBCONP.SDATE_TIME
Percent used The average percentage ofthe connection pools in useat the collection interval.
KYNDBCONP.PCT_USED
DB Connection Pools with Highest Wait TimeThe DB Connection Pools with Highest Wait Time group widget displays the 5data sources with the highest average wait times during the current interval.
The DB Connection Pools with Highest Wait Time group widget provides theinformation in the following table.
Chapter 3. Group widget help 41

KPI Description Definition
Datasource name The name of the data source. KYNDBCONP.NAME
Average wait time (ms) The average time (inmilliseconds) that a clientwaited to be granted aconnection during thecurrent interval.
KYNDBCONP.AVG_WAITTM
DB Connection Pools with Highest Allocation RateThe DB Connection Pools with Highest Allocation Rate group widget displays the5 DB connection pools that are most heavily used during the current interval.
Tip:
v No data is available if the PMI is not enabled or is not set high enough on theapplication server.
v Some PMI data is only available after the application server is restarted.v No data is available if you are monitoring WebSphere Liberty.
The DB Connection Pools with Highest Allocation Rate group widget provides theinformation in the following table.
KPI Description Definition
Datasource name The name of the data source. KYNDBCONP.NAME
Connections allocation rate(per sec)
The rate, per second, atwhich connections areallocated during the currentinterval.
KYNDBCONP.RTE_ALLOC
DB Connection PoolsThe DB Connection Pools group widget displays information about theperformance of the DB connection pools during the current interval.v Some data is not available if you are monitoring WebSphere Liberty.v Select a datasource in the table to filter the [Summary] Pool Used (Last 24
Hours) group widget for the data source. To remove the filtering, click ClearSelection.
The DB Connection Pools group widget provides the information in the followingtable:
KPI Description Definition
Datasource label The abbreviated name of thedata source.
KYNDBCONP.DSSH_NAME
Datasource name The name of the data source. KYNDBCONP.NAME
Maximum pool size The maximum number ofconnections that can becreated in this connectionpool.
KYNDBCONP.MAX_SIZE
Average wait time (ms) The average time (inmilliseconds) that a clientwaited for a connectionduring the current interval.
KYNDBCONP.AVG_WAITTM
42 Application Performance Diagnostics: Application Performance Diagnostics Reference

KPI Description Definition
Average waiting threads The average number ofthreads that are waiting for aconnection during thecurrent interval.
KYNDBCONP.AVG_WAIT
Percent used The average percentage ofthe connection pool in useduring the current interval.
KYNDBCONP.PCT_USED
Thread Pools dashboardUse the Thread Pools dashboard to identify if any of your thread pools are notlarge enough to handle the load that is placed on them.
Group Widgets
The Thread Pools dashboard shows the following group widgets:v [Thread Pool] - Average Pool Size (Last 24 Hours)v Average Thread Pool Usagev [Thread Pool] Usage (Last 24 Hours)v Thread Pools
To view group widget help, click the online help icon ( ) on the group widget.
Average Thread Pool UsageThe Average Thread Pool Usage group widget displays the average number ofactive threads and free threads for each thread pool.
Tip:
v No data is available if the PMI is not enabled or is not set high enough on theapplication server.
v Some PMI data is only available after the application server is restarted.
The Average Thread Pool Usage group widget provides the information in thefollowing table:
KPI Description Definition
Thread pool name The thread pool name. KYNTHRDP.THRDP_NAME
Average active threads The average number ofconcurrently active threadsduring the current interval.
KYNTHRDP.NUM_ACTTHR
Average free threads The average number of freethreads during the currentinterval.
KYNTHRDP.AVG_INACT
[Thread Pool] Usage (Last 24 Hours)The [Thread Pool] Usage (Last 24 Hours) group widget displays information aboutthe usage of the thread pool during the previous 24 hours.
Tip:
v No data is available if the PMI is not enabled or is not set high enough on theapplication server.
Chapter 3. Group widget help 43

v Some PMI data is only available after the application server is restarted.v Historical collection must be enabled for the Thread Pools attribute group to see
data.v Some data is not available if you are monitoring WebSphere Liberty.v The chart displays the usage of the web container, or in the case of WebSphere
Liberty, the default executor, when no row is selected. Select a thread pool in thethread pools table to filter the chart for a specific thread pool.
The [Thread Pool] Usage (Last 24 Hours) group widget provides the information inthe following table:
KPI Description Definition
Sample date and time The date and time that theagent collected the data.
KYNTHRDP.SDATE_TIME
Maximum pool size The configured maximumnumber of web containerthreads in the pool at eachinterval during theprevious 24 hours.
KYNTHRDP.MAX_SIZE
Average active threads The average number ofconcurrently active webcontainer threads at eachinterval during theprevious 24 hours.
KYNTHRDP.NUM_ACTTHR
Thread PoolsThe Thread Pools group widget displays information about the performance ofeach thread pool during the current interval.
Tip:
v No data is available if the PMI is not enabled or is not set high enough on theapplication server.
v Some PMI data is only available after the application server is restarted.v Some data is not available if you are monitoring WebSphere Liberty.v Select a thread pool in the table to filter the [Thread Pool] - Average Pool Size
(Last 24 Hours) group widget for the data source. To remove the filtering, clickClear Selection.
The Thread Pools group widget provides the information in the following table.
The table is sorted on the thread pool name.
KPI Description Definition
Thread pool name The thread pool name. KYNTHRDP.THRDP_NAME
Maximum pool size The configured number ofthreads that are allowed inthe thread pool.
KYNTHRDP.MAX_SIZE
Average active threads The average number ofconcurrently active threadsduring the current interval.
KYNTHRDP.NUM_ACTTHR
44 Application Performance Diagnostics: Application Performance Diagnostics Reference

KPI Description Definition
Average pool size The average number ofconnections in use duringthe current interval.
KYNTHRDP.POOL_SIZE
[Thread Pool] - Average Pool Size (Last 24 Hours)The [Thread Pool] - Average Pool Size (Last 24 Hours) group widget displays theaverage pool size during the previous 24 hours.
Note:
v Historical collection must be enabled for the Thread Pools attribute group to seedata.
v The chart displays the average number of threads in the web container, or in thecase of WebSphere Liberty, the default executor, when no row is selected. Selecta pool in the thread pools table to filter the chart for that pool.
The [Thread Pool] - Average Pool Size (Last 24 Hours) group widget provides theinformation in the following table:
KPI Description Definition
Sample date and time The date and time that theagent collected the data.
KYNTHRDP.SDATE_TIME
Average pool size The average size of the poolat the collection interval.
KYNTHRDP.POOL_SIZE
Log Messages dashboardUse the Log Messages dashboard to identify spikes in the arrival of error andwarning messages.
The Agent for WebSphere Applications reads the application server log files andanalyzes the data.
Look for periods of time when a spike of errors occurred.Search for the corresponding time stamp in the log analysis table to viewthe error details.
Group Widgets
The Log Messages dashboard shows the Log Messages group widget.
To view group widget help, click the online help icon ( ) on the group widget.
Log MessagesThe Log Messages group widget displays the most recent 100 error and warningmessages in the SystemOut.log file, or in the case of WebSphere Liberty, themessages.log file. The chart shows the creation of the messages over time. Thetable shows further details about each of the error and warning messages.
Tip:
v Unless you configure the data collector within the application server, data is notavailable.
Chapter 3. Group widget help 45

v Only time intervals during which a log message was created are plotted on thechart.
v When you increase the levels of logging and tracing, the log file and the groupwidget are updated more frequently. If the log file updates too quickly, nomessages are displayed in the group widget.
The Log Messages group widget provides the information in the following table:
KPI Description Definition
Error date andtime
Time interval duringwhich a log message wasrecorded.
KYNLOGANAL.SDATE_TIME
Errors Number of errors in thelast 100 messages in thelog file.
COUNT(KYNLOGANAL.SEVERITY)WHERE KYNLOGANAL.SEVERITY=22
Warnings Number of warnings inthe last 100 messages inthe log file.
COUNT(KYNLOGANAL.SEVERITY)WHERE KYNLOGANAL.SEVERITY=21
Thread ID The unique identifier ofthe thread where theevent message occurred.
KYNLOGANAL.THREADID
Severity The severity of themessage.
KYNLOGANAL.SEVERITYWHERE KYNLOGANAL.SEVERITY=21OR WHEREKYNLOGANAL.SEVERITY=22
Message ID The ID of the message. KYNLOGANAL.MSG_ID
Message text The text of the message. KYNLOGANAL.ERR_MSG
Process ID The process ID of theJVM.
KYNLOGANAL.PROCESSID
Diagnostics dashboardsThe Agent for WebSphere Applications provides several dashboards for performingdeep-dive diagnosis of the WebSphere Application Server.
Request Summary dashboardUse the Request Summary dashboard to identify in which Java segments therequest spent the most time. From this dashboard, you can drill down to therequest instances that took the most time.
Group Widgets
The Request Summary dashboard shows the following group widgets:v Request Summaryv Response Time Breakdownv Response Time Distribution
To view group widget help, click the online help icon ( ) on the group widget.
46 Application Performance Diagnostics: Application Performance Diagnostics Reference

Request SummaryThe Request Summary group widget displays an aggregated view of all requestson the application server. The requests are sorted by the average response time.The table displays the aggregated average response time and average CPU usagefor each request.
Use the Request Summary table to identify which requests have a problem. Drilldown into the Request Instance table to debug the problematic transactions.
Tip:
v Unless you configure the data collector within the JVM of the application server,data is not available.
v No data is available if diagnostics mode is disabled.v Select any request to filter the Response Time Breakdown and the Response
Time Distribution charts for the specific request. To remove the filtering, clickClear Selection.
v You can drill down to view the request instances that are associated with arequest. Click View Instance data on the request row.
The Request Summary group widget provides the information in the followingtable:
KPI Description Definition
Start record date and time The start date and time of thesampled period for allsummary records.
KYNREQSMRY.SREC_DTTIM
End record date and time The end date and time of thesampled period for allsummary records.
KYNREQSMRY.EREC_DTTIM
Request name The request name. KYNREQSMRY.REQ_NAME
Average response time(ms)
The average response time, inmilliseconds, for the request.
KYNREQSMRY.AVG_RESP
Minimum response time(ms)
The minimum response time,in milliseconds, for therequest.
KYNREQSMRY.MIN_RESP
Maximum response time(ms)
The maximum response time,in milliseconds, for therequest.
KYNREQSMRY.MAX_RESP
Chapter 3. Group widget help 47

KPI Description Definition
Sampled requests count The number of sampledrequest instances.
All requests are displayed inthe Request Summary table.However, sampling isapplied, by default, at therequest instance level. Thedc.sampling.frequencyproperty in thedc_home/itcam.toolkit/gdc/etc/gdc.properties filespecifies how often a specificrequest name is sampled.
The Sampled requests countis less that or equal to therequest count.
KYNREQSMRY.SAMP_INST
Request count The number of requestsinstances.
KYNREQSMRY.REQ_COUNTT
CPU time (ms) The average CPU time for therequest.
KYNREQSMRY.AVG_CPU
Request type The request type. Valid valuesare:
v Servlet
v EJB Method
v JMS
v JCA
v JNDI
v JDBC
v WebService
v Custom
v SkinRender
v PortalPhase
v PortalRequest
v ContentHandlerRequest
v PortalPhase
v PortalLogin
v Portlet
v ScreenRender
v ThemeRender
Important: WebServicerequest type is not supportedfor WebSphere Liberty.
KYNREQSMRY.REQ_TYPE
Important: The Action column does not display a KPI. In this column, you canclick View Instance data to view the request instances that are associated with arequest.
48 Application Performance Diagnostics: Application Performance Diagnostics Reference
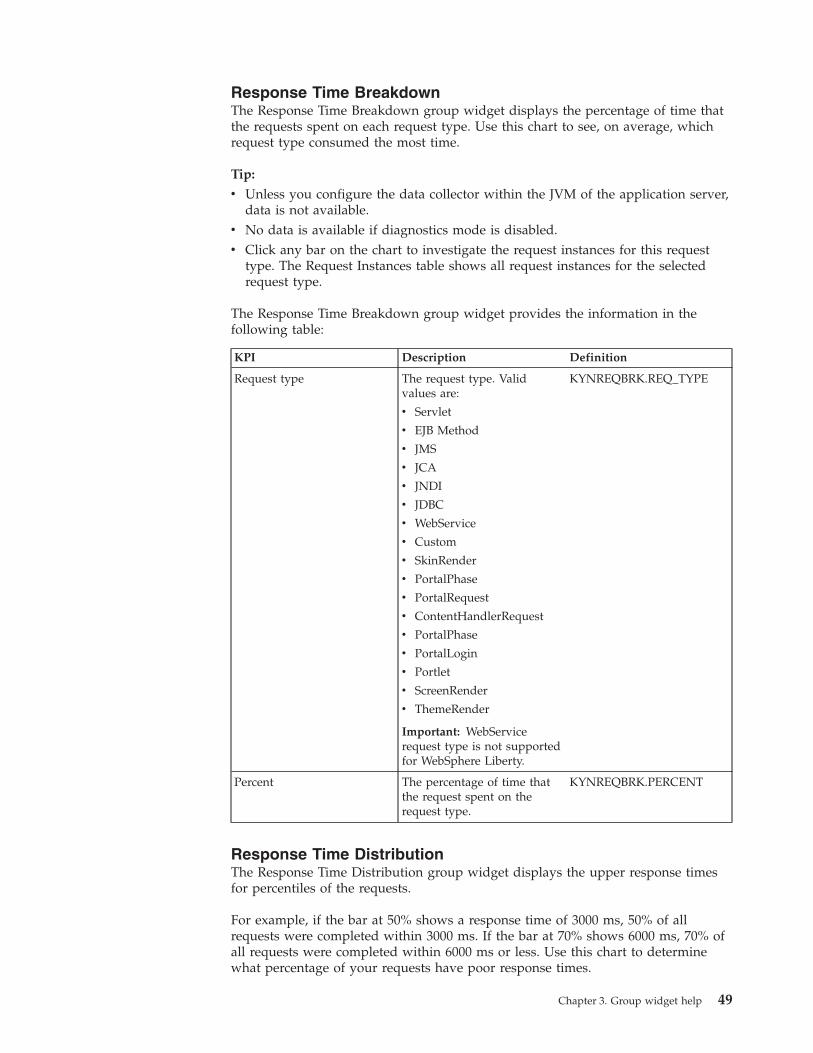
Response Time BreakdownThe Response Time Breakdown group widget displays the percentage of time thatthe requests spent on each request type. Use this chart to see, on average, whichrequest type consumed the most time.
Tip:
v Unless you configure the data collector within the JVM of the application server,data is not available.
v No data is available if diagnostics mode is disabled.v Click any bar on the chart to investigate the request instances for this request
type. The Request Instances table shows all request instances for the selectedrequest type.
The Response Time Breakdown group widget provides the information in thefollowing table:
KPI Description Definition
Request type The request type. Validvalues are:
v Servlet
v EJB Method
v JMS
v JCA
v JNDI
v JDBC
v WebService
v Custom
v SkinRender
v PortalPhase
v PortalRequest
v ContentHandlerRequest
v PortalPhase
v PortalLogin
v Portlet
v ScreenRender
v ThemeRender
Important: WebServicerequest type is not supportedfor WebSphere Liberty.
KYNREQBRK.REQ_TYPE
Percent The percentage of time thatthe request spent on therequest type.
KYNREQBRK.PERCENT
Response Time DistributionThe Response Time Distribution group widget displays the upper response timesfor percentiles of the requests.
For example, if the bar at 50% shows a response time of 3000 ms, 50% of allrequests were completed within 3000 ms. If the bar at 70% shows 6000 ms, 70% ofall requests were completed within 6000 ms or less. Use this chart to determinewhat percentage of your requests have poor response times.
Chapter 3. Group widget help 49

Tip:
v Unless you configure the data collector within the JVM of the application server,data is not available.
v No data is available if diagnostics mode is disabled.v Click any bar on the chart to investigate requests that have a response time in
this percentile. For example, if the 50% bar shows a response time of 3000 msand the 60% bar shows a response time of 4000 ms, click the 60% bar toinvestigate request instances with a response time between 3000 and 4000 ms.
The Response Time Distribution group widget provides the information in thefollowing table:
KPI Description Definition
Upper-bound response time(ms)
The upper-bound responsetime, in seconds, for thepercentile value. Forexample, if the bar at the80% percentile shows a valueof 6500 ms, 80% of requestswere processed within 6500ms.
KYNREQDIST.UB
Percent of requestcompletion
The percentile value. KYNREQDIST.PV
Request Instances dashboardUse the Request Instances dashboard to determine if all of the request instances ofa request have a problem.
Group Widgets
The Request Instances dashboard shows the following group widgets:v Request Instancesv Request Contextv Request Stack Trace
To view group widget help, click the online help icon ( ) on the group widget.
Request InstancesThe Request Instances group widget displays the response time for individualrequests inclusive of their nested requests. The table is sorted by response time bydefault. Use the group widget to identify the request instances with the highestresponse time.
Tip:
v Unless you configure the data collector within the JVM of the application server,data is not available.
v No data is available if diagnostics mode is disabled.v Select any request instance to filter the Request context and the Request stack
trace tables for the specific request instance. To remove the filtering, click ClearSelection.
v You can drill down to view the request sequence for this instance. Click Viewrequest sequence on the request row.
50 Application Performance Diagnostics: Application Performance Diagnostics Reference
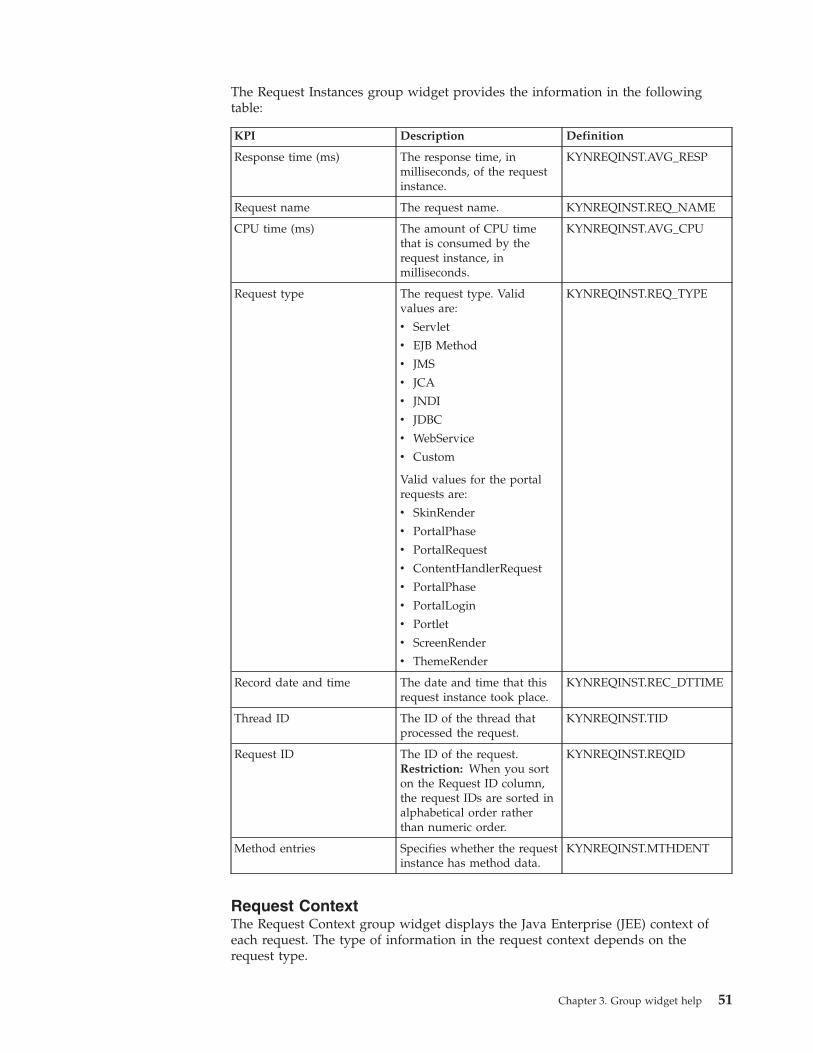
The Request Instances group widget provides the information in the followingtable:
KPI Description Definition
Response time (ms) The response time, inmilliseconds, of the requestinstance.
KYNREQINST.AVG_RESP
Request name The request name. KYNREQINST.REQ_NAME
CPU time (ms) The amount of CPU timethat is consumed by therequest instance, inmilliseconds.
KYNREQINST.AVG_CPU
Request type The request type. Validvalues are:
v Servlet
v EJB Method
v JMS
v JCA
v JNDI
v JDBC
v WebService
v Custom
Valid values for the portalrequests are:
v SkinRender
v PortalPhase
v PortalRequest
v ContentHandlerRequest
v PortalPhase
v PortalLogin
v Portlet
v ScreenRender
v ThemeRender
KYNREQINST.REQ_TYPE
Record date and time The date and time that thisrequest instance took place.
KYNREQINST.REC_DTTIME
Thread ID The ID of the thread thatprocessed the request.
KYNREQINST.TID
Request ID The ID of the request.Restriction: When you sorton the Request ID column,the request IDs are sorted inalphabetical order ratherthan numeric order.
KYNREQINST.REQID
Method entries Specifies whether the requestinstance has method data.
KYNREQINST.MTHDENT
Request ContextThe Request Context group widget displays the Java Enterprise (JEE) context ofeach request. The type of information in the request context depends on therequest type.
Chapter 3. Group widget help 51

For a JNDI request, the request context includes the JNDI resource URI. For aJDBC request, the request context includes the data source name, the request name,and an SQL statement. For an EJB method and servlet requests, the request contextincludes the request name and the application module name.
When you have multiple instances of a resource in your environment, use therequest context to identify which resource instance the request used.
Tip:
v Unless you configure the data collector within the JVM of the application server,data is not available.
v No data is available if diagnostics mode is disabled.v No data is available if you disabled the collection of request context data.v No data is available if threshold-based monitoring is enabled and a threshold is
not exceeded.v Select a request in the request instances table to show context information for
the request instance.
The Request Context group widget provides the information in the following table:
KPI Description Definition
Name The parameter name in thename-value pair.
For example, for a JDBCrequest type, a parametername is SQL. The valuecolumn displays the SQLstatement.
KYNREQCTX.VNAME
Value The parameter value in thename-value pair.
KYNREQCTX.VAL
Request Stack TraceThe Request Stack Trace group widget displays the stack trace for the selectedrequest or nested request. The data collector tracks the progress of a request. Whena violation occurs, the data collector captures a stack trace.
Use the stack trace to understand the context in which a method call was made. Amethod trace might perform differently depending on caller method. Each callermethod might pass different input parameters to the method call.
Use the stack trace to identify and fix looping conditions.
The stack trace also provides the depth of a method call. A high number of nestedcalls might lead to a high method response time.
Tip:
v Unless you configure the data collector within the JVM of the application server,data is not available.
v No data is available if diagnostics mode is disabled.v No data is available if threshold-based monitoring is enabled and a threshold is
not exceeded.v No data is available if you disabled the collection of stack trace data.
52 Application Performance Diagnostics: Application Performance Diagnostics Reference

v Select a request in the request instances table to show the stack trace for therequest instance.
The Request Stack Trace group widget provides the information in the followingtable:
KPI Description Definition
Fully QualifiedMethod Name
The class name, the methodname within the class name,and the relevant line of thesource code.
KYNREQSTK.FMTHD_NAME
Request Sequence dashboardUse the Request Sequence dashboard to identify the sequence of calls to nestedrequests and methods for a request instance. Use the dashboard to identify the rootcause of a problem, if the problem relates to the code.
Group Widgets
The Request Sequence dashboard shows the following group widgets:v Request Sequencev Request Contextv Request Stack Trace
To view group widget help, click the online help icon ( ) on the group widget.
Request SequenceThe Request Sequence group widget displays a tree view of all the requestinstances and their nested requests. If method data was collected, calls to methodsare included in this tree.
The request sequence table provides the average response time and the CPU usageof request, nested request, or method call.
Tip:
v Unless you configure the data collector within the JVM of the application server,data is not available.
v No data is available if diagnostics mode is disabled.v Method trace data is not available if method trace is disabled. You can enable
method trace from the Agent Configuration page.v Some trace data is not available by default, because method sampling is enabled
in the gdc_dfe.properties file. You can disable method sampling by setting thedc.sampling.methsampler.enabled property to false in thegdc_custom.properties file, which overrides the settings in thegdc_dfe.properties file. The setting can result in degraded server performance.
v Some trace data is not available if some methods take less time than theminimum required method threshold and are filtered out.
v Select any trace to filter the Request context and the Request stack trace tablesfor the specific request. To remove the filtering, click Clear Selection.
v Expand a request in the request trace table to view sub-requests that were calledby the request.
Chapter 3. Group widget help 53
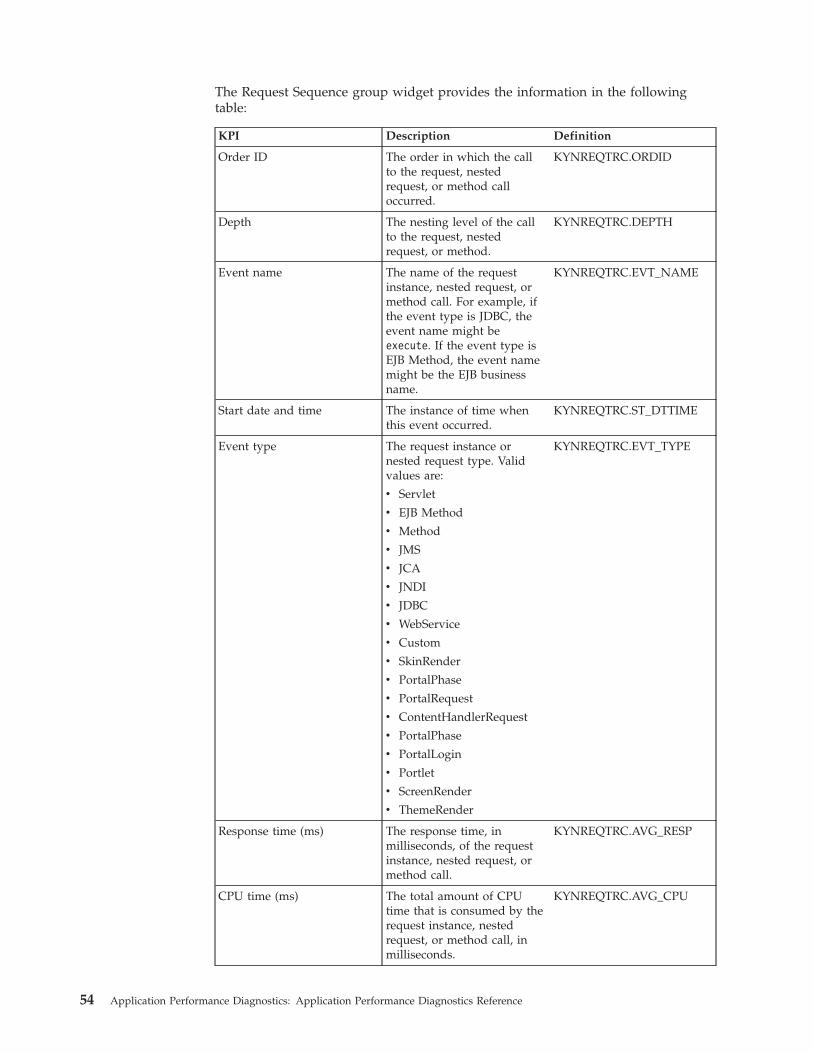
The Request Sequence group widget provides the information in the followingtable:
KPI Description Definition
Order ID The order in which the callto the request, nestedrequest, or method calloccurred.
KYNREQTRC.ORDID
Depth The nesting level of the callto the request, nestedrequest, or method.
KYNREQTRC.DEPTH
Event name The name of the requestinstance, nested request, ormethod call. For example, ifthe event type is JDBC, theevent name might beexecute. If the event type isEJB Method, the event namemight be the EJB businessname.
KYNREQTRC.EVT_NAME
Start date and time The instance of time whenthis event occurred.
KYNREQTRC.ST_DTTIME
Event type The request instance ornested request type. Validvalues are:
v Servlet
v EJB Method
v Method
v JMS
v JCA
v JNDI
v JDBC
v WebService
v Custom
v SkinRender
v PortalPhase
v PortalRequest
v ContentHandlerRequest
v PortalPhase
v PortalLogin
v Portlet
v ScreenRender
v ThemeRender
KYNREQTRC.EVT_TYPE
Response time (ms) The response time, inmilliseconds, of the requestinstance, nested request, ormethod call.
KYNREQTRC.AVG_RESP
CPU time (ms) The total amount of CPUtime that is consumed by therequest instance, nestedrequest, or method call, inmilliseconds.
KYNREQTRC.AVG_CPU
54 Application Performance Diagnostics: Application Performance Diagnostics Reference

KPI Description Definition
Event ID The event identifier. KYNREQTRC.EVTID
Request ContextThe Request Context group widget displays the Java Enterprise (JEE) context ofeach request (event name). The type of information in the request context dependson the request type (event type).
For a JNDI request, the request context includes the JNDI resource URI. For aJDBC request, the request context includes the data source name, the request name,and an SQL statement. For an EJB method and servlet requests, the request contextincludes the request name and the application module name.
When you have multiple instances of a resource in your environment, use therequest context to identify which resource instance the request used.
Tip:
v Unless you configure the data collector within the JVM of the application server,data is not available.
v No data is available if diagnostics mode is disabled.v No data is available if you disabled the collection of request context data.v No data is available if threshold-based monitoring is enabled and a threshold is
not exceeded.v Select a request in the request instances table to show context information for
the request instance.
The Request Context group widget provides the information in the following table:
KPI Description Definition
Name The parameter name in thename-value pair.
For example, for a JDBCrequest type, a parametername is SQL. The valuecolumn displays the SQLstatement.
KYNREQCTX.VNAME
Value The parameter value in thename-value pair.
KYNREQCTX.VAL
Request Stack TraceThe Request Stack Trace group widget displays the stack trace for the selectedrequest or nested request. The data collector tracks the progress of a request. Whena violation occurs, the data collector captures a stack trace.
Use the stack trace to understand the context in which a method call was made. Amethod trace might perform differently depending on caller method. Each callermethod might pass different input parameters to the method call.
Use the stack trace to identify and fix looping conditions.
The stack trace also provides the depth of a method call. A high number of nestedcalls might lead to a high method response time.
Chapter 3. Group widget help 55

Tip:
v Unless you configure the data collector within the JVM of the application server,data is not available.
v No data is available if diagnostics mode is disabled.v No data is available if you disabled the collection of stack trace data for the
request type.v No data is available if you enabled the collection of stack trace data for the
request type but the collection threshold value was not exceeded.v Select a request in the request instances table to show the stack trace for the
request instance.
The Request Stack Trace group widget provides the information in the followingtable:
KPI Description Definition
Fully Qualified MethodName
The class name, the methodname within the class name,and the relevant line of thesource code.
KYNREQSTK.FMTHD_NAME
WebSphere Application Servers dashboardUse the WebSphere Application Servers dashboard to identify in which Javasegments the requests spent the most time. From this dashboard, you can drilldown to the request instances that took the most time.
Group Widgets
The WebSphere Application Servers dashboard shows the following group widgets:v Slowest Request Response Times on WebSphere Application Servers -
[Transaction]v Slowest Request Response Times on WebSphere Application Servers - All
Requests
To view group widget help, click the online help icon ( ) on the group widget.
Slowest Request Response Times on WebSphere ApplicationServers - All RequestsThe Slowest Request Response Times on WebSphere Application Servers - AllRequests group widget displays an aggregated view of requests across all of theapplication servers that are part of the selected application. The requests are sortedby the average response time. The table displays the aggregated average responsetime and average CPU usage for each request.v Unless you configure the data collector within the JVM of the application server,
data is not available.v No data is available if diagnostics mode is disabled for the WebSphere
Application Server.v No data is available unless you the Web Response Time agent and the Agent for
WebSphere Applications agent are running.v You can drill down to view the request instances that are associated with a
request. Click View Instance data on the request row.
56 Application Performance Diagnostics: Application Performance Diagnostics Reference

The Slowest Request Response Times on WebSphere Application Servers - AllRequests group widget provides the information in the following table:
KPI Description Definition
Origin Node(encoded servername)
The encoded name of the serverthat processes the request.
KYNREQSMRY.ORIGINNODE
Request name The request name. KYNREQSMRY.REQ_NAME
Average responsetime (ms)
The average response time, inmilliseconds, for the request.
KYNREQSMRY.AVG_RESP
Minimum responsetime (ms)
The minimum response time, inmilliseconds, for the request.
KYNREQSMRY.MIN_RESP
Maximum responsetime (ms)
The maximum response time, inmilliseconds, for the request.
KYNREQSMRY.MAX_RESP
Sampled requestscount
The number of sampled requestinstances.
All requests are displayed in theRequest Summary table. However,sampling is applied, by default, atthe request instance level. Thedc.sampling.frequency propertyin the dc_home/itcam.toolkit/gdc/etc/gdc.properties filespecifies how often a specificrequest name is sampled.
The Sampled requests count isless that or equal to the requestcount.
KYNREQSMRY.SAMP_INST
Request count The number of requests instances. KYNREQSMRY.REQ_COUNTT
CPU time (ms) The CPU time for the request. KYNREQSMRY.AVG_CPU
Chapter 3. Group widget help 57

KPI Description Definition
Request type The request type. Valid values are:
v Servlet
v EJB Method
v JMS
v JCA
v JNDI
v JDBC
v WebService
v Custom
v SkinRender
v PortalPhase
v PortalRequest
v ContentHandlerRequest
v PortalPhase
v PortalLogin
v Portlet
v ScreenRender
v ThemeRender
Important: WebService requesttype is not supported forWebSphere Liberty.
KYNREQSMRY.REQ_TYPE
Important: The Action column does not display a KPI. In this column, you canclick View Instance data to view the request instances that are associated with arequest.
Slowest Request Response Times on WebSphere ApplicationServers - [Transaction]The Slowest Request Response Times on WebSphere Application Servers -[Transaction] group widget displays an aggregated view of requests that areassociated with the transaction you selected. The requests are sorted by theaverage response time. The table displays the aggregated average response timeand average CPU usage for each request.v Unless you configure the data collector within the JVM of the application server,
data is not available.v No data is available if diagnostics mode is disabled for the WebSphere
Application Server.v No data is available unless the Web Response Time agent and the Agent for
WebSphere Applications agent are running.v You can drill down to view the request instances that are associated with a
request. Click View Instance data on the request row.
The Slowest Request Response Times on WebSphere Application Servers -[Transaction] group widget provides the information in the following table:
KPI Description Definition
Origin Node(encoded servername)
The encoded name of the serverthat processes the request.
KYNREQSMRY.ORIGINNODE
58 Application Performance Diagnostics: Application Performance Diagnostics Reference

KPI Description Definition
Request name The request name. KYNREQSMRY.REQ_NAME
Average responsetime (ms)
The average response time, inmilliseconds, for the request.
KYNREQSMRY.AVG_RESP
Minimum responsetime (ms)
The minimum response time, inmilliseconds, for the request.
KYNREQSMRY.MIN_RESP
Maximum responsetime (ms)
The maximum response time, inmilliseconds, for the request.
KYNREQSMRY.MAX_RESP
Sampled requestscount
The number of sampled requestinstances.
All requests are displayed in theRequest Summary table.However, sampling is applied, bydefault, at the request instancelevel. The dc.sampling.frequencyproperty in thedc_home/itcam.toolkit/gdc/etc/gdc.properties file specifies howoften a specific request name issampled.
The Sampled requests count isless that or equal to the requestcount.
KYNREQSMRY.SAMP_INST
Request count The number of requests instances. KYNREQSMRY.REQ_COUNTT
CPU time (ms) The average CPU time for therequest.
KYNREQSMRY.AVG_CPU
Request type The request type. Valid valuesare:
v Servlet
v EJB Method
v JMS
v JCA
v JNDI
v JDBC
v WebService
v Custom
v SkinRender
v PortalPhase
v PortalRequest
v ContentHandlerRequest
v PortalPhase
v PortalLogin
v Portlet
v ScreenRender
v ThemeRender
Important: WebService requesttype is not supported forWebSphere Liberty.
KYNREQSMRY.REQ_TYPE
Chapter 3. Group widget help 59

Important: The Action column does not display a KPI. In this column, you canclick View Instance data to view the request instances that are associated with arequest.
60 Application Performance Diagnostics: Application Performance Diagnostics Reference

Chapter 4. Attribute Groups
A variety of key performance indicators (KPIs) are supported by the Agent forWebSphere Applications dashboards.
The following tables list the attributes that are used to calculate the KPIs that aredisplayed in the in the Agent for WebSphere Applications dashboards.
Web Applications
Table 1. Web Applications attribute group
Table ColumnAttributeGroup Attribute Data Type Description
KYNAPP APPL_NAME
WebApplications
EnterpriseApplicationName
S, 128(string oflength: 128bytes)
The name of the application.
KYNAPP AVG_RT
WebApplications
AverageResponseTime
INT The time it takes, in milliseconds, for a servlet toperform a task.
KYNAPP AVG_TIME
WebApplications
AverageRequestResponseTime
INT The average request response time in milliseconds.
KYNAPP REQ_RATEWebApplications
RequestRate
INT The request throughput.
Garbage Collection Analysis
Table 2. Garbage Collection Analysis attribute group
Table ColumnAttributeGroup Attribute Data Type Description
KYNGCACT NUMB_FREE
GarbageCollectionAnalysis
KbytesFree
INT The total number of free KB in the heap aftergarbage collection.
KYNGCACT IN_USE
GarbageCollectionAnalysis
KbytesUsed
INT The total number of free kilobytes in the heapfollowing the garbage-collection cycle.
KYNGCACT GC_RATE
GarbageCollectionAnalysis
GC Rate INT The rate (per minute) at which the Java virtualmachine is starting its garbage-collection routine.
KYNGCACT HEAP_USPCT
GarbageCollectionAnalysis
Heap UsedPercent
INT The percentage of heap that is used.
KYNGCACT REAL_TPCT
GarbageCollectionAnalysis
Real TimePercent
INT The percentage of real time that the garbagecollector was active.
KYNGCACT SDATE_TIME
GarbageCollectionAnalysis
SampleDate andTime
T(timestamp)
The date and time that the agent collected the data.
KYNGCACT SERVER_NAM
GarbageCollectionAnalysis
ServerName
S, 256(string oflength: 256bytes)
The name of the application server.
© Copyright IBM Corp. 2013 61

Table 2. Garbage Collection Analysis attribute group (continued)
Table ColumnAttributeGroup Attribute Data Type Description
KYNGCACT PID
GarbageCollectionAnalysis
Process ID INT The unique identifier of the JVM process (the classID of the JVM).
KYNGCACT NUM_RUN
GarbageCollectionAnalysis
Times Run INT The number of times that the garbage collector randuring the interval.
KYNGCACT BYTE_FREE
GarbageCollectionAnalysis
KbytesTotal Freedby GC
INT The total number of kbytes freed by the garbagecollector during the interval.
KYNGCACT REAL_TIME
GarbageCollectionAnalysis
Real Time INT The total amount of time (in milliseconds) that thegarbage collector was active during the interval.
Thread Pools
Table 3. Thread Pools attribute group
Table ColumnAttributeGroup Attribute Data Type Description
KYNTHRDP THRDP_NAME
ThreadPools
ThreadPool Name
S, 256(string oflength: 256bytes)
The thread pool name.
KYNTHRDP NUM_ACTTHR
ThreadPools
AverageActiveThreads
INT The average number of concurrently active threads.
KYNTHRDP AVG_INACT
ThreadPools
AverageFreeThreads
INT The average number of free threads.
KYNTHRDP MAX_SIZEThreadPools
MaximumPool Size
INT The configured number of threads that are allowedin the thread pool.
KYNTHRDP POOL_SIZEThreadPools
AveragePool Size
INT The average number of connections in use.
KYNTHRDP SDATE_TIME
ThreadPools
SampleDate andTime
T(timestamp)
The date and time that the agent collected the data.
DB Connection Pools
Table 4. DB Connection Pools attribute group
Table ColumnAttributeGroup Attribute Data Type Description
KYNDBCONP NAME
DBConnectionPools
DatasourceName
S, 256(string oflength: 256bytes)
The name of the data source.
KYNDBCONP AVG_WAITTM
DBConnectionPools
AverageWait Time
INT The average time, in milliseconds, that a clientwaited to be granted a connection.
KYNDBCONP RTE_ALLOC
DBConnectionPools
ConnectionAllocationRate
INT The rate, per second, at which connections wereallocated.
62 Application Performance Diagnostics: Application Performance Diagnostics Reference
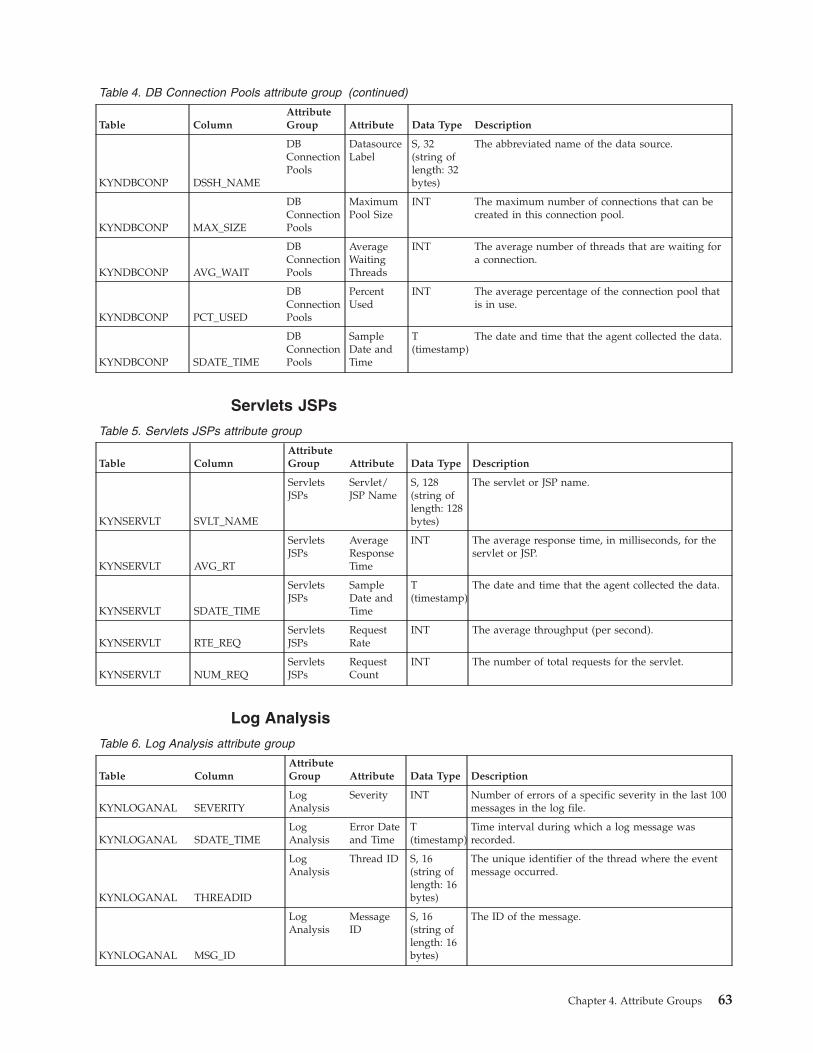
Table 4. DB Connection Pools attribute group (continued)
Table ColumnAttributeGroup Attribute Data Type Description
KYNDBCONP DSSH_NAME
DBConnectionPools
DatasourceLabel
S, 32(string oflength: 32bytes)
The abbreviated name of the data source.
KYNDBCONP MAX_SIZE
DBConnectionPools
MaximumPool Size
INT The maximum number of connections that can becreated in this connection pool.
KYNDBCONP AVG_WAIT
DBConnectionPools
AverageWaitingThreads
INT The average number of threads that are waiting fora connection.
KYNDBCONP PCT_USED
DBConnectionPools
PercentUsed
INT The average percentage of the connection pool thatis in use.
KYNDBCONP SDATE_TIME
DBConnectionPools
SampleDate andTime
T(timestamp)
The date and time that the agent collected the data.
Servlets JSPs
Table 5. Servlets JSPs attribute group
Table ColumnAttributeGroup Attribute Data Type Description
KYNSERVLT SVLT_NAME
ServletsJSPs
Servlet/JSP Name
S, 128(string oflength: 128bytes)
The servlet or JSP name.
KYNSERVLT AVG_RT
ServletsJSPs
AverageResponseTime
INT The average response time, in milliseconds, for theservlet or JSP.
KYNSERVLT SDATE_TIME
ServletsJSPs
SampleDate andTime
T(timestamp)
The date and time that the agent collected the data.
KYNSERVLT RTE_REQServletsJSPs
RequestRate
INT The average throughput (per second).
KYNSERVLT NUM_REQServletsJSPs
RequestCount
INT The number of total requests for the servlet.
Log Analysis
Table 6. Log Analysis attribute group
Table ColumnAttributeGroup Attribute Data Type Description
KYNLOGANAL SEVERITYLogAnalysis
Severity INT Number of errors of a specific severity in the last 100messages in the log file.
KYNLOGANAL SDATE_TIMELogAnalysis
Error Dateand Time
T(timestamp)
Time interval during which a log message wasrecorded.
KYNLOGANAL THREADID
LogAnalysis
Thread ID S, 16(string oflength: 16bytes)
The unique identifier of the thread where the eventmessage occurred.
KYNLOGANAL MSG_ID
LogAnalysis
MessageID
S, 16(string oflength: 16bytes)
The ID of the message.
Chapter 4. Attribute Groups 63

Table 6. Log Analysis attribute group (continued)
Table ColumnAttributeGroup Attribute Data Type Description
KYNLOGANAL ERR_MSG
LogAnalysis
MessageText
S, 256(string oflength: 256bytes)
The text of the message.
KYNLOGANAL PROCESSID
LogAnalysis
ProcessIdentifier
S, 8 (stringof length:8 bytes)
The process ID of the JVM.
EJB Container
Table 7. EJB Container attribute group
Table ColumnAttributeGroup Attribute Data Type Description
KYNCONTNR MTHD_RT
EJBContainer
MethodAverageResponseTime
INT The average response time (in milliseconds) onremote interface methods for all beans.
KYNCONTNR MTHD_CALLS
EJBContainer
MethodInvocationCount
INT The number of method invocations.
KYNCONTNR RTE_MT_CAL
EJBContainer
MethodInvocationRate
INT The rate of invocations per second.
KYNCONTNR AVG_TO_LIV
EJBContainer
AverageConcurrentlyLive Beans
INT The average number of bean objects concurrentlylive.
KYNCONTNR NUM_TO_CREJBContainer
CreateCount
INT The number of bean create calls.
KYNCONTNR NUM_TO_DSEJBContainer
DestroyCount
INT The number of times bean objects were destroyed bygarbage collection.
KYNCONTNR NUM_TO_ACTEJBContainer
ActivateCount
INT The number of times a bean instance was activated .
Container Transactions
Table 8. Container Transactions attribute group
Table ColumnAttributeGroup Attribute Data Type Description
KYNTRANS RTE_GT_BEG
ContainerTransactions
GlobalTransactionsBegin Rate
INT The number of times global transactions were started(per second).
KYNTRANS RTE_LT_BEG
ContainerTransactions
LocalTransactionsBegin Rate
INT The number of times local transactions were started(per second).
KYNTRANS ACT_GL_TRN
ContainerTransactions
GlobalTransactionsActive
INT The number of concurrently active globaltransactions running in the container.
KYNTRANS ACT_LC_TRN
ContainerTransactions
LocalTransactionsActive
INT The number of concurrently active local transactionsrunning in the container.
KYNTRANS GL_TR_COM
ContainerTransactions
GlobalTransactionsCommitted
INT The number of global transactions that werecompleted.
64 Application Performance Diagnostics: Application Performance Diagnostics Reference

Table 8. Container Transactions attribute group (continued)
Table ColumnAttributeGroup Attribute Data Type Description
KYNTRANS LC_TR_COM
ContainerTransactions
LocalTransactionsCommitted
INT The number of local transactions that werecompleted.
KYNTRANS GL_TR_RB
ContainerTransactions
GlobalTransactionsRolled Back
INT The total number of global transactions that wereundone because they could not complete.
KYNTRANS LC_TR_RB
ContainerTransactions
LocalTransactionsRolled Back
INT The total number of local transactions that wereundone because they could not complete.
KYNTRANS GL_TR_TO
ContainerTransactions
GlobalTransactionTimeouts
INT The number of global transactions that timed out.
KYNTRANS LC_TR_TO
ContainerTransactions
LocalTransactionTimeouts
INT The number of local transactions that timed out.
KYNTRANS GL_TR_DUR
ContainerTransactions
GlobalTransactionDuration
INT The average duration (in milliseconds) for globaltransactions.
KYNTRANS LC_TR_DUR
ContainerTransactions
LocalTransactionDuration
INT The average duration (in milliseconds) of localtransactions.
Container Object Pools
Table 9. Container Object Pools attribute group
Table ColumnAttributeGroup Attribute Data Type Description
KYNCNTROP SDATE_TIME
ContainerObjectPools
SampleDate andTime
T(timestamp)
The date and time that the agent collected the data.
KYNCNTROP POOL_SIZE
ContainerObjectPools
AverageObjects inPool
INT The average number of objects in the bean object pool.
KYNCNTROP AVG_DR_SZ
ContainerObjectPools
AverageObjectsDiscarded
INT The average number of objects that were discardedeach time the bean object pool was emptied of idleobjects.
KYNCNTROP NUM_GET_FN
ContainerObjectPools
FindCount
INT The number of times a retrieval call found anunavailable object in the bean object pool.
KYNCNTROP NUM_GETS
ContainerObjectPools
Get Count INT The number of calls that were made to retrieve anobject from the bean object pool.
KYNCNTROP NUM_PUT_DS
ContainerObjectPools
DiscardCount
INT The number of times the returning object wasdiscarded because the pool was full.
Chapter 4. Attribute Groups 65

Enterprise Java Beams
Table 10. Enterprise Java Beams attribute group
Table ColumnAttributeGroup Attribute Data Type Description
KYNEJB CONT_NAME
EnterpriseJavaBeams
ApplicationEJBModuleName
S,64(string oflength: 64bytes)
The name of the Web Application or EJB Module.
KYNEJB BEAN_NAME
EnterpriseJavaBeams
BeanName
S,128(string oflength: 128bytes)
The name of the EJB.
KYNEJB BEAN_TYPE
EnterpriseJavaBeams
Bean Type INT The type of bean. Beans can be stateless, stateful,entity, and message driven.
KYNEJB MTHD_CALLS
EnterpriseJavaBeams
MethodInvocations
INT The number of method invocations during theinterval.
KYNEJB RTE_MT_CAL
EnterpriseJavaBeams
MethodInvocationRate
INT The method invocation rate, per second, for allmethods during the interval.
KYNEJB MTHD_RT
EnterpriseJavaBeams
MethodAverageResponseTime
INT The average response time (in milliseconds) for allmethods of the remote interface for this bean duringthe interval.
KYNEJB NUM_CREATE
EnterpriseJavaBeams
CreateCount
INT The number of times that a bean instance was createdduring the interval.
KYNEJB NUM_ACTIV
EnterpriseJavaBeams
ActivateCount
INT The number of times a bean instance was activatedduring the interval.
KYNEJB NUM_PASSIV
EnterpriseJavaBeams
PassivateCount
INT The number of times that a bean instance waspassivated during the interval.
KYNEJB NUM_LOAD
EnterpriseJavaBeams
EntityBean LoadCount
INT The number of times an entity bean data was loadedduring the interval.
KYNEJB NUM_STORE
EnterpriseJavaBeams
EntityBean StoreCount
INT The number of times entity bean data was written tothe database during the interval.
KYNEJB NUM_DSTRY
EnterpriseJavaBeams
DestroyCount
INT The number of times bean objects were destroyed bygarbage collection during the interval.
KYNEJB NUM_BLIVE
EnterpriseJavaBeams
AverageConcurrentlyLive Beans
INT The average number of bean objects concurrently liveduring the interval.
Messaging Engines
Table 11. Messaging Engines attribute group
Table ColumnAttributeGroup Attribute Data Type Description
KYNMSGENG MSGE_NAME
MessagingEngines
MessagingEngineName
S,256(string oflength: 256bytes)
The Message Engine name.
66 Application Performance Diagnostics: Application Performance Diagnostics Reference

Table 11. Messaging Engines attribute group (continued)
Table ColumnAttributeGroup Attribute Data Type Description
KYNMSGENG AVG_LOC_WT
MessagingEngines
AverageLocal WaitTime
INT The time spent by messages on this durablesubscription at consumption.
KYNMSGENG EXP_MSGMessagingEngines
ExpiredMessages
INT The number of report-enabled messages that expired.
KYNMSGENG INCOM_TOPI
MessagingEngines
IncompleteTopicPublications
INT The number of publications that were not yetreceived by all current subscribers.
KYNMSGENG SDATE_TIME
MessagingEngines
SampleDate andTime
T(timestamp)
The date and time that the agent collected the data.
KYNMSGENG TOT_PUBMessagingEngines
TotalPublished
INT The total number of publications to the messagingengine.
Web Services
Table 12. Web Services attribute group
Table ColumnAttributeGroup Attribute Data Type Description
KYNWEBSVC WEB_SVC
WebServices
WebService
S,256(string oflength: 256bytes)
The name of the web service.
KYNWEBSVC RESP_TIMEWebServices
ResponseTime
INT The average response time (in milliseconds) for asuccessful request for the web service.
KYNWEBSVC RCV_REQWebServices
ReceivedRequests
INT The number of requests received.
KYNWEBSVC PROC_REQWebServices
ProcessedRequests
INT The number of requests the service successfullyprocessed.
KYNWEBSVC PAYLOADWebServices
PayloadSize
INT The average payload size (in bytes) of a receivedrequest or reply.
KYNWEBSVC SDATE_TIME
WebServices
SampleDate andTime
T(timestamp)
The date and time that the agent collected the data.
Web Services Gate Way
Table 13. Web Services Gate Way attribute group
Table ColumnAttributeGroup Attribute Data Type Description
KYNWEBSGW WEB_SVC
WebServicesGate Way
Web Service S,256(string oflength:256 bytes)
The name of the web service.
KYNWEBSGW SYN_REQ
WebServicesGate Way
SynchronousRequests
INT The number of synchronous requests made.
KYNWEBSGW SYN_RESP
WebServicesGate Way
SynchronousResponses
INT The number of synchronous responses made.
KYNWEBSGW ASYN_REQ
WebServicesGate Way
AsynchronousRequests
INT The number of asynchronous requests made.
Chapter 4. Attribute Groups 67

Table 13. Web Services Gate Way attribute group (continued)
Table ColumnAttributeGroup Attribute Data Type Description
KYNWEBSGW ASYN_RESP
WebServicesGate Way
AsynchronousResponses
INT The number of asynchronous responses made.
Application Server
Table 14. Application Server attribute group
Table ColumnAttributeGroup Attribute Data Type Description
KYNAPSRV SDATE_TIMEApplicationServer
Sample Dateand Time
T(timestamp)
The date and time when the event occurred.
KYNAPSRV AS_CPUApplicationServer
CPU Used INT The number of milliseconds of the JVM CPU usedduring the interval.
KYNAPSRV MEM_SIZE_K
ApplicationServer
JVMMemoryUsed Kb
INT JVM memory that is used.
KYNAPSRV STATUSApplicationServer
Status INT The status of the application server.
KYNAPSRV MEM_TTL_K
ApplicationServer
JVMMemoryTotal Kb
INT The JVM total memory size in Kbytes
KYNAPSRV PIDApplicationServer
Process ID INT The process ID of the JVM
KYNAPSRV SERVER_NAM
ApplicationServer
ServerName
S,256(string oflength:256 bytes)
The name of the application server.
KYNAPSRV WAS_NNAM
ApplicationServer
WAS NodeName
S,64(string oflength: 64bytes)
The name of the WebSphere Application Servernode group to which the application server belongs.
KYNAPSRV WAS_CNAM
ApplicationServer
WAS CellName
S,64(string oflength: 64bytes)
The name of the WebSphere Application Server cellto which the application server belongs.
KYNAPSRV REQ_MON
ApplicationServer
RequestDataMonitoringLevel
INT The monitoring level for request data. Valid valuesare:
v N/A
v JMX Monitoring
v Data Collector Monitoring
KYNAPSRV SRV_TYPE
ApplicationServer
Server Type INT The type of server. Valid values are:
v Traditional_WebSphere
v Liberty
68 Application Performance Diagnostics: Application Performance Diagnostics Reference
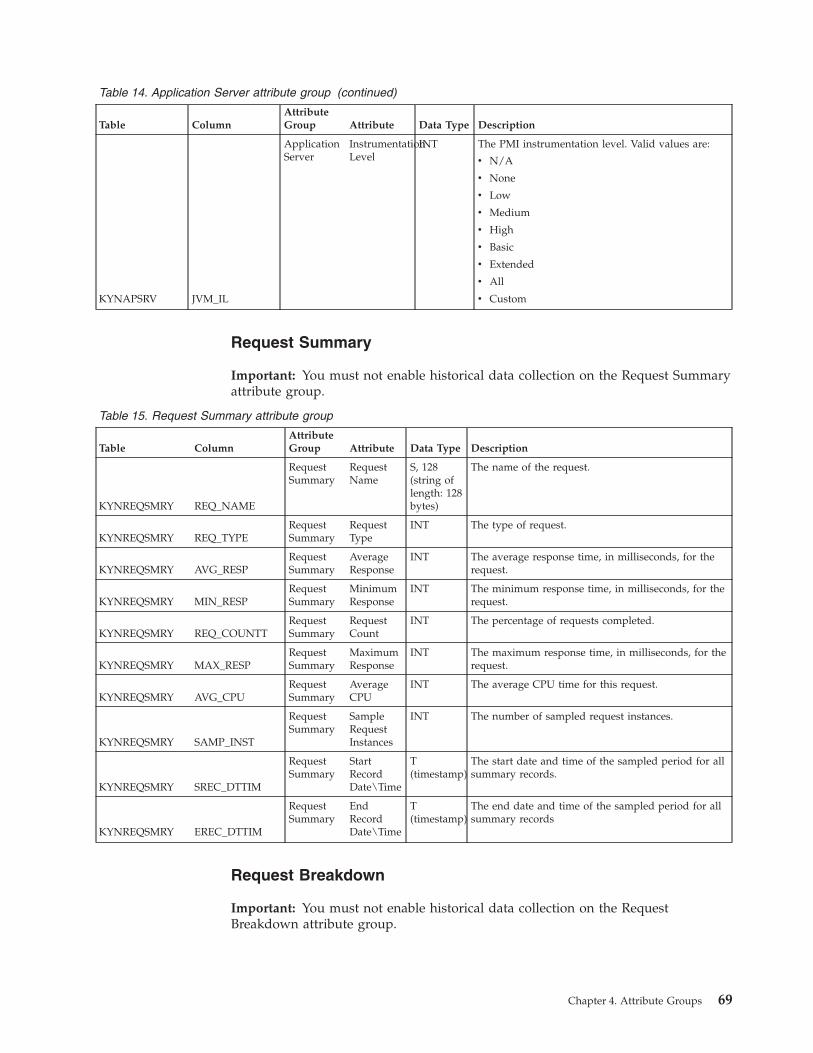
Table 14. Application Server attribute group (continued)
Table ColumnAttributeGroup Attribute Data Type Description
KYNAPSRV JVM_IL
ApplicationServer
InstrumentationLevel
INT The PMI instrumentation level. Valid values are:
v N/A
v None
v Low
v Medium
v High
v Basic
v Extended
v All
v Custom
Request Summary
Important: You must not enable historical data collection on the Request Summaryattribute group.
Table 15. Request Summary attribute group
Table ColumnAttributeGroup Attribute Data Type Description
KYNREQSMRY REQ_NAME
RequestSummary
RequestName
S, 128(string oflength: 128bytes)
The name of the request.
KYNREQSMRY REQ_TYPERequestSummary
RequestType
INT The type of request.
KYNREQSMRY AVG_RESPRequestSummary
AverageResponse
INT The average response time, in milliseconds, for therequest.
KYNREQSMRY MIN_RESPRequestSummary
MinimumResponse
INT The minimum response time, in milliseconds, for therequest.
KYNREQSMRY REQ_COUNTTRequestSummary
RequestCount
INT The percentage of requests completed.
KYNREQSMRY MAX_RESPRequestSummary
MaximumResponse
INT The maximum response time, in milliseconds, for therequest.
KYNREQSMRY AVG_CPURequestSummary
AverageCPU
INT The average CPU time for this request.
KYNREQSMRY SAMP_INST
RequestSummary
SampleRequestInstances
INT The number of sampled request instances.
KYNREQSMRY SREC_DTTIM
RequestSummary
StartRecordDate\Time
T(timestamp)
The start date and time of the sampled period for allsummary records.
KYNREQSMRY EREC_DTTIM
RequestSummary
EndRecordDate\Time
T(timestamp)
The end date and time of the sampled period for allsummary records
Request Breakdown
Important: You must not enable historical data collection on the RequestBreakdown attribute group.
Chapter 4. Attribute Groups 69

Table 16. Request Breakdown attribute group
Table ColumnAttributeGroup Attribute Data Type Description
KYNREQBRK REQ_TYPERequestBreakdown
RequestType
INT The request type.
KYNREQBRK PERCENT
RequestBreakdown
Percent ofResponseTime
INT The percentage of time that the request spent on therequest type.
Request Distribution
Important: You must not enable historical data collection on the RequestDistribution attribute group.
Table 17. Request Distribution attribute group
Table ColumnAttributeGroup Attribute Data Type Description
KYNREQDIST UB
RequestDistribution
Upper-boundresponsetime
INT The upper response time, in seconds, for thepercentile value.
KYNREQDIST PVRequestDistribution
Percentilevalue
INT The percentile value.
Request Instances
Important: You must not enable historical data collection on the Request Instancesattribute group.
Table 18. Request Instances attribute group
Table ColumnAttributeGroup Attribute Data Type Description
KYNREQINST REC_DTTIMERequestInstances
RecordDate\Time
T(timestamp)
The date and time that this request instance tookplace.
KYNREQINST REQID
RequestInstances
Request ID S,20(string oflength: 20bytes)
The ID of the request.
KYNREQINST REQ_NAME
RequestInstances
RequestName
S,128(string oflength: 128bytes)
The name of the request.
KYNREQINST REQ_TYPERequestInstances
RequestType
INT The type of request.
KYNREQINST AVG_RESPRequestInstances
ResponseTime
INT The average response time, in milliseconds, for therequest instance.
KYNREQINST AVG_CPURequestInstances
CPU Time INT The average amount of CPU time consumed by therequest instance, in milliseconds.
KYNREQINST TIDRequestInstances
Thread ID INT The ID of the thread that processed the request.
KYNREQINST MTHDENTRequestInstances
MTHDENT INT Specifies whether the request instance has methoddata.
70 Application Performance Diagnostics: Application Performance Diagnostics Reference

Request Analysis
Table 19. Request Analysis attribute group
Table ColumnAttributeGroup Attribute Data Type Description
KYNREQUEST COMPL_PCT
RequestAnalysis
RequestCompletionPercent
INT The request completion percent.
KYNREQUEST C10RequestAnalysis
AverageResponse
INT The average response time.
KYNREQUEST C7RequestAnalysis
RequestCount
INT The number of times that the request ran.
KYNREQUEST C2
RequestAnalysis
SampleDate andTime
T(timestamp
The date and time that the agent collected the data.
KYNREQUEST C8RequestAnalysis
RequestRate
INT The average throughput.
KYNREQUEST REQ_TYPERequestAnalysis
RequestType
INT The request type.
KYNREQUEST REQ_NAME
RequestAnalysis
RequestName
S,128(string oflength: 128bytes)
The request name.
KYNREQUEST REQ_DETAIL
RequestAnalysis
RequestDetail
S,128(string oflength: 128bytes)
The request URL.
Request Times and Rates
Table 20. Request Times and Rates attribute group
Table ColumnAttributeGroup Attribute Data Type Description
KYNREQHIS SDATE_TIME
RequestTimes andRates
SampleDate andTime
T(timestamp)
The time and date that the agent collected the data.
KYNREQHIS AVG_TIME
RequestTimes andRates
AverageRequestResponseTime
INT The average response time (in milliseconds),
KYNREQHIS APP_NAME
RequestTimes andRates
Applicationname
S,256(string oflength: 256bytes)
The name of the application to which the requestbelongs.
KYNREQHIS REQ_RATE
RequestTimes andRates
AverageRequestCompletionRate
INT The request completion rate (that is, the requestthroughput).
Request Context
Important:
v You must not enable historical data collection on the Request Context attributegroup.
v You must not create thresholds on the Request Context attribute group.
Chapter 4. Attribute Groups 71

Table 21. Request Context attribute group
Table ColumnAttributeGroup Attribute Data Type Description
KYNREQCTX VNAME
RequestContext
Name S,128(string oflength: 128bytes)
The parameter name in the name-value pair.
KYNREQCTX VAL
RequestContext
Value S,1024(string oflength:1024bytes)
The parameter value in the name-value pair.
Request Stack Trace
Important:
v You must not enable historical data collection on the Request Stack Traceattribute group.
v You must not create thresholds on the Request Stack Trace attribute group.
Table 22. Request Stack Trace attribute group
Table ColumnAttributeGroup Attribute Data Type Description
KYNREQSTK FMTHD_NAME
RequestStackTrace
FullyQualifiedMethodName
S,1024(string oflength:1024bytes)
The fully qualified method name for each Java objectthat handled the request instance and the linenumber that was invoked in each class.
Request Trace
Important:
v You must not enable historical data collection on the Request Trace attributegroup.
v You must not create thresholds on the Request Trace attribute group.
Table 23. Request Trace attribute group
Table ColumnAttributeGroup Attribute Data Type Description
KYNREQTRC ORDIDRequestTrace
Order ID INT The order in which the call to the request, nestedrequest, or method call occurred.
KYNREQTRC DEPTHRequestTrace
Depth INT The nesting level of the call to the request, nestedrequest, or method.
KYNREQTRC ST_DTTIMERequestTrace
StartDateTime
T(timestamp)
The instance of time when this event occurred
72 Application Performance Diagnostics: Application Performance Diagnostics Reference

Table 23. Request Trace attribute group (continued)
Table ColumnAttributeGroup Attribute Data Type Description
KYNREQTRC EVT_TYPE
RequestTrace
EventType
INT The request instance or nested request type. Validvalues are:
v Servlet
v EJB Method
v Method
v JMS
v JCA
v JNDI
v JDBC
v WebService
v Custom
v SkinRender
v PortalPhase
v PortalRequest
v ContentHandlerRequest
v PortalPhase
v PortalLogin
v Portlet
v ScreenRender
v ThemeRender
KYNREQTRC AVG_RESPRequestTrace
ResponseTime
INT The response time, in milliseconds, of the requestinstance, nested request, or method call.
KYNREQTRC AVG_CPU
RequestTrace
CPU Time INT The total amount of CPU time that is consumed bythe request instance, nested request, or method call,in milliseconds.
KYNREQTRC EVTIDRequestTrace
Event ID INT The event identifier.
KYNREQTRC EVT_NAME
RequestTrace
EventName
S,512(string oflength: 512bytes)
The name of the request instance, nested request, ormethod call.
Chapter 4. Attribute Groups 73

74 Application Performance Diagnostics: Application Performance Diagnostics Reference

Chapter 5. Dashboard attributes
Resource monitoring dashboards use attributes to calculate KPIs. Some of theattributes map to WebSphere PMI categories and attributes. A monitoring overheadis incurred when you turn on these attributes. The overhead depends on theWebSphere PMI level of the attribute.
To identify all dashboards that require historical data collection to be enabled, seeChapter 3, “Group widget help,” on page 15
WAS Status group widgetThe WAS Status group widget uses attributes that map to WebSphere PMIattributes.
Table 24. WAS Status attributes to PMI Mapping
Table Column Attribute Group AttributeWebSphere PMIAttribute
WebSpherePMI Level Overhead
KYNDBCONP PCT_USEDDB ConnectionPools Percent Used PercentUsed Basic
High
WAS DashboardThe WAS Dashboard uses attributes that map to WebSphere PMI attributes.
The Busiest Thread Pools (Last 2 Hours) group widget uses attributes from theThread Pools attribute group in its KPI calculations.
Table 25. Busiest Thread Pools (Last 2 Hours) attributes to PMI Mapping
Table Column Attribute Group AttributeWebSphere PMIAttribute
WebSpherePMI Level Overhead
KYNTHRDP MAX_SIZE Thread Pools Maximum Pool Size PoolSize Basic High
KYNTHRDP POOL_SIZE Thread Pools Average Pool Size PoolSize Basic High
The Busiest DB Connection Pools (Last 2 Hours) group widget uses attributes fromthe DB Connection Pools attribute group in its KPI calculations.
Table 26. Busiest DB Connection Pools (Last 2 Hours) attributes to PMI Mapping
Table Column Attribute Group AttributeWebSphere PMIAttribute
WebSpherePMI Level Overhead
KYNDBCONP PCT_USEDDB ConnectionPools Percent Used PercentUsed Basic
High
The Slowest Web Services (Last 2 Hours) group widget uses attributes from theWeb Services attribute group in its KPI calculations.
Table 27. Slowest Web Services (Last 2 Hours) attributes to PMI Mapping
Table Column Attribute Group AttributeWebSphere PMIAttribute
WebSpherePMI Level Overhead
KYNWEBSVC RESP_TIME Web Services Response Time ResponseTime All High
© Copyright IBM Corp. 2013 75

The Slowest Web Applications (Last 2 Hours) from PMI group widget usesattributes from the Web Applications attribute group to calculate KPIs in its KPIcalculations.
Table 28. Slowest Web Applications (Last 2 Hours) from PMI attributes to PMI Mapping
Table Column Attribute Group AttributeWebSphere PMIAttribute
WebSpherePMI Level Overhead
KYNAPP AVG_RT Web Applications Average Response TimeServiceTime (ServletInfo)
Basic Medium
The EJB Container (Last 2 Hours) group widget uses attributes from the EJBContainers attribute group in its KPI calculations.
Table 29. EJB Container (Last 2 Hours) attributes to PMI Mapping
Table Column Attribute Group AttributeWebSphere PMIAttribute
WebSpherePMI Level Overhead
KYNCONTNR MTHD_RT EJB ContainersMethod AverageResponse Time MethodResponseTime Basic
High
KYNCONTNR RTE_MT_CAL EJB Containers Method Invocation Rate MethodCallCount Basic High
The Slowest Messaging Engines (Last 2 Hours) group widget uses attributes fromthe Messaging Engines attribute group in its KPI calculations.
Table 30. Slowest Messaging Engines (Last 2 Hours) attributes to PMI Mapping
Table Column Attribute Group AttributeWebSphere PMIAttribute
WebSpherePMI Level Overhead
KYNMSGENG AVG_LOC_WTMessagingEngines Average Local Wait Time LocalMessageWaitTime All
Low
EJB Container dashboardThe EJB Container dashboard uses attributes that map to WebSphere PMIattributes.
The EJB Containers (Last 2 Hours) uses attributes in the EJB Containers attributegroup in its KPI calculations.
Table 31. EJB Containers (Last 2 Hours) attributes PMI Mapping
Table Column Attribute Group AttributeWebSphere PMIAttribute
WebSpherePMI Level Overhead
KYNCONTNR MTHD_RT EJB ContainersMethod AverageResponse Time MethodResponseTime Basic
High
KYNCONTNR MTHD_CALLS EJB ContainersMethod InvocationCount MethodCallCount
Basic High
KYNCONTNR RTE_MT_CAL EJB Containers Method Invocation Rate MethodCallCount Basic High
KYNCONTNR AVG_TO_LIV EJB ContainersAverage ConcurrentlyLive Beans LiveCount
Extended High
KYNCONTNR NUM_TO_CR EJB Containers Create Count CreateCount Basic Low
KYNCONTNR NUM_TO_DS EJB Containers Destroy Count FreedCount All Low
KYNCONTNR NUM_TO_ACT EJB Containers Activate Count ActivateCount All Low
KYNCONTNR NUM_LOAD EJB Containers Entity Bean Load Count LoadCount All Low
KYNCONTNR NUM_STORE EJB Containers Entity Bean Store Count StoreCount All Low
76 Application Performance Diagnostics: Application Performance Diagnostics Reference

The Container Object Pools (Last 24 Hours) group widget uses attributes in theContainer Object Pools attribute group in its KPI calculations.
Table 32. EJB Containers (Last 2 Hours)Container Object Pools (Last 24 Hours) attributes PMI Mapping
Table Column Attribute Group AttributeWebSphere PMIAttribute
WebSpherePMI Level Overhead
KYNCNTROP POOL_SIZEContainer ObjectPools Average Objects in Pool PooledCount Basic
High
KYNCNTROP AVG_DR_SZContainer ObjectPools
Average ObjectsDiscarded DrainSize
All Medium
KYNCNTROP NUM_GET_FNContainer ObjectPools Find Count RetrieveFromPoolSuccessCount
All Low
KYNCNTROP NUM_GETSContainer ObjectPools Get Count RetrieveFromPoolCount
All Low
KYNCNTROP NUM_PUT_DSContainer ObjectPools Discard Count ReturnsDiscardCount
Extended Low
The Container Transactions group widget uses attributes in the ContainerTransactions attribute group in its KPI calculations.
Table 33. Container Transactions attributes PMI Mapping
Table Column Attribute Group AttributeWebSphere PMIAttribute
WebSpherePMI Level Overhead
KYNTRANS RTE_GT_BEGContainerTransactions
Global TransactionsBegin Rate GlobalBegunCount Extended
Low
KYNTRANS RTE_LT_BEGContainerTransactions
Local Transactions BeginRate LocalBegunCount
Extended Low
KYNTRANS ACT_GL_TRNContainerTransactions
Global TransactionsActive ActiveCount
Basic Low
KYNTRANS ACT_LC_TRNContainerTransactions
Local TransactionsActive LocalActiveCount
All Low
KYNTRANS GL_TR_COMContainerTransactions
Global TransactionsCommitted CommittedCount
Basic Low
KYNTRANS LC_TR_COMContainerTransactions
Local TransactionsCommitted LocalCommittedCount
All Low
KYNTRANS GL_TR_RBContainerTransactions
Global TransactionsRolled Back RolledbackCount
Basic Low
KYNTRANS LC_TR_RBContainerTransactions
Local TransactionsRolled Back LocalRolledbackCount
All Low
KYNTRANS GL_TR_TOContainerTransactions
Global TransactionTimeouts GlobalTimeoutCount
Extended Low
KYNTRANS LC_TR_TOContainerTransactions
Local TransactionTimeouts LocalTimeoutCount
Extended Low
KYNTRANS GL_TR_DURContainerTransactions
Global TransactionDuration GlobalTranTime
Extended Medium
KYNTRANS LC_TR_DURContainerTransactions
Local TransactionDuration LocalTranTime
Extended Medium
The Enterprise Java Beans group widget uses attributes in the Enterprise JavaBeans attribute group in its KPI calculations.
Chapter 5. Dashboard attributes 77

Table 34. Enterprise Java Beans attributes PMI Mapping
Table Column Attribute Group AttributeWebSphere PMIAttribute
WebSpherePMI Level Overhead
KYNEJB MTHD_CALLSEnterprise JavaBeans Method Invocations MethodCallCount Basic
High
KYNEJB RTE_MT_CALEnterprise JavaBeans Method Invocation Rate MethodCallCount
Basic High
KYNEJB MTHD_RTEnterprise JavaBeans
Method AverageResponse Time MethodResponseTime
Basic High
KYNEJB NUM_CREATEEnterprise JavaBeans Create Count CreateCount
Basic Low
KYNEJB NUM_ACTIVEnterprise JavaBeans Activate Count ActivateCount
All Low
KYNEJB NUM_PASSIVEnterprise JavaBeans Passivate Count PassivateCount
All Low
KYNEJB NUM_LOADEnterprise JavaBeans Entity Bean Load Count LoadCount
All Low
KYNEJB NUM_STOREEnterprise JavaBeans Entity Bean Store Count StoreCount
All Low
KYNEJB NUM_DSTRYEnterprise JavaBeans Destroy Count FreedCount
All Low
KYNEJB NUM_BLIVEEnterprise JavaBeans
Average ConcurrentlyLive Beans ReadyCount
Basic High
Messaging Engine dashboardThe Messaging Engine dashboard uses attributes that map to WebSphere PMIattributes.
The [Summary] - Average Local Wait Time (Last 24 Hours) group widget usesattributes from the Messaging Engine attribute group in its KPI calculations.
Table 35. [Summary] - Average Local Wait Time (Last 24 Hours) attributes to PMI Mapping
Table Column Attribute Group AttributeWebSphere PMIAttribute
WebSpherePMI Level Overhead
KYNMSGENG AVG_LOC_WTMessagingEngines Average Local Wait Time LocalMessageWaitTime All
Low
The [Summary] - Expired Messages (Last 24 Hours) group widget uses attributesfrom the Messaging Engine attribute group in its KPI calculations.
Table 36. [Summary] - Expired Messages (Last 24 Hours) attributes to PMI Mapping
Table Column Attribute Group AttributeWebSphere PMIAttribute
WebSpherePMI Level Overhead
KYNMSGENG EXP_MSGMessagingEngines Expired Messages ReportEnabledMessagesExpiredCountAll
Low
The [Summary] - Incomplete Topic Publications (Last 24 Hours) group widget usesattributes from the Messaging Engine attribute group in its KPI calculations.
78 Application Performance Diagnostics: Application Performance Diagnostics Reference

Table 37. [Summary] - Incomplete Topic Publications (Last 24 Hours) attributes to PMI Mapping
Table Column Attribute Group AttributeWebSphere PMIAttribute
WebSpherePMI Level Overhead
KYNMSGENG INCOM_TOPIMessagingEngines
Incomplete TopicPublications IncompletePublicationCount
All Low
The [Summary] - Total Published (Last 24 Hours) group widget uses attributesfrom the Messaging Engine attribute group in its KPI calculations.
Table 38. [Summary] - Total Published (Last 24 Hours) attributes to PMI Mapping
Table Column Attribute Group AttributeWebSphere PMIAttribute
WebSpherePMI Level Overhead
KYNMSGENG TOT_PUBMessagingEngines Total Published TotalMessagesPublishedCount
All Low
The Messaging Engines group widget uses attributes from the Messaging Engineattribute group in its KPI calculations.
Table 39. Messaging Engines attributes to PMI Mapping
Table Column Attribute Group AttributeWebSphere PMIAttribute
WebSpherePMI Level Overhead
KYNMSGENG AVG_LOC_WTMessagingEngines Average Local Wait Time LocalMessageWaitTime All
Low
KYNMSGENG EXP_MSGMessagingEngines Expired Messages ReportEnabledMessagesExpiredCountAll
Low
KYNMSGENG INCOM_TOPIMessagingEngines
Incomplete TopicPublications IncompletePublicationCount
All Low
KYNMSGENG TOT_PUBMessagingEngines Total Published TotalMessagesPublishedCount
All Low
Web Services dashboardThe Web Services dashboard uses attributes that map to WebSphere PMI attributes.
The Web Service (Last 24 Hours) - [Service] group widget uses attributes from theWeb Services attribute group in its KPI calculations.
Table 40. Web Service (Last 24 Hours) - [Service] attributes to PMI Mapping
Table Column Attribute Group AttributeWebSphere PMIAttribute
WebSpherePMI Level Overhead
KYNWEBSVC RESP_TIME Web Services Response Time ResponseTime All High
KYNWEBSVC RCV_REQ Web Services Received Requests ReceivedRequestCount All Low
The Web Services group widget uses attributes from the Web Services attributegroup in its KPI calculations.
Table 41. Web Services attributes to PMI Mapping
Table Column Attribute Group AttributeWebSphere PMIAttribute
WebSpherePMI Level Overhead
KYNWEBSVC RCV_REQ Web Services Received Requests ReceivedRequestCount All Low
KYNWEBSVC PROC_REQ Web Services Processed Requests ProcessedRequestCount All Low
KYNWEBSVC RESP_TIME Web Services Response Time ResponseTime All High
KYNWEBSVC PAYLOAD Web Services Payload Size PayloadSize All Medium
Chapter 5. Dashboard attributes 79

The Web Services Gateway group widget uses attributes from the Web ServicesGate way attribute group in its KPI calculations.
Table 42. Web Services Gateway attributes to PMI Mapping
Table Column Attribute Group AttributeWebSphere PMIAttribute
WebSpherePMI Level Overhead
KYNWEBSGW SYN_REQWeb ServicesGate way Synchronous Requests SynchronousRequestCountAll
Low
KYNWEBSGW SYN_RESPWeb ServicesGate way Synchronous Responses SynchronousResponseCount
All Low
KYNWEBSGW ASYN_REQWeb ServicesGate way Asynchronous Requests AsynchronousRequestCount
All Low
KYNWEBSGW ASYN_RESPWeb ServicesGate way
AsynchronousResponses AsynchronousResponseCount
All Low
Web Applications dashboardThe Web Applications dashboard uses attributes that map to WebSphere PMIattributes.
The Web Applications (Last 24 Hours) - [Application] group widget uses attributesfrom the Web Applications attribute group in its KPI calculations.
Table 43. Web Applications (Last 24 Hours) - [Application] attributes to PMI Mapping
Table Column Attribute Group AttributeWebSphere PMIAttribute
WebSpherePMI Level Overhead
KYNAPP RESP_TIME Web Applications Response TimeServiceTime (ServletInfo) Basic
Medium
KYNAPP RCV_REQ Web Applications Request Rate RequestCount Basic Low
The Servlets/JSPs - [Application] group widget uses attributes from theServlet/JSP attribute group in its KPI calculations.
Table 44. Servlets/JSPs - [Application] attributes to PMI Mapping
Table Column Attribute Group AttributeWebSphere PMIAttribute
WebSpherePMI Level Overhead
KYNSERVLT AVG_RT Servlets JSPs Average Response TimeServiceTime (ServletInfo)
Basic Medium
KYNSERVLT NUM_REQ Servlets JSPs Request CountRequestCount (ServletInfo)
Basic Low
The Servlet/JSP (Last 24 Hours) - [Servlet/JSP Name] group widget uses attributesfrom the Servlet/JSP s attribute group in its KPI calculations.
Table 45. Servlet/JSP (Last 24 Hours) - [Servlet/JSP Name] attributes to PMI Mapping
Table Column Attribute Group AttributeWebSphere PMIAttribute
WebSpherePMI Level Overhead
KYNSERVLT AVG_RT Servlets JSPs Average Response TimeServiceTime (ServletInfo)
Basic Medium
KYNSERVLT RTE_REQ Servlets JSPs Request Rate RequestCount Basic Low
80 Application Performance Diagnostics: Application Performance Diagnostics Reference

DB Connection Pools dashboardThe DB Connection Pools dashboard uses attributes that map to WebSphere PMIattributes.
The [Summary] Pool Used (Last 24 Hours) group widget uses attributes from theDB Connection Pools attribute group in its KPI calculations.
Table 46. [Summary] Pool Used (Last 24 Hours) attributes to PMI Mapping
Table Column Attribute Group AttributeWebSphere PMIAttribute
WebSpherePMI Level Overhead
KYNDBCONP PCT_USEDDB ConnectionPools Percent Used PercentUsed Basic
High
The DB Connection Pools with Highest Wait Time group widget uses attributesfrom the DB Connection Pools attribute group in its KPI calculations.
Table 47. DB Connection Pools with Highest Wait Time attributes to PMI Mapping
Table Column Attribute Group AttributeWebSphere PMIAttribute
WebSpherePMI Level Overhead
KYNDBCONP AVG_WAITTMDB ConnectionPools Average Wait Time WaitTime
Basic Medium
The DB Connection Pools with Highest Allocation Rate group widget usesattributes from the DB Connection Pools attribute group in its KPI calculations.
Table 48. DB Connection Pools with Highest Allocation Rate attributes to PMI Mapping
Table Column Attribute Group AttributeWebSphere PMIAttribute
WebSpherePMI Level Overhead
KYNDBCONP RTE_ALLOCDB ConnectionPools
Connection AllocationRate AllocateCount
Extended Low
The DB Connection Pools group widget uses attributes from the DB ConnectionPools attribute group in its KPI calculations.
Table 49. DB Connection Pools attributes to PMI Mapping
Table Column Attribute Group AttributeWebSphere PMIAttribute
WebSpherePMI Level Overhead
KYNDBCONP MAX_SIZEDB ConnectionPools Maximum Pool Size PoolSize
Basic High
KYNDBCONP AVG_WAITTMDB ConnectionPools Average Wait Time WaitTime
Basic Medium
KYNDBCONP AVG_WAITDB ConnectionPools Average Waiting Threads WaitTime
Basic Medium
KYNDBCONP PCT_USEDDB ConnectionPools Percent Used PercentUsed Basic
High
Thread Pools dashboardThe Thread Pools dashboard uses attributes that map to WebSphere PMI attributes.
Chapter 5. Dashboard attributes 81

The Average Thread Pool Usage group widget uses attributes from the ThreadPools attribute group in its KPI calculations.
Table 50. Average Thread Pool Usage attributes to PMI Mapping
Table Column Attribute Group AttributeWebSphere PMIAttribute
WebSpherePMI Level Overhead
KYNTHRDP NUM_ACTTHR Thread Pools Average Active Threads ActiveCount Extended High
KYNTHRDP AVG_INACT Thread Pools Average Free Threads ActiveCount Extended High
The [Thread Pool] Usage (Last 24 Hours) group widget uses attributes from theThread Pools attribute group in its KPI calculations.
Table 51. [Thread Pool] Usage (Last 24 Hours) attributes to PMI Mapping
Table Column Attribute Group AttributeWebSphere PMIAttribute
WebSpherePMI Level Overhead
KYNTHRDP MAX_SIZE Thread Pools Maximum Pool Size PoolSize Basic High
KYNTHRDP NUM_ACTTHR Thread Pools Average Active Threads ActiveCount Extended High
The Thread Pools group widget uses attributes from the Thread Pools attributegroup in its KPI calculations.
Table 52. Thread Pools attributes to PMI Mapping
Table Column Attribute Group AttributeWebSphere PMIAttribute
WebSpherePMI Level Overhead
KYNTHRDP MAX_SIZE Thread Pools Maximum Pool Size PoolSize Basic High
KYNTHRDP NUM_ACTTHR Thread Pools Average Active Threads ActiveCount Extended High
KYNTHRDP POOL_SIZE Thread Pools Average Pool Size PoolSize Basic High
82 Application Performance Diagnostics: Application Performance Diagnostics Reference

Chapter 6. Historical data collections
The Agent for WebSphere Applications has a set of predefined historical datacollections to help you get started with monitoring your WebSphere ApplicationServers.
Historical data collection is configured out-of-the-box on the set of attribute groupsthat are used by the group widgets that display history data.
Important: If you configure historical collection for other attribute groups or if youincrease the default retention period, your change does not impact the data that isdisplayed in the group widgets. However, if you disable historical data collectionfor an attribute group or if you change the default interval for an attribute group,the group widgets that display historical data are impacted.
The Agent for WebSphere Applications has predefined historical data collectionsfor the following attribute groups:
Table 53. Attribute Groups
Attribute Group Table Name Default IntervalDefault Retentionperiod (Hours)
Web Services KYNWEBSVC 5 24
Web Applications KYNAPP 5 24
Thread Pools KYNTHRDP 5 24
Servlet JSPs KYNSERVLT 5 24
Request Times andRates
KYNREQHIS 5 24
Request Analysis KYNREQUEST 5 24
Messaging Engines KYNMSGENG 5 24
Garbage CollectionAnalysis
KYNGCACT 1 24
Enterprise Java Beans KYNEJB 5 24
EJB Containers KYNCONTNR 5 24
DB Connection Pools KYNDBCONP 5 24
Container ObjectPools
KYNCNTROP 5 24
Application Server KYNAPSRV 5 24
For information about whether historical data collection must be configured to seedata in a group widget, see the group widget help. To view group widget help,
click the help icon ( ) on the group widget.
For information about configuring historical data collection, see the “HistoricalData Configuration” section in the Smart Cloud Monitoring - Application Insightonline help.
© Copyright IBM Corp. 2013 83

84 Application Performance Diagnostics: Application Performance Diagnostics Reference

Chapter 7. Thresholds
The Agent for WebSphere Applications has a set of predefined thresholds(situations) to help you get started with monitoring your WebSphere ApplicationServers.
You edit existing thresholds and create new thresholds using the ThresholdManager. For information about creating thresholds, see the “Threshold Manager”section in the Smart Cloud Monitoring - Application Insight online help.
Thresholds are tests expressed in IF-TRUE format of system conditions that youwant to monitor; the tested value is an ITCAM Agent for WebSphere Applicationsattribute expressed in the form attribute-group.attribute-name. If the specifiedcondition occurs or exists, the situation is true, and an event is opened. The eventis visible in the Events tab of the Application Performance Dashboard.
WASHighResponseTime
WASHighResponseTime monitors the average request response time and issues acritical condition whenever that time exceeds 2 seconds. The formula is:
If
Request_Times_and_Rates.Average_Request_Response_Time is greater than 2000
and
Request_Times_and_Rates.Application_name is NE
then
the situation WASHighResponseTime is true.
WASHighGCTimePercent
WASHighGCTimePercent monitors the percentage of time being spent by thegarage collector and issues a critical condition whenever that time exceeds 80%.The formula is:
If
Garbage_Collection_Analysis.Real_Time_Percent is greater than 80
then
the situation WASHighGCTimePercent is true.
WASOutofHeapSpace
WASOutofHeapSpace monitors the heap allocation status and issues a criticalcondition whenever heap space is exhausted. The formula is:
If
© Copyright IBM Corp. 2013 85

Allocation_Failure.Heap_Status equals Out of heap space or Insufficient space
then
the situation WASOutofHeapSpace is true.
WASHighCPUPercentUsed
WASHighCPUPercentUsed monitors the percentage of the CPU being consumedand issues a critical condition whenever that time exceeds 80%. The formula is:
If
Application_Server.CPU_Used_Percent is greater than 80
then
the situation WASHighCPUPercentUsed is true.
WASServletsJSPsError
WASServletsJSPsError monitors the error count for servlets and JSPs invoked by aWebSphere application server application. This situation issues a critical conditionwhenever the count becomes nonzero. Its formula is:
If
Servlets_JSPs.Error_Count is greater than 0
then
the situation WASServletsJSPsError is true.
WASWebApplicationError
WASWebApplicationError monitors the error log status of the WebSphere serverand issues a critical condition when an error occurs. Its formula is:
If
Web_Applications.Error_Count is greater than 0
then
the situation WASWebApplicationError is true.
WASThreadPoolPercentMaxed
WASThreadPoolPercentMaxed monitors the average usage time of all threads, andissues a critical condition whenever that time exceeds 100%. The formula is:
If
Thread_Pools.Percent_of_Time_Pool_at_Max is greater than 100
then
86 Application Performance Diagnostics: Application Performance Diagnostics Reference

the situation WASThreadPoolPercentMaxed is true.
WASNotConnected
WASNotConnected monitors the connection between the ITCAM for Data CollectorWebSphere running in an application server and the Agent for WebSphereApplications monitoring agent to ensure that the monitoring agent is connectedand issues a critical condition whenever it is not. Its formula is:
If
Application_Server_Status.Status equals Disconnected
then
the situation WASNotConnected is true.
WASAvgHeapSizeAfterGCHigh
WASAvgHeapSizeAfterGCHigh monitors the average heap size free percentageafter garbage collection. This situation issues a critical alert if the average heap sizefree percentage after garbage collection is greater than 80%. Its formula is:
If
Garbage_Collection_Cycle.Heap_Free_Percent_after_GC is greater than 80
then
the situation WASAvgHeapSizeAfterGCHigh is true.
WASContainerTransactionRollback
WASContainerTransactionRollback monitors the rollback count of the WebSphereapplication server. This situation issues a Critical alert whenever the countbecomes nonzero. Its formula is:
If
Container_Transactions.Global_Transactions_Rolled_Back is greater than 0
or
Container_Transactions.Local_Transactions_Rolled_Back is greater than 0
then
the situation WASContainerTransactionRollBack is true.
WASCTGlbTransDurationHigh
WASCTGlbTransDurationHigh monitors the average duration of globaltransactions. This situation issues a critical alert if the time period is longer than 2seconds. Its formula is:
If
Chapter 7. Thresholds 87

Container_Transactions.Global_Transaction_Duration is greater than 2000
then
the situation WASCTGlbTransDurationHigh is true.
WASCTLclTransDurationHigh
WASCTLclTransDurationHigh monitors the average duration of local transactions.This situation issues a critical alert if the time period is longer than 2 seconds. Itsformula is:
If
Container_Transactions.Local_Transaction_Duration is greater than 2000
then
the situation WASCTLclTransDurationHigh is true.
WASDBConnectionPoolThrdTimeout
WASDBConnectionPoolThrdTimeout monitors the thread timeout count. Thissituation issues a critical condition whenever the timeout count is greater thanzero. The situation excludes summary rows from its calculation. Its formula is:
If
DB_Connection_Pools.Threads_Timed_Out is greater than 0
and
DB_Connection_Pools.Summary_of_All_DB_Connections is equal to 0
then
the situation WASDBConnectionPoolThreadTimeout is true.
WASDBConnectionPoolUsageMaxed
WASDBConnectionPoolUsageMaxed monitors the JDBC pool usage and issues acritical alert if the pool usage is greater than or equal to 100%. The situationexcludes summary rows from its calculation. Its formula is:
If
DB_Connection_Pools.Percent_Used is greater than or equal to 100%
and
DB_Connection_Pools.Summary_of_All_DB_Connections is equal to 0
then
the situation WASDBConnectionPoolUsageMaxed is true.
88 Application Performance Diagnostics: Application Performance Diagnostics Reference

WASDBConPAverageUsageTimeHigh
WASDBConPAverageUsageTimeHigh monitors the average time that a connectionin use is high. This situation issues a critical alert if the average time theconnection in use is longer than 2 seconds. The situation excludes summary rowsfrom its calculation. Its formula is:
If
DB_Connection_Pools.Average_Usage_Time is greater than 2000
and
DB_Connection_Pools.Summary_of_All_DB_Connections is equal to 0
then
the situation WASDBConPAverageTimeHigh is true.
WASDBConPAvgWaitTimeHigh
WASDBConPAvgWaitTimeHigh monitors the average time that a client must waitfor a connection. This situation issues a critical alert when the time period is longerthan 2 seconds. The situation excludes summary rows from its calculation. Itsformula is:
If
DB_Connection_Pools.Average_Wait_Time is greater than 2000
and
DB_Connection_Pools.Summary_of_All_DB_Connections is equal to 0
then
the situation WASDBConPAvgWaitTimeHigh is true.
WASEJBCreateTimeHigh
WASEJBCreateTimeHigh monitors the average time of a bean create call and issuesa critical alert when the time is longer than 2 seconds. Its formula is:
If
Enterprise_Java_Beans.Create_Average_Time is greater than 2000
then
the situation WASEJBCreateTimeHigh is true.
WASEJBMethodResponseTimeHigh
WASEJBMethodResponseTimeHigh monitors the average response time on remoteinterface methods for all beans. This situation issues a Critical alert if the responsetime is longer than 2 seconds. Its formula is:
Chapter 7. Thresholds 89

If
Enterprise_Java_Beans.Method_Average_Response_Time is greater than 2000
then
the situation WASEJBMethodResponseTimeHigh is true.
WASEJBRemoveTimeHigh
WASEJBRemoveTimeHigh monitors the average time of a bean remove call andissues a critical alert when the time is longer than 2 seconds. Its formula is:
If
Enterprise_Java_Beans.Remove_Average_Time is greater than 2000
then
the situation WASEJBRemoveTimeHigh is true.
90 Application Performance Diagnostics: Application Performance Diagnostics Reference

Chapter 8. System Messages
The Agent for WebSphere Applications displays system messages when errorsoccur when you are installing, configuring, or using the agent.
CFG Messages: Data Collector installation and configuration utilitiesThe ITCAM Data Collector for WebSphere is installed in a location you specify. Anumber of configuration utilities are provided for configuring, unconfiguring,reconfiguring, and migrating the data collector in both console mode and silentmode. All such messages have IDs in the range CFG1002E to CFG5052W.
CFG1002E:Unexpected exception detected in config.py.Explanation
The configuration program detected an unexpected and unrecoverable errorcondition.
Operator response
Gather the provider trace log for more information and contact IBM support.
CFG1003E:Logging routine failed, traceback follows.Explanation
An error that occurred during the logging routine prevented successful diagnosticrecording.
Operator response
Gather the provider trace log and, if possible, the terminal log for this session, andcontact IBM support.
CFG1004E:Some substitution values were not replaced in theinput.properties file:
Explanation
Tokens of the form @{tokenname} were not replaced in by file tailoring of theinput.properties file. This might be a problem, depending upon the use of themissing tokens.
Operator response
Gather the provider trace log and, if possible, the terminal log for this session, andcontact IBM support.
© Copyright IBM Corp. 2013 91

CFG1005E:Directory directory does not exist, will attempt tocreate.
Explanation
The specified directory is not present in the runtime directory. Processing willcontinue, but successful completion of configuration is unlikely.
Operator response
Gather the provider trace log and, if possible, the terminal log for this session, andcontact IBM support.
CFG1038E:Unable to create the directory - directory.Explanation
Unable to create the specified directory.
Operator response
None.
CFG1039E:The directory is not empty - directory.Explanation
The specified directory is not empty.
Operator response
Select a different directory.
CFG1050E:Some substitution values were not replaced in theitcam_wsBundleMetaData.xml file:
Explanation
Tokens of the form tokenname} were not replaced by file tailoring of theitcam_wsBundleMetaData.xml file. This might be a problem, depending upon theuse of the missing tokens.
Operator response
Gather the provider trace log and, if possible, the terminal log for this session, andcontact IBM support.
CFG1055E:**ERROR** Error in creating runtime directories.Explanation
An error occurred when creating or updating the runtime directories.
Operator response
Gather the provider trace log and, if possible, the terminal log for this session, andcontact IBM support.
92 Application Performance Diagnostics: Application Performance Diagnostics Reference

CFG1057E:Property property has no value or does not exist-input.properties.
Explanation
A value is not specified for the property in the input.properties file of the server.
Operator response
Gather the provider trace log and, if possible, the terminal log for this session, andcontact IBM support.
CFG1058E:Server list is empty or serious error occurred.Explanation
The server list is empty or a serious error occurred.
Operator response
Gather the provider trace log and, if possible, the terminal log for this session, andcontact IBM support.
CFG1059E:No matching property or missing property found in- file.
Explanation
No matching property is found in the input.properties file of the server or theproperty is missing from the file.
Operator response
Gather the provider trace log and, if possible, the terminal log for this session, andcontact IBM support.
CFG1064E:ITCAM_MIGRATEHOME variable is not set.Explanation
To migrate, you must specify the location of the configuration to be migrated.
Operator response
Specify the location of the configuration to migrate.
CFG1065E:Error occurred while checking for upgrade version- version.
Explanation
An error occurred while the utility was checking for the version to upgrade.
Operator response
Gather the provider trace log and, if possible, the terminal log for this session, andcontact IBM support.
Chapter 8. System Messages 93
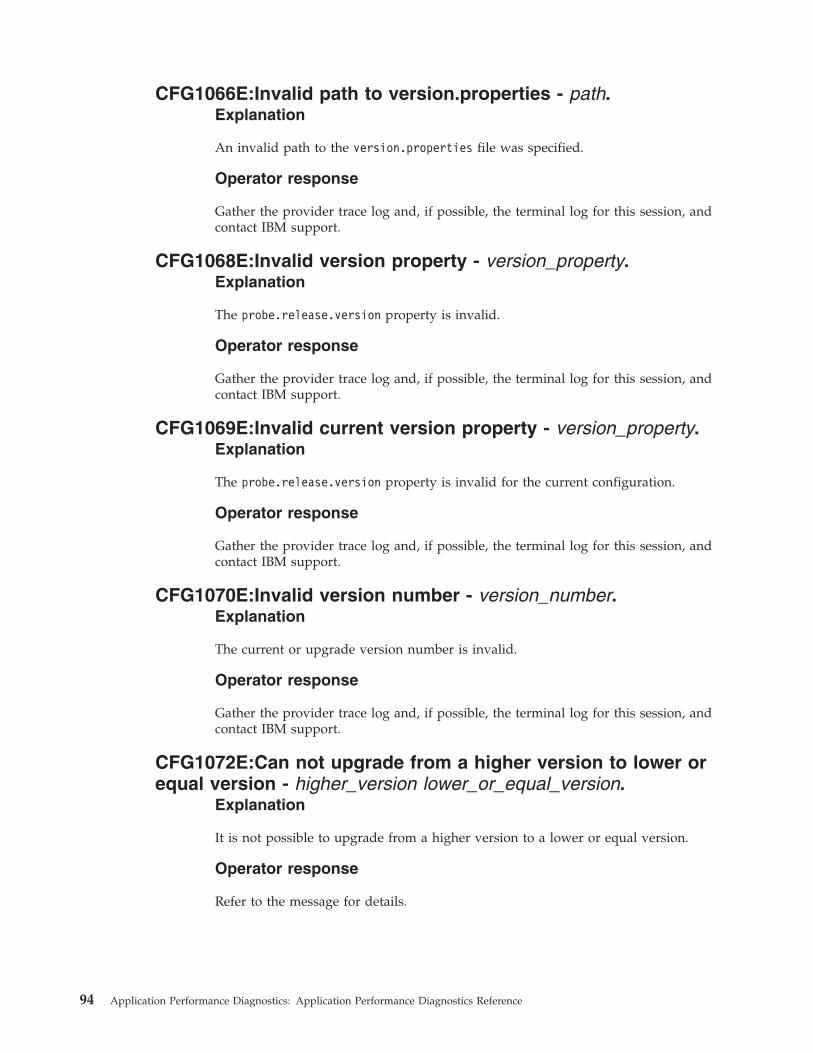
CFG1066E:Invalid path to version.properties - path.Explanation
An invalid path to the version.properties file was specified.
Operator response
Gather the provider trace log and, if possible, the terminal log for this session, andcontact IBM support.
CFG1068E:Invalid version property - version_property.Explanation
The probe.release.version property is invalid.
Operator response
Gather the provider trace log and, if possible, the terminal log for this session, andcontact IBM support.
CFG1069E:Invalid current version property - version_property.Explanation
The probe.release.version property is invalid for the current configuration.
Operator response
Gather the provider trace log and, if possible, the terminal log for this session, andcontact IBM support.
CFG1070E:Invalid version number - version_number.Explanation
The current or upgrade version number is invalid.
Operator response
Gather the provider trace log and, if possible, the terminal log for this session, andcontact IBM support.
CFG1072E:Can not upgrade from a higher version to lower orequal version - higher_version lower_or_equal_version.
Explanation
It is not possible to upgrade from a higher version to a lower or equal version.
Operator response
Refer to the message for details.
94 Application Performance Diagnostics: Application Performance Diagnostics Reference

CFG1073E:Can not discover profiles. Make sure there is alocal application server profile created.
Explanation
Unable to discover a list of profiles.
Operator response
Create a local application server profile and rerun the utility.
CFG1076E:Required files not processed for migration.Explanation
Required files not processed for migration.
Operator response
Check the migrate_home/config/configure/@SERVER directory for the dcInput.txtfile.
CFG1078I:There are application servers configured by olderversion of the data collector. Run migrate.bat/sh for details.
Explanation
There are application servers configured by an older version of the ITCAM DataCollector for WebSphere. You must run the migration script to upgrade theapplication servers to the current version of the data collector.
Operator response
Check config_home/data/config.log for the list of application servers.
CFG1081E:Unable to create custom directory directory.Explanation
Unable to create a custom directory.
Operator response
Gather the provider trace log and, if possible, the terminal log for this session, andcontact IBM support.
CFG1082E:Unable to copy custom property file file to location.Explanation
Unable to copy the custom property file from the old release.
Operator response
Gather the provider trace log and, if possible, the terminal log for this session, andcontact IBM support.
Chapter 8. System Messages 95

CFG1087I:Configuration process has failed. Check datacollector configuration log files to find error messages.
Explanation
The configuration process has failed.
Operator response
Check config.log and configDataCollector.log for configuration errors.
CFG1091E:WAS admin connection type: property has no portnumber specified.
Explanation
The SOAP or RMI port number is not specified.
Operator response
Rerun the configuration utility and provide a valid SOAP or RMI port number.
CFG1092E:WAS admin user: property has no password.Explanation
The password for the WebSphere Application Server administrator user was notspecified.
Operator response
Rerun the configuration utility and specify a valid WebSphere Application Serveradministrator password.
CFG1093E:Error found during data collector configurationprocess for server(s): servers. Next line has the errordescription.
Explanation
An error occurred during the configuration process.
Operator response
Review the error description and fix the problem accordingly.
CFG1104E:FAILED.Explanation
The installation of the service program failed.
Operator response
None.
96 Application Performance Diagnostics: Application Performance Diagnostics Reference

CFG1107E:Error(s) occurred during the installation of theservice programs. Please check the log for more information.
Explanation
The script that installs service programs finished with errors.
Operator response
None.
CFG1109E:WebSphere version is not set, unable to continue.Explanation
The might be a problem with the installation of the WebSphere Application Server.Unable to determine the version of the WebSphere Application Server.
Operator response
Verify that the version of the WebSphere Application Server is supported.
CFG1110E:Unable to discover WebSphere installationdirectory under location.
Explanation
Unable to discover the WebSphere Application Server home directory.
Operator response
Reenter the WebSphere Application Server home directory.
CFG1111E:Prompt failed for TCP/IP interface.Explanation
See message.
Operator response
None.
CFG1112E:Unexpected line in findServers output output.Explanation
An internal error has occurred.
Operator response
Contact IBM support.
CFG1113E:Unexpected line in findServers output output.Explanation
An internal error has occurred.
Chapter 8. System Messages 97

Operator response
Contact IBM support.
CFG1114E:Invalid path path - loadProperties failed.Explanation
An internal error has occurred.
Operator response
Contact IBM support.
CFG1115E:Unable to continue without these files: files.Explanation
Files required for performing the configuration are not found.
Operator response
Contact IBM support.
CFG1116E:Unable to remove subComponentName symlinksymbolicLinkName.
Explanation
Unable to remove the symlink.
Operator response
Review the error description for more details.
CFG1117E:Parameter is required if TTAPI integration isconfigured.
Explanation
The specified parameter is not set.
Operator response
Rerun the utility and set the specified parameter.
CFG1118E:Failed to copy properties file: file.Explanation
Unable to copy the specified properties file.
Operator response
Review the error description for details.
98 Application Performance Diagnostics: Application Performance Diagnostics Reference

CFG1119E:log.properties copy and ascii conversion failed.Explanation
An internal error has occurred.
Operator response
Review the error description for details.
CFG1122E:directory home exists but file file is missing.Explanation
The specified file is not found.
Operator response
Review the error description for details.
CFG1123E:Failed to create subComponentName symlinksymbolicLinkName.
Explanation
Unable to create the symlink.
Operator response
Review the error description for details.
CFG1124E:Failed to copy file file.Explanation
Unable to copy the specified file.
Operator response
Review the error description for details.
CFG1125E:TTAPI Configuration failed for servers servers.Explanation
An error occurred during the configuration process.
Operator response
Review the error description for details.
CFG1128E:Unable to copy file file to destination.Explanation
Unable to copy the file to the specified location.
Chapter 8. System Messages 99

Operator response
Check the space available, the destination directory, and file permissions. Gatherthe provider trace log and, if possible, the terminal log for this session, and contactIBM support.
CFG1129E: Server Server program program failed to installproperly. Please check the log for more details log.
Explanation
An error occurred during the installation of a server program.
Operator response
Check the error log. Correct the error, if possible, and rerun the utility. Gather theprovider trace log and, if possible, the terminal log for this session, and contactIBM support.
CFG1134E:Unable to discover WebSphere installationdirectory on the system.
Explanation
Unable to discover the WebSphere Application Server home directory.
Operator response
Refer the message for details.
CFG1139E:-reconfig option is not supported in silent mode.Explanation
The -reconfig option is not supported in silent mode.
Operator response
You must not specify the -reconfig option when running the configuration utilityin silent mode.
CFG1141E:Unable to discover WebSphere home directoryunder directory.
Explanation
The WebSphere Application Server configuration home directory and the defaultprofile of the wsadmin utility of the WebSphere Application Server were not foundin the directory which was listed using the program's default directory searchdepth.
Operator response
Specify more of the path to the WebSphere Application Server configuration home.
100 Application Performance Diagnostics: Application Performance Diagnostics Reference

CFG1147E:Unable to locate NodeSync for node node. Makesure nodeagent for the node is started.
Explanation
The Node Agent must be running for the configuration process to complete. Arunning Node Agent was not found for the node.
Operator response
Start the Node Agent for the node. Make sure that the correct host name and portare specified for the Deployment Manager.
CFG1148E:No server has been specified.Explanation
One or more servers must be specified using the command-line -server option orthe ITCAM_SERVER environmental variable.
Operator response
Specify a server to be configured or unconfigured.
CFG1149E:No valid server name has been specified.Explanation
One or more valid server names must be specified using the command-line-server option or the ITCAM_SERVER environmental variable.
Operator response
Specify a valid server name.
CFG2002E:Unexpected exception detected in unconfig.py.Explanation
The program detected an unexpected and an unrecoverable error condition.
Operator response
Gather the provider trace log and, if possible, the terminal log for this session, andcontact IBM support.
CFG2003E:Logging routine failed, traceback follows.Explanation
An error in the logging routine has prevented successful diagnostic recording.
Operator response
Gather the provider trace log and, if possible, the terminal log for this session, andcontact IBM support.
Chapter 8. System Messages 101

CFG2006E:Migration of the Data Collector did not completesuccessfully with return code return code.
Explanation
The migration of the data collector did not complete successfully.
Operator response
Gather the provider trace log and, if possible, the terminal log for this session, andcontact IBM support.
CFG2007E:Copying the custom files or migrate unconfiguringfailed, Migration of the Data Collector did not completedsuccessfully.
Explanation
Either the process of copying the custom files failed or the unconfiguration processfailed. The migration of the data collector did not complete successfully.
Operator response
Gather the provider trace log and, if possible, the terminal log for this session, andcontact IBM support.
CFG2008E:Copying the custom file file to file failed.Explanation
Copying the specified custom file from a server that was migrated failed.
Operator response
Gather the provider trace log and, if possible, the terminal log for this session, andcontact IBM support.
CFG2009E:Migration of the Data Collector did not completedsuccessfully with return code return_code.
Explanation
The migration of the data collector did not complete successfully.
Operator response
Gather the provider trace log and, if possible, the terminal log for this session, andcontact IBM support.
CFG2012E:Failed to create websphere backup backup.Explanation
Unable to create a backup of the WebSphere Application Server.
102 Application Performance Diagnostics: Application Performance Diagnostics Reference

Operator response
Gather the provider trace log and, if possible, the terminal log for this session, andcontact IBM support.
CFG2016E:Error occurred while processing find servers -servers.
Explanation
An error occurred during the process of finding servers.
Operator response
Gather the provider trace log for more information and contact IBM support.
CFG2017E:Error occurred while processing find probes -probes.
Explanation
An error occurred while finding the probes routine.
Operator response
Gather the provider trace log for more information and contact IBM support.
CFG2018E:Error occurred while processing check probes -probes.
Explanation
An error occurred while checking the probes routine.
Operator response
Gather the provider trace log for more information and contact IBM support.
CFG2019E:Error found during program call process for Cell:cell Node: node Profile: profile. Next line has the errordescription.
Explanation
An error occurred while the wsadmin utility was processing a specific category.The category is displayed in the message.
Operator response
Gather the provider trace log for more information and contact IBM support.
Chapter 8. System Messages 103

CFG2020E:Error found during wsadmin execution for programcall process for Cell: cell Node: node Profile: profile.
Explanation
An error occurred while the wsadmin utility was processing a specific category.The category is displayed in the message.
Operator response
Gather the provider trace log for more information and contact IBM support.
CFG2027E:Dynamic reconfiguration process did not completesuccessfully.
Explanation
The dynamic reconfiguration process did not complete successfully.
Operator response
Gather the provider trace log for more information and contact IBM support.
CFG2029E:Error occurred while processing find servers -servers.
Explanation
An error occurred while running the find servers process.
Operator response
Gather the provider trace log for more information and contact IBM support.
CFG2030E:Error occurred while processing mbean call, failedto open file.
Explanation
An error occurred during the mbeancall routine. Unable to open the mbeanlist file.
Operator response
Gather the provider trace log for more information and contact IBM support.
CFG2031E:Error found during wsadmin execution for programcall process for Profile: profile.
Explanation
An error occurred while the wsadmin utility was processing a specific category.The category is displayed in the message.
Operator response
Gather the provider trace log for more information and contact IBM support.
104 Application Performance Diagnostics: Application Performance Diagnostics Reference

CFG2033E:Connection to profile profile failed.Explanation
Unable to connect to the specified profile.
Operator response
Review the message for details.
CFG2034E:Error found during program call process for Cell:cell Node: node Profile: profile.
Explanation
An error occurred while the wsadmin utility was processing a specific category.The category is displayed in the message.
Operator response
Make sure that the server is up and that it is running. If the server is up and isrunning, then gather the provider trace log for more information, and contact IBMsupport.
CFG2037E:Could not connect to the MS - Managing_Server.Explanation
Could not connect to the Managing Server.
Operator response
Check the host name and make sure that the Managing Server is up and isrunning.
CFG2038E:Error occurred while program call - call.Explanation
An error occurred while processing a call for the wsadmin utility for a specificcategory. The category is specified in the message.
Operator response
Gather the provider trace log for more information and contact IBM support.
CFG2041E:Profile registry file not found file.Explanation
The profile registry file does not exist in the WebSphere Application Server homedirectory. The registry file must reside in the WAS_home/properties directory.
Operator response
Gather the provider trace log for more information and contact IBM support.
Chapter 8. System Messages 105
CFG2042E:Profile path not found for profile profile.Explanation
Unable to find the path to the specified profile.
Operator response
Gather the provider trace log for more information and contact IBM support.
CFG2043E:dc.operation.mode has no parameter setting.Explanation
The dc.operation.mode parameter does not have the correct value for theunconfiguration process.
Operator response
Gather the provider trace log for more information and contact IBM support.
CFG2044E:Unable to locate property in file.Explanation
Unable to find the specified property in the data collector property files.
Operator response
Gather the provider trace log for more information and contact IBM support.
CFG2047E:XD Template creation did not completesuccessfully
Explanation
XD Template creation did not complete successfully.
Operator response
Gather the provider trace log for more information, and call IBM help desk.
CFG2049E:Creation of XD template did not completesuccessfully.
Explanation
XD template creation did not complete successful.
Operator response
Gather the provider trace log for more information, and call IBM help desk.
CFG2054E:Discovery data file does not exist.Explanation
Discovery data file does not exist.
106 Application Performance Diagnostics: Application Performance Diagnostics Reference

Operator response
Gather the provider trace log for more information, and call IBM help desk.
CFG2056E:Unexpected exception detected inconfigtemplatexd.py.
Explanation
The program has detected an unexpected and unrecoverable error condition.
Operator response
Gather the provider trace log for more information, and call IBM help desk.
CFG2057E:Unexpected exception detected indeletetemplatexd.py.
Explanation
The program has detected an unexpected and unrecoverable error condition.
Operator response
Gather the provider trace log for more information, and call IBM help desk.
CFG2059E:Deletion of XD template did not completesuccessfully.
Explanation
XD template deletion did not complete successfully.
Operator response
Gather the provider trace log for more information, and call IBM help desk.
CFG2061E:Discovery of XD template did not completesuccessfully.
Explanation
XD template discovery did not complete successfully.
Operator response
Gather the provider trace log for more information, and call IBM help desk.
CFG2079E:Error found during wsadmin execution forConfiguration call process for Profile: <profile>
Explanation
Error found in processing a specific category for wsadmin. The category is displayedin the message.
Chapter 8. System Messages 107

Operator response
Gather the provider trace log for more information, and call IBM help desk.
CFG2080E:Error found during wsadmin execution forReconfiguration call process for Profile: <profile>
Explanation
Error found in processing a specific category for wsadmin. The category isdisplayed in the message.
Operator response
Gather the provider trace log for more information, and call IBM help desk.
CFG2081E:Error found during wsadmin execution forUnconfiguration call process for Profile: <profile>
Explanation
Error found in processing a specific category for wsadmin. The category isdisplayed in the message.
Operator response
Gather the provider trace log for more information, and call IBM help desk.
CFG2082E:Error found during wsadmin execution formigration call process for Profile: <profile>
Explanation
Error found in processing a specific category for wsadmin. The category isdisplayed in the message.
Operator response
Gather the provider trace log for more information, and call IBM help desk.
CFG2083E:Error found during wsadmin execution for FindServers call process for Profile: <profile>
Explanation
Error found in processing a specific category for wsadmin. The category isdisplayed in the message.
Operator response
Gather the provider trace log for more information, and call IBM help desk.
108 Application Performance Diagnostics: Application Performance Diagnostics Reference

CFG2084E:Error found during wsadmin execution for XDtemplate configuration call process for Profile: <profile>
Explanation
Error found in processing a specific category for wsadmin. The category isdisplayed in the message.
Operator response
Gather the provider trace log for more information, and call IBM help desk.
CFG2085E:Error found during wsadmin execution for XDtemplate deletion call process for Profile: <profile>
Explanation
Error found in processing a specific category for wsadmin. The category isdisplayed in the message.
Operator response
Gather the provider trace log for more information, and call IBM help desk.
CFG2086E:Error found during wsadmin execution for XDtemplate discovery call process for Profile: <profile>
Explanation
Error found in processing a specific category for wsadmin. The category isdisplayed in the message.
Operator response
Gather the provider trace log for more information, and call IBM help desk.
CFG2087E:Error found during wsadmin execution forConfiguration call process for Cell: <cell> Node: <node>Profile: <profile>
Explanation
Error found in processing a specific category for wsadmin. The category is displayedin the message.
Operator response
Gather the provider trace log for more information, and call IBM help desk.
Chapter 8. System Messages 109

CFG2088E:Error found during wsadmin execution forReconfiguration call process for Cell: <cell> Node: <node>Profile: <profile>
Explanation
Error found in processing a specific category for wsadmin. The category isdisplayed in the message.
Operator response
Gather the provider trace log for more information, and call IBM help desk.
CFG2089E:Error found during wsadmin execution forUnconfiguration call process for Cell: <cell> Node: <node>Profile: <profile>
Explanation
Error found in processing a specific category for wsadmin. The category isdisplayed in the message.
Operator response
Gather the provider trace log for more information, and call IBM help desk.
CFG2090E: Error found during wsadmin execution forMigration call process for Cell: <cell> Node: <node> Profile:<profile>
Explanation
Error found in processing a specific category for wsadmin. The category isdisplayed in the message.
Operator response
Gather the provider trace log for more information, and call IBM help desk.
CFG2091E:Error found during wsadmin execution for FindServers call process for Cell: <cell> Node: <node> Profile:<profile>
Explanation
Error found in processing a specific category for wsadmin. The category is displayedin the message.
Operator response
Gather the provider trace log for more information, and call IBM help desk.
110 Application Performance Diagnostics: Application Performance Diagnostics Reference

CFG2092E:Error found during wsadmin execution for XDtemplate configuration call process for Cell: <cell> Node:<node> Profile: <profile>
Explanation
Error found in processing a specific category for wsadmin. The category isdisplayed in the message.
Operator response
Gather the provider trace log for more information, and call IBM help desk.
CFG2093E:Error found during wsadmin execution for XDtemplate deletion call process for Cell: <cell> Node: <node>Profile: <profile>
Explanation
Error found in processing a specific category for wsadmin. The category isdisplayed in the message.
Operator response
Gather the provider trace log for more information, and call IBM help desk.
CFG2094E:Error found during wsadmin execution for XDtemplate discovery call process for Cell: <cell> Node: <node>Profile: <profile>
Explanation
Error found in processing a specific category for wsadmin. The category isdisplayed in the message.
Operator response
Gather the provider trace log for more information, and call IBM help desk.
CFG3022E:Invalid installation home directory specified:directory.
Explanation
The installation home directory that was specified is invalid.
Operator response
Review the error message for details. Correct the problem and rerun the script.
Chapter 8. System Messages 111

CFG5003E:Error: Maximum number of retries have beenreached.
Explanation
An error occurred in the prompt routine. The script was unable to get a valid userresponse within the maximum number of retries.
Operator response
Gather the provider trace log for more information and contact IBM support.
CFG5007E:Invalid response: response Please try again.Explanation
Your response was invalid.
Operator response
Enter a valid response.
CFG5011E:Warning - Note that not all Node Agents connectedto the Deployment Manager are running.
Explanation
A non-critical error problem was found when discovering servers.
Operator response
Start the Node Agents.
CFG5012E:Error - Failed to discover servers for the profile.Explanation
A critical error problem was found when discovering servers.
Operator response
Review the error message for details, correct the problem, and retry.
CFG5013E:Invalid response:Explanation
Your response was invalid.
Operator response
Enter a valid response.
CFG5015E:Data element element is not present in the PDL.Explanation
An internal error has occurred.
112 Application Performance Diagnostics: Application Performance Diagnostics Reference

Operator response
Contact IBM support.
CFG5016E:Data element element of PDL is not a list,superfluous index index specified.
Explanation
An internal error has occurred.
Operator response
Contact IBM Software Support.
CFG5017E:Data element element of PDL has no entries.Explanation
An internal error has occurred.
Operator response
Contact IBM support.
CFG5018E:Data element for PCL is not present in the PDL.Explanation
An internal error has occurred.
Operator response
Contact IBM support.
CFG5019E:Unexpected value type type for PDL key key.Explanation
An internal error has occurred.
Operator response
Contact IBM support.
CFG5020E:Invalid PDL key format from: format to: format,unable to prompt.
Explanation
An internal error has occurred.
Operator response
Contact IBM support.
Chapter 8. System Messages 113

CFG5021E:Failed to create directory.Explanation
Unable to create the specified directory.
Operator response
None.
CFG5022E:Internal program error detected in location.Explanation
The program has detected an unrecoverable internal error condition.
Operator response
Gather the provider trace log for more information and contact IBM support.
CFG5023E:Command line option option is not a known flag.Explanation
The specified option is invalid.
Operator response
Enter the correct parameter name and rerun the utility.
CFG5024E:Missing parameter for option command line option.Explanation
The command-line option requires a parameter.
Operator response
Enter a parameter for the option.
CFG5025E:Unexpected value value for environment variableenvironment_variable format format for variable.
Explanation
The value of the specified environment variable is invalid.
Operator response
Review the error and assign correct value to the variable.
CFG5026E:Critical error in program.Explanation
The program has detected an unrecoverable error which was caused by eitherinvalid parameters or invalid environmental settings being specified.
114 Application Performance Diagnostics: Application Performance Diagnostics Reference

Operator response
Review the error and correct the problem.
CFG5028E:Configuration home is not set from eitherITCAM_CONFIG nor -config and current directory is not avalid config_home.
Explanation
Unable to validate the configuration home directory.
Operator response
Change the current directory to the configuration home directory which containsthe script you want to run and rerun the script.
CFG5030E:The file directory in the file name: file does notexist. The file must be under an existing directory.
Explanation
Reenter a file name under an existing directory.
Operator response
Either exit the configuration utility, create the directory, and rerun theconfiguration utility, or enter a different file name.
CFG5032E:Cannot access file: file.Explanation
The specified file either does not exist or the user has no access to the file.
Operator response
Check the log file to see whether a related error is logged.
CFG5033E:The silent input file cannot be accessed.Explanation
The silent input file cannot be accessed.
Operator response
Check that the file exists or whether access to the file is defined for any reason.Otherwise, gather the provider trace log and, if possible, the terminal log for thissession, and contact IBM support.
CFG5034E:Invalid value specified by program for option:keyword for dataEntry - badValue.
Explanation
Validation failed for the value specified by the option.
Chapter 8. System Messages 115

Operator response
Correct or remove the invalid value and retry.
CFG5035E:This combination of profile profile, cell name cell,node name node, server name server is not a validcombination.
Explanation
The specified cell name, node name, and server name combination does notrepresent a configured server.
Operator response
Gather the provider trace log and, if possible, the terminal log for this session, andcontact IBM support.
CFG5036E:This combination of profile profile, cell name cell,node name node, server name server is already unconfigured.
Explanation
The specified cell name, node name, and server name combination represents aserver that is already unconfigured.
Operator response
Gather the provider trace log and, if possible, the terminal log for this session, andcontact IBM support.
CFG5037E:Cannot connect to WebSphere. Make sure theWebSphere server or the node agent is up and running.
Explanation
Unable to connect to the WebSphere server. The WebSphere server or the NodeAgent might not be up and running
Operator response
Check that the WebSphere server and the Node Agent are running. Start the serveror the Node Agent if it is not running, and rerun configuration utility.
CFG5038E:The value of parameter which is: value in the silentconfiguration file is invalid.
Explanation
The specified value in the silent configuration file is invalid.
Operator response
Enter a valid value and, if necessary, contact IBM support.
116 Application Performance Diagnostics: Application Performance Diagnostics Reference

CFG5039E:[SERVER] is uncommented for server server, butwas.appserver.server.name is not defined.
Explanation
See message.
Operator response
Either comment out the unused [SERVER] line in the file or enter the server name,and, if necessary, contact IBM support.
CFG5040E:Managing Server home is not set in the silentconfiguration file and we cannot connect to the ManagingServer, so exiting Configuration Utility.
Explanation
The utility cannot access the Managing Server because the Managing Server homedirectory is not set in the silent configuration file. Exiting the configuration utility.
Operator response
Check the connection to the Managing Server and restart the Managing Server. Ifthe Managing Server is not running and the Managing Server home directoryvalue is known, enter the Managing Server home directory in the silentconfiguration file.
CFG5041E:Cannot connect to Managing Server, so we areusing the Managing Server Home details provided in the silentconfiguration file: file.
Explanation
Unable to connect to the Managing Server using the connection information in thesilent configuration file. The utility is using the Managing Server home directoryvalue set in the silent configuration file.
Operator response
If this information is incorrect, reconfigure the server to change its connection tothe Managing Server.
CFG5042E:This value: value is not currently supported in thesilent configuration file.
Explanation
The silent configuration file does not support the specified key.
Operator response
Input a correct key value. Review the comments it the sample silent files that areprovided or consult the documentation.
Chapter 8. System Messages 117

CFG5044E:Parameter: parameter is missing from the silentinput file.
Explanation
The specified parameter must be set in the silent input file for the current scenario.
Operator response
Update the silent file to include the specified parameter.
CFG5045E:The configuration process is being terminated dueto errors listed above.
Explanation
The configuration process is stopping because of the errors listed earlier.
Operator response
Examine the error messages and take the appropriate action to correct.
CFG5046E:AdminTask object is required to complete theconfiguration, but is unavailable. Unable to continue.
Explanation
The AdminTask object, which is required to set WebSphere Application Serverparameters, is unavailable.
Operator response
Check wsadmin.traceout file for errors and fix any problems identified.
CFG5047E:Invalid Profile:profile , Cellname:cell ,nodename:node , servername:server combination in the silentinput file.
Explanation
The specified profile, cell, node, and server name combination in the silent inputfile is invalid for the current scenario.
Operator response
Update the silent file to include a valid profile, cell, node, and server namecombination.
CFG5049E:The ProbeUnconfigurator failed: kernel.rfs.addressis not set.
Explanation
An internal error has occurred. The ProbeUnconfigurator is usable to communicatewith the Managing Server.
118 Application Performance Diagnostics: Application Performance Diagnostics Reference

Operator response
Check the log files to determine why the kernel.rfs.address parameter is not set.You might be able to unconfigure the data collector manually from the ManagingServer.
CFG5050E:The ProbeUnconfigurator failed: invalid rfs port.Explanation
An internal error has occurred. The ProbeUnconfigurator is usable to communicatewith the Managing Server.
Operator response
Check the log files to determine why the kernel RFS port is invalid. You might beable to unconfigure the data collector probe manually from the Managing Server.
CFG5054E:Failure in Jython bootstrap.Explanation
Unrecoverable error occurred while extracting files from gdc archive.
Operator response
Review log files, check directory permission.
CFG5056E:Specified response file not found on the system.Explanation
Response file not found in the location specified.
Operator response
Make sure correct path and filename are specified in the silent response file.
CFG5057E:Extraction of gdc_extract.py failedExplanation
Failed to extract files from gdc archive into temporary location.
Operator response
Check user permission, make sure disk is not full. Check logs for additionaldetails.
CFG5058E:Specify archive file to extract from.Explanation
Required parameter archive file name is not specified.
Operator response
Re-run the command, include all the required parameters.
Chapter 8. System Messages 119

CFG5059E:No temporary directory.Explanation
Unable to create temporary directory to place extracted files.
Operator response
Check user permission, make sure disk is not full. Check logs for additionaldetails.
CFG5060E:Failure in Java bootstrap.Explanation
Unrecoverable error occurred while running a Java command.
Operator response
Review log files, check directory permission.
CFG5061E:Parameter conflict, both -d and -r flags may not beused together
Explanation
The command was executed with flags that can not be specified together.
Operator response
Check usage documentation, re-run command with correct flags.
CFG5062E:Failed to get the value of ITCAM_CONFIGHOMEExplanation
Unable to get value of a system variable.
Operator response
Check logs for additional details.
CFG5063E:Specified archive file doesn't exist.Explanation
Archive file not found in the location specified.
Operator response
Check file name and location and re-run the command.
CFG5064E:Unknown PDL formatExplanation
An internal error has been detected.
120 Application Performance Diagnostics: Application Performance Diagnostics Reference
Operator response
Gather the provider trace log for more information, and call IBM help desk.
CFG5065E: Path does not exist: <path>Explanation
A path which does not exist has been entered in response to a prompt.
Operator response
Retry specifying a valid path. If the prompt persists, gather the provider trace logfor more information, and call IBM help desk.
CFG5066E: Path is not a valid WebSphere home directory:<directory>
Explanation
In the case of WebSphere the path entered does not contain a WAS.product file inthe properties/version directory, or in the case of WebSphere Liberty does notcontain the WebSphereApplicationServer.properties file in the lib/versionsdirectory. In this situation the path is presumed to be invalid.
Operator response
Retry specifying a valid WebSphere home directory. If the prompt persists, gatherthe provider trace log for more information, and call IBM help desk.
CFG5069E:The WebSphere product file WAS.product was notfound in <location>
Explanation
This message indicates the reason that the path indicated is not within a validWebSphere home directory.
Operator response
Retry specifying a valid WebSphere home directory. If the prompt persists, gatherthe provider trace log for more information, and call IBM help desk.
CFG5070E:No WebSphere properties/version path foundunder <location>
Explanation
This message indicates the reason that the path indicated is not a valid WebSpherehome directory.
Operator response
Retry specifying a valid WebSphere home directory. If the prompt persists, gatherthe provider trace log for more information, and call IBM help desk.
Chapter 8. System Messages 121
CFG5071E:No WebSphere Liberty home properties file foundin lib/versions under <location>
Explanation
This message indicates the reason that the path indicated is not a valid WebSphereLiberty home directory.
Operator response
Retry specifying a valid WebSphere Liberty or WebSphere home directory. If theprompt persists, gather the provider trace log for more information, and call IBMhelp desk.
CFG5072E: No WebSphere Liberty lib/properties path foundunder <location>
Explanation
This message indicates the reason that the path indicated is not a valid WebSphereLiberty home directory.
Operator response
Retry specifying a valid WebSphere Liberty or WebSphere home directory. If theprompt persists, gather the provider trace log for more information, and call IBMhelp desk.
CYND Messages: Data CollectorThe following messages relate to the WebSphere data collector. All such messageshave IDs in the range CYND0012I to CYND7163I and CYNPE0001I toCYNPE0011E.
CYND1002E:Custom Service initialization failed as JVMPIcould not be initialized
Explanation
Custom Service initialization failure is due to the JVM argument -Xrun not beingspecified properly
Operator response
Check the Installation Guide and verify that the application server is configuredproperly.
CYND1006E:The am.home system property is undefined.Explanation
The installer failed to setam.home during installation.
Operator response
Check the Installation Guide and specify am.home properly.
122 Application Performance Diagnostics: Application Performance Diagnostics Reference

CYND1012E:Failed to start ProbeManager.Explanation
JVMPI initialization failed.
Operator response
Check the application configuration and Installation Guide. Verify that the requiredJVM arguments are set correctly
CYND1013F:JVMPI was not initialized by native probe startexiting.
Explanation
Failure to initialize JVMPI may be caused by either a corrupted libam.so file, orJVM arguments are set incorrectly.
Operator response
Check the application configuration and the Installation Guide. Verify that therequired JVM arguments are set correctly.
CYND1015F:JVMPI initialization failed.Explanation
Failure to initialize JVMPI may be caused by either a corrupted libam.so file, orJVM arguments are set incorrectly
Operator response
Check the application configuration and the Installation Guide. Verify that therequired JVM arguments are set correctly.
CYND1017E:Failed to initialize JVMMI.Explanation
Failure to initialize JVMMI may be caused by either a corrupted libam.so file orthe JVM arguments are set incorrectly.
Operator response
Check the application configuration and the Installation Guide. Verify that therequired JVM arguments are set correctly.
CYND1019E: Error occurred during encryption.Explanation
The error occurred as the result of a corrupted userid and password.
Operator response
Check the input user ID and password, and verify that they are in clear text.
Chapter 8. System Messages 123

CYND1020E:Invalid file name.Explanation
The file name containing the user ID and password is invalid
Operator response
Verify that the properties certificate.path and keystore.location are setcorrectly in datacollector.properties.
CYND1021E:Invalid userID or password.Explanation
User ID or password is missing.
Operator response
Enter a valid user ID and password.
CYND1022E: Invalid file name.Explanation
The file name containing user ID and password is invalid.
Operator response
Verify that the properties certificate.path and keystore.location are setcorrectly in datacollector.properties.
CYND1023E: Invalid userID or password.Explanation
User ID or password is missing.
Operator response
Check the Installation Guide and enter a valid user ID and password.
CYND1024E:Could not open the file: filenameExplanation
Either the file does not exist, or the file does not have read permissions.
Operator response
Verify that the file exists and has read permission.
CYND1025E:No data in the file: filenameExplanation
The file is empty.
124 Application Performance Diagnostics: Application Performance Diagnostics Reference

Operator response
Verify that the file contains a valid user ID and password.
CYND1026E:Invalid file name, userID or password.Explanation
The file name, user ID or password is missing.
Operator response
Check the Installation Guide and verify that a valid ker store, certificate, user id,and password are provided.
CYND1027E:Could not open the file for writing: filenameExplanation
The error may be caused by no write permissions on the file.
Operator response
Verify the account has write permissions to the file.
CYND1028E:The input string is corrupt.Explanation
The input string is corrupt.
Operator response
Verify that the user ID and password do not exceed the maximum length.
CYND1029E:UID, PASSWORD or filename is NULL.Explanation
The userID, password or generated password filename is missing.
Operator response
Check the Installation Guide and verify that a valid user id, password, andgenerated password filename exist.
CYND1030E:Your actual password and decrypted passworddon't match
Explanation
The password may contain a space.
Operator response
Turn off Caps Lock and ensure there are no spaces in the password.
Chapter 8. System Messages 125

CYND1031E:The userID read from the file is not the same asUID entered.
Explanation
Verify that you typed in a valid user ID.
Operator response
Enter a valid user ID.
CYND1032E:Password read from the file is not the same asthe password entered.
Explanation
Verify that you typed in a valid password.
Operator response
Enter a valid password.
CYND1034E:Encrypted password string is corrupt.Explanation
The password is too long.
Operator response
Verify that the password does not exceed the maximum length.
CYND1035E:Error occurred during decryption.Explanation
The password may be corrupt.
Operator response
Enter a valid password.
CYND1036E:The password is too long. It should be less thanmax_len characters.
Explanation
The password is too long.
Operator response
Verify that the password does not exceed the maximum length.
126 Application Performance Diagnostics: Application Performance Diagnostics Reference

CYND1037E: JVMPI could not create a Raw Monitor forGlobalLock.
Explanation
An internal error has occurred.
Operator response
Restart the Application Server.
CYND1038E:Global lock was created before initialization ofJVMPI.
Explanation
An internal error has occurred.
Operator response
Restart the application server.
CYND1040E:The EventAgent was not started and cannotmanage ThreadData.
Explanation
The EventAgent failed to start.
Operator response
Check the Installation Guide for the Data Collector configuration. Restart theApplication Server.
CYND1042E:Event Queue is NULL for Thread, TID: tidExplanation
An internal error has occurred.
Operator response
Restart the Application Server.
CYND1048E:Class file is corrupt.Explanation
The ClassLoadHookEvent is corrupted. Therefore, eventHandler failed to getconstant pool.
Operator response
Restart the Application Server.
Chapter 8. System Messages 127

CYND1049E:Bad class file magic number:Explanation
The class file is corrupted.
Operator response
Restart the Application Server.
CYND1050E:Failed to open library: libNameExplanation
The library path was not set properly.
Operator response
Check the Installation Guide. Verify that the library path is set properly.
CYND1068E:am.home was not found; failed to initialize theProperty Manager.
Explanation
The Installer failed to set it during installation.
Operator response
Check the Installation Guide and specify it correctly.
CYND1069E:Default property file <file> not found.Explanation
The Installer failed to copy it during installation.
Operator response
Check the Installation Guide and copy it manually.
CYND1074E:Failed to retrieve the command arguments forWAS.
Explanation
An internal error has occurred.
Operator response
Restart the Application Server.
CYND1075E:Failed to retrieve command line arguments forStand Alone Java.
Explanation
An internal error has occurred.
128 Application Performance Diagnostics: Application Performance Diagnostics Reference

Operator response
Restart the Application Server.
CYND1076E:Failed to construct ThreadDumpInfo object.Explanation
The server is out of Java heap memory.
Operator response
Increase Java heap size and restart the Application Server.
CYND1083E:Cannot findcom.cyanea.bcm.bootstrap.BcmBootstrap.class.
Explanation
The JVM arguments -Xbootclasspath is not configured properly.
Operator response
Check the Installation Guide and verify that JVM is configured properly.
CYND1086E:Unable to send CTRL+BREAK event to JVMprocess.
Explanation
The Application Server was started as a Windows service. CTRL+BREAK onlyworks when the server is started from a console.
Operator response
Start the server from a console and try again.
CYND1087E:Unable to send SIGQUIT to JVM process.Explanation
Java process hangs or is under load.
Operator response
Do not try to get thread dump or a stack trace when the server is under load. Trylater when the server load is lighter.
CYND1088E:Cannot get Java system propertycyanea.probe.stdout.
Explanation
The Installer failed to set it properly. This property is only needed for hotspot jdk.
Chapter 8. System Messages 129

Operator response
Check the Installation Guide and configure it properly.
CYND1068E:am.home was not found; failed to initialize theProperty Manager.
Explanation
The Installer failed to set it during installation.
Operator response
Check the Installation Guide and specify it correctly.
CYND1069E:Default property file <file> not found.Explanation
The Installer failed to copy it during installation.
Operator response
Check the Installation Guide and copy it manually.
CYND1074E:Failed to retrieve the command arguments forWAS.
Explanation
An internal error has occurred.
Operator response
Restart the Application Server.
CYND1075E:Failed to retrieve command line arguments forStand Alone Java.
Explanation
An internal error has occurred.
Operator response
Restart the Application Server.
CYND1076E:Failed to construct ThreadDumpInfo object.Explanation
The server is out of Java heap memory.
Operator response
Increase Java heap size and restart the Application Server.
130 Application Performance Diagnostics: Application Performance Diagnostics Reference

CYND1083E:Cannot findcom.cyanea.bcm.bootstrap.BcmBootstrap.class.
Explanation
The JVM arguments -Xbootclasspath is not configured properly.
Operator response
Check the Installation Guide and verify that JVM is configured properly.
CYND1086E:Unable to send CTRL+BREAK event to JVMprocess.
Explanation
The Application Server was started as a Windows service. CTRL+BREAK onlyworks when the server is started from a console.
Operator response
Start the server from a console and try again.
CYND1087E:Unable to send SIGQUIT to JVM process.Explanation
Java process hangs or is under load.
Operator response
Do not try to get thread dump or a stack trace when the server is under load. Trylater when the server load is lighter.
CYND1088E:Cannot get Java system propertycyanea.probe.stdout.
Explanation
The Installer failed to set it properly. This property is only needed for hotspot jdk.
Operator response
Check the Installation Guide and configure it properly.
CYND0220E:generateThreadDump failedExplanation
The thread dump info field is null.
Operator response
Report the error to IBM support.
Chapter 8. System Messages 131

CYND0222E:Can't get ThreadDumpInfo classExplanation
Cannot get the thread dump information.
Operator response
Report error to IBM support.
CYND0223E:Cannot find method MethodExplanation
Cannot find method name.
Operator response
Report error to IBM support.
CYND0224E:Failed to allocate memory.Explanation
Memory allocation failed.
Operator response
Report the to IBM support.
CYND0225E:The Event Agent already started.Explanation
Event agent has already started.
Operator response
None.
CYND0226E:Failed to obtain jvmmi handle for heap dumpExplanation
Getting JVMMI handle for heap dump has failed.
Operator response
Report the error to IBM support.
CYND0227E:No javacore is generated.Explanation
Javacore is not generated.
Operator response
None.
132 Application Performance Diagnostics: Application Performance Diagnostics Reference

CYND0228E: Unable to get RAS.Explanation
Getting RAS has failed.
Operator response
Report the error to IBM support.
CYND0219E:Failed to GetStringUTFCharsExplanation
An error occurred while converting string to UTF8.
Operator response
Report the error to IBM support.
CYND0230E: Error in getting number of cpu with return codeError code
Explanation
Error in getting number of cpu.
Operator response
Report error to IBM support.
CYND0079E:Error in getting stack trace for thread Thread IDExplanation
Command Agent failed to get the stack trace for the specified thread.
Operator response
Report the error to IBM support.
CYND1112E:Unable to open counter file, FileExplanation
Not able to open gps counter file.
Operator response
Report the error to IBM support
CYND1104E:Cannot get the server common storage with errornumber Error
Explanation
Cannot get the server common storage.
Chapter 8. System Messages 133

Operator response
Report the error to IBM support.
Byte Code Modification Messages
CYND6001E: Unexpected exception. Refer to the tracing log.Explanation
No additional information is available for this message.
CYND6002E: ObjectName invalid format -MalformedObjectNameException was produced.Explanation
No additional information is available for this message.
CYND6003E: Unable to load configuration file: ProbeconfigfileExplanation
No additional information is available for this message.
CYND6007E: KeyStore location or store password or keypassword are not definedExplanation
No additional information is available for this message.
CYND6008E: No SSL compatible server socket implementation isavailable, if you are using JDK 1.3, download JSSE extensionand install it following JDK documentationExplanation
No additional information is available for this message.
CYND6009E: Exception when initializing SSL parametersExplanation
No additional information is available for this message.
CYND6010E: Exception in the task. Refer to the tracing log.Explanation
No additional information is available for this message.
CYND6032E: JMXConnectorServer was not found.Explanation
No additional information is available for this message.
CYND6033E: RequestAggregator was not foundExplanation
No additional information is available for this message.
134 Application Performance Diagnostics: Application Performance Diagnostics Reference
Generic Probe Engine
CYNPE0008E: XML parsing error occurred: errorType parsing filefileNameExplanation
See message.
CYNPE0009E: Aspect definition aspectName is defined withabstract pointcut pointcutName but has no concretizePointcutdefinitionExplanation
See message.
CYNPE0011E: MBean manager was unable to create MBeanserver with class MBeanServerClass and default domain namedomainNameExplanation
See message.
CYNPE0012E:Unable to resolve RequestWrapperRequestMapperName context data ContextDataKey WrappedException WrappedExceptionExplanation
See message.
KYN Messages: Tivoli Enterprise Monitoring AgentThe Tivoli Enterprise Monitoring Agent produces errors messages with IDs in therange KYNA0000 to KYNA0999; these are described below and in the followingpages.
KYNA0002E: ITCAM for Application Diagnostics monitoringagent initialization failed: errorMessage.
Explanation
The ITCAM for Application Diagnostics Tivoli Enterprise Monitoring Agentinitialization failed.
Operator response
Collect the agent log and contact IBM support.
KYNA0004E: Agent configuration file file was not found.Explanation
The ITCAM for Application Diagnostics monitoring configuration file specified inthe message was not found, the default configuration settings will be used.
Chapter 8. System Messages 135

Operator response
Reconfigure the ITCAM for Application Diagnostics Tivoli Enterprise MonitoringAgent to restore the configuration file, or collect the agent log and contact IBMsupport.
KYNA0005E: Agent configuration file file loading error:errorMessage.
Explanation
The ITCAM for Application Diagnostics monitoring configuration file specified inthe message could not be loaded so the default configuration settings will be used.
Operator response
Delete the corrupted configuration file manually and reconfigure the ITCAM forApplication Diagnostics Tivoli Enterprise Monitoring Agent to restore it, or collectthe agent log and contact IBM support.
KYNA0013E: The Application server connection connectionInfofailed: errorMessage
Explanation
The ITCAM for Application Diagnostics Tivoli Enterprise Monitoring Agentaccepted the incoming data collector connection but handshaking failed witherrors, the application server is not available for monitoring.
Operator response
Collect agent and data collector logs and contact IBM support.
KYNA0022E: Application server log scrapping stopped for theapplication server serverId with error: errorMsg.
Explanation
The ITCAM for Application Diagnostics Tivoli Enterprise Monitoring Agentstopped application server log scrapping for the specified application serverbecause errors were detected.
Operator response
Collect the agent and data collector logs and contact IBM support.
KYNA0024E: Take action tactId failed for the application serverserverId: tactReason.
Explanation
The ITCAM for Application Diagnostics Tivoli Enterprise Monitoring Agent failedto take action for the specified application server.
Operator response
Collect the agent and data collector logs and contact IBM support.
136 Application Performance Diagnostics: Application Performance Diagnostics Reference

KYNA0026E: Take sample table failed for application serverserverId: errorMsg.
Explanation
The ITCAM for Application Diagnostics Tivoli Enterprise Monitoring Agent failedto collect a sample for the specified application server.
Operator response
Collect the agent and data collector logs and contact IBM support.
KYNA0039E:Application dashboard monitoring failed to starton the application server serverId
Explanation
The monitoring agent failed to start application dashboard monitoring on thespecified application server.
Operator response
Collect the agent and data collector logs and contact IBM support.
KYNA0103E: Unsupported number cast in attribute attrNamewith type attrType from type actualType
Explanation
See message.
Operator response
See message.
KYNA0104E:Unsupported type cast in attribute attrName withtype attrType from type actualType.
Explanation
See message.
Operator response
See message.
KYNA0034E:Application appName baselining failed on theapplication server serverId.
Explanation
The monitoring agent detected baselining failure on the specified applicationserver.
Operator response
Collect the agent and data collector logs and contact IBM support.
Chapter 8. System Messages 137

KYND Messages: ITCAM for Application Diagnostics Secondary DataCollector
The following messages relate to the ITCAM for Application Diagnostics'ssecondary data collector (which accumulates WebSphere performance data andpasses it to the ITCAM for Application Diagnostics Tivoli Enterprise MonitoringAgent for processing). All such messages have IDs in the range KYND0000 toKYND0999.
KYND0001E: AgentConnection class initializer not able to loadnative library: Library Name
Explanation
The data collector was unable to load the specified native library. The datacollector cannot continue.
Operator response
Ensure that the specified native library is installed in the proper directory.
KYND0003E: Unable to write to MVS™ console - Console NameExplanation
Because of the specified Java exception, the data collector was unable to write amessage to the system console.
Operator response
Investigate the Java exception. If necessary, contact IBM support.
KYND0004E: Unable to check native library build levelbecause native library not available
Explanation
The data collector was unable to verify the compatibility of the native librarybecause the library was not locatable.
Operator response
Examine the installation log for errors during the installation of the data collector.
KYND0005E: Incompatibility detected between Java libraryJava Library and Native Library Native Library. Java library buildlevel is Java Library Level Native library build level is NativeLibrary Level
Explanation
During initialization, the data collector found that the build level of its Java JARfile is incompatible with the build level of its native library module. The datacollector cannot continue.
138 Application Performance Diagnostics: Application Performance Diagnostics Reference

Operator response
Examine the installation log for errors during the installation of the data collector.If maintenance was recently applied, ensure that all steps in the configurationprocess were completed successfully.
KYND0006E: Incompatibility detected between Native libraryNative Library and Java Library Java Library. Native library buildlevel is Native Library Level Java library build level is JavaLibrary Level
Explanation
During initialization, the data collector found that the build level of its nativelibrary module is incompatible with the build level of its Java JAR jar file. The datacollector cannot continue.
Operator response
Examine the installation log for errors during the installation of the data collector.If maintenance was recently applied, ensure that all steps in the configurationprocess were completed successfully.
KYND0007E: Error Error caught attempting to verify Nativelibrary compatibility
Explanation
An exception occurred when the data collector was attempting to verifycompatibility with the native library. The exact error is given by exception.
Operator response
Verify the installation log for errors during the installation of the data collector. Ifmaintenance was recently applied, ensure that all steps in the configuration processwere completed successfully.
KYND0008E: Unable to obtain current working directory -Working Directory
Explanation
A Java exception was caught trying to determine the name of the current workingdirectory.
Operator response
Contact IBM support.
KYND0011E: Data collector has caught exception Exceptionduring sample collection and communication
Explanation
A Java exception was caught in a sampling or transport thread belonging to thedata collector.
Chapter 8. System Messages 139

Operator response
Contact IBM support.
KYND0012E: The data collector has become disconnectedfrom the monitoring agent
Explanation
The data collector has lost its connection to the monitoring agent.
Operator response
Investigate the cause of the failure. This could be because the monitoring agent hasstopped running or has disconnected from the data collector for some reason. Ifnecessary, contact IBM support.
KYND0013E: Exception: Exception caught in DataGathererthread
Explanation
A Java exception was caught while attempting to collect data for transmission tothe monitoring agent. A stack trace is also written into the log.
Operator response
Contact IBM support.
KYND0014E: Exception: Exception caught processing Pollrequest
Explanation
A Java exception was caught while attempting to collect data for transmission tothe monitoring agent. A stack trace is also written into the log.
Operator response
Contact IBM support.
KYND0015E: Incompatible Agent build level detected. Actual =Actual Level Required = Required Level. Agent sessiondisconnected.
Explanation
The data collector discovered it was connecting to an older version of themonitoring agent, which is unsupported.
Operator response
Determine why the monitoring agent version is too old relative to the version ofthe data collector. If necessary, contact IBM support.
140 Application Performance Diagnostics: Application Performance Diagnostics Reference

KYND0022E: I/O error encountered writing log file Log FileExplanation
An I/O error was detected while writing to the data collector log file specified inthe message.
Operator response
Determine why the data collector cannot write to the log file.
KYND0023E: Unable to capture records for DD name Reason:Reason
Explanation
The data collector was requested to gather garbage-collection data, but it wasunable to trap verbose GC messages for the reason specified. The ddnameidentifies the DD statement from which messages are to be trapped.
Operator response
If Reason is No DEB, the WebSphere Application Server server does not have theSYSOUT DD statement open. Ensure that the SYSOUT DD statement is present inthe application server JCL and that the JVM_LOGFILE parameter is not specifiedin the current.env file for the application server. For any other reason, contact IBMsupport.
Chapter 8. System Messages 141

142 Application Performance Diagnostics: Application Performance Diagnostics Reference

Chapter 9. Glossary for Agent for WebSphere Applications
C
class file A file containing Java object code for a single Java class of objects.
class loader A Java component that loads Java object classes into the heap.
component In object-oriented programming environments like Java, a componentis a reusable program building block that can be combined with other componentsrunning on the same or different computers in a distributed network to form anapplication. Examples of a component include a single button in a graphical userinterface, an interface to a database manager, and an EJB. A component runswithin a container.
connection pool A group of host connections that are maintained in an initializedstate, ready to be used without having to create and initialize them.
container In the Enterprise JavaBeans (EJB) architecture, a container is anapplication program that executes the program building block known as acomponent (a JavaBean). You write a Java container (such as a GUI button or adatabase requester) that runs both prewritten and site-developed JavaBeans.Examples of containers include pages on a website as well as the web browsersthemselves.
contention In the database manager, a situation in which a transaction attempts tolock a row or table that is already locked.
CPU Central Processing Unit. The part of the computer that controls theinterpretation and execution of instructions.
D
data sources Data pertaining to JDBC data streams. These are logical connectionsto database subsystems.
DHCP Dynamic Host Configuration Protocol. A communications protocol that letsnetwork administrators centrally manage the assignment of Internet Protocol (IP)addresses across an organization network. Without DHCP, each computer IPaddress must be entered manually at each computer. If computers move to anotherlocation in another part of the network, a new IP address must be chosen. DHCPlets a network administrator supervise and distribute IP addresses from a centralpoint and automatically sends a new IP address when a computer is plugged intoa different location in the network.
dynamic cache A consolidation of several caching activities, including servlets,web services, and WebSphere commands into one service where these activitieswork together to improve performance and share configuration parameters.
E
EJB Enterprise Java Bean. A component architecture for the development anddeployment of object-oriented, distributed, enterprise-level applications.
© Copyright IBM Corp. 2013 143

Applications written using the Enterprise JavaBeans architecture are scalable,transactional, multi-user, and secure.
G
garbage collection A facility of the JVM that reallocates and frees up memory lostwhen objects are created and later destroyed. Garbage collection usually occurswhen insufficient heap space is available for allocating new objects, although youcan trigger it manually by invoking the System.gc method.
Garbage collection can be expensive since it involves identifying all theunreferenced objects, removing them from the heap, and then possibly compactingthe heap.
H
heap A memory storage area known formally as the System Resources area thatstores system information about running applications. The main storage area usedfor allocating Java classes and object instances, as well as executable code. Theallocation of objects on the heap creates a live or active object, which exists as longas the JVM maintains a pointer to it. When all references to an object cease to exist,it is subject to garbage collection.
HTTP Hypertext Transfer Protocol. A suite of protocols for the Internet thattransfer and display hypertext documents.
HTTP sessions Data related to sessions of specific World Wide Web browsers.
I
instrumentation The process of modifying program code so the time it takes thecode to run, along with other statistics, can be measured. These modificationsinsert hooks into these Java methods so that the real time and CPU time spentexecuting the methods can be measured. Instrumentation is key to certaindata-collection features (such as lock analysis) of WebSphere Application Server.
J
JEE Java Platform, Enterprise Edition. An environment for developing anddeploying enterprise applications using the Java language. The J2EE platformconsists of a set of services, application programming interfaces (APIs), andprotocols that provide the functions needed for developing multi-tiered, Web-basedapplications.
JAR file A Java archive file, which is a compressed file containing many class filesalong with their directory structure.
JavaBean The Java implementation of component-based software architecture,which defines how small, tested software entities called components can beintegrated to build complete software solutions (called containers).
JDBC Java Database Connectivity. An application programming interface (API) forconnecting Java programs to the data in a relational database. With this API, youcan encode data requests in Structured Query Language (SQL) that JDBC thenpasses to the database manager for interpretation and processing.
144 Application Performance Diagnostics: Application Performance Diagnostics Reference

JMS Java Message Service. A programming interface that connects Java programsto middleware messaging applications, for example, WebSphere MQ.
JMX Java Management Extensions. A standard technology for management andmonitoring of Java applications and Java environments that defines architecture,application programming interfaces (APIs), and services for application andnetwork management. JMX provides tools for building distributed, Web-basedsolutions for managing and monitoring Java devices and applications.
A JMX agent is an Mbean container.
JNDI Java Naming and Directory Interface. A programming interface that connectsJava applications to naming and directory servers such as LDAP.
JSP JavaServer Page. A web page that specifies one or more servlets whoseexecution on the web server modifies the page content or appearance before it ispresented to the user.
JVM Java virtual machine. A software implementation of a central processing unit(CPU) that runs Java applets and applications. The JVM provides a softwareexecution engine that safely and compatibly executes the byte codes in Java classfiles on various microprocessors, whether embedded in a computer or in anotherelectronic device.
JVMPI Java Virtual Machine Profiling Interface. An experimental interface thatprovides profiling hooks into the Java virtual machine. This interface supportstwo-way function calls between the JVM and a profiler agent: the virtual machinenotifies the agent of various events, and the agent issues requests for controlinformation.
M
MBeans Managed Beans. A set of standard instrumentation methods for use inJava programs and by Java management applications (such as WebSphereApplication Server) that allows monitoring and management of Java-basedapplications. An MBean is a JavaBean that represents a JMX-manageable resource.
monitor 1) A transaction environment for maintaining large quantities of data in aconsistent state and that controls which users and clients can access data throughauthorized servers. 2) A programming primitive created so multiple programthreads can share the same resource (such as an object). A program creates amonitor for a given resource by requesting it from the system; the system returns aunique ID for that monitor. After that, any thread needing the resource must usethe monitor to lock the resource while the thread is using it. If the monitor isalready locked, a thread requesting the resource is queued by the system and thengiven control when the monitor becomes unlocked. Also called a mutex.
N
node Any managed system, such as a WebSphere application server, that the TivoliEnterprise Portal is monitoring. A node can also be a managed system of subnodesbeing managed under a primary node.
Chapter 9. Glossary for Agent for WebSphere Applications 145

P
PMI Performance Monitoring Infrastructure. The application programminginterface (API) that IBM provides for extracting WebSphere application serverperformance data. PMI must be enabled and the appropriate instrumentation levelsset for the Tivoli Enterprise Monitoring Agent to extract PMI data and populatecertain workspaces. PMI runs as an interface to JMX.
portal A Web-based application that commonly provides personalization, singlesignon, and content aggregation from different sources, and hosts the presentationlayer of Information Systems (IS). Portals are becoming the next-generationdesktop, delivering ebusiness applications over the web to many types of clientdevices.
R
request The entry point into an application whose processing or response timedirectly affects the response time the end user perceives. In WebSphere ApplicationServer, a request is a servlet, JSP, or EJB method. Also called a transaction.
request analysis A configuration technique for a request (that is, a transaction)within WebSphere application server that allows you to see how often the requestruns and what factors about the request degrade its performance. Request analysisinvolves collecting and aggregating request data on each request that runs. Itsprimary purpose is to report on requests running in the application server, howoften they run, their response time, and what is causing performance degradation.
Request analysis works by dynamic object code instrumentation, which modifiesthe Java object code for the application classes as they are being loaded into theJVM.
RMI Remote Method Invocation. A Java standard from Sun Microsystems thatperforms a remote procedure call (RPC) to allow Java objects stored in the networkto be accessed remotely in a client/server environment.
RPC Remote Procedure Call. A protocol based on the Distributed ComputingEnvironment (DCE) of the Open Software Foundation that allows one program torequest services from a program running on another computer in a network. (Aprocedure call is also known as a function call or a subroutine call.) RPC uses theclient/server model: the requesting program is the client, and the respondingprogram is the server. As with a local procedure call, an RPC is a synchronousoperation: the requesting program is suspended until the remote procedure returnsits results.
S
servlet A Java application that runs in an application server or web server, andthat provides server-side processing.
session A series of requests to a servlet that originate from the same user at thesame browser. Sessions allow applications running in a web container to tracksindividual users.
SSL Secure Sockets Layer. A security protocol for communication privacy toprovide secure client-server conversations.
146 Application Performance Diagnostics: Application Performance Diagnostics Reference

T
thread A dispatchable unit of work.
thread pool The threads that are being used by or are available to a computerprogram.
transaction A single execution of a workload.
U
URI Uniform Resource Identifier. An identifier for a point of content on theInternet, be it a page of text, a video or sound clip, a still or animated image, or aprogram. The most common form of URI is the web page address, which is aparticular form of URI called a Universal Resource Locator (URL). A URI typicallydescribes the mechanism used to access the resource, the computer that houses theresource, and the name of the resource (such as a file name) on that computer.
URL Universal Resource Locator. The unique address for a file accessible via theInternet. Such a file might be a web page (usually the home page), an image file,or a program such as a Java applet or servlet. The URL comprises the protocolused to access the file, a domain name that identifies a specific computer on theInternet, and a path name that specifies the file location on that computer.
W
Web container A special J2EE container that manages web applications in a J2EEarchitecture. A web container specifies a runtime environment for webcomponents, including security, concurrency, lifecycle management, transaction,deployment, and other services. It also enables a web application to access externalresources such as relational databases (via JDBC) and Enterprise Java Beans. A webcontainer provides the same services as a JSP container and provides support formanaging JavaServer Pages.
Every J2EE server contains at least one web container.
Chapter 9. Glossary for Agent for WebSphere Applications 147

148 Application Performance Diagnostics: Application Performance Diagnostics Reference

Appendix. Accessibility
Accessibility features help users with physical disabilities, such as restrictedmobility or limited vision, to use software products successfully.
The accessibility features in the product enable users to:v Use assistive technologies, such as screen reader software and digital speech
synthesizers, to hear what is displayed on the screen. Consult the productdocumentation of the assistive technology for details on using the technologywith this product.
v Perform tasks with the software using only the keyboard.
General Navigation
Each page has four main sections:v Headerbarv Toolbarv Main tabsv Content
Each page has navigation points for screen readers. The following navigationpoints are all H1:v Title barv Main tabsv Main formv Section labelsv Table labels
Menu Navigation
You use the Go To menu to navigate to any of the applications that you haveaccess to. The Go To menu is a cascading menu that is three levels deep at itsdeepest point. The following instructions describe how to get started with JAWS:1. To get to the Go To menu press Alt+G.2. When you open the menu, JAWS reads the first application in the menu. If
JAWS does not begin to read the entry, restart the screen reader.3. Navigate the list of applications in the menus by using the arrow keys.4. JAWS indicates if a menu item has submenus. To get to a submenu, press the
right arrow or enter.5. Press the left arrow to move up a level in the hierarchy. If you press the left
arrow at the highest level of the Go To menu, you leave the menu completely.6. Press the Enter key to enter an application.
Accessibility help
The Accessibility Help panels provide details on general navigation, menunavigation, and hot keys. Click Accessibility Help from the toolbar of the productto access the help panels.
© Copyright IBM Corp. 2013 149

Screen reader setting
The product contains a screen reader flag. When you turn on the screen readerflag, the user interface is optimized to work with JAWS for Windows®. You use theUser tab in the Users application to turn on the screen reader flag.
Keyboard shortcuts
You can navigate within the applications by using a combination of keys.
Accessible reports
To use the accessibility tools to read reports, you must access the reports inMicrosoft Excel. In the reports applications, select the Run Reports option in theSelect Action menu. With this option, you can email an .xls file version of a reportto yourself at a scheduled time.
IBM and accessibility
For more information about the commitment that IBM has to accessibility, see theIBM Human Ability and Accessibility Center. The IBM Human Ability andAccessibility Center is at the following web address: http://www.ibm.com/able
150 Application Performance Diagnostics: Application Performance Diagnostics Reference

Index
Special characters[Summary] - Average Local Wait Time
(Last 24 Hours) group widget 31[Summary] - Expired Messages (Last 24
Hours) group widget 32[Summary] - Incomplete Topic
Publications (Last 24 Hours) groupwidget 32
[Summary] - Total Published (Last 24Hours) group widget 33
[Summary] Pool Used (Last 24 Hours)group widget 41
[Thread Pool] - Average Pool Size (Last24 Hours) group widget 45
[Thread Pool] Usage (Last 24 Hours)group widget 43
Aaccessibility xAverage Thread Pool Usage group
widget 43
Bbooks ixBusiest DB Connection Pools (Last 2
Hours) group widget 21Busiest Thread Pools (Last 2 Hours)
group widget 21
CContainer Object Pools (Last 24 Hours)
group widget 28Container Transactions group widget 28conventions
typeface xii
Ddashboard
WebSphere ApplicationsDB Connection Pools
dashboard 41EJB Container - Detail
dashboard 24, 26JVM GC dashboard 38Log Messages dashboard 45Messaging Engines dashboard 31Request Instances dashboard 50Request Sequence dashboard 53Request Summary dashboard 46Thread Pools - Detail
dashboard 43WAS dashboard 17Web Applications dashboard 36Web Services dashboard 34
dashboard (continued)WebSphere Applications (continued)
WebSphere Application Serversdashboard 56
dashboards 46Dashboards 15Data Collector installation and
configuration utility messages 91Data Collector messages 122, 138DB Connection Pools dashboard 41DB Connection Pools group widget 42DB Connection Pools with Highest
Allocation Rate group widget 42DB Connection Pools with Highest Wait
Time group widget 41DC_home xiidirectories, variables for xii
Eeducation
See Tivoli technical trainingEJB Container (Last 2 Hours) group
widget 23EJB Container dashboard 24, 26EJB Containers (Last 2 Hours) group
widget 27Enterprise Java Beans group widget 30
GGarbage Collection Analysis group
widget 40GC Count and GC Duration (Last 2
Hours) group widget 39group widgets
Slowest Web Applications (Last 2Hours) from PMI
Web Applications groupwidget 22
WebSphere Applications[Summary] - Average Local Wait
Time (Last 24 Hours) groupwidget 31
[Summary] - Expired Messages(Last 24 Hours) groupwidget 32
[Summary] - Incomplete TopicPublications (Last 24 Hours)group widget 32
[Summary] - Total Published (Last24 Hours) group widget 33
[Summary] Pool Used (Last 24Hours) group widget 41
[Thread Pool] - Average Pool Size(Last 24 Hours) groupwidget 45
[Thread Pool] Usage (Last 24Hours) group widget 43
group widgets (continued)WebSphere Applications (continued)
Average Thread Pool Usage groupwidget 43
Busiest DB Connection Pools (Last2 Hours) group widget 21
Busiest Thread Pools (Last 2Hours) group widget 21
Container Object Pools (Last 24Hours) group widget 28
Container Transactions groupwidgets 28
DB Connection Pools groupwidget 42
DB Connection Pools with HighestAllocation Rate groupwidget 42
DB Connection Pools with HighestWait Time group widget 41
EJB Container (Last 2 Hours)group widget 23
EJB Containers (Last 2 Hours)group widget 27
Enterprise Java Beansgroupwidget 30
Garbage Collection Analysis groupwidget 40
GC Count and GC Duration (Last2 Hours) group widget 39
Heap Usage (Last 24 Hours) groupwidget 39
JVM CPU Usage (Last 24 Hours)group widget 38
JVM GC (Last 2 Hours) groupwidget 20
Log Messages group widget 23,45
Messaging Engines groupwidget 33
Request - [Request Name] (Last 24Hours) group widget 26
Request Context groupwidget 52, 55
Request Instances groupwidget 50
Request Sequence groupwidget 53
Request Stack Trace groupwidget 52, 55
Request Summary groupwidget 47
Requests - [Application] groupwidget 25
Requests with Slowest ResponseTime group widget 18
Response Time Breakdown groupwidget 49
Response Time Distribution groupwidget 49
© Copyright IBM Corp. 2013 151

group widgets (continued)WebSphere Applications (continued)
Servlet/JSP (Last 24 Hours) -[Servlet/JSP Name] groupwidget 37
Servlets/JSPs - [Application] groupwidget 37
Slowest Messaging Engines (Last 2Hours) 24
Slowest Request Response Timeson WebSphere ApplicationServers - [Transaction] groupwidget 58
Slowest Request Response Timeson WebSphere ApplicationServers - All Requests groupwidget 56
Slowest Web Services (Last 2Hours) group widget 22
Thread Pools group widget 44WAS Information group
widget 19WAS Status group widget 15Web Applications (Last 24 Hours) -
[Application] group widget 36Web Service (Last 24 Hours) -
[Service] group widget 35Web Services Gateway group
widgets 36Web Services group widget 35WebSphere Applications (Last 24
Hours) - [Application] groupwidget 25
WebSphere Applications groupwidget 19
HHeap Usage (Last 24 Hours) group
widget 39
JJVM CPU Usage (Last 24 Hours) group
widget 38JVM GC (Last 2 Hours) group
widget 20JVM GC dashboard 38
KKYNA messages 135KYND messages 138
LLog Messages dashboard 45Log Messages group widget 23, 45
Mmanuals ixMessaging Engines group widget 33Messaging Enginesdashboard 31
OOperational monitoring dashboards 15ordering publications x
Ppublications ix
ordering x
Rreader requirements ixRequest - [Request Name] (Last 24
Hours) group widget 26Request Context group widget 52, 55Request Instances dashboard 50Request Instances group widget 50Request Sequence dashboard 53Request Sequence group widget 53Request Stack Trace group widget 52, 55Request Summary dashboard 46Request Summary group widget 47Requests - [Application] group
widget 25Requests with Slowest Response Time
group widget 18requirements for readers ixResponse Time Breakdown group
widget 49Response Time Distribution group
widget 49
Sservice xiservice management connect xiServlet/JSP (Last 24 Hours) - [Servlet/JSP
Name] group widget 37Servlets/JSPs - [Application] group
widget 37Slowest Messaging Engines (Last 2
Hours) group widget 24Slowest Request Response Times on
WebSphere Application Servers -[Transaction] group widget 58
Slowest Request Response Times onWebSphere Application Servers - AllRequests group widget 56
Slowest Web Applications (Last 2 Hours)from PMI group widget 22
Slowest Web Services (Last 2 Hours)group widget 22
SMC xiStatus Overview 15support xi
Ttab
WebSphere ApplicationsStatus Overview 15
Thread Pools - Detail dashboard 43Thread Pools group widget 44Throughput and Average Response Time
(Last 24 Hours) group widget 39
Tivoli Enterprise Tivoli EnterpriseMonitoring Agent messages 135
Tivoli technical training xiTivoli user groups xitraining, Tivoli technical xitypeface conventions xii
Uuser groups, Tivoli xi
Vvariables for directories xii
WWAS dashboard 17WAS Information group widget 19WAS Status group widget 15Web Applications (Last 24 Hours) -
[Application] group widget 36Web Applications dashboard 36Web Service (Last 24 Hours) - [Service]
group widget 35Web Services 35Web Services dashboard 34Web Services Gateway group
widgets 36WebSphere Application Servers
dashboard 56WebSphere Applications (Last 24 Hours) -
[Application] group widget 25WebSphere Applications group
widget 19widgets
WebSphere ApplicationsThroughput and Average Response
Time (Last 24 Hours) groupwidget 39
152 Application Performance Diagnostics: Application Performance Diagnostics Reference

Trademarks
IBM, the IBM logo, and ibm.com are trademarks or registered trademarks ofInternational Business Machines Corp., registered in many jurisdictions worldwide.Other product and service names might be trademarks of IBM or other companies.A current list of IBM trademarks is available on the web at “Copyright andtrademark information” at http://www.ibm.com/legal/copytrade.shtml.
Adobe and all Adobe-based trademarks are either registered trademarks ortrademarks of Adobe Systems Incorporated in the United States, other countries, orboth.
Linux is a trademark of Linus Torvalds in the United States, other countries, orboth.
Microsoft, Windows, and the Windows logo are trademarks of MicrosoftCorporation in the United States, other countries, or both.
UNIX is a registered trademark of The Open Group in the United States and othercountries.
Java and all Java-based trademarks and logos are trademarks or registeredtrademarks of Oracle and/or its affiliates. or
Java and all Java-based trademarks and logos are trademarks or registeredtrademarks of Oracle and/or its affiliates.
© Copyright IBM Corp. 2013 153

154 Application Performance Diagnostics: Application Performance Diagnostics Reference

Notices
This information was developed for products and services offered in the U.S.A.IBM may not offer the products, services, or features discussed in this document inother countries. Consult your local IBM representative for information on theproducts and services currently available in your area. Any reference to an IBMproduct, program, or service is not intended to state or imply that only that IBMproduct, program, or service may be used. Any functionally equivalent product,program, or service that does not infringe any IBM intellectual property right maybe used instead. However, it is the user's responsibility to evaluate and verify theoperation of any non-IBM product, program, or service.
IBM may have patents or pending patent applications covering subject matterdescribed in this document. The furnishing of this document does not give youany license to these patents. You can send license inquiries, in writing, to:
IBM Director of LicensingIBM CorporationNorth Castle DriveArmonk, NY 10504-1785 U.S.A.
For license inquiries regarding double-byte (DBCS) information, contact the IBMIntellectual Property Department in your country or send inquiries, in writing, to:
Intellectual Property LicensingLegal and Intellectual Property LawIBM Japan, Ltd.19-21, Nihonbashi-Hakozakicho, Chuo-kuTokyo 103-8510, Japan
The following paragraph does not apply to the United Kingdom or any othercountry where such provisions are inconsistent with local law:
INTERNATIONAL BUSINESS MACHINES CORPORATION PROVIDES THISPUBLICATION "AS IS" WITHOUT WARRANTY OF ANY KIND, EITHEREXPRESS OR IMPLIED, INCLUDING, BUT NOT LIMITED TO, THE IMPLIEDWARRANTIES OF NON-INFRINGEMENT, MERCHANTABILITY OR FITNESSFOR A PARTICULAR PURPOSE.
Some states do not allow disclaimer of express or implied warranties in certaintransactions, therefore, this statement might not apply to you.
This information could include technical inaccuracies or typographical errors.Changes are periodically made to the information herein; these changes will beincorporated in new editions of the publication. IBM may make improvementsand/or changes in the product(s) and/or the program(s) described in thispublication at any time without notice.
Any references in this information to non-IBM Web sites are provided forconvenience only and do not in any manner serve as an endorsement of those Websites. The materials at those Web sites are not part of the materials for this IBMproduct and use of those Web sites is at your own risk.
© Copyright IBM Corp. 2013 155

IBM may use or distribute any of the information you supply in any way itbelieves appropriate without incurring any obligation to you.
Licensees of this program who wish to have information about it for the purposeof enabling: (i) the exchange of information between independently createdprograms and other programs (including this one) and (ii) the mutual use of theinformation which has been exchanged, should contact:
IBM Corporation2Z4A/10111400 Burnet RoadAustin, TX 78758 U.S.A.
Such information may be available, subject to appropriate terms and conditions,including in some cases payment of a fee.
The licensed program described in this document and all licensed materialavailable for it are provided by IBM under terms of the IBM Customer Agreement,IBM International Program License Agreement or any equivalent agreementbetween us.
Information concerning non-IBM products was obtained from the suppliers ofthose products, their published announcements or other publicly available sources.IBM has not tested those products and cannot confirm the accuracy ofperformance, compatibility or any other claims related to non-IBM products.Questions on the capabilities of non-IBM products should be addressed to thesuppliers of those products.
This information contains examples of data and reports used in daily businessoperations. To illustrate them as completely as possible, the examples include thenames of individuals, companies, brands, and products. All of these names arefictitious and any similarity to the names and addresses used by an actual businessenterprise is entirely coincidental.
156 Application Performance Diagnostics: Application Performance Diagnostics Reference


����
Printed in USA


![Identification and Quantification of Diagnostics Markers ...[application note] IdentIfIcatIon and QuantIfIcatIon of dIagnostIcs Markers and Pathway nalysa Is for gaucher dIsease by](https://img.pdfslide.net/doc/110x75/5e9de20087ab3c412108b6a5/identification-and-quantification-of-diagnostics-markers-application-note.jpg)