Embed Size (px)
Citation preview
Tunnel and Bridge AssessmentsCentral ZoneVauxhall Road BridgeDoc Ref: 9.15.56
Folder 101 September 2013DCO-DT-000-ZZZZZ-091500
Vaux
hall
Road
Brid
ge
Thames Tideway Tunnel Thames Water Utilities Limited
Application for Development ConsentApplication Reference Number: WWO10001

CONFIDENTIAL
Vauxhall Bridge - Assessment Report 315-RG-TPI-BR010-000001 Revision - AF Date approved -
i Printed 26/10/2012
Thames Tunnel
Assessment Report – Vauxhall Road Bridge
List of contents
Page number
1 Executive Summary ......................................................................................... 1
2 Introduction ...................................................................................................... 3
2.1 Scope ...................................................................................................... 3
2.2 Utilities ..................................................................................................... 3
2.3 Third Party Interfaces .............................................................................. 4
3 Structure Description ...................................................................................... 5
3.2 Structural Type ........................................................................................ 6
3.3 Foundation Type ...................................................................................... 6
3.4 Span Arrangements ................................................................................. 6
3.5 Articulation Arrangements ....................................................................... 6
3.6 Road Restraint system type..................................................................... 6
4 Background to Assessment ............................................................................ 7
4.1 Previous Assessment Summary .............................................................. 7
4.2 Current Weight Restrictions ..................................................................... 7
4.3 Monitoring ................................................................................................ 7
4.4 Inspection for Assessment....................................................................... 7
5 Assessment Method ........................................................................................ 9
5.1 General .................................................................................................... 9
5.2 Material Properties .................................................................................. 9
5.3 Loading .................................................................................................... 9
5.4 Structural Analysis ................................................................................. 10
5.5 Assessment Criteria .............................................................................. 11
6 Assessment Results ...................................................................................... 12
6.1 Summary of Results .............................................................................. 12
6.2 Thames Tunnel Results ......................................................................... 12
6.3 Combined Thames Tunnel and CSO Results ........................................ 17
6.4 Deck Movement at Supports ................................................................. 22
6.5 Utilities Movement at Supports .............................................................. 22
6.6 Assessment Results Discussion ............................................................ 23
6.7 Cat II Check ........................................................................................... 28

CONFIDENTIAL
Vauxhall Bridge - Assessment Report 315-RG-TPI-BR010-000001 Revision - AF Date approved -
ii Printed 26/10/2012
7 Mitigation Measures/Additional Work Recommendations ......................... 29
7.1 General .................................................................................................. 29
7.2 Substructure .......................................................................................... 29
7.3 Superstructure ....................................................................................... 29
7.4 Expansion Joints and Bearings ............................................................. 30
Bibliography ............................................................................................................ 31
Glossary .................................................................................................................. 32
Appendices ............................................................................................................. 33
Appendix A – Load Summary ................................................................................ 35
Appendix B – Models ............................................................................................. 44
Appendix C – Geotechnical Assessment Results (Thames Tunnel) .................. 46
Appendix D – Geotechnical Assessment Results (CSO Interception) ............... 56
Appendix E – Settlement Summary ...................................................................... 81
Appendix F – Cat II Check Results & Comparison .............................................. 82
Appendix G – Settlement Drawing ........................................................................ 85
CONFIDENTIAL
Vauxhall Bridge - Assessment Report 315-RG-TPI-BR010-000001 Revision - AF Date approved -
iii Printed 26/10/2012
List of figures
Page number
None
List of tables
Page number
Table 2.1 Summary of Utilities affected by settlement of bridge ................................ 3
Table 6.1 Thames Tunnel Assessment Results – Outer Arch ................................. 12
Table 6.2 Thames Tunnel Assessment Results – Inner Arch .................................. 13
Table 6.3 Thames Tunnel Assessment Results – 10"x6"x42lbs .............................. 13
Table 6.4 Thames Tunnel Assessment Results – 3.5"x3.5"x7/16" .......................... 13
Table 6.5 Thames Tunnel Assessment Results – 8"x6"x35lbs ................................ 14
Table 6.6 Thames Tunnel Assessment Results – 12"x6"x52lbs .............................. 14
Table 6.7 Thames Tunnel Assessment Results – 18"x7"x78lbs .............................. 14
Table 6.8 Thames Tunnel Assessment Results – Cross Beam 1 ............................ 15
Table 6.9 Thames Tunnel Assessment Results – Cross Beam 2 ............................ 15
Table 6.10 Thames Tunnel Assessment Results – Cross Bracing 1 ....................... 16
Table 6.11 Thames Tunnel Assessment Results – Cross Bracing 2 ....................... 16
Table 6.12 Combined Assessment Results – Outer Arch ........................................ 17
Table 6.13 Combined Assessment Results – Inner Arch ........................................ 17
Table 6.14 Combined Assessment Results – 10"x6"x42lbs .................................... 18
Table 6.15 Combined Assessment Results – 3.5"x3.5"x7/16" ................................. 18
Table 6.16 Combined Assessment Results – 8”x6”x35lbs ...................................... 18
Table 6.17 Combined Assessment Results – 12"x6"x52lbs .................................... 19
Table 6.18 Combined Assessment Results – 18"x7"x78lbs .................................... 19
Table 6.19 Combined Assessment Results – Cross Beam 1 .................................. 20
Table 6.20 Combined Assessment Results – Cross Beam 2 .................................. 20
Table 6.21 Combined Assessment Results – Cross Bracing 1 ................................ 21
Table 6.22 Combined Assessment Results – Cross Bracing 2 ................................ 21
Table 6.23 Displacement Summary at Deck Level .................................................. 22
Table 6.24 Longitudinal Displacements ................................................................... 22
Table 6.25 Transverse Displacements .................................................................... 22
Table 6.26 Shore Span Further Assessment Results – 12"x6"x52lbs ..................... 24
Table 6.27 Intermediate Span Further Assessment Results – 12"x6"x52lbs ........... 24
Table 6.28 Centre Span Further Assessment Results – 12"x6"x52lbs .................... 24
Table 6.29 Shore Span Further Assessment Results – 10"x6"x42lbs ..................... 25
CONFIDENTIAL
Vauxhall Bridge - Assessment Report 315-RG-TPI-BR010-000001 Revision - AF Date approved -
iv Printed 26/10/2012
Table 6.30 Intermediate Span Further Assessment Results – 10"x6"x42lbs ........... 25
Table 6.31 Centre Span Further Assessment Results – 10"x6"x42lbs .................... 25
Table 6.32 Further Assessment Results – 3.5"x3.5"x7/16" ..................................... 26
Table 6.33 Combined Assessment Results – Cross Bracing 1 ................................ 27
Table 6.34 Combined Assessment Results – Cross Bracing 2 ................................ 27
List of abbreviations
AIP Approval in Principle
CSO Combined Sewer Overflow
1 Executive Summary
Vauxhall Bridge - Assessment Report 315-RG-TPI-BR010-000001 Revision - AF Date approved -
Page 1 Uncontrolled when printed Printed 26/10/2012
CONFIDENTIAL
1 Executive Summary
1.1.1 This document sets out the results of the detailed assessment of Vauxhall Road Bridge.
1.1.2 The assessment was carried out to assess the structural adequacy of the bridge to resist the predicted ground settlement due to the construction of the Thames Tunnel. Assessment has also been carried out to investigate the effects of constructing the proposed Combined Sewer Outflow (CSO) Interception works in the vicinity of the south abutment.
1.1.3 The initial stage of analysis determined structural adequacy using the results from the previous assessment completed by Parkman Buck Limited in 1994 in combination with the results from the analysis for differential settlement due to the tunnel construction and CSO Interception works. The structure was generally found to be adequate where settlement/rotation loads were added to the previous assessment findings with usage factors found to be less than 1.0.
1.1.4 For members that were not considered in the previous Parkman Buck 1994 assessment, the percentage increase in the usage was reported based on the calculated resistance of the member. As the previous assessment loading on these members was not considered, it is not possible to quantify the total increase in the load effects on the member within the scope of this assessment.
1.1.5 For the Cross Beams the percentage increase in the load relative to the section resistance is less than 2.5%. On this basis, the load increase is considered to be small, and the section can be assumed to be adequate.
1.1.6 For the 18"x7"x78lbs outer beam, the previous loads were not reported. However, they are assumed to be similar to those on the inner beams, where the loading has been reported. On this basis, the usage on this section can be assumed to be adequate.
1.1.7 Where members were identified as inadequate during this initial stage of analysis further assessment, including application of permanent and live load has been undertaken. The scope of the further assessment does not allow for consideration of these permanent and live loads on the members shown to pass using the previous 1994 Parkman Buck assessment.
1.1.8 The further assessment indicates that the 3.5"x3.5"x7/16" bracing connection is already deficient without the application of the settlement/rotation effects. This finding was not reported within the Parkman Buck 1994 assessment as no analysis was undertaken for these members within the 2 dimensional line beam and plane frame models. This detail should be inspected to determine whether there is any evidence of failure currently. Strengthening of the rivets forming the connection may be necessary, which can be undertaken by replacing existing rivets with high strength bolts. No strengthening of the bracing members themselves is considered necessary.

1 Executive Summary
Vauxhall Bridge - Assessment Report 315-RG-TPI-BR010-000001 Revision - AF Date approved -
Page 2 Uncontrolled when printed Printed 26/10/2012
CONFIDENTIAL
1.1.9 All other aspects of the structure were found to be adequate where settlement/rotations loads were added to the coexistent permanent and live load with usage factors less than 1.0.
1.1.10 For the 10"x6"x42lbs vertical members the further assessment work has shown that the maximum usage factor is 1.03, which can be considered adequate, subject to agreement of the asset owner. This is due to the conservative assumptions made within the assessment of the structure both within the geotechnical and structural analysis. The geotechnical assessment of movement at the bridge supports has been undertaken assuming a Greenfield Settlement Trough develops. In reality the lateral stiffness of the structure would reduce the anticipated lateral pier deflections and resulting rotations, consequently reducing the stresses within the bridge members. Considering a full soil-structure interaction would lead to a reduction in the differential settlement values observed at the bridge supports. The structural analysis has been undertaken using strength values specified within BD 21/01 to which a partial factor is applied. These values are considered to represent a conservative lower bound threshold for this material. The 1.03 usage factor falls within the 5% allowable stress increase considered within stage 1 of the assessment.
1.1.11 It is recommended that the deck expansion joints, rubber bearings and sliding plates under longitudinal beams are investigated prior to construction of the tunnel. This is to ensure that the bearings/joints have not locked up. The investigation should also consider whether there is sufficient movement range available to allow for the additional movement due to the tunnel construction as well as the predicted temperature movement.
2 Introduction
Vauxhall Bridge - Assessment Report 315-RG-TPI-BR010-000001 Revision - AF Date approved -
Page 3 Uncontrolled when printed Printed 26/10/2012
CONFIDENTIAL
2 Introduction
2.1 Scope
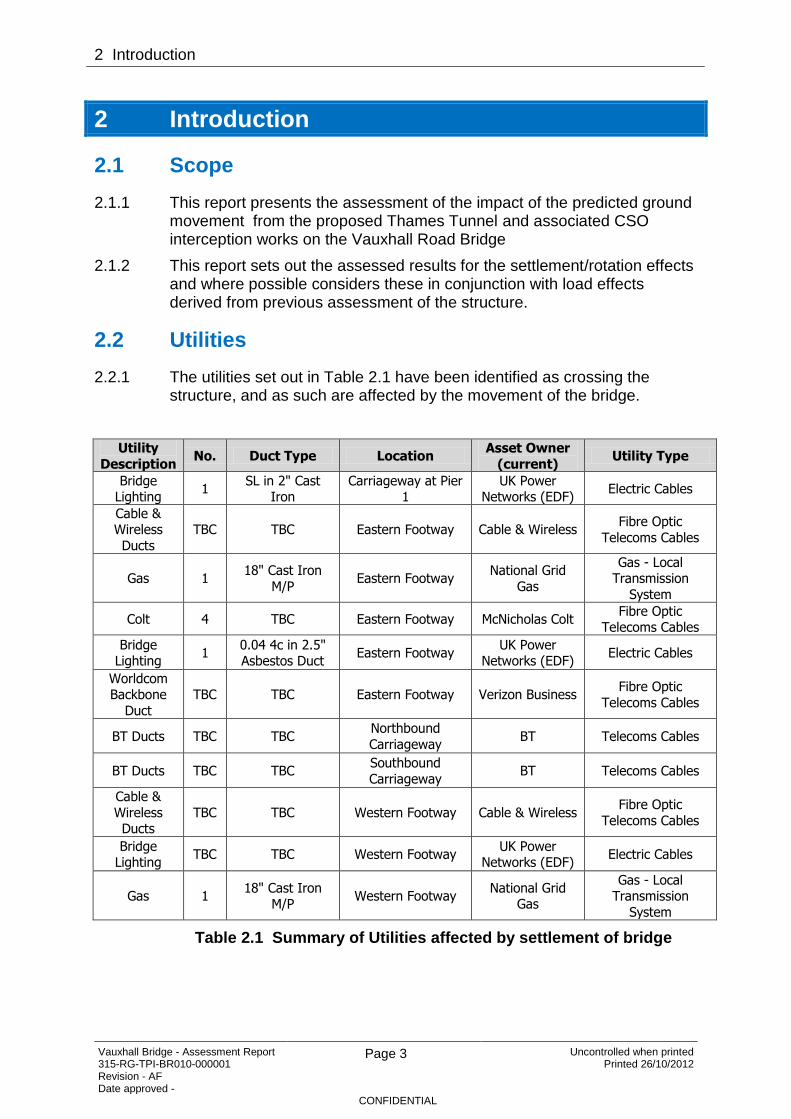
2.1.1 This report presents the assessment of the impact of the predicted ground movement from the proposed Thames Tunnel and associated CSO interception works on the Vauxhall Road Bridge
2.1.2 This report sets out the assessed results for the settlement/rotation effects and where possible considers these in conjunction with load effects derived from previous assessment of the structure.
2.2 Utilities
2.2.1 The utilities set out in Table 2.1 have been identified as crossing the structure, and as such are affected by the movement of the bridge.
Utility
Description No. Duct Type Location
Asset Owner
(current) Utility Type
Bridge Lighting
1 SL in 2" Cast
Iron Carriageway at Pier
1 UK Power
Networks (EDF) Electric Cables
Cable & Wireless
Ducts
TBC TBC Eastern Footway Cable & Wireless Fibre Optic
Telecoms Cables
Gas 1 18" Cast Iron
M/P Eastern Footway
National Grid
Gas
Gas - Local Transmission
System
Colt 4 TBC Eastern Footway McNicholas Colt Fibre Optic
Telecoms Cables
Bridge Lighting
1 0.04 4c in 2.5" Asbestos Duct
Eastern Footway UK Power
Networks (EDF) Electric Cables
Worldcom Backbone
Duct
TBC TBC Eastern Footway Verizon Business Fibre Optic
Telecoms Cables
BT Ducts TBC TBC Northbound
Carriageway BT Telecoms Cables
BT Ducts TBC TBC Southbound
Carriageway BT Telecoms Cables
Cable &
Wireless Ducts
TBC TBC Western Footway Cable & Wireless Fibre Optic
Telecoms Cables
Bridge Lighting
TBC TBC Western Footway UK Power
Networks (EDF) Electric Cables
Gas 1 18" Cast Iron
M/P Western Footway
National Grid Gas
Gas - Local Transmission
System
Table 2.1 Summary of Utilities affected by settlement of bridge

2 Introduction
Vauxhall Bridge - Assessment Report 315-RG-TPI-BR010-000001 Revision - AF Date approved -
Page 4 Uncontrolled when printed Printed 26/10/2012
CONFIDENTIAL
2.3 Third Party Interfaces
2.3.1 A meeting was held on 30/06/11 with representatives from TfL to agree the AIP. The contents of the AIP were agreed at this meeting, with only minor amendments to the original version of the AIP.

3 Structure Description
Vauxhall Bridge - Assessment Report 315-RG-TPI-BR010-000001 Revision - AF Date approved -
Page 5 Uncontrolled when printed Printed 26/10/2012
CONFIDENTIAL
3 Structure Description
3.1.1 The current Vauxhall Bridge was designed by Sir Alexander Binnie. It was constructed between 1898 and 1906 and is located between Lambeth Bridge and Grosvenor Bridge.
3.1.2 Vauxhall Bridge is a five span steel arch bridge carrying the A202 Vauxhall Bridge Road over the River Thames in Central London and links Vauxhall Cross with Pimlico.
3.1.3 The width of the structure between parapets is 24.4m with footways of approx 2.65m wide. The structure has 4 lanes of traffic, 2 in each direction, plus 2 bus lanes, again 1 in each direction and one cycle lane.
3.1.4 The deck is formed from flat steel plates overlaid by a mass concrete slab and protected with bituminous waterproofing below the asphalt carriageway surface. Concrete paving slabs cover the footways. The carriageway has a transverse crossfall to facilitate drainage and gullies are positioned along the entire length of the structure to collect and drain the carriageway.
3.1.5 The main deck is supported on cross beams which are themselves supported on the main longitudinal members. The longitudinal members are supported on spandrel columns which stem from the arch ribs.
3.1.6 The ribs forming the arch span are spaced at 1.97m centres which support the spandrel column locations, which are at 3.15m centres. The outer ribs support the footway and 11No inner ribs support the carriageway (there are a total number of 13 arch ribs per span). The outer ribs are shallower in depth than the inner ribs supporting the roadway. The inner ribs also vary in cross section along their span. All the ribs and spandrel columns are cross braced vertically. There are several other cross members used in the structure, deck cross beams, spandrel vertical cross bracing, diagonal wind bracing and rib vertical cross bracing which make up the structure.
3.1.7 The structure is supported by four piers and two abutments which comprise granite face concrete chambers founded on steel caissons filled with concrete. The Westminster abutment is also supported by a series of piles.
3.1.8 Knuckle pin bearings are located at the ends of the arch ribs. The longitudinal beams are supported on rubber pad bearings at the abutment location. Sliding plates are used within the deck expansion joints.
3.1.9 There are 10 expansion joints, 2 are located at each of the piers and 1 at each abutment. This structure has a history of problems with the expansion joints and refurbishment work was carried out on the joints in 2002. New joints were installed between 1987 and 1994, the deck modifications around the joints are unknown.
3.1.10 The bridge was assessed in 1994 and was found to have adequate capacity for 40 tonne loading in accordance with BD 21/93.

3 Structure Description
Vauxhall Bridge - Assessment Report 315-RG-TPI-BR010-000001 Revision - AF Date approved -
Page 6 Uncontrolled when printed Printed 26/10/2012
CONFIDENTIAL
3.1.11 The footways were widened in 1972-1973 and comprise precast concrete cover slabs on the kerb side laid transversely, with steel plates at expansion joints, and paving slabs on the parapet side laid in a regular bonding pattern.
3.2 Structural Type
3.2.1 Each of the five spans consists of steel arches pinned at the supports (pier/abutment). The horizontal deck member is supported vertically at the piers on sliding plates at the intermediate piers and by elastomeric bearings at the abutment.
3.3 Foundation Type
3.3.1 The foundations for the piers and abutments consist of mass concrete caissons.
3.4 Span Arrangements
3.4.1 The bridge is symmetrical about its centre line with spans of 42.04m, 48.64m, 50.40m, 48.64m and 42.04m. The total structure length is 231.76m.
3.5 Articulation Arrangements
3.5.1 The arch ribs are supported by pin bearings at the intermediate piers and abutments. The deck is supported on elastomeric bearings at the abutment and sliding plates at the intermediate piers. These support the structure vertically, but allow movement in the longitudinal direction. There is an expansion joint on each side to the intermediate piers and at each abutment.
3.6 Road Restraint system type
3.6.1 The road restraint system consists of steel parapets. The containment type is unknown.

4 Background to Assessment
Vauxhall Bridge - Assessment Report 315-RG-TPI-BR010-000001 Revision - AF Date approved -
Page 7 Uncontrolled when printed Printed 26/10/2012
CONFIDENTIAL
4 Background to Assessment
4.1 Previous Assessment Summary
4.1.1 The bridge was previously assessed using BD 21/93 for the assessment loading and BS 5400-3:1982 for the structural adequacy. This assessment was completed by Parkman Buck Limited in 1994.
4.1.2 The assessment considered the structure as a series of 2 dimensional line beam and plane frame models. Some items such as bracing and cross beams were not assessed. Only the central span of the bridge was assessed. The reasons for this are not stated, but it is assumed that this was due to the similarity in construction and member sizes between the different spans. As the central span is the longest, it is also likely to have the most onerous loading applied to it.
4.1.3 The previous assessment reported that the structure was adequate under full 40 tonne assessment live loading. The flat deck plates were reported to not meet the 40 tonne assessment loading when considered in isolation. However, when considered acting compositely with the slab, these were found to be adequate.
4.1.4 A review of the previous calculations also found that overstresses were found on the inner longitudinal deck beams (12”x6”x52 lbs sections) which were overstressed by a factor of 1.02 for shear and 1.18 for bending when considering the maximum single axle loading. The combination for HA+KEL was found to be adequate.
4.1.5 The assessment calculations do not generally allow for combined bending and axial forces and combined bending and shear. It is not clear from the calculations why this was not considered.
4.1.6 Only the main pin connection at the face of the piers was checked. No checks were completed on the riveted connections.
4.2 Current Weight Restrictions
4.2.1 Vauxhall Bridge has an assessment live load capacity of 40 Tonnes.
4.3 Monitoring
4.3.1 There is currently no monitoring present on the structure
4.4 Inspection for Assessment
4.4.1 As part of the assessment process, an inspection for assessment was carried out. This was done in order to identify any items/problems that needed to be taken into account during the assessment. These findings are recorded in 315-RI-TPI-BR010-000001-AE Vauxhall Bridge. A condition factor of 1.0 was recommended for all elements of the structure. However, based on the corrosion noted in a previous principal inspection
4 Background to Assessment
Vauxhall Bridge - Assessment Report 315-RG-TPI-BR010-000001 Revision - AF Date approved -
Page 8 Uncontrolled when printed Printed 26/10/2012
CONFIDENTIAL
report (see Inspection for Assessment report for details) and the potential impact this might have on the structure unless maintenance is carried out, a sensitivity analysis was made during the assessment of the effects of reducing the condition factor on the bracing.

5 Assessment Method
Vauxhall Bridge - Assessment Report 315-RG-TPI-BR010-000001 Revision - AF Date approved -
Page 9 Uncontrolled when printed Printed 26/10/2012
CONFIDENTIAL
5 Assessment Method
5.1 General
5.1.1 The structure was assessed to determine the impacts of constructing the Thames Tunnel and associated CSO interception works beneath the structure. The construction has the potential to cause settlement/rotations at the supports depending on the proximity of the abutment/pier to the tunnel, amongst other factors. These ground movements could potentially lead to differential settlement between the different piers thereby impacting on the integrity of the structure.
5.1.2 The differential settlement was quantified as part of the geotechnical assessment outlined in Appendix C.
5.1.3 The deck structure was assessed quantitatively for the impacts of the expected settlements/rotations from the tunnel construction and CSO interception works. The substructure, including the piers/abutments and the foundations were assessed qualitatively.
5.1.4 Movements/rotations at the supports caused by the settlement were also assessed as this will affect the existing expansion joints and bearings.
5.1.5 As stated in the AIP, the assessment is for the differential load effects arising from predicted ground movements due to tunnel construction. Therefore, only the derivation of the differential settlement load case was considered in detail. For the initial analysis all other load effects were derived from the previous 1994 Parkman Buck assessment report.
5.1.6 Where members have not been considered previously, the member resistance was calculated and the percentage increase in load is reported based on the total capacity of the section considered.
5.1.7 Soil structure interaction was not considered as part of the assessment when looking at the effects of the settlement/rotations.
5.2 Material Properties
5.2.1 The main deck structure is constructed from steel. The material properties for this were derived based on the properties set out in BD 21/01.
5.3 Loading
5.3.1 Expected settlements/rotations from the tunnel construction and CSO interception works have been considered as part of this assessment in conjunction with the 1994 assessment results for full loading to BD21/93.
5.3.2 Therefore, as part of the assessment, the local geology for the bridge location was reviewed and „moderately conservative volume loss‟ values derived for the tunnel construction. This was done by using the moderately conservative 1% volume loss, which is considered to be appropriate for the assessment stages considered in this report.

5 Assessment Method
Vauxhall Bridge - Assessment Report 315-RG-TPI-BR010-000001 Revision - AF Date approved -
Page 10 Uncontrolled when printed Printed 26/10/2012
CONFIDENTIAL
5.3.3 The differential settlement applied to the structure was then based on the geotechnical studies on the predicted settlement. The full geotechnical report is set out in Appendix C. The purpose of this assessment is to determine the typical settlements/rotations occurring at each of the piers and abutments. From this the impact on the structure was determined.
5.3.4 The geotechnical analysis did not take into account the interaction of the structure in the calculations for the settlement. This is a conservative approach as the structure will in reality resist rotational movement of the support (pier).
5.3.5 It is noted that the assessment utilised BD 21/93 for the live loading calculations. A comparison between the basic loading from BD 21/84 and BD 21/01 shows that the loading for 40 tonne traffic is the same. However, the lane factors in BD21/93 are higher for lanes 3 and 4 with load factors of 0.6 applied to the 40 tonne loading. The lane factors for lanes 3 and 4 in BD 21/01 are 0.5 and 0.4.
5.3.6 Where the previous 1994 Parkman Buck assessment information is considered insufficient and where the initial stage of assessment has identified a deficiency, a full load assessment to BD21/01 has been undertaken.
5.4 Structural Analysis
5.4.1 The structure has been analysed using three 3D linear elastic space frame models using SuperSTRESS. A model was created for each of the three spans potentially affected by the differential settlement caused by the construction of Thames Tunnel. The 3D models were used for the assessment to review the implications of the settlement loads.
Tunnel Construction
5.4.2 Four typical load cases were considered for the differential settlement. These were based on the predicted movements of the piers set out in Appendix C. The four load cases included three typical intermediate positions of the tunnel boring machine and the final long term condition. The tunnel boring machine positions considered for the purposes of the analysis were 30m, 0m, -25m and -55m, At each of these positions, the differential settlements of the structure were calculated. The positions are measured from the point of intersection between the centreline of the bridge and the line of the tunnel boring machine. See Appendix C.5 for the definition of the point of intersection. These positions were selected as they were considered to cause the most onerous loading on the structure.
CSO Interception Works
5.4.3 The CSO interception works have been considered as five load cases covering the excavation, construction and backfill associated with the works at the South Abutment. See Appendix D and CSO Interface Report 100-RG-TPI-BR010-000010 for details. The CSO works will mainly affect the South Abutment and Pier 1, therefore only movements at these locations have been predicted. The load effects caused by the differential
5 Assessment Method
Vauxhall Bridge - Assessment Report 315-RG-TPI-BR010-000001 Revision - AF Date approved -
Page 11 Uncontrolled when printed Printed 26/10/2012
CONFIDENTIAL
settlement/rotations were considered for the southern span. These effects were then combined with the load effects taken from the existing 1994 assessment where possible. These combined effects were then compared with the resistances of the relevant section.
5.5 Assessment Criteria
5.5.1 For members considered in the previous 1994 Parkman Buck assessment, the acceptability of the build-up of the load effects will be based on the total sum of the applied loads, including the settlement, compared with the total load resistance. The usage factor from this will then be reported. Usage factors above 1.0 indicate potential over stresses and usage factors less than 1.0 indicate adequacy of the structure.
5.5.2 For members not considered in the previous assessment and where the previous loading cannot be quantified, an increase in load of up to 5% of the calculated member resistances will be considered adequate. This limit is considered to be acceptable when considering a steel structure.
5.5.3 For members where initial assessment using the above criteria shows a deficiency a full load assessment to BD21/01 will be undertaken to consider the coexistent build up of the load effects in the member, compared with the total load resistance. The usage factor from this will then be reported.
5.5.4 Concern has been raised regarding the applicability of Curve 37 (affecting buckling of compression members) of BS 5400 for pre-1906 steel. The use of Figure 37 depends on straightness, residual stress and ductility. The first two affect the middle slenderness region and it is considered that old manufacture is no worse than modern welding or cold forming in terms of residual stresses, both of which introduce yield locally. The latter affects the plateau length at low slenderness which may be affected in pre-1906 steels. Therefore, where a calculation of the compression strength is required the curves in Figure 37 will be adopted, but the plateau of the curve is reduced from 15 to 0 on the slenderness axis (by removing the “-15” in the appendix G formula). This is considered to be a conservative approach.

6 Assessment Results
Vauxhall Bridge - Assessment Report 315-RG-TPI-BR010-000001 Revision - AF Date approved -
Page 12 Uncontrolled when printed Printed 26/10/2012
CONFIDENTIAL
6 Assessment Results
6.1 Summary of Results
6.1.1 In the calculations made for the resistances of the sections, there was no allowance made for the lack of straightness of the members as no measurements for straightness were taken on site. The inspection for assessment did not identify any areas where this was thought to be of concern
6.1.2 A summary of results for each of the sections is presented below. Where possible the loads have been added to the previous assessment loads and compared with the resistances derived at the previous assessment. Where the section considered was not checked previously, the loads are compared with the calculated section resistance. Appendix A includes the full loading summary of all load cases.
6.1.3 The loads set out in Sections 6.2 and 6.3 consider the maximum loads occurring in each section. It does not allow for coexistent effects, as these are not available from the original assessment.
6.1.4 Where over stresses have been noted, further assessment work has been undertaken, where the expected settlements/rotations from the tunnel construction and CSO interception works have been considered in addition to coexistent loading occurring from a full load assessment to BD21/01. These results are presented within Section 6.6.
6.2 Thames Tunnel Results
6.2.1 Results presented for the Thames Tunnel settlement/rotations are the maximum load for each section within the three affected spans. (Central span, Intermediate span and Shore span)
Outer Arch
6.2.2 Outermost „I‟ Section fabricated girders spanning between bearings.
FX (kN)
FY (kN)
FZ (kN)
MX (kN)
MY (kNm)
MZ (kNm)
Previous Assessment Loads 4870.0 - 178.0 - 1124.0 -
Previous Assessment Resistance 7111.0 - 974.0 - 2169.0 -
Additional Load 397.8 - 163.2 - 325.1 -
% Increase 7.6% - 47.8% - 22.4% -
Total Load 5267.8 - 341.2 - 1449.1 -
Usage 0.74 - 0.35 - 0.67 -
- - -
Table 6.1 Thames Tunnel Assessment Results – Outer Arch
6 Assessment Results
Vauxhall Bridge - Assessment Report 315-RG-TPI-BR010-000001 Revision - AF Date approved -
Page 13 Uncontrolled when printed Printed 26/10/2012
CONFIDENTIAL
Inner Arch
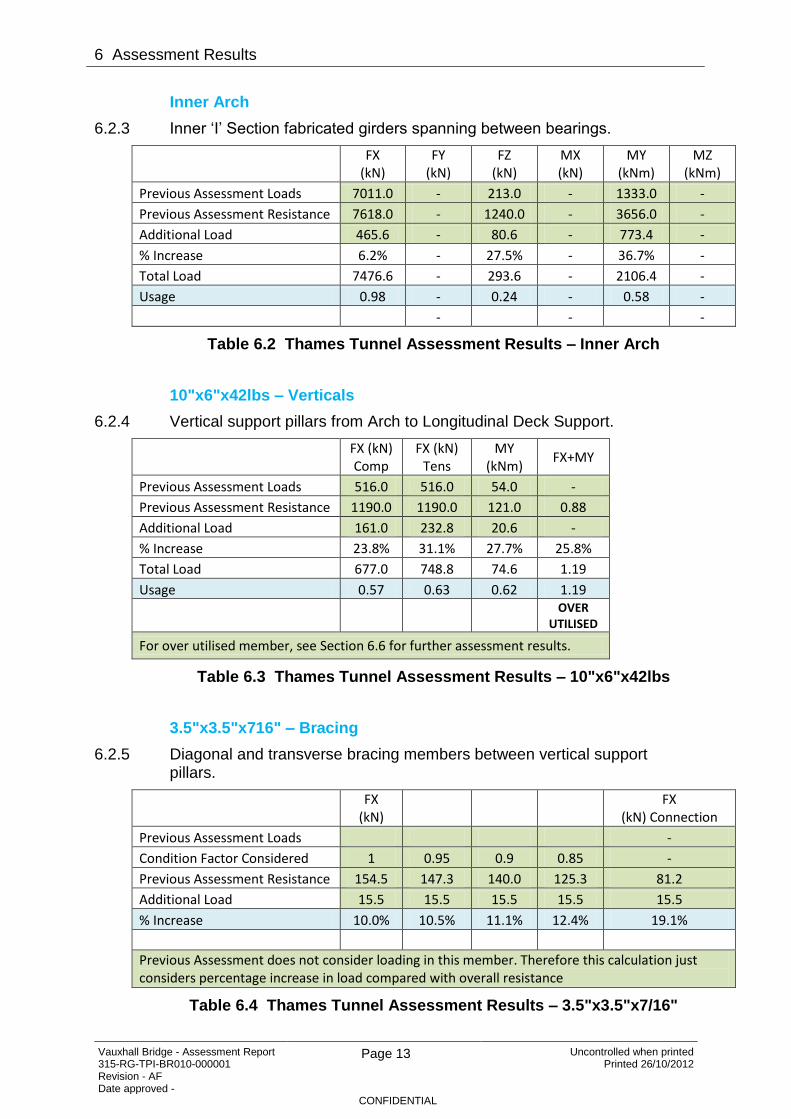
6.2.3 Inner „I‟ Section fabricated girders spanning between bearings.
FX (kN)
FY (kN)
FZ (kN)
MX (kN)
MY (kNm)
MZ (kNm)
Previous Assessment Loads 7011.0 - 213.0 - 1333.0 -
Previous Assessment Resistance 7618.0 - 1240.0 - 3656.0 -
Additional Load 465.6 - 80.6 - 773.4 -
% Increase 6.2% - 27.5% - 36.7% -
Total Load 7476.6 - 293.6 - 2106.4 -
Usage 0.98 - 0.24 - 0.58 -
- - -
Table 6.2 Thames Tunnel Assessment Results – Inner Arch
10"x6"x42lbs – Verticals
6.2.4 Vertical support pillars from Arch to Longitudinal Deck Support.
FX (kN) Comp
FX (kN) Tens
MY (kNm)
FX+MY
Previous Assessment Loads 516.0 516.0 54.0 -
Previous Assessment Resistance 1190.0 1190.0 121.0 0.88
Additional Load 161.0 232.8 20.6 -
% Increase 23.8% 31.1% 27.7% 25.8%
Total Load 677.0 748.8 74.6 1.19
Usage 0.57 0.63 0.62 1.19
OVER
UTILISED
For over utilised member, see Section 6.6 for further assessment results.
Table 6.3 Thames Tunnel Assessment Results – 10"x6"x42lbs
3.5"x3.5"x716" – Bracing
6.2.5 Diagonal and transverse bracing members between vertical support pillars.
FX (kN)
FX (kN) Connection
Previous Assessment Loads -
Condition Factor Considered 1 0.95 0.9 0.85 -
Previous Assessment Resistance 154.5 147.3 140.0 125.3 81.2
Additional Load 15.5 15.5 15.5 15.5 15.5
% Increase 10.0% 10.5% 11.1% 12.4% 19.1%
Previous Assessment does not consider loading in this member. Therefore this calculation just considers percentage increase in load compared with overall resistance
Table 6.4 Thames Tunnel Assessment Results – 3.5"x3.5"x7/16"
6 Assessment Results
Vauxhall Bridge - Assessment Report 315-RG-TPI-BR010-000001 Revision - AF Date approved -
Page 14 Uncontrolled when printed Printed 26/10/2012
CONFIDENTIAL
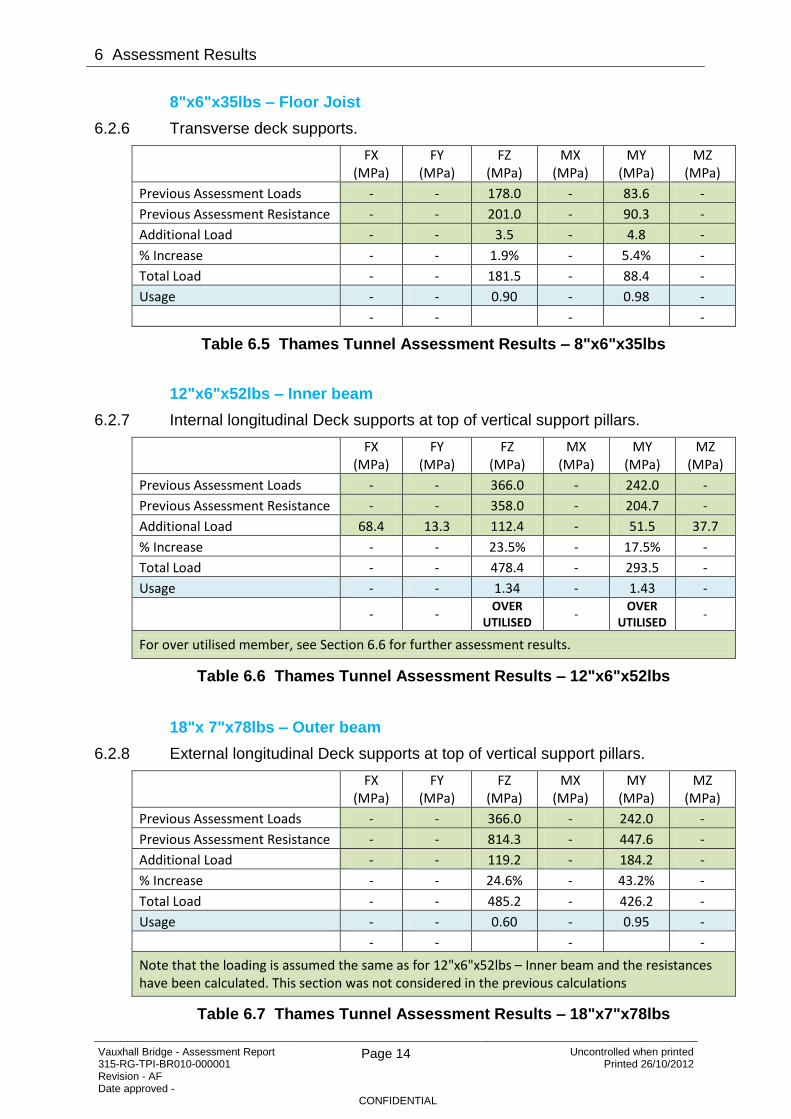
8"x6"x35lbs – Floor Joist
6.2.6 Transverse deck supports.
FX (MPa)
FY (MPa)
FZ (MPa)
MX (MPa)
MY (MPa)
MZ (MPa)
Previous Assessment Loads - - 178.0 - 83.6 -
Previous Assessment Resistance - - 201.0 - 90.3 -
Additional Load - - 3.5 - 4.8 -
% Increase - - 1.9% - 5.4% -
Total Load - - 181.5 - 88.4 -
Usage - - 0.90 - 0.98 -
- - - -
Table 6.5 Thames Tunnel Assessment Results – 8"x6"x35lbs
12"x6"x52lbs – Inner beam
6.2.7 Internal longitudinal Deck supports at top of vertical support pillars.
FX (MPa)
FY (MPa)
FZ (MPa)
MX (MPa)
MY (MPa)
MZ (MPa)
Previous Assessment Loads - - 366.0 - 242.0 -
Previous Assessment Resistance - - 358.0 - 204.7 -
Additional Load 68.4 13.3 112.4 - 51.5 37.7
% Increase - - 23.5% - 17.5% -
Total Load - - 478.4 - 293.5 -
Usage - - 1.34 - 1.43 -
- -
OVER UTILISED
- OVER
UTILISED -
For over utilised member, see Section 6.6 for further assessment results.
Table 6.6 Thames Tunnel Assessment Results – 12"x6"x52lbs
18"x 7"x78lbs – Outer beam
6.2.8 External longitudinal Deck supports at top of vertical support pillars.
FX (MPa)
FY (MPa)
FZ (MPa)
MX (MPa)
MY (MPa)
MZ (MPa)
Previous Assessment Loads - - 366.0 - 242.0 -
Previous Assessment Resistance - - 814.3 - 447.6 -
Additional Load - - 119.2 - 184.2 -
% Increase - - 24.6% - 43.2% -
Total Load - - 485.2 - 426.2 -
Usage - - 0.60 - 0.95 -
- - - -
Note that the loading is assumed the same as for 12"x6"x52lbs – Inner beam and the resistances have been calculated. This section was not considered in the previous calculations
Table 6.7 Thames Tunnel Assessment Results – 18"x7"x78lbs

6 Assessment Results
Vauxhall Bridge - Assessment Report 315-RG-TPI-BR010-000001 Revision - AF Date approved -
Page 15 Uncontrolled when printed Printed 26/10/2012
CONFIDENTIAL
Cross Beam 1
6.2.9 Transverse beam between internal arch ribs at centrespan.
FX (kN)
FY (kN)
FZ (kN)
MX (kN)
MY (kNm)
MZ (kNm)
Previous Assessment Loads - - -
Previous Assessment Resistance 4367.0 1662.0 1813.5
Additional Load 48.7 10.8 15.8
% Increase 1.1% - 0.6% - 0.9% -
Total Load - - -
Usage - - -
- - -
Previous Assessment does not consider loading in this member. Therefore this calculation just considers percentage increase in load compared with overall resistance
Table 6.8 Thames Tunnel Assessment Results – Cross Beam 1
Cross Beam 2
6.2.10 Transverse beam between External and central arch ribs at centrespan.
FX (kN)
FY (kN)
FZ (kN)
MX (kN)
MY (kNm)
MZ (kNm)
Previous Assessment Loads - - -
Previous Assessment Resistance 3775.0 1049.2 1096.0
Additional Load 52.7 17.0 26.9
% Increase 1.4% - 1.6% - 2.5% -
Total Load - - -
Usage - - -
- - -
Previous Assessment does not consider loading in this member. Therefore this calculation just considers percentage increase in load compared with overall resistance
Table 6.9 Thames Tunnel Assessment Results – Cross Beam 2
6 Assessment Results
Vauxhall Bridge - Assessment Report 315-RG-TPI-BR010-000001 Revision - AF Date approved -
Page 16 Uncontrolled when printed Printed 26/10/2012
CONFIDENTIAL
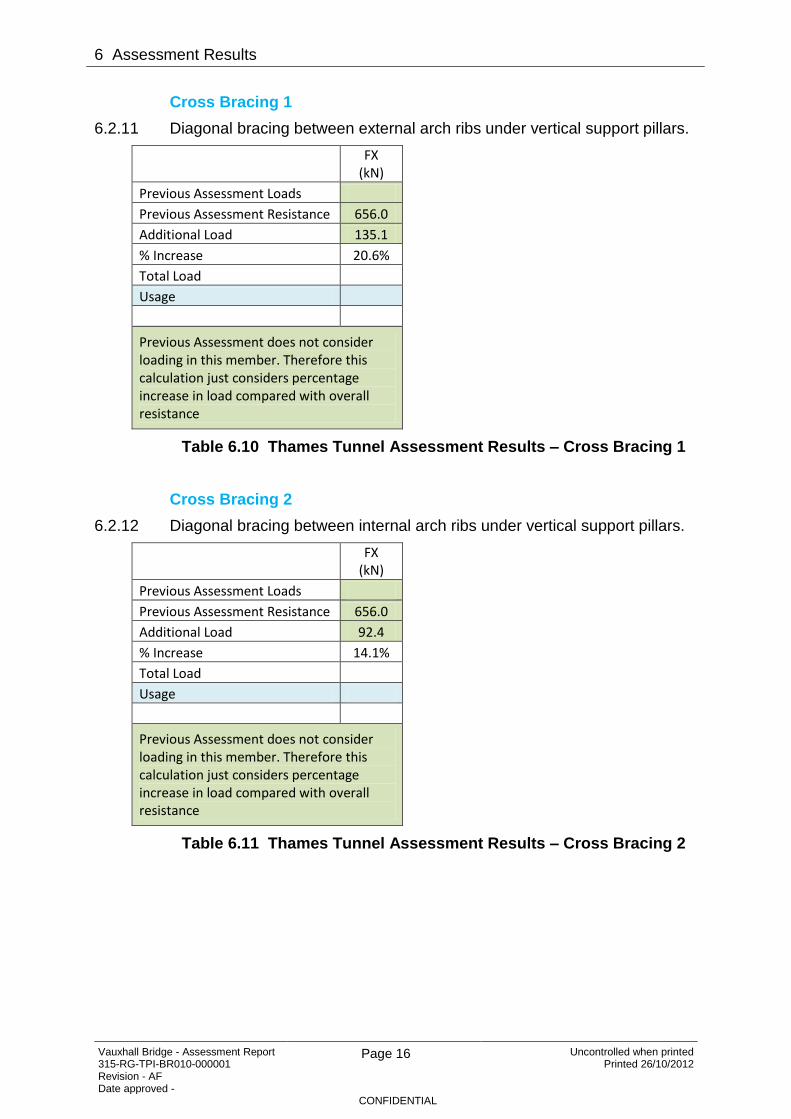
Cross Bracing 1
6.2.11 Diagonal bracing between external arch ribs under vertical support pillars.
FX (kN)
Previous Assessment Loads
Previous Assessment Resistance 656.0
Additional Load 135.1
% Increase 20.6%
Total Load
Usage
Previous Assessment does not consider loading in this member. Therefore this calculation just considers percentage increase in load compared with overall resistance
Table 6.10 Thames Tunnel Assessment Results – Cross Bracing 1
Cross Bracing 2
6.2.12 Diagonal bracing between internal arch ribs under vertical support pillars.
FX (kN)
Previous Assessment Loads
Previous Assessment Resistance 656.0
Additional Load 92.4
% Increase 14.1%
Total Load
Usage
Previous Assessment does not consider loading in this member. Therefore this calculation just considers percentage increase in load compared with overall resistance
Table 6.11 Thames Tunnel Assessment Results – Cross Bracing 2

6 Assessment Results
Vauxhall Bridge - Assessment Report 315-RG-TPI-BR010-000001 Revision - AF Date approved -
Page 17 Uncontrolled when printed Printed 26/10/2012
CONFIDENTIAL
6.3 Combined Thames Tunnel and CSO Results
6.3.1 Results presented for the combined coexistent Thames Tunnel and CSO Interface settlement/rotations are the maximum effects from the shore span where the CSO works are concentrated.
6.3.2 The CSO Interception Works predominantly affect the south abutment with associated settlements occurring to the south pier. Consequently settlement effects due to the CSO Interception Works are localised to the shore and intermediate spans.
6.3.3 Results presented for the CSO settlement/rotations are the maximum load for each section within the two affected spans.
Outer Arch
6.3.4 Outermost „I‟ Section fabricated girders spanning between bearings.
FX (kN)
FY (kN)
FZ (kN)
MX (kN)
MY (kNm)
MZ (kNm)
Previous Assessment Loads 4870.0 - 178.0 - 1124.0 -
Previous Assessment Resistance 7111.0 - 974.0 - 2169.0 -
Additional Load 402.9 - 165.6 - 326.7 -
% Increase 7.6% - 48.2% - 22.5% -
Total Load 5272.9 - 343.6 - 1450.7 -
Usage 0.74 - 0.35 - 0.67 -
- - -
Table 6.12 Combined Assessment Results – Outer Arch
Inner Arch
6.3.5 Inner „I‟ Section fabricated girders spanning between bearings.
FX (kN)
FY (kN)
FZ (kN)
MX (kN)
MY (kNm)
MZ (kNm)
Previous Assessment Loads 7011.0 - 213.0 - 1333.0 -
Previous Assessment Resistance 7618.0 - 1240.0 - 3656.0 -
Additional Load 469.6 - 81.1 - 777.4 -
% Increase 6.3% - 27.6% - 36.8% -
Total Load 7480.6 - 294.1 - 2110.4 -
Usage 0.98 - 0.24 - 0.58 -
- - -
Table 6.13 Combined Assessment Results – Inner Arch
6 Assessment Results
Vauxhall Bridge - Assessment Report 315-RG-TPI-BR010-000001 Revision - AF Date approved -
Page 18 Uncontrolled when printed Printed 26/10/2012
CONFIDENTIAL
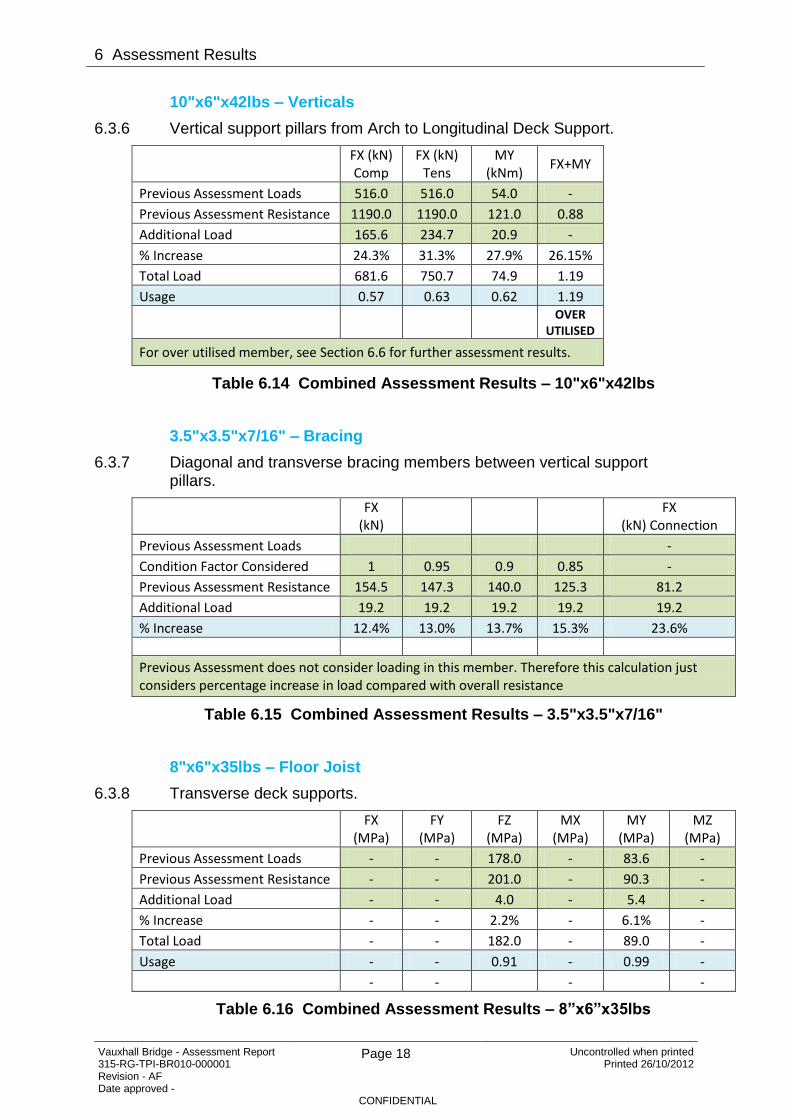
10"x6"x42lbs – Verticals
6.3.6 Vertical support pillars from Arch to Longitudinal Deck Support.
FX (kN) Comp
FX (kN) Tens
MY (kNm)
FX+MY
Previous Assessment Loads 516.0 516.0 54.0 -
Previous Assessment Resistance 1190.0 1190.0 121.0 0.88
Additional Load 165.6 234.7 20.9 -
% Increase 24.3% 31.3% 27.9% 26.15%
Total Load 681.6 750.7 74.9 1.19
Usage 0.57 0.63 0.62 1.19
OVER
UTILISED
For over utilised member, see Section 6.6 for further assessment results.
Table 6.14 Combined Assessment Results – 10"x6"x42lbs
3.5"x3.5"x7/16" – Bracing
6.3.7 Diagonal and transverse bracing members between vertical support pillars.
FX (kN)
FX (kN) Connection
Previous Assessment Loads -
Condition Factor Considered 1 0.95 0.9 0.85 -
Previous Assessment Resistance 154.5 147.3 140.0 125.3 81.2
Additional Load 19.2 19.2 19.2 19.2 19.2
% Increase 12.4% 13.0% 13.7% 15.3% 23.6%
Previous Assessment does not consider loading in this member. Therefore this calculation just considers percentage increase in load compared with overall resistance
Table 6.15 Combined Assessment Results – 3.5"x3.5"x7/16"
8"x6"x35lbs – Floor Joist
6.3.8 Transverse deck supports.
FX (MPa)
FY (MPa)
FZ (MPa)
MX (MPa)
MY (MPa)
MZ (MPa)
Previous Assessment Loads - - 178.0 - 83.6 -
Previous Assessment Resistance - - 201.0 - 90.3 -
Additional Load - - 4.0 - 5.4 -
% Increase - - 2.2% - 6.1% -
Total Load - - 182.0 - 89.0 -
Usage - - 0.91 - 0.99 -
- - - -
Table 6.16 Combined Assessment Results – 8”x6”x35lbs

6 Assessment Results
Vauxhall Bridge - Assessment Report 315-RG-TPI-BR010-000001 Revision - AF Date approved -
Page 19 Uncontrolled when printed Printed 26/10/2012
CONFIDENTIAL
12"x6"x52lbs – Inner beam
6.3.9 Internal longitudinal Deck supports at top of vertical support pillars.
FX (MPa)
FY (MPa)
FZ (MPa)
MX (MPa)
MY (MPa)
MZ (MPa)
Previous Assessment Loads - - 366.0 - 242.0 -
Previous Assessment Resistance - - 358.0 - 204.7 -
Additional Load 68.7 17.0 113.3 - 51.9 43.2
% Increase - - 23.6% - 17.6% -
Total Load - - 479.3 - 293.9 -
Usage - - 1.34 - 1.44 -
- - OVER
UTILISED -
OVER UTILISED
-
For over utilised member, see Section 6.6 for further assessment results.
Table 6.17 Combined Assessment Results – 12"x6"x52lbs
18"x 7"x78lbs – Outer beam
6.3.10 External longitudinal Deck supports at top of vertical support pillars.
FX (MPa)
FY (MPa)
FZ (MPa)
MX (MPa)
MY (MPa)
MZ (MPa)
Previous Assessment Loads - - 366.0 - 242.0 -
Previous Assessment Resistance - - 814.3 - 447.6 -
Additional Load - - 120.3 - 185.5 -
% Increase - - 24.7% - 43.4% -
Total Load - - 486.3 - 427.5 -
Usage - - 0.60 - 0.96 -
- - - -
Note that the loading is assumed the same as for 12"x6"x52lbs – Inner beam and the resistances have been calculated. This section was not considered in the previous calculations
Table 6.18 Combined Assessment Results – 18"x7"x78lbs
6 Assessment Results
Vauxhall Bridge - Assessment Report 315-RG-TPI-BR010-000001 Revision - AF Date approved -
Page 20 Uncontrolled when printed Printed 26/10/2012
CONFIDENTIAL
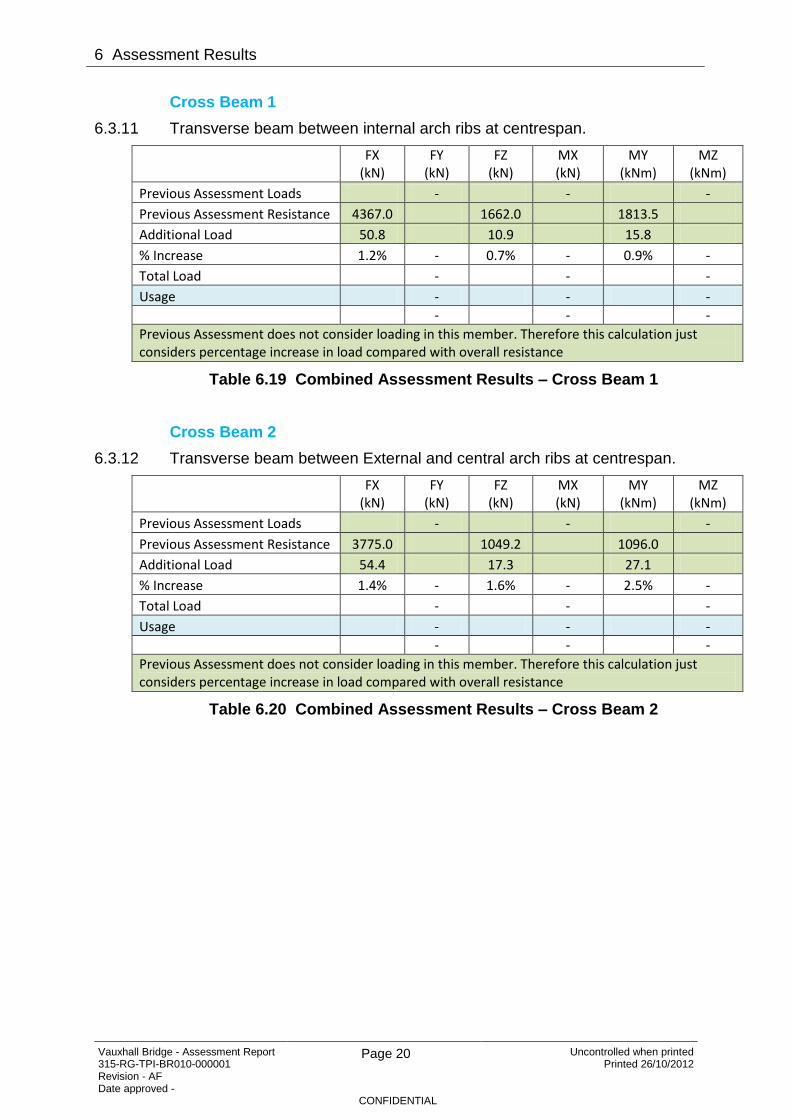
Cross Beam 1
6.3.11 Transverse beam between internal arch ribs at centrespan.
FX (kN)
FY (kN)
FZ (kN)
MX (kN)
MY (kNm)
MZ (kNm)
Previous Assessment Loads - - -
Previous Assessment Resistance 4367.0 1662.0 1813.5
Additional Load 50.8 10.9 15.8
% Increase 1.2% - 0.7% - 0.9% -
Total Load - - -
Usage - - -
- - -
Previous Assessment does not consider loading in this member. Therefore this calculation just considers percentage increase in load compared with overall resistance
Table 6.19 Combined Assessment Results – Cross Beam 1
Cross Beam 2
6.3.12 Transverse beam between External and central arch ribs at centrespan.
FX (kN)
FY (kN)
FZ (kN)
MX (kN)
MY (kNm)
MZ (kNm)
Previous Assessment Loads - - -
Previous Assessment Resistance 3775.0 1049.2 1096.0
Additional Load 54.4 17.3 27.1
% Increase 1.4% - 1.6% - 2.5% -
Total Load - - -
Usage - - -
- - -
Previous Assessment does not consider loading in this member. Therefore this calculation just considers percentage increase in load compared with overall resistance
Table 6.20 Combined Assessment Results – Cross Beam 2

6 Assessment Results
Vauxhall Bridge - Assessment Report 315-RG-TPI-BR010-000001 Revision - AF Date approved -
Page 21 Uncontrolled when printed Printed 26/10/2012
CONFIDENTIAL
Cross Bracing 1
6.3.13 Diagonal bracing between external arch ribs under vertical support pillars.
FX (kN)
Previous Assessment Loads
Previous Assessment Resistance 656.0
Additional Load 135.8
% Increase 20.7%
Total Load
Usage
Previous Assessment does not consider loading in this member. Therefore this calculation just considers percentage increase in load compared with overall resistance
Table 6.21 Combined Assessment Results – Cross Bracing 1
Cross Bracing 2
6.3.14 Diagonal bracing between internal arch ribs under vertical support pillars.
FX (kN)
Previous Assessment Loads
Previous Assessment Resistance 656.0
Additional Load 96.8
% Increase 14.8%
Total Load
Usage
Previous Assessment does not consider loading in this member. Therefore this calculation just considers percentage increase in load compared with overall resistance
Table 6.22 Combined Assessment Results – Cross Bracing 2
6 Assessment Results
Vauxhall Bridge - Assessment Report 315-RG-TPI-BR010-000001 Revision - AF Date approved -
Page 22 Uncontrolled when printed Printed 26/10/2012
CONFIDENTIAL
6.4 Deck Movement at Supports
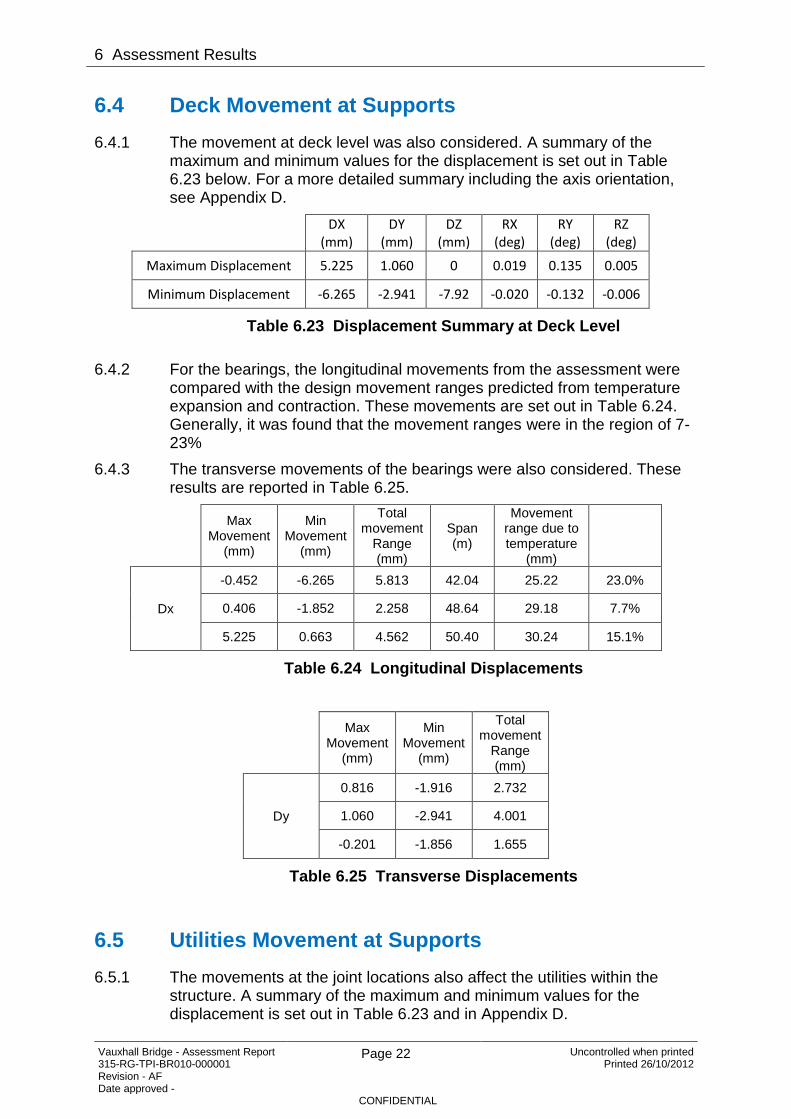
6.4.1 The movement at deck level was also considered. A summary of the maximum and minimum values for the displacement is set out in Table 6.23 below. For a more detailed summary including the axis orientation, see Appendix D.
DX (mm)
DY (mm)
DZ (mm)
RX (deg)
RY (deg)
RZ (deg)
Maximum Displacement 5.225 1.060 0 0.019 0.135 0.005
Minimum Displacement -6.265 -2.941 -7.92 -0.020 -0.132 -0.006
Table 6.23 Displacement Summary at Deck Level
6.4.2 For the bearings, the longitudinal movements from the assessment were compared with the design movement ranges predicted from temperature expansion and contraction. These movements are set out in Table 6.24. Generally, it was found that the movement ranges were in the region of 7-23%
6.4.3 The transverse movements of the bearings were also considered. These results are reported in Table 6.25.
Max Movement
(mm)
Min Movement
(mm)
Total movement
Range (mm)
Span (m)
Movement range due to temperature
(mm)
Dx
-0.452 -6.265 5.813 42.04 25.22 23.0%
0.406 -1.852 2.258 48.64 29.18 7.7%
5.225 0.663 4.562 50.40 30.24 15.1%
Table 6.24 Longitudinal Displacements
Max Movement
(mm)
Min Movement
(mm)
Total movement
Range (mm)
Dy
0.816 -1.916 2.732
1.060 -2.941 4.001
-0.201 -1.856 1.655
Table 6.25 Transverse Displacements
6.5 Utilities Movement at Supports
6.5.1 The movements at the joint locations also affect the utilities within the structure. A summary of the maximum and minimum values for the displacement is set out in Table 6.23 and in Appendix D.

6 Assessment Results
Vauxhall Bridge - Assessment Report 315-RG-TPI-BR010-000001 Revision - AF Date approved -
Page 23 Uncontrolled when printed Printed 26/10/2012
CONFIDENTIAL
6.6 Assessment Results Discussion
General
6.6.1 The analysis of the structure for predicted settlements generated by the combined Thames Tunnel and CSO Interception works shows maximum load effects occur in the intermediate span.
Substructure
6.6.2 The substructure was assessed qualitatively by consideration of the predicted movements affecting the foundations. As the ground movements are generally considered to be small, the impacts of the settlement/rotations due to the new tunnel construction was deemed to have a negligible effect on the abutments and the piers.
Superstructure
12”x6”x52 lbs – Inner beam
6.6.3 The previous assessment reported that the structure was adequate under full 40 tonne assessment live loading. However, a review of the previous calculations showed that over stresses had been found in the inner longitudinal deck beams (12”x6”x52 lbs sections), which were overstressed by a factor of 1.02 for shear and 1.18 for bending when considering the maximum single axle loading. The combination for HA+KEL was found to be adequate.
6.6.4 A limited sensitivity study was conducted using the 3D space frame to investigate whether the loads could be decreased due to the increased distribution possible with a 3D model. The limited study showed that this was not the case and the loads derived from this study were slightly larger than those derived from the original assessment.
6.6.5 The initial analysis indicated that the proposed construction of Thames Tunnel would potentially increase the moment in the section by up to 17.5%. This would have the effect of further increasing the usage factor to 1.43. The previous calculations also did not consider the combined effects of shear and moment in the section.
6.6.6 Further analysis work has been undertaken to consider the maximum coexistent effects of the settlement/rotations in combination with the moments and shear forces from a full 40 tonne assessment live load assessment to BD21/01 (similarly considering HA and KEL loading). The maximum effects per span are presented within Tables 6.26 – 6.28 below for each of the three affected spans.

6 Assessment Results
Vauxhall Bridge - Assessment Report 315-RG-TPI-BR010-000001 Revision - AF Date approved -
Page 24 Uncontrolled when printed Printed 26/10/2012
CONFIDENTIAL
FZ (MPa)
MY (MPa)
Further Assessment Loads 185.7 162.3
Previous Assessment Resistance 358.0 204.7
Additional Load due to Settlement 12.8 17.3
% Increase 6.9% 10.7%
Total Load 198.5 179.6
Usage 0.55 0.88
Table 6.26 Shore Span Further Assessment Results – 12"x6"x52lbs
FZ (MPa)
MY (MPa)
Further Assessment Loads 208.1 149.5
Previous Assessment Resistance 358.0 204.7
Additional Load due to Settlement 113.3 51.8
% Increase 54.4% 34.6%
Total Load 321.4 201.3
Usage 0.90 0.98
Table 6.27 Intermediate Span Further Assessment Results – 12"x6"x52lbs
FZ (MPa)
MY (MPa)
Further Assessment Loads 209.1 135.6
Previous Assessment Resistance 358.0 204.7
Additional Load due to Settlement 7.0 9.1
% Increase 3.2% 6.3%
Total Load 216.1 144.7
Usage 0.60 0.71
Table 6.28 Centre Span Further Assessment Results – 12"x6"x52lbs
6.6.7 The further assessment work shows that the sections are adequate with a usage factor less than 1.0 when coexistent loading of existing loading and settlement/rotations are considered within each span.
10"x6"x42lbs – Verticals
6.6.8 The initial analysis indicated that an overstress was observed in the vertical members, 10"x6"x42lbs – Verticals, due to combined bending and axial load.
6.6.9 Further analysis work has been undertaken to consider the full coexistent effects of the settlement/rotations in combination with the moments and

6 Assessment Results
Vauxhall Bridge - Assessment Report 315-RG-TPI-BR010-000001 Revision - AF Date approved -
Page 25 Uncontrolled when printed Printed 26/10/2012
CONFIDENTIAL
shear forces from a full 40 tonne assessment live load assessment to BD21/01. The maximum coexistent effects within individual members are presented within Tables 6.29 – 6.31 below for each of the three affected spans.
FX (kN) Comp
MY (kNm)
FX+MY
Further Assessment Loads 237.7 88.5 -
Previous Assessment Resistance 1190.0 121.0 0.93
Additional Load 8.7 11.6 -
% Increase 3.5% 11.6% Total Load 246.4 100.1 Usage 0.21 0.83 1.03
Table 6.29 Shore Span Further Assessment Results – 10"x6"x42lbs
FX (kN) Comp
MY (kNm)
FX+MY
Further Assessment Loads 235.4 81.6 Previous Assessment Resistance 1190.0 121.0 Additional Load 6.9 18.3 % Increase 2.9% 18.3% Total Load 242.3 82.9 Usage 0.20 0.83 1.03
Table 6.30 Intermediate Span Further Assessment Results – 10"x6"x42lbs
FX (kN) Comp
MY (kNm)
FX+MY
Further Assessment Loads 229.6 74.8 Previous Assessment Resistance 1190.0 121.0 Additional Load -2.3 7.9 % Increase -1.0% 9.6% Total Load 227.3 82.8 Usage 0.19 0.68 0.87
Table 6.31 Centre Span Further Assessment Results – 10"x6"x42lbs
6.6.10 The further assessment work shows that the maximum usage factor within a member is 1.03 when coexistent loading of existing loading and settlement/rotations are considered for each individual member, and can be considered adequate due to the conservative assumptions made within the assessment of the structure, subject to agreement of the asset owner.
6 Assessment Results
Vauxhall Bridge - Assessment Report 315-RG-TPI-BR010-000001 Revision - AF Date approved -
Page 26 Uncontrolled when printed Printed 26/10/2012
CONFIDENTIAL
6.6.11 It is expected that the Parkman Buck 1994 resistances can be increased for the members with the highest usage by considering the actual effective length, as the previous assessment has considered the non coexistent longest effective length within the calculations.
Members not considered in Previous Assessment
6.6.12 For members that were not considered in the previous assessment, the percentage increase in the usage was reported based on the calculated resistance of the member. As the previous assessment loading on these members was not considered, it is not possible to quantify the total increase in the load effects on the member within the scope of this assessment.
6.6.13 For the Cross Beam (results given in Tables 6.8, 6.9, 6.19 and 6.20) the percentage increase in the load relative to the section resistance is less than 2.5%. On this basis, the load increase is considered to be small, and the section can be assumed to be adequate.
6.6.14 For the 18"x7"x78lbs outer beam, the previous loads were not reported. However, they are assumed to be similar to those on the inner beams, where the loading has been reported. On this basis, the usage on this section can be assumed to be adequate.
3.5"x3.5"x7/16" – Bracing
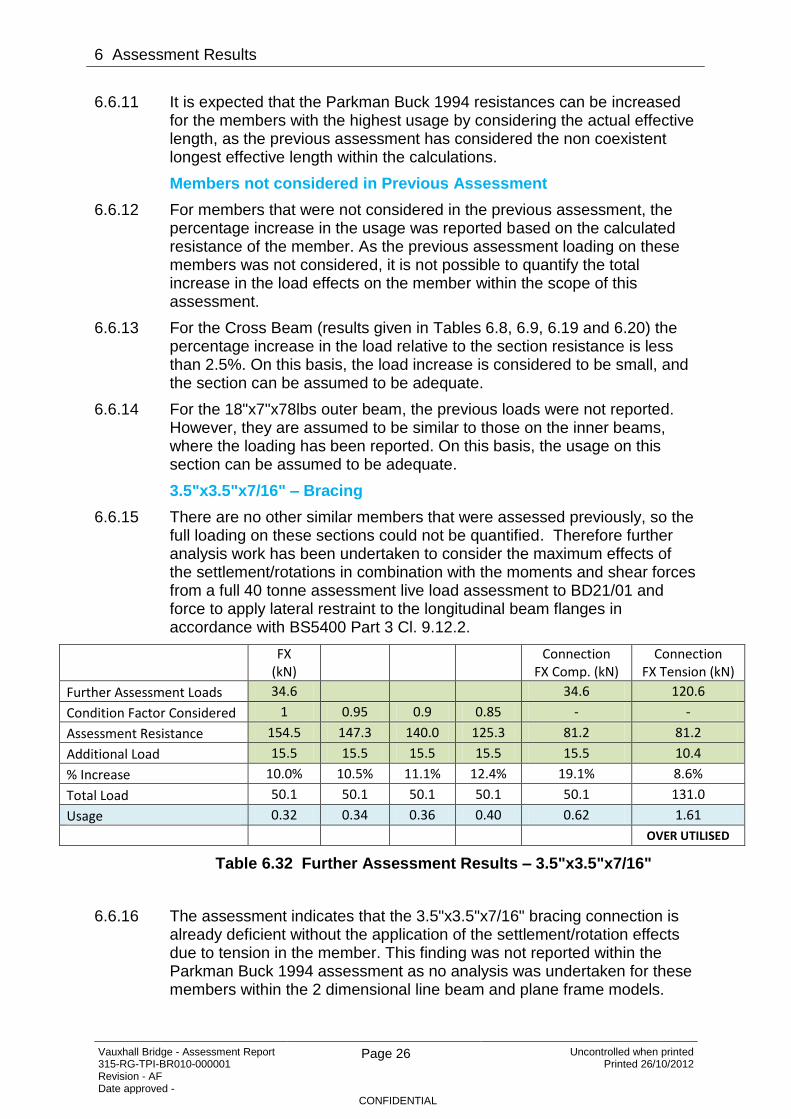
6.6.15 There are no other similar members that were assessed previously, so the full loading on these sections could not be quantified. Therefore further analysis work has been undertaken to consider the maximum effects of the settlement/rotations in combination with the moments and shear forces from a full 40 tonne assessment live load assessment to BD21/01 and force to apply lateral restraint to the longitudinal beam flanges in accordance with BS5400 Part 3 Cl. 9.12.2.
FX (kN)
Connection FX Comp. (kN)
Connection FX Tension (kN)
Further Assessment Loads 34.6
34.6 120.6
Condition Factor Considered 1 0.95 0.9 0.85 - -
Assessment Resistance 154.5 147.3 140.0 125.3 81.2 81.2
Additional Load 15.5 15.5 15.5 15.5 15.5 10.4
% Increase 10.0% 10.5% 11.1% 12.4% 19.1% 8.6%
Total Load 50.1 50.1 50.1 50.1 50.1 131.0
Usage 0.32 0.34 0.36 0.40 0.62 1.61
OVER UTILISED
Table 6.32 Further Assessment Results – 3.5"x3.5"x7/16"
6.6.16 The assessment indicates that the 3.5"x3.5"x7/16" bracing connection is already deficient without the application of the settlement/rotation effects due to tension in the member. This finding was not reported within the Parkman Buck 1994 assessment as no analysis was undertaken for these members within the 2 dimensional line beam and plane frame models.
6 Assessment Results
Vauxhall Bridge - Assessment Report 315-RG-TPI-BR010-000001 Revision - AF Date approved -
Page 27 Uncontrolled when printed Printed 26/10/2012
CONFIDENTIAL
Cross Bracing
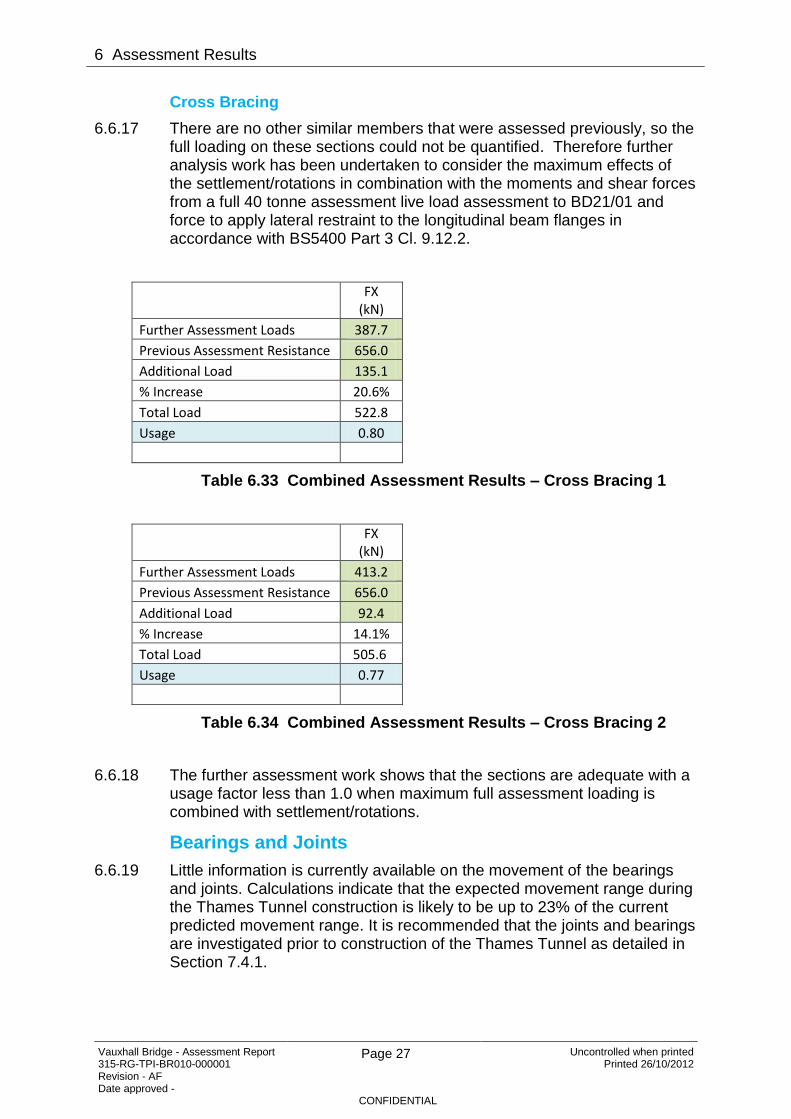
6.6.17 There are no other similar members that were assessed previously, so the full loading on these sections could not be quantified. Therefore further analysis work has been undertaken to consider the maximum effects of the settlement/rotations in combination with the moments and shear forces from a full 40 tonne assessment live load assessment to BD21/01 and force to apply lateral restraint to the longitudinal beam flanges in accordance with BS5400 Part 3 Cl. 9.12.2.
FX (kN)
Further Assessment Loads 387.7
Previous Assessment Resistance 656.0
Additional Load 135.1
% Increase 20.6%
Total Load 522.8
Usage 0.80
Table 6.33 Combined Assessment Results – Cross Bracing 1
FX (kN)
Further Assessment Loads 413.2
Previous Assessment Resistance 656.0
Additional Load 92.4
% Increase 14.1%
Total Load 505.6
Usage 0.77
Table 6.34 Combined Assessment Results – Cross Bracing 2
6.6.18 The further assessment work shows that the sections are adequate with a usage factor less than 1.0 when maximum full assessment loading is combined with settlement/rotations.
Bearings and Joints
6.6.19 Little information is currently available on the movement of the bearings and joints. Calculations indicate that the expected movement range during the Thames Tunnel construction is likely to be up to 23% of the current predicted movement range. It is recommended that the joints and bearings are investigated prior to construction of the Thames Tunnel as detailed in Section 7.4.1.
6 Assessment Results
Vauxhall Bridge - Assessment Report 315-RG-TPI-BR010-000001 Revision - AF Date approved -
Page 28 Uncontrolled when printed Printed 26/10/2012
CONFIDENTIAL
Utilities
6.6.20 For utility services crossing Vauxhall Road Bridge, each service has been checked for structural adequacy based upon the geotechnical assessment results set out in Appendix C. The conclusions of this work are presented within the separate Utilities Assessment Reports listed below.
BT 315-RG-TPI-BR010-000003-AA
Cable & Wireless 315-RG-TPI-BR010-000004-AA
McNicholas Colt 315-RG-TPI-BR010-000005-AA
National Grid Gas 315-RG-TPI-BR010-000006-AA
UK Power Networks (EDF) 315-RG-TPI-BR010-000007-AA
Verizon Business 315-RG-TPI-BR010-000008-AA
6.7 Cat II Check
6.7.1 The final member usages are generally similar between the assessment and the check. There is no disagreement on which elements fail and which pass either before or after the new settlements have occurred.
6.7.2 The differences in additional loading due to settlement between the assessment and the check have not been investigated further as the overall conclusions are similar.
6.7.3 The assessment results are reported in section 6.1 and Appendix A. The check results have been included in Appendix E for visibility.
7 Mitigation Measures
Vauxhall Bridge - Assessment Report 315-RG-TPI-BR010-000001 Revision - AF Date approved -
Page 29 Uncontrolled when printed Printed 26/10/2012
CONFIDENTIAL
7 Mitigation Measures/Additional Work Recommendations
7.1 General
7.1.1 Prior to tunnel construction, it is recommended to investigate and monitor the joints/bearings to ensure that they are articulating as predicted. This is to ensure that the assumptions of the fixity made in the assessment are valid.
7.1.2 Monitoring should also be done on other parts of the structure to determine the behaviour of the structure prior to the tunnel construction. This monitoring should be maintained during the tunnel construction and post tunnel construction. The monitoring period pre/post tunnel construction is to be completed over a time period adequate to determine the normal behaviour of the structure.
7.1.3 During the construction of Thames Tunnel, it will be necessary to install monitoring equipment in order to ensure that the actual movements of the foundations are within the limits predicted by the Geotechnical Assessment. Control limits will need to be set out to quantify when intervention is required to prevent damage to the structure.
7.1.4 It is recommended the southern span of Vauxhall Bridge is protected from impact during the works, especially during installation and removal of sheet piles adjacent/below the structure and installation of the connecting culvert adjacent to the south abutment. Please see the Vauxhall Bridge Interface Report, 100-RG-TPI-BR010-000010 for details.
7.2 Substructure
7.2.1 No specific mitigation measures are currently proposed for the substructure as the substructure is considered adequate.
7.2.2 It may be necessary to install scour protection to mitigate the increased scour risk proposed to the bridge structure during the construction and permanent phases of the CSO works. Increased scour risk will occur due to modification of fluvial flow during these phases. A detailed review of the scour modelling has been undertaken and is reported in document 315-RG-TPI-BR010-000009.
7.3 Superstructure
7.3.1 No specific mitigation measures are currently proposed for the superstructure as it is considered to adequately pass its assessment except as below
7.3.2 For the 10"x6"x42lbs vertical members further assessment work has shown that the maximum usage factor is 1.03, which can be considered adequate, subject to agreement of the asset owner, due to the conservative assumptions made within the assessment of the structure.
7 Mitigation Measures
Vauxhall Bridge - Assessment Report 315-RG-TPI-BR010-000001 Revision - AF Date approved -
Page 30 Uncontrolled when printed Printed 26/10/2012
CONFIDENTIAL
7.3.3 The assessment indicates that the 3.5"x3.5"x7/16" bracing connection is already deficient without the application of the settlement/rotation effects. This detail should be inspected to determine whether there is any evidence of failure currently. Strengthening of the rivets forming the connection may be necessary, which can be undertaken by replacing existing rivets with high strength bolts. No strengthening of the bracing members themselves is considered necessary.
7.4 Expansion Joints and Bearings
7.4.1 It is recommended that the joints and bearings are investigated prior to construction of the tunnel. This is to ensure that the bearings/joints have not locked up. The investigation should also consider whether there is sufficient movement range available to allow for the additional movement due to the tunnel construction as well as the predicted temperature movement.
7.4.2 An emergency action plan is to be put in place for the possible adverse effects on movement joints prior to the works being undertaken.

Bibliography
Vauxhall Bridge - Assessment Report 315-RG-TPI-BR010-000001 Revision - AF Date approved -
Page 31 Uncontrolled when printed Printed 26/10/2012
CONFIDENTIAL
Bibliography
Thames Tunnel, 2011, Thames Tunnel Design Standard and Guidance, London, Thames Tunnel
Thames Tunnel. (2011). Construction report - Albert Embankment Foreshore. 100-RG-CNL-PLH1X-000010_AC . London: Thames Tunnel.
Parkman Buck, 1994, Vauxhall Bridge Principal Inspection and Assessment Report 2753/3377.2, London, January 1994

Glossary
Vauxhall Bridge - Assessment Report 315-RG-TPI-BR010-000001 Revision - AF Date approved -
Page 32 Uncontrolled when printed Printed 26/10/2012
CONFIDENTIAL
Glossary
Term Description
AIP Approval in Principle
CSO Combined Sewer Overflow

Glossary
Vauxhall Bridge - Assessment Report 315-RG-TPI-BR010-000001 Revision - AF Date approved -
Page 33 Uncontrolled when printed Printed 26/10/2012
CONFIDENTIAL
Appendices
List of figures
Page number
Figure B.1 Plan View of Deck (Shore Span) ............................................................. 44
Figure B.2 Side View of Deck (Shore Span) ............................................................. 44
Figure B.3 Overall 3D Deck Model (Shore Span) ..................................................... 45
Figure C.1 Bridge Layout and Pier Position .............................................................. 47
Figure C.2 Development of a 3D settlement trough .................................................. 48
Figure C.3 R1, R2 in relation to approaching tunnel ................................................. 49
Figure D.1 CSO Works on the Albert Embankment foreshore at Vauxhall Bridge.... 56
Figure D.2 Cross section of CSO Works. ................................................................. 57
Figure D.3 Pier & Abutment Calculation Lines.......................................................... 60
Figure D.4 Model of Calculation Phase 1 ................................................................. 61
Figure D.5 Model of Calculation Phase 2, 3, & 4 ...................................................... 61
Figure D.6 Model of Calculation Phase 5 & 6 ........................................................... 62
Figure D.7 Direction of horizontal movements .......................................................... 64
Figure D.8 Settlement of Line 1 ................................................................................ 69
Figure D.9 Settlement of Line 2 ................................................................................ 69
Figure D.10 Settlement of Line 3 .............................................................................. 70
Figure D.11 Settlement of Line 4 .............................................................................. 70
Figure D.12 Horizontal Movements (X) of Line 2. ..................................................... 71
Figure D.13 Horizontal Movements (X) of Line 3. ..................................................... 71
Figure D.14 Horizontal Movements (X) of Line 4. ..................................................... 72
Figure D.15 Horizontal Movements (Y) of Line 2. ..................................................... 72
Figure D.16 Horizontal Movements (Y) of Line 4. ..................................................... 73
Figure D.17 Settlement of Line 1 .............................................................................. 73
Figure D.18 Settlement of Line 2 .............................................................................. 74
Figure D.19 Settlement of Line 3 .............................................................................. 74
Figure D.20 Settlement of Line 4 .............................................................................. 75
Figure D.21 Horizontal Movements (X) of Line 1. ..................................................... 75
Figure D.22 Horizontal Movements (X) of Line 2. ..................................................... 76
Figure D.23 Horizontal Movements (X) of Line 3. ..................................................... 76
Figure D.24 Horizontal Movements (X) of Line 4 ...................................................... 77
Figure D.25 Horizontal Movements (Y) of Line 1 ...................................................... 77

Glossary
Vauxhall Bridge - Assessment Report 315-RG-TPI-BR010-000001 Revision - AF Date approved -
Page 34 Uncontrolled when printed Printed 26/10/2012
CONFIDENTIAL
Figure D.26 Horizontal Movements (Y) of Line 2. ..................................................... 78
Figure D.27 Horizontal Movements (Y) of Line 3. ..................................................... 78
Figure D.28 Horizontal Movements (Y) of Line 4. ..................................................... 79
Figure E.1 Axis System relative to bridge deck ........................................................ 81
List of tables
Page number
Table C.1 Thames Tunnel assessment parameters ................................................. 46
Table C.2 Foundation Information ............................................................................ 46
Table C.3 Pier 3 ........................................................................................................ 47
Table C.4 Lambeth Pier ............................................................................................ 47
Table D.1 CSO Works assessment parameters ....................................................... 57
Table D.2 Short term geotechnical parameters ........................................................ 59
Table D.3 Long term geotechnical parameters ......................................................... 59
Table D.4 Levels used in the ground movement assessment .................................. 59
Table D.5 Results Pier foundation level – Settlements ............................................. 65
Table D.6 Results Abutment foundation level - Settlements ..................................... 66
Table D.7 Results Pier foundation level – Horizontal Movements ............................ 67
Table D.8 Results Abutment foundation level – Horizontal Movements ................... 68

Appendices
Vauxhall Bridge - Assessment Report 315-RG-TPI-BR010-000001 Revision - AF Date approved -
Page 35 Uncontrolled when printed Printed 26/10/2012
CONFIDENTIAL
Appendix A – Load Summary

Appendices
Vauxhall Bridge - Assessment Report 315-RG-TPI-BR010-000001 Revision - AF Date approved -
Page 36 Uncontrolled when printed Printed 26/10/2012
DRAFT AND CONFIDENTIAL
A.1 Thames Tunnel – Total Load Summary
Project Thames Tunnel Assessments
Vauxhall Bridge
Part of Structure Calc sheet no. Results
Drawing Ref Calc By Date Check by Date
JMS
Ref Calculations
Max Values
FX (kN) FY (kN) FZ (kN) FX (kN) FY (kN) FZ (kN) MX (kNm) MY (kNm) MZ (kNm) MX (kNm) MY (kNm) MZ (kNm)
Outer Arch End Members Span 1 (Shore Span) 70.5 4.3 87.7 116.6 6.3 94.1 0.1 74.5 10.0 0.1 6.5 9.0 Outer Arch FX (kN) FY (kN) FZ (kN) MX (kNm)MY (kNm)MZ (kNm)
Outer Arch End Members Span 2 (Intermediate Span) 65.6 4.0 136.0 156.9 6.1 133.2 0.1 12.7 8.9 0.1 102.9 9.1 Previous Assessment Loads 4870.0 - 178.0 - 1124.0 -
Outer Arch End Members Span 3 (Central Span) 84.3 6.3 54.4 48.4 3.2 51.3 0.1 40.3 14.2 0.0 6.9 14.8 Previous Assessment Resistance 7111.0 - 974.0 - 2169.0 -
Max 84.3 6.3 136.0 156.9 6.3 133.2 0.1 74.5 14.2 0.1 102.9 14.8 Additonal Load 397.8 - 163.2 - 325.1 -
1.2*Max 101.2 7.6 163.2 188.3 7.6 159.8 0.2 89.4 17.0 0.2 123.5 17.8 % Increase 7.6% - 47.8% - 22.4% -
1.2*Min -188.3 -7.6 -159.8 -101.2 -7.6 -163.2 -0.2 -125.0 -17.6 -0.2 -92.0 -16.7 Total Load 5267.8 - 341.2 - 1449.1 -
Outer Arch Central Members Span 1 (Shore Span) 0.2 12.4 29.3 229.3 11.3 28.8 0.1 189.1 9.1 0.1 -6.3 10.8 Usage 0.74 - 0.35 - 0.67 -
Outer Arch Central Members Span 2 (Intermediate Span) 331.5 3.9 47.9 -4.1 4.9 48.0 0.1 -9.0 3.4 0.1 270.9 3.5 - - -
Outer Arch Central Members Span 3 (Central Span) 23.3 3.6 19.7 125.8 3.2 20.6 0.0 106.5 4.7 0.0 -2.8 5.5
Max 331.5 12.4 47.9 229.3 11.3 48.0 0.1 189.1 9.1 0.1 270.9 10.8
1.2*Max 397.8 14.8 57.5 275.2 13.5 57.6 0.1 226.9 10.9 0.1 325.1 13.0
1.2*Min -275.2 -13.5 -57.6 -397.8 -14.8 -57.5 -0.1 -325.1 -11.6 -0.1 -226.7 -11.4
Usage Variance 5% - 41% - 19% -
InnerArch End Members Span 1 (Shore Span) -10.336 4.115 50.266 276.009 6.198 50.607 0.127 198.581 9.568 0.083 0 9.406 Inner Arch FX (kN) FY (kN) FZ (kN) MX (kNm)MY (kNm)MZ (kNm)
Inner Arch End Members Span 2 (Intermediate Span) 388 3.7 66.9 -18.3 5.7 67.2 0.1 0 8.5 0.1 258.7 8.6 Previous Assessment Loads 7011.0 - 213.0 - 1333.0 -
Inner Arch End Members Span 3 (Central Span) -5.075 6.228 24.569 136.068 4.039 24.997 0.073 94.173 13.811 0.116 0 14.739 Previous Assessment Resistance 7618.0 - 1240.0 - 3656.0 -
Max 388.0 6.2 66.9 276.0 6.2 67.2 0.1 198.6 13.8 0.1 258.7 14.7 Additonal Load 465.6 - 80.6 - 773.4 -
1.2*Max 465.6 7.5 80.3 331.2 7.4 80.6 0.2 238.3 16.6 0.1 310.4 17.7 % Increase 6.2% - 27.5% - 36.7% -
1.2*Min -331.2 -7.4 -80.6 -465.6 -7.5 -80.3 -0.1 -310.1 -17.3 -0.2 -238.8 -16.1 Total Load 7476.6 - 293.6 - 2106.4 -
InnerArch Central Members Span 1 (Shore Span) -7.082 12.98 39.329 205.765 11.537 39.026 0.12 446.645 9.95 0.097 -18.165 10.703 Usage 0.98 - 0.24 - 0.58 -
Inner Arch Central Members Span 2 (Intermediate Span) 252.2 5.2 50 -8 7.5 54.9 0.2 -28.5 4.1 0.1 644.5 4.3 - - -
Inner Arch Central Members Span 3 (Central Span) -2.217 5.62 24.81 99.689 3.343 23.816 0.057 252.044 6.186 0.072 -10.656 6.951
Max 252.2 13.0 50.0 205.8 11.5 54.9 0.2 446.6 10.0 0.1 644.5 10.7
1.2*Max 302.6 15.6 60.0 246.9 13.8 65.9 0.2 536.0 11.9 0.1 773.4 12.8
1.2*Min -246.9 -13.8 -65.9 -302.6 -15.6 -60.0 -0.1 -773.4 -11.4 -0.2 -535.8 -11.3
Usage Variance 5% - 22% - 33% -
10"x6"x42lbs-verticals Span 1 (Shore Span) 134.131 11.865 25.154 61.088 13.31 25.102 0.007 8.278 3.031 0.007 11.121 1.776 10"x6"x42lbs-verticals
FX (kN)
Comp
FX (kN)
Tens MY (kN) FX+MY
10"x6"x42lbs-verticals Span 2 (Intermediate Span) 77.4 2.7 27.8 194 3.1 27.7 0 13.5 0.6 0 17.2 1 Previous Assessment Loads 516.0 516.0 54.0 -
10"x6"x42lbs-verticals Span 3 (Central Span) 78.247 2.884 11.517 29.025 2.35 10.767 0.002 5.307 0.569 0.004 6.474 0.652 Previous Assessment Resistance 1190.0 1190.0 121.0 0.88
Max 134.1 11.9 27.8 194.0 13.3 27.7 0.0 13.5 3.0 0.0 17.2 1.8 Additonal Load 161.0 232.8 20.6 -
1.2*Max 161.0 14.2 33.4 232.8 16.0 33.2 0.0 16.2 3.6 0.0 20.6 2.1 % Increase 23.8% 31.1% 27.7% 25.79%
1.2*Min -232.8 -16.0 -33.2 -161.0 -14.2 -33.4 0.0 -16.2 -4.1 0.0 -20.6 -2.4 Total Load 677.0 748.8 74.6 1.19
Usage 0.57 0.63 0.62 1.19
FAILS
Usage Variance 20% 27% 15% 1%
3.5"x3.5"x716" Bracing Span 1 (Shore Span) 6.785 0.14 0.112 8.671 0.148 0.082 0.001 0.081 0.125 0.001 0.084 0.12 3.5"x3.5"x716" Bracing FX (kN) FX Connection
3.5"x3.5"x716" Bracing Span 2 (Intermediate Span) 12.9 0.2 0.2 8.5 0.2 0.2 0 0.2 0.1 0 0.2 0.1 Previous Assessment Loads -
3.5"x3.5"x716" Bracing Span 3 (Central Span) 4.612 0.08 0.099 5.864 0.11 0.127 0.001 0.111 0.07 0.001 0.113 0.07 Condition Factor Considered 1 0.95 0.9 0.85 -
Max 12.9 0.2 0.2 8.7 0.2 0.2 0.0 0.2 0.1 0.0 0.2 0.1 Assessment Resistance 154.5 147.3 140.0 125.3 81.2
1.2*Max 15.5 0.2 0.2 10.4 0.2 0.2 0.0 0.2 0.2 0.0 0.2 0.1 Additonal Load 15.5 15.5 15.5 15.5 15.5
1.2*Min -10.4 -0.2 -0.2 -15.5 -0.2 -0.2 0.0 -0.2 -0.2 0.0 -0.2 -0.2 % Increase 10.0% 10.5% 11.1% 12.4% 19.1%
8"x6"x35lbs Floor Joist Span 1 (Shore Span) 14.069 1.139 2.925 1.736 1.217 1.361 0.006 2.445 0.984 0.006 0.334 1.02 8"x6"x35lbs Floor Joist FX (kN) FY (kN) FZ (kN) MX (kNm)MY (kNm)MZ (kNm)
8"x6"x35lbs Floor Joist Span 2 (Intermediate Span) 4.9 1.4 2.2 9.3 1.3 2.5 0 0.8 1.2 0 3.8 1.2 Previous Assessment Loads - - 178.0 - 83.6 -
8"x6"x35lbs Floor Joist Span 3 (Central Span) 3.207 0.627 1.339 1.946 0.71 1.041 0.003 1.484 0.543 0.003 1.034 0.561 Previous Assessment Resistance - - 201.0 - 90.3 -
Max 14.1 1.4 2.9 9.3 1.3 2.5 0.0 2.4 1.2 0.0 3.8 1.2 Additonal Load - - 3.5 - 4.8 -
1.2*Max 16.9 1.7 3.5 11.2 1.6 3.0 0.0 2.9 1.4 0.0 4.6 1.4 % Increase - - 1.9% - 5.4% -
1.2*Min -11.2 -1.6 -3.0 -16.9 -1.7 -3.5 0.0 -4.8 -1.4 0.0 -2.9 -1.4 Total Load - - 181.5 - 88.4 -
Usage - - 0.90 - 0.98 -
- - - -
Section 5
Section 6
Section 7
Section 1
Section 2
Section 3
Section 4
End 1 End 2 End 1 End 2
Job ref
5099103
Previous Assessment
does not consider loading
in this member.
Therefore this calculation
just considers percentage
increase in load
compared with overall
Output

Appendices
Vauxhall Bridge - Assessment Report 315-RG-TPI-BR010-000001 Revision - AF Date approved -
Page 37 Uncontrolled when printed Printed 26/10/2012
DRAFT AND CONFIDENTIAL
12"x6"x52lbs Inner beam Span 1 (Shore Span) 36.612 10.533 9.819 0.306 11.332 8.794 0.015 12.754 26.699 0.015 13.988 27.524 12"x6"x52lbs Inner beam FX (kN) FY (kN) FZ (kN) MX (kNm)MY (kNm)MZ (kNm)
12"x6"x52lbs Inner beam Span 2 (Intermediate Span) 0.3 11.1 91.7 57 11.1 93.7 0 42.9 31.4 0 16.1 6.9 Previous Assessment Loads - - 366.0 - 242.0 -
12"x6"x52lbs Inner beam Span 3 (Central Span) 31.11 10.281 5.032 0.088 5.374 5.833 0.014 6.24 9.969 0.016 7.543 25.728 Previous Assessment Resistance - - 358.0 - 204.7 -
Max 36.6 11.1 91.7 57.0 11.3 93.7 0.0 42.9 31.4 0.0 16.1 27.5 Additonal Load 68.4 13.3 112.4 - 51.5 37.7
F 43.9 13.3 110.0 68.4 13.6 112.4 0.0 51.5 37.7 0.0 19.3 33.0 % Increase - - 23.5% - 17.5% -
1.2*Min -68.4 -13.6 -112.4 -43.9 -13.3 -110.0 0.0 -19.1 -32.2 0.0 -50.4 -37.8 Total Load - - 478.4 - 293.5 -
Usage - - 1.34 - 1.43 -
- - FAILS - FAILS -
Usage Variance - - 22% - 1% -
18"x7"x78lbs outer beam Span 1 (Shore Span) 70.344 1.892 65.731 8.451 2.269 72.758 0.061 16.946 0.693 0.059 101.693 0.837 18"x7"x78lbs outer beam FX (kN) FY (kN) FZ (kN) MX (kNm)MY (kNm)MZ (kNm)
18"x7"x78lbs outer beam Span 2 (Intermediate Span) 7 3.3 99.3 117 3.2 97.5 0.6 153.5 0.8 0.7 24.7 0.9 Previous Assessment Loads - - 366.0 - 242.0 -
18"x7"x78lbs outer beam Span 3 (Central Span) 39.606 1.08 39.072 2.924 1.465 39.175 0.299 8.224 0.497 0.185 61.548 0.419 Assessment Resistance - - 814.3 - 447.6 -
Max 70.3 3.3 99.3 117.0 3.2 97.5 0.6 153.5 0.8 0.7 101.7 0.9 Additonal Load - - 119.2 - 184.2 -
1.2*Max 84.4 4.0 119.2 140.4 3.8 117.0 0.7 184.2 1.0 0.8 122.0 1.1 % Increase - - 24.6% - 43.2% -
1.2*Min -140.4 -3.8 -117.0 -84.4 -4.0 -119.2 -0.8 -136.3 -1.2 -0.7 -180.4 -1.0 Total Load - - 485.2 - 426.2 -
Usage - - 0.60 - 0.95 -
- - - -
Usage Variance - - 21% - 38% -
Cross Beam 1 Span 1 (Shore Span) 23.226 3.879 3.454 -0.044 1.219 3.095 0.004 6.067 3.87 0.004 7.383 3.864 Cross Beam 1 FX (kN) FY (kN) FZ (kN) MX (kNm)MY (kNm)MZ (kNm)
Cross Beam 1 Span 2 (Intermediate Span) 0 1.1 9 40.6 0.5 6.6 0 11.2 1.1 0 8.8 1.2 Previous Assessment Loads - - -
Cross Beam 1 Span 3 (Central Span) 16.553 0.031 4.882 0.061 3.959 4.318 0.004 4.942 0.037 0.003 5.802 0.026 Previous Assessment Resistance 4367.0 1662.0 1813.5
Max 23.2 3.9 9.0 40.6 4.0 6.6 0.0 11.2 3.9 0.0 8.8 3.9 Additonal Load 48.7 10.8 15.8
1.2*Max 27.9 4.7 10.8 48.7 4.8 7.9 0.0 13.4 4.6 0.0 10.6 4.6 % Increase 1.1% - 0.6% - 0.9% -
1.2*Min -48.7 -4.8 -7.9 -27.9 -4.7 -10.8 0.0 -10.8 -4.7 0.0 -15.8 -4.7 Total Load - - -
Usage - - -
- - -
Cross Beam 2 Span 1 (Shore Span) 25.359 7.198 11.026 27.065 7.319 4.78 0.02 3.571 6.359 0.019 8.65 6.384 Cross Beam 2 FX (kN) FY (kN) FZ (kN) MX (kNm)MY (kNm)MZ (kNm)
Cross Beam 2 Span 2 (Intermediate Span) 43.9 10.3 14.1 44 8.6 14.2 0.1 22.4 9.1 0 18.1 9.1 Previous Assessment Loads - - -
Cross Beam 2 Span 3 (Central Span) 17.176 2.008 5.489 16.943 6.406 5.092 0.014 6.653 1.763 0.016 7.937 1.792 Previous Assessment Resistance 3775.0 1049.2 1096.0
Max 43.9 10.3 14.1 44.0 8.6 14.2 0.1 22.4 9.1 0.0 18.1 9.1 Additonal Load 52.7 17.0 26.9
1.2*Max 52.7 12.4 16.9 52.8 10.3 17.0 0.1 26.9 10.9 0.0 21.7 10.9 % Increase 1.4% - 1.6% - 2.5% -
1.2*Min -52.8 -10.3 -17.0 -52.7 -12.4 -16.9 0.0 -22.2 -9.1 -0.1 -26.9 -9.1 Total Load - - -
Usage - - -
- - -
Usage Variance - - - - - -
Cross Bracing 1 Span 1 (Shore Span) 75.38 0.107 2.143 87.438 0.106 0.36 0.001 11.319 0.29 0.001 2.231 0.261 Cross Bracing 1 FX (kN) FY (kN) FZ (kN) MX (kNm)MY (kNm)MZ (kNm)
Cross Bracing 1 Span 2 (Intermediate Span) 135.3 0.1 4.4 118.1 0.1 7.4 0 6.1 0.3 0 33.9 0.3 Previous Assessment Loads - - - - -
Cross Bracing 1 Span 3 (Central Span) 48.301 0.042 1.584 52.077 0.109 1.507 0.001 8.926 0.088 0.001 3.461 0.082 Previous Assessment Resistance 656.0
Max 135.3 0.1 4.4 118.1 0.1 7.4 0.0 11.3 0.3 0.0 33.9 0.3 Additonal Load 135.1
1.2*Max 162.4 0.1 5.3 141.7 0.1 8.9 0.0 13.6 0.4 0.0 40.7 0.4 % Increase 20.6% - - - - -
1.2*Min -141.7 -0.1 -8.9 -162.4 -0.1 -5.3 0.0 -33.0 -0.4 0.0 -14.4 -0.3 Total Load - - - - -
Usage - - - - -
- - - - -
Cross Bracing 2 Span 1 (Shore Span) 17.479 0.154 4.209 40.941 0.11 4.863 0.001 30.735 0.365 0.001 4.328 0.368 Cross Bracing 2 FX (kN) FY (kN) FZ (kN) MX (kNm)MY (kNm)MZ (kNm)
Cross Bracing 2 Span 2 (Intermediate Span) 48.1 0.1 8.1 4.7 0.1 8 0 10.1 0.2 0 60.5 0.1 Previous Assessment Loads - - - - -
Cross Bracing 2 Span 3 (Central Span) 20.545 0.03 1.483 34.049 0.138 3.301 0.001 22.821 0.04 0.001 5.209 0.075 Previous Assessment Resistance 656.0
Max 48.1 0.2 8.1 40.9 0.1 8.0 0.0 30.7 0.4 0.0 60.5 0.4 Additonal Load 92.4
1.2*Max 57.7 0.2 9.7 49.1 0.2 9.6 0.0 36.9 0.4 0.0 72.6 0.4 % Increase 14.1% - - - - -
1.2*Min -49.1 -0.2 -9.6 -57.7 -0.2 -9.7 0.0 -72.1 -0.3 0.0 -39.2 -0.4 Total Load - - - - -
Usage - - - - -
- - - - -
Usage Variance - - - - - -
Note: For Fx: end 1, tension is negative and compression is positive. For End
2, the signs are reversed.
Section 12
Section 13
Section 14
Section 8
Section 11
Section 9 Note that the loading is
assummed the same as for
section 8 and the resistances
have been calculated. This
section was not considered in
the previous calculations
Previous Assessment does not
consider loading in this member.
Therefore this calculation just
considers percentage increase in
load compared with overall
resistance
Previous Assessment does not
consider loading in this member.
Therefore this calculation just
considers percentage increase in
load compared with overall
resistance
Previous Assessment does not
consider loading in this member.
Therefore this calculation just
considers percentage increase in
load compared with overall
resistance
Previous Assessment does not
consider loading in this member.
Therefore this calculation just
considers percentage increase in
load compared with overall
resistance

Appendices
Vauxhall Bridge - Assessment Report 315-RG-TPI-BR010-000001 Revision - AF Date approved -
Page 38 Uncontrolled when printed Printed 26/10/2012
DRAFT AND CONFIDENTIAL
A.2 Thames Tunnel – Long Term Loading
Project Thames Tunnel Assessments
Vauxhall Bridge
Part of Structure Calc sheet no. Results
Drawing Ref Calc By Date Check by Date
JMS
Ref Calculations
Max Values
FX (kN) FY (kN) FZ (kN) FX (kN) FY (kN) FZ (kN) MX (kNm) MY (kNm) MZ (kNm) MX (kNm) MY (kNm) MZ (kNm)
Outer Arch End Members Span 1 (Shore Span) 70.5 4.3 87.7 116.6 6.3 94.1 0.1 74.5 10.0 0.1 6.5 9.0 Outer Arch FX (kN) FY (kN) FZ (kN) MX (kNm)MY (kNm)MZ (kNm)
Outer Arch End Members Span 2 (Intermediate Span) 65.6 4.0 136.0 156.9 6.1 133.2 0.1 12.7 8.9 0.1 102.9 9.1 Previous Assessment Loads 4870.0 - 178.0 - 1124.0 -
Outer Arch End Members Span 3 (Central Span) 84.3 6.3 54.4 48.4 3.2 51.3 0.1 40.3 14.2 0.0 6.9 14.8 Previous Assessment Resistance 7111.0 - 974.0 - 2169.0 -
Max 84.3 6.3 136.0 156.9 6.3 133.2 0.1 74.5 14.2 0.1 102.9 14.8 Additonal Load 397.8 - 163.2 - 325.1 -
1.2*Max 101.2 7.6 163.2 188.3 7.6 159.8 0.2 89.4 17.0 0.2 123.5 17.8 % Increase 7.6% - 47.8% - 22.4% -
1.2*Min -188.3 -7.6 -159.8 -101.2 -7.6 -163.2 -0.2 -125.0 -17.6 -0.2 -92.0 -16.7 Total Load 5267.8 - 341.2 - 1449.1 -
Outer Arch Central Members Span 1 (Shore Span) 0.2 12.4 29.3 229.3 11.3 28.8 0.1 189.1 9.1 0.1 -6.3 10.8 Usage 0.74 - 0.35 - 0.67 -
Outer Arch Central Members Span 2 (Intermediate Span) 331.5 3.9 47.9 -4.1 4.9 48.0 0.1 -9.0 3.4 0.1 270.9 3.5 - - -
Outer Arch Central Members Span 3 (Central Span) 23.3 3.6 19.7 125.8 3.2 20.6 0.0 106.5 4.7 0.0 -2.8 5.5
Max 331.5 12.4 47.9 229.3 11.3 48.0 0.1 189.1 9.1 0.1 270.9 10.8
1.2*Max 397.8 14.8 57.5 275.2 13.5 57.6 0.1 226.9 10.9 0.1 325.1 13.0
1.2*Min -275.2 -13.5 -57.6 -397.8 -14.8 -57.5 -0.1 -325.1 -11.6 -0.1 -226.7 -11.4
Usage Variance 5% - 41% - 19% -
InnerArch End Members Span 1 (Shore Span) -10.336 4.115 50.266 276.009 6.198 50.607 0.127 198.581 9.568 0.083 0 9.406 Inner Arch FX (kN) FY (kN) FZ (kN) MX (kNm)MY (kNm)MZ (kNm)
Inner Arch End Members Span 2 (Intermediate Span) 388 3.7 66.9 -18.3 5.7 67.2 0.1 0 8.5 0.1 258.7 8.6 Previous Assessment Loads 7011.0 - 213.0 - 1333.0 -
Inner Arch End Members Span 3 (Central Span) -5.075 6.228 24.569 136.068 4.039 24.997 0.073 94.173 13.811 0.116 0 14.739 Previous Assessment Resistance 7618.0 - 1240.0 - 3656.0 -
Max 388.0 6.2 66.9 276.0 6.2 67.2 0.1 198.6 13.8 0.1 258.7 14.7 Additonal Load 465.6 - 80.6 - 773.4 -
1.2*Max 465.6 7.5 80.3 331.2 7.4 80.6 0.2 238.3 16.6 0.1 310.4 17.7 % Increase 6.2% - 27.5% - 36.7% -
1.2*Min -331.2 -7.4 -80.6 -465.6 -7.5 -80.3 -0.1 -310.1 -17.3 -0.2 -238.8 -16.1 Total Load 7476.6 - 293.6 - 2106.4 -
InnerArch Central Members Span 1 (Shore Span) -7.082 12.98 39.329 205.765 11.537 39.026 0.12 446.645 9.95 0.097 -18.165 10.703 Usage 0.98 - 0.24 - 0.58 -
Inner Arch Central Members Span 2 (Intermediate Span) 252.2 5.2 50 -8 7.5 54.9 0.2 -28.5 4.1 0.1 644.5 4.3 - - -
Inner Arch Central Members Span 3 (Central Span) -2.217 5.62 24.81 99.689 3.343 23.816 0.057 252.044 6.186 0.072 -10.656 6.951
Max 252.2 13.0 50.0 205.8 11.5 54.9 0.2 446.6 10.0 0.1 644.5 10.7
1.2*Max 302.6 15.6 60.0 246.9 13.8 65.9 0.2 536.0 11.9 0.1 773.4 12.8
1.2*Min -246.9 -13.8 -65.9 -302.6 -15.6 -60.0 -0.1 -773.4 -11.4 -0.2 -535.8 -11.3
Usage Variance 5% - 22% - 33% -
10"x6"x42lbs-verticals Span 1 (Shore Span) 134.131 11.865 25.154 61.088 13.31 25.102 0.007 8.278 3.031 0.007 11.121 1.776 10"x6"x42lbs-verticals
FX (kN)
Comp
FX (kN)
Tens MY (kN) FX+MY
10"x6"x42lbs-verticals Span 2 (Intermediate Span) 77.4 2.7 27.8 194 3.1 27.7 0 13.5 0.6 0 17.2 1 Previous Assessment Loads 516.0 516.0 54.0 -
10"x6"x42lbs-verticals Span 3 (Central Span) 78.247 2.884 11.517 29.025 2.35 10.767 0.002 5.307 0.569 0.004 6.474 0.652 Previous Assessment Resistance 1190.0 1190.0 121.0 0.88
Max 134.1 11.9 27.8 194.0 13.3 27.7 0.0 13.5 3.0 0.0 17.2 1.8 Additonal Load 161.0 232.8 20.6 -
1.2*Max 161.0 14.2 33.4 232.8 16.0 33.2 0.0 16.2 3.6 0.0 20.6 2.1 % Increase 23.8% 31.1% 27.7% 25.79%
1.2*Min -232.8 -16.0 -33.2 -161.0 -14.2 -33.4 0.0 -16.2 -4.1 0.0 -20.6 -2.4 Total Load 677.0 748.8 74.6 1.19
Usage 0.57 0.63 0.62 1.19
FAILS
Usage Variance 20% 27% 15% 1%
3.5"x3.5"x716" Bracing Span 1 (Shore Span) 6.785 0.14 0.112 8.671 0.148 0.082 0.001 0.081 0.125 0.001 0.084 0.12 3.5"x3.5"x716" Bracing FX (kN) FX Connection
3.5"x3.5"x716" Bracing Span 2 (Intermediate Span) 12.9 0.2 0.2 8.5 0.2 0.2 0 0.2 0.1 0 0.2 0.1 Previous Assessment Loads -
3.5"x3.5"x716" Bracing Span 3 (Central Span) 4.612 0.08 0.099 5.864 0.11 0.127 0.001 0.111 0.07 0.001 0.113 0.07 Condition Factor Considered 1 0.95 0.9 0.85 -
Max 12.9 0.2 0.2 8.7 0.2 0.2 0.0 0.2 0.1 0.0 0.2 0.1 Assessment Resistance 154.5 147.3 140.0 125.3 81.2
1.2*Max 15.5 0.2 0.2 10.4 0.2 0.2 0.0 0.2 0.2 0.0 0.2 0.1 Additonal Load 15.5 15.5 15.5 15.5 15.5
1.2*Min -10.4 -0.2 -0.2 -15.5 -0.2 -0.2 0.0 -0.2 -0.2 0.0 -0.2 -0.2 % Increase 10.0% 10.5% 11.1% 12.4% 19.1%
8"x6"x35lbs Floor Joist Span 1 (Shore Span) 14.069 1.139 2.925 1.736 1.217 1.361 0.006 2.445 0.984 0.006 0.334 1.02 8"x6"x35lbs Floor Joist FX (kN) FY (kN) FZ (kN) MX (kNm)MY (kNm)MZ (kNm)
8"x6"x35lbs Floor Joist Span 2 (Intermediate Span) 4.9 1.4 2.2 9.3 1.3 2.5 0 0.8 1.2 0 3.8 1.2 Previous Assessment Loads - - 178.0 - 83.6 -
8"x6"x35lbs Floor Joist Span 3 (Central Span) 3.207 0.627 1.339 1.946 0.71 1.041 0.003 1.484 0.543 0.003 1.034 0.561 Previous Assessment Resistance - - 201.0 - 90.3 -
Max 14.1 1.4 2.9 9.3 1.3 2.5 0.0 2.4 1.2 0.0 3.8 1.2 Additonal Load - - 3.5 - 4.8 -
1.2*Max 16.9 1.7 3.5 11.2 1.6 3.0 0.0 2.9 1.4 0.0 4.6 1.4 % Increase - - 1.9% - 5.4% -
1.2*Min -11.2 -1.6 -3.0 -16.9 -1.7 -3.5 0.0 -4.8 -1.4 0.0 -2.9 -1.4 Total Load - - 181.5 - 88.4 -
Usage - - 0.90 - 0.98 -
- - - -
Section 5
Section 6
Section 7
Section 1
Section 2
Section 3
Section 4
End 1 End 2 End 1 End 2
Job ref
5099103
Previous Assessment
does not consider loading
in this member.
Therefore this calculation
just considers percentage
increase in load
compared with overall
Output

Appendices
Vauxhall Bridge - Assessment Report 315-RG-TPI-BR010-000001 Revision - AF Date approved -
Page 39 Uncontrolled when printed Printed 26/10/2012
DRAFT AND CONFIDENTIAL
12"x6"x52lbs Inner beam Span 1 (Shore Span) 36.612 10.533 9.819 0.306 11.332 8.794 0.015 12.754 26.699 0.015 13.988 27.524 12"x6"x52lbs Inner beam FX (kN) FY (kN) FZ (kN) MX (kNm)MY (kNm)MZ (kNm)
12"x6"x52lbs Inner beam Span 2 (Intermediate Span) 0.3 11.1 91.7 57 11.1 93.7 0 42.9 31.4 0 16.1 6.9 Previous Assessment Loads - - 366.0 - 242.0 -
12"x6"x52lbs Inner beam Span 3 (Central Span) 31.11 10.281 5.032 0.088 5.374 5.833 0.014 6.24 9.969 0.016 7.543 25.728 Previous Assessment Resistance - - 358.0 - 204.7 -
Max 36.6 11.1 91.7 57.0 11.3 93.7 0.0 42.9 31.4 0.0 16.1 27.5 Additonal Load 68.4 13.3 112.4 - 51.5 37.7
F 43.9 13.3 110.0 68.4 13.6 112.4 0.0 51.5 37.7 0.0 19.3 33.0 % Increase - - 23.5% - 17.5% -
1.2*Min -68.4 -13.6 -112.4 -43.9 -13.3 -110.0 0.0 -19.1 -32.2 0.0 -50.4 -37.8 Total Load - - 478.4 - 293.5 -
Usage - - 1.34 - 1.43 -
- - FAILS - FAILS -
Usage Variance - - 22% - 1% -
18"x7"x78lbs outer beam Span 1 (Shore Span) 70.344 1.892 65.731 8.451 2.269 72.758 0.061 16.946 0.693 0.059 101.693 0.837 18"x7"x78lbs outer beam FX (kN) FY (kN) FZ (kN) MX (kNm)MY (kNm)MZ (kNm)
18"x7"x78lbs outer beam Span 2 (Intermediate Span) 7 3.3 99.3 117 3.2 97.5 0.6 153.5 0.8 0.7 24.7 0.9 Previous Assessment Loads - - 366.0 - 242.0 -
18"x7"x78lbs outer beam Span 3 (Central Span) 39.606 1.08 39.072 2.924 1.465 39.175 0.299 8.224 0.497 0.185 61.548 0.419 Assessment Resistance - - 814.3 - 447.6 -
Max 70.3 3.3 99.3 117.0 3.2 97.5 0.6 153.5 0.8 0.7 101.7 0.9 Additonal Load - - 119.2 - 184.2 -
1.2*Max 84.4 4.0 119.2 140.4 3.8 117.0 0.7 184.2 1.0 0.8 122.0 1.1 % Increase - - 24.6% - 43.2% -
1.2*Min -140.4 -3.8 -117.0 -84.4 -4.0 -119.2 -0.8 -136.3 -1.2 -0.7 -180.4 -1.0 Total Load - - 485.2 - 426.2 -
Usage - - 0.60 - 0.95 -
- - - -
Usage Variance - - 21% - 38% -
Cross Beam 1 Span 1 (Shore Span) 23.226 3.879 3.454 -0.044 1.219 3.095 0.004 6.067 3.87 0.004 7.383 3.864 Cross Beam 1 FX (kN) FY (kN) FZ (kN) MX (kNm)MY (kNm)MZ (kNm)
Cross Beam 1 Span 2 (Intermediate Span) 0 1.1 9 40.6 0.5 6.6 0 11.2 1.1 0 8.8 1.2 Previous Assessment Loads - - -
Cross Beam 1 Span 3 (Central Span) 16.553 0.031 4.882 0.061 3.959 4.318 0.004 4.942 0.037 0.003 5.802 0.026 Previous Assessment Resistance 4367.0 1662.0 1813.5
Max 23.2 3.9 9.0 40.6 4.0 6.6 0.0 11.2 3.9 0.0 8.8 3.9 Additonal Load 48.7 10.8 15.8
1.2*Max 27.9 4.7 10.8 48.7 4.8 7.9 0.0 13.4 4.6 0.0 10.6 4.6 % Increase 1.1% - 0.6% - 0.9% -
1.2*Min -48.7 -4.8 -7.9 -27.9 -4.7 -10.8 0.0 -10.8 -4.7 0.0 -15.8 -4.7 Total Load - - -
Usage - - -
- - -
Cross Beam 2 Span 1 (Shore Span) 25.359 7.198 11.026 27.065 7.319 4.78 0.02 3.571 6.359 0.019 8.65 6.384 Cross Beam 2 FX (kN) FY (kN) FZ (kN) MX (kNm)MY (kNm)MZ (kNm)
Cross Beam 2 Span 2 (Intermediate Span) 43.9 10.3 14.1 44 8.6 14.2 0.1 22.4 9.1 0 18.1 9.1 Previous Assessment Loads - - -
Cross Beam 2 Span 3 (Central Span) 17.176 2.008 5.489 16.943 6.406 5.092 0.014 6.653 1.763 0.016 7.937 1.792 Previous Assessment Resistance 3775.0 1049.2 1096.0
Max 43.9 10.3 14.1 44.0 8.6 14.2 0.1 22.4 9.1 0.0 18.1 9.1 Additonal Load 52.7 17.0 26.9
1.2*Max 52.7 12.4 16.9 52.8 10.3 17.0 0.1 26.9 10.9 0.0 21.7 10.9 % Increase 1.4% - 1.6% - 2.5% -
1.2*Min -52.8 -10.3 -17.0 -52.7 -12.4 -16.9 0.0 -22.2 -9.1 -0.1 -26.9 -9.1 Total Load - - -
Usage - - -
- - -
Usage Variance - - - - - -
Cross Bracing 1 Span 1 (Shore Span) 75.38 0.107 2.143 87.438 0.106 0.36 0.001 11.319 0.29 0.001 2.231 0.261 Cross Bracing 1 FX (kN) FY (kN) FZ (kN) MX (kNm)MY (kNm)MZ (kNm)
Cross Bracing 1 Span 2 (Intermediate Span) 135.3 0.1 4.4 118.1 0.1 7.4 0 6.1 0.3 0 33.9 0.3 Previous Assessment Loads - - - - -
Cross Bracing 1 Span 3 (Central Span) 48.301 0.042 1.584 52.077 0.109 1.507 0.001 8.926 0.088 0.001 3.461 0.082 Previous Assessment Resistance 656.0
Max 135.3 0.1 4.4 118.1 0.1 7.4 0.0 11.3 0.3 0.0 33.9 0.3 Additonal Load 135.1
1.2*Max 162.4 0.1 5.3 141.7 0.1 8.9 0.0 13.6 0.4 0.0 40.7 0.4 % Increase 20.6% - - - - -
1.2*Min -141.7 -0.1 -8.9 -162.4 -0.1 -5.3 0.0 -33.0 -0.4 0.0 -14.4 -0.3 Total Load - - - - -
Usage - - - - -
- - - - -
Cross Bracing 2 Span 1 (Shore Span) 17.479 0.154 4.209 40.941 0.11 4.863 0.001 30.735 0.365 0.001 4.328 0.368 Cross Bracing 2 FX (kN) FY (kN) FZ (kN) MX (kNm)MY (kNm)MZ (kNm)
Cross Bracing 2 Span 2 (Intermediate Span) 48.1 0.1 8.1 4.7 0.1 8 0 10.1 0.2 0 60.5 0.1 Previous Assessment Loads - - - - -
Cross Bracing 2 Span 3 (Central Span) 20.545 0.03 1.483 34.049 0.138 3.301 0.001 22.821 0.04 0.001 5.209 0.075 Previous Assessment Resistance 656.0
Max 48.1 0.2 8.1 40.9 0.1 8.0 0.0 30.7 0.4 0.0 60.5 0.4 Additonal Load 92.4
1.2*Max 57.7 0.2 9.7 49.1 0.2 9.6 0.0 36.9 0.4 0.0 72.6 0.4 % Increase 14.1% - - - - -
1.2*Min -49.1 -0.2 -9.6 -57.7 -0.2 -9.7 0.0 -72.1 -0.3 0.0 -39.2 -0.4 Total Load - - - - -
Usage - - - - -
- - - - -
Usage Variance - - - - - -
Note: For Fx: end 1, tension is negative and compression is positive. For End
2, the signs are reversed.
Section 12
Section 13
Section 14
Section 8
Section 11
Section 9 Note that the loading is
assummed the same as for
section 8 and the resistances
have been calculated. This
section was not considered in
the previous calculations
Previous Assessment does not
consider loading in this member.
Therefore this calculation just
considers percentage increase in
load compared with overall
resistance
Previous Assessment does not
consider loading in this member.
Therefore this calculation just
considers percentage increase in
load compared with overall
resistance
Previous Assessment does not
consider loading in this member.
Therefore this calculation just
considers percentage increase in
load compared with overall
resistance
Previous Assessment does not
consider loading in this member.
Therefore this calculation just
considers percentage increase in
load compared with overall
resistance

Appendices
Vauxhall Bridge - Assessment Report 315-RG-TPI-BR010-000001 Revision - AF Date approved -
Page 40 Uncontrolled when printed Printed 26/10/2012
DRAFT AND CONFIDENTIAL
A.3 Combined Thames Tunnel and CSO – Total Load Summary
Project Thames Tunnel Assessments
Vauxhall Bridge
Part of Structure Calc sheet no. Results
Drawing Ref Calc By Date Check by Date
TA
Ref Calculations
Max Values
FX (kN) FY (kN) FZ (kN) FX (kN) FY (kN) FZ (kN) MX (kNm) MY (kNm) MZ (kNm) MX (kNm) MY (kNm) MZ (kNm)
Outer Arch End Members Span 1 (Shore Span) 144.5 12.7 89.3 235.7 18.8 95.7 0.2 193.5 28.5 0.4 68.6 26.5 Outer Arch FX (kN) FY (kN) FZ (kN) MX (kNm)MY (kNm)MZ (kNm)
Outer Arch End Members Span 2 (Intermediate Span) 335.8 8.8 138.0 174.1 12.7 134.0 0.2 22.2 20.3 0.2 272.3 14.8 Previous Assessment Loads 4870.0 - 178.0 - 1124.0 -
Outer Arch End Members Span 3 (Central Span) Previous Assessment Resistance 7111.0 - 974.0 - 2169.0 -
Max 335.8 12.7 138.0 235.7 18.8 134.0 0.2 193.5 28.5 0.4 272.3 26.5 Additonal Load 402.9 - 165.6 - 326.7 -
1.2*Max 402.9 15.2 165.6 282.9 22.6 160.8 0.2 232.2 34.2 0.4 326.7 31.8 % Increase 7.6% - 48.2% - 22.5% -
1.2*Min -282.9 -22.6 -159.8 -173.4 -15.2 -163.2 -0.4 -125.0 -48.1 -0.2 -232.2 -52.3 Total Load 5272.9 - 343.6 - 1450.7 -
Outer Arch Central Members Span 1 (Shore Span) 144.5 12.7 89.3 235.7 18.8 95.7 0.2 193.5 28.5 0.4 68.6 26.5 Usage 0.74 - 0.35 - 0.67 -
Outer Arch Central Members Span 2 (Intermediate Span) 335.8 8.8 138.0 174.1 12.7 134.0 0.2 22.2 20.3 0.2 272.3 14.8 - - -
Outer Arch Central Members Span 3 (Central Span)
Max 335.8 12.7 138.0 235.7 18.8 134.0 0.2 193.5 28.5 0.4 272.3 26.5
1.2*Max 402.9 15.2 165.6 282.9 22.6 160.8 0.2 232.2 34.2 0.4 326.7 31.8
1.2*Min -282.9 -22.6 -114.9 -397.8 -15.2 -107.1 -0.4 -325.1 -48.1 -0.2 -232.2 -52.3
Usage Variance 7% - 42% - 19% -
InnerArch End Members Span 1 (Shore Span) 95.838 13.572 51.182 281.447 19.107 52.285 0.281 457.244 29.647 0.195 161.71 28.188 Inner Arch FX (kN) FY (kN) FZ (kN) MX (kNm)MY (kNm)MZ (kNm)
Inner Arch End Members Span 2 (Intermediate Span) 391.292 7.98 70.3 39.056 11.314 67.56 0.218 51.542 18.622 0.181 647.8 14.554 Previous Assessment Loads 7011.0 - 213.0 - 1333.0 -
Inner Arch End Members Span 3 (Central Span) Previous Assessment Resistance 7618.0 - 1240.0 - 3656.0 -
Max 391.3 13.6 70.3 281.4 19.1 67.6 0.3 457.2 29.6 0.2 647.8 28.2 Additonal Load 469.6 - 81.1 - 777.4 -
1.2*Max 469.6 16.3 84.4 337.7 22.9 81.1 0.3 548.7 35.6 0.2 777.4 33.8 % Increase 6.3% - 27.6% - 36.8% -
1.2*Min -337.7 -22.9 -80.6 -465.6 -16.3 -80.3 -0.2 -310.1 -45.7 -0.3 -548.7 -48.5 Total Load 7480.6 - 294.1 - 2110.4 -
InnerArch Central Members Span 1 (Shore Span) 95.838 13.572 51.182 281.447 19.107 52.285 0.281 457.244 29.647 0.195 161.71 28.188 Usage 0.98 - 0.24 - 0.58 -
Inner Arch Central Members Span 2 (Intermediate Span) 391.292 7.98 70.3 39.056 11.314 67.56 0.218 51.542 18.622 0.181 647.8 14.554 - - -
Inner Arch Central Members Span 3 (Central Span)
Max 391.3 13.6 70.3 281.4 19.1 67.6 0.3 457.2 29.6 0.2 647.8 28.2
1.2*Max 469.6 16.3 84.4 337.7 22.9 81.1 0.3 548.7 35.6 0.2 777.4 33.8
1.2*Min -337.7 -22.9 -65.9 -302.6 -16.3 -61.4 -0.2 -773.4 -45.7 -0.3 -548.7 -48.5
Usage Variance 6% - 23% - 33% -
10"x6"x42lbs-verticals Span 1 (Shore Span) 137.996 15.118 25.848 63.091 14.904 25.626 0.016 8.529 3.867 0.009 12.184 2.257 10"x6"x42lbs-verticals
FX (kN)
Comp
FX (kN)
Tens MY (kN) FX+MY
10"x6"x42lbs-verticals Span 2 (Intermediate Span) 77.822 2.777 27.976 195.619 3.208 27.946 0.005 13.651 0.862 0.006 17.386 1.23 Previous Assessment Loads 516.0 516.0 54.0 -
10"x6"x42lbs-verticals Span 3 (Central Span) Previous Assessment Resistance 1190.0 1190.0 121.0 0.88
Max 138.0 15.1 28.0 195.6 14.9 27.9 0.0 13.7 3.9 0.0 17.4 2.3 Additonal Load 165.6 234.7 20.9 -
1.2*Max 165.6 18.1 33.6 234.7 17.9 33.5 0.0 16.4 4.6 0.0 20.9 2.7 % Increase 24.3% 31.3% 27.9% 26.15%
1.2*Min -232.8 -17.9 -33.2 -165.6 -18.1 -33.4 0.0 -16.2 -4.6 0.0 -20.6 -2.7 Total Load 681.6 750.7 74.9 1.19
Usage 0.57 0.63 0.62 1.19
FAILS
Usage Variance 21% 29% -34% 23%
3.5"x3.5"x716" Bracing Span 1 (Shore Span) 9.781 0.316 0.142 12.432 0.157 0.158 0.001 0.139 0.289 0.001 0.14 0.267 3.5"x3.5"x716" Bracing FX (kN) FX Connection
3.5"x3.5"x716" Bracing Span 2 (Intermediate Span) 15.989 0.201 0.27 9.921 0.202 0.252 0 0.25 0.141 0 0.253 0.124 Previous Assessment Loads -
3.5"x3.5"x716" Bracing Span 3 (Central Span) Condition Factor Considered 1 0.95 0.9 0.85 -
Max 16.0 0.3 0.3 12.4 0.2 0.3 0.0 0.3 0.3 0.0 0.3 0.3 Assessment Resistance 154.5 147.3 140.0 125.3 81.2
1.2*Max 19.2 0.4 0.3 14.9 0.2 0.3 0.0 0.3 0.3 0.0 0.3 0.3 Additonal Load 19.2 19.2 19.2 19.2 19.2
1.2*Min -14.9 -0.2 -0.2 -15.5 -0.4 -0.2 0.0 -0.2 -0.2 0.0 -0.2 -0.2 % Increase 12.4% 13.0% 13.7% 15.3% 23.6%
8"x6"x35lbs Floor Joist Span 1 (Shore Span) 15.992 1.351 3.354 9.371 1.304 1.962 0.006 2.63 1.175 0.006 0.908 1.202 8"x6"x35lbs Floor Joist FX (kN) FY (kN) FZ (kN) MX (kNm)MY (kNm)MZ (kNm)
8"x6"x35lbs Floor Joist Span 2 (Intermediate Span) 6.541 1.4 2.256 9.652 1.323 2.549 0.001 0.883 1.2 0.001 3.831 1.207 Previous Assessment Loads - - 178.0 - 83.6 -
8"x6"x35lbs Floor Joist Span 3 (Central Span) Previous Assessment Resistance - - 201.0 - 90.3 -
Max 16.0 1.4 3.4 9.7 1.3 2.5 0.0 2.6 1.2 0.0 3.8 1.2 Additonal Load - - 4.0 - 5.4 -
1.2*Max 19.2 1.7 4.0 11.6 1.6 3.1 0.0 3.2 1.4 0.0 4.6 1.4 % Increase - - 2.2% - 6.1% -
1.2*Min -11.2 -1.6 -3.0 -19.2 -1.7 -4.0 0.0 -5.4 -1.4 0.0 -3.0 -1.4 Total Load - - 182.0 - 89.0 -
Usage - - 0.91 - 0.99 -
- - - -
Section 5
Section 6
Section 7
Section 1
Section 2
Section 3
Section 4
End 1 End 2 End 1 End 2
Job ref
5099103
Previous Assessment
does not consider loading
in this member.
Therefore this calculation
just considers percentage
increase in load
compared with overall
Output
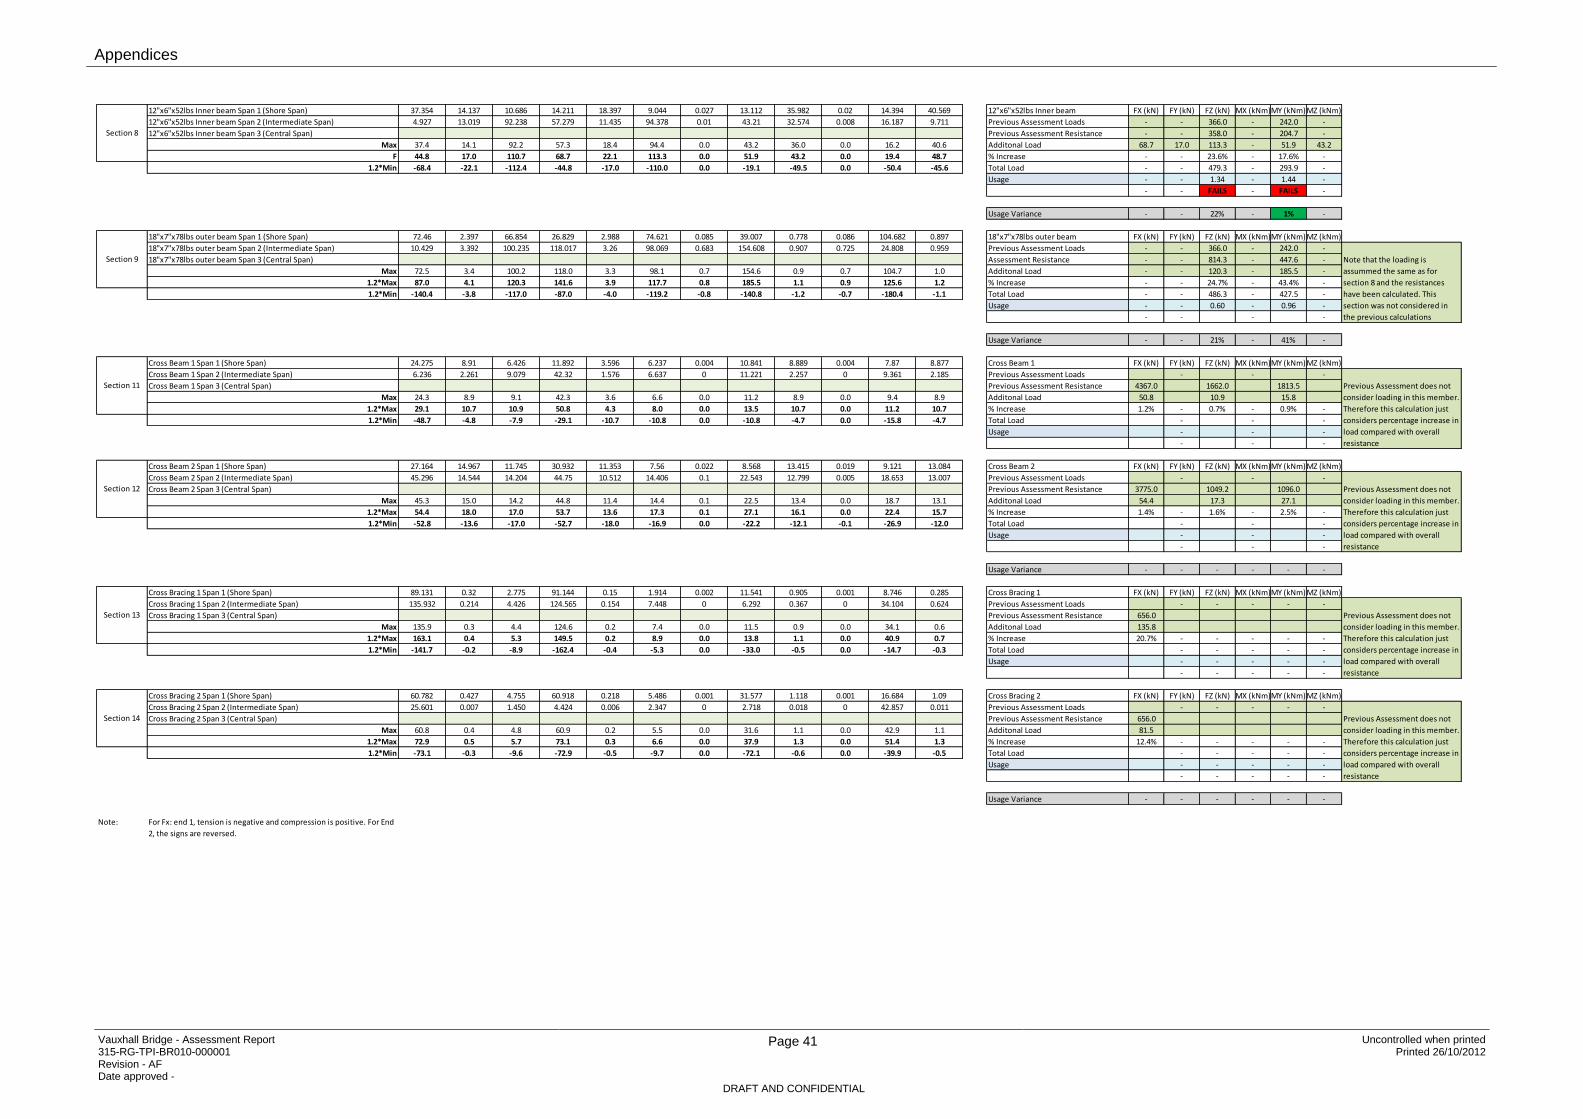
Appendices
Vauxhall Bridge - Assessment Report 315-RG-TPI-BR010-000001 Revision - AF Date approved -
Page 41 Uncontrolled when printed Printed 26/10/2012
DRAFT AND CONFIDENTIAL
12"x6"x52lbs Inner beam Span 1 (Shore Span) 37.354 14.137 10.686 14.211 18.397 9.044 0.027 13.112 35.982 0.02 14.394 40.569 12"x6"x52lbs Inner beam FX (kN) FY (kN) FZ (kN) MX (kNm)MY (kNm)MZ (kNm)
12"x6"x52lbs Inner beam Span 2 (Intermediate Span) 4.927 13.019 92.238 57.279 11.435 94.378 0.01 43.21 32.574 0.008 16.187 9.711 Previous Assessment Loads - - 366.0 - 242.0 -
12"x6"x52lbs Inner beam Span 3 (Central Span) Previous Assessment Resistance - - 358.0 - 204.7 -
Max 37.4 14.1 92.2 57.3 18.4 94.4 0.0 43.2 36.0 0.0 16.2 40.6 Additonal Load 68.7 17.0 113.3 - 51.9 43.2
F 44.8 17.0 110.7 68.7 22.1 113.3 0.0 51.9 43.2 0.0 19.4 48.7 % Increase - - 23.6% - 17.6% -
1.2*Min -68.4 -22.1 -112.4 -44.8 -17.0 -110.0 0.0 -19.1 -49.5 0.0 -50.4 -45.6 Total Load - - 479.3 - 293.9 -
Usage - - 1.34 - 1.44 -
- - FAILS - FAILS -
Usage Variance - - 22% - 1% -
18"x7"x78lbs outer beam Span 1 (Shore Span) 72.46 2.397 66.854 26.829 2.988 74.621 0.085 39.007 0.778 0.086 104.682 0.897 18"x7"x78lbs outer beam FX (kN) FY (kN) FZ (kN) MX (kNm)MY (kNm)MZ (kNm)
18"x7"x78lbs outer beam Span 2 (Intermediate Span) 10.429 3.392 100.235 118.017 3.26 98.069 0.683 154.608 0.907 0.725 24.808 0.959 Previous Assessment Loads - - 366.0 - 242.0 -
18"x7"x78lbs outer beam Span 3 (Central Span) Assessment Resistance - - 814.3 - 447.6 -
Max 72.5 3.4 100.2 118.0 3.3 98.1 0.7 154.6 0.9 0.7 104.7 1.0 Additonal Load - - 120.3 - 185.5 -
1.2*Max 87.0 4.1 120.3 141.6 3.9 117.7 0.8 185.5 1.1 0.9 125.6 1.2 % Increase - - 24.7% - 43.4% -
1.2*Min -140.4 -3.8 -117.0 -87.0 -4.0 -119.2 -0.8 -140.8 -1.2 -0.7 -180.4 -1.1 Total Load - - 486.3 - 427.5 -
Usage - - 0.60 - 0.96 -
- - - -
Usage Variance - - 21% - 41% -
Cross Beam 1 Span 1 (Shore Span) 24.275 8.91 6.426 11.892 3.596 6.237 0.004 10.841 8.889 0.004 7.87 8.877 Cross Beam 1 FX (kN) FY (kN) FZ (kN) MX (kNm)MY (kNm)MZ (kNm)
Cross Beam 1 Span 2 (Intermediate Span) 6.236 2.261 9.079 42.32 1.576 6.637 0 11.221 2.257 0 9.361 2.185 Previous Assessment Loads - - -
Cross Beam 1 Span 3 (Central Span) Previous Assessment Resistance 4367.0 1662.0 1813.5
Max 24.3 8.9 9.1 42.3 3.6 6.6 0.0 11.2 8.9 0.0 9.4 8.9 Additonal Load 50.8 10.9 15.8
1.2*Max 29.1 10.7 10.9 50.8 4.3 8.0 0.0 13.5 10.7 0.0 11.2 10.7 % Increase 1.2% - 0.7% - 0.9% -
1.2*Min -48.7 -4.8 -7.9 -29.1 -10.7 -10.8 0.0 -10.8 -4.7 0.0 -15.8 -4.7 Total Load - - -
Usage - - -
- - -
Cross Beam 2 Span 1 (Shore Span) 27.164 14.967 11.745 30.932 11.353 7.56 0.022 8.568 13.415 0.019 9.121 13.084 Cross Beam 2 FX (kN) FY (kN) FZ (kN) MX (kNm)MY (kNm)MZ (kNm)
Cross Beam 2 Span 2 (Intermediate Span) 45.296 14.544 14.204 44.75 10.512 14.406 0.1 22.543 12.799 0.005 18.653 13.007 Previous Assessment Loads - - -
Cross Beam 2 Span 3 (Central Span) Previous Assessment Resistance 3775.0 1049.2 1096.0
Max 45.3 15.0 14.2 44.8 11.4 14.4 0.1 22.5 13.4 0.0 18.7 13.1 Additonal Load 54.4 17.3 27.1
1.2*Max 54.4 18.0 17.0 53.7 13.6 17.3 0.1 27.1 16.1 0.0 22.4 15.7 % Increase 1.4% - 1.6% - 2.5% -
1.2*Min -52.8 -13.6 -17.0 -52.7 -18.0 -16.9 0.0 -22.2 -12.1 -0.1 -26.9 -12.0 Total Load - - -
Usage - - -
- - -
Usage Variance - - - - - -
Cross Bracing 1 Span 1 (Shore Span) 89.131 0.32 2.775 91.144 0.15 1.914 0.002 11.541 0.905 0.001 8.746 0.285 Cross Bracing 1 FX (kN) FY (kN) FZ (kN) MX (kNm)MY (kNm)MZ (kNm)
Cross Bracing 1 Span 2 (Intermediate Span) 135.932 0.214 4.426 124.565 0.154 7.448 0 6.292 0.367 0 34.104 0.624 Previous Assessment Loads - - - - -
Cross Bracing 1 Span 3 (Central Span) Previous Assessment Resistance 656.0
Max 135.9 0.3 4.4 124.6 0.2 7.4 0.0 11.5 0.9 0.0 34.1 0.6 Additonal Load 135.8
1.2*Max 163.1 0.4 5.3 149.5 0.2 8.9 0.0 13.8 1.1 0.0 40.9 0.7 % Increase 20.7% - - - - -
1.2*Min -141.7 -0.2 -8.9 -162.4 -0.4 -5.3 0.0 -33.0 -0.5 0.0 -14.7 -0.3 Total Load - - - - -
Usage - - - - -
- - - - -
Cross Bracing 2 Span 1 (Shore Span) 60.782 0.427 4.755 60.918 0.218 5.486 0.001 31.577 1.118 0.001 16.684 1.09 Cross Bracing 2 FX (kN) FY (kN) FZ (kN) MX (kNm)MY (kNm)MZ (kNm)
Cross Bracing 2 Span 2 (Intermediate Span) 25.601 0.007 1.450 4.424 0.006 2.347 0 2.718 0.018 0 42.857 0.011 Previous Assessment Loads - - - - -
Cross Bracing 2 Span 3 (Central Span) Previous Assessment Resistance 656.0
Max 60.8 0.4 4.8 60.9 0.2 5.5 0.0 31.6 1.1 0.0 42.9 1.1 Additonal Load 81.5
1.2*Max 72.9 0.5 5.7 73.1 0.3 6.6 0.0 37.9 1.3 0.0 51.4 1.3 % Increase 12.4% - - - - -
1.2*Min -73.1 -0.3 -9.6 -72.9 -0.5 -9.7 0.0 -72.1 -0.6 0.0 -39.9 -0.5 Total Load - - - - -
Usage - - - - -
- - - - -
Usage Variance - - - - - -
Note: For Fx: end 1, tension is negative and compression is positive. For End
2, the signs are reversed.
Section 12
Section 13
Section 14
Section 8
Section 11
Section 9 Note that the loading is
assummed the same as for
section 8 and the resistances
have been calculated. This
section was not considered in
the previous calculations
Previous Assessment does not
consider loading in this member.
Therefore this calculation just
considers percentage increase in
load compared with overall
resistance
Previous Assessment does not
consider loading in this member.
Therefore this calculation just
considers percentage increase in
load compared with overall
resistance
Previous Assessment does not
consider loading in this member.
Therefore this calculation just
considers percentage increase in
load compared with overall
resistance
Previous Assessment does not
consider loading in this member.
Therefore this calculation just
considers percentage increase in
load compared with overall
resistance
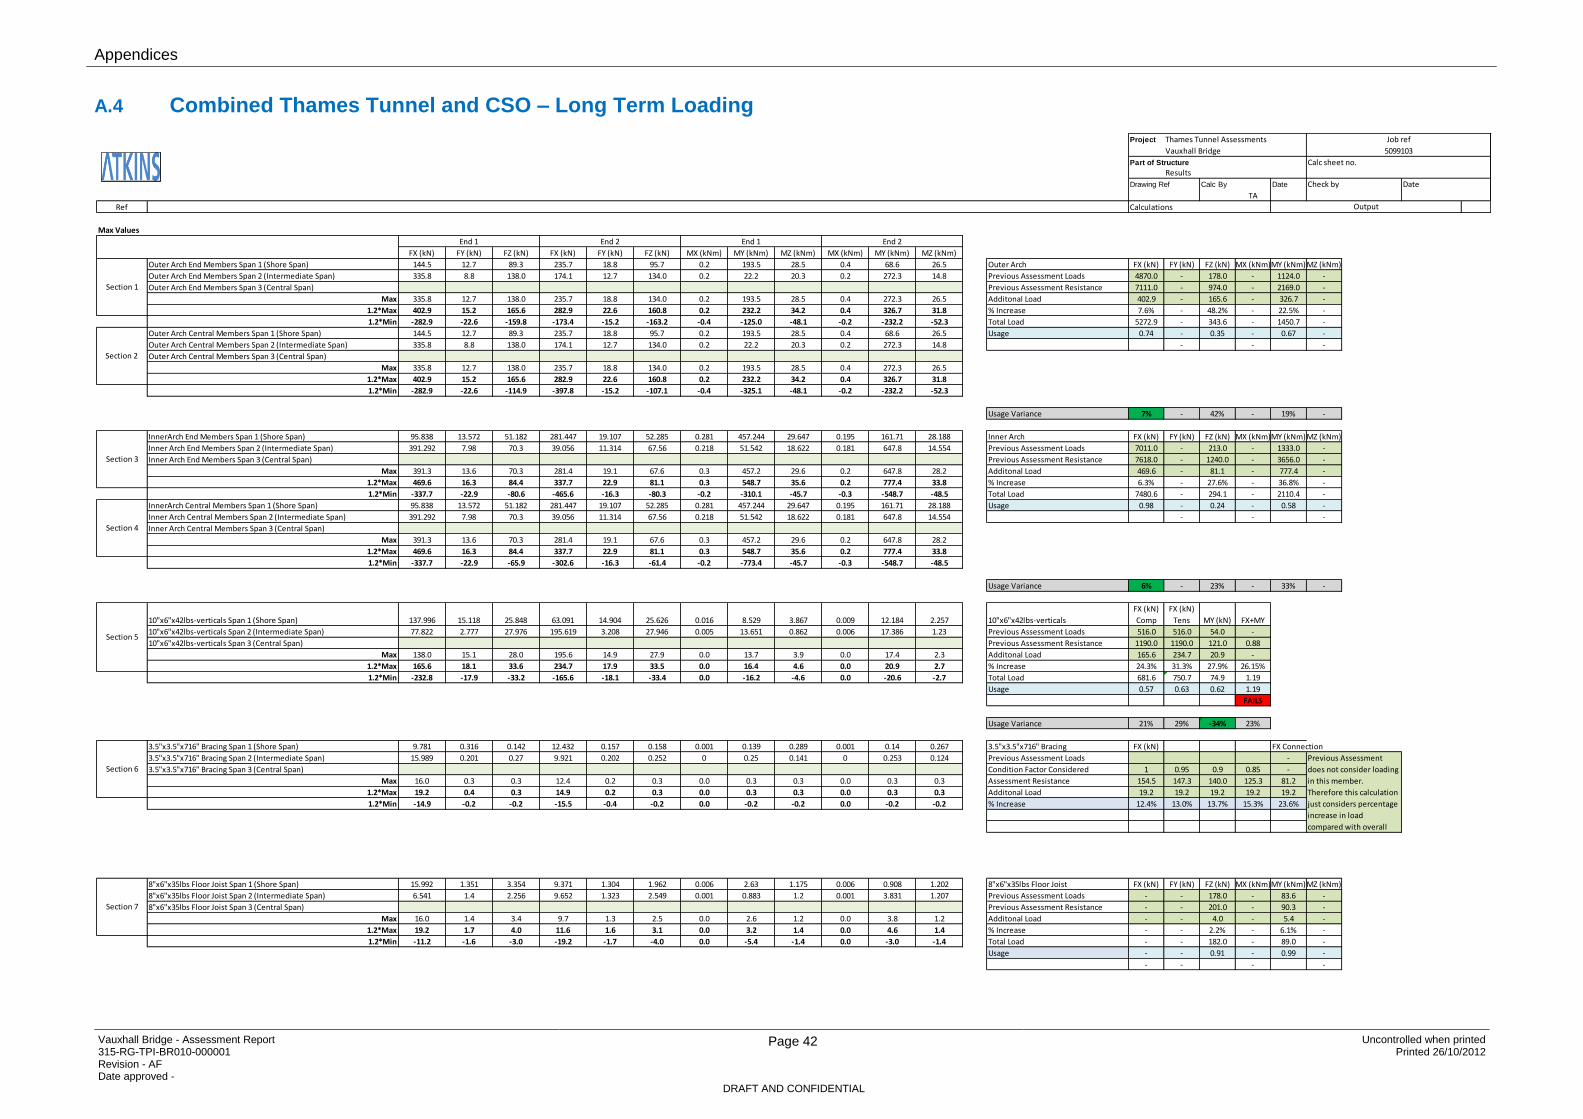
Appendices
Vauxhall Bridge - Assessment Report 315-RG-TPI-BR010-000001 Revision - AF Date approved -
Page 42 Uncontrolled when printed Printed 26/10/2012
DRAFT AND CONFIDENTIAL
A.4 Combined Thames Tunnel and CSO – Long Term Loading
Project Thames Tunnel Assessments
Vauxhall Bridge
Part of Structure Calc sheet no. Results
Drawing Ref Calc By Date Check by Date
TA
Ref Calculations
Max Values
FX (kN) FY (kN) FZ (kN) FX (kN) FY (kN) FZ (kN) MX (kNm) MY (kNm) MZ (kNm) MX (kNm) MY (kNm) MZ (kNm)
Outer Arch End Members Span 1 (Shore Span) 144.5 12.7 89.3 235.7 18.8 95.7 0.2 193.5 28.5 0.4 68.6 26.5 Outer Arch FX (kN) FY (kN) FZ (kN) MX (kNm)MY (kNm)MZ (kNm)
Outer Arch End Members Span 2 (Intermediate Span) 335.8 8.8 138.0 174.1 12.7 134.0 0.2 22.2 20.3 0.2 272.3 14.8 Previous Assessment Loads 4870.0 - 178.0 - 1124.0 -
Outer Arch End Members Span 3 (Central Span) Previous Assessment Resistance 7111.0 - 974.0 - 2169.0 -
Max 335.8 12.7 138.0 235.7 18.8 134.0 0.2 193.5 28.5 0.4 272.3 26.5 Additonal Load 402.9 - 165.6 - 326.7 -
1.2*Max 402.9 15.2 165.6 282.9 22.6 160.8 0.2 232.2 34.2 0.4 326.7 31.8 % Increase 7.6% - 48.2% - 22.5% -
1.2*Min -282.9 -22.6 -159.8 -173.4 -15.2 -163.2 -0.4 -125.0 -48.1 -0.2 -232.2 -52.3 Total Load 5272.9 - 343.6 - 1450.7 -
Outer Arch Central Members Span 1 (Shore Span) 144.5 12.7 89.3 235.7 18.8 95.7 0.2 193.5 28.5 0.4 68.6 26.5 Usage 0.74 - 0.35 - 0.67 -
Outer Arch Central Members Span 2 (Intermediate Span) 335.8 8.8 138.0 174.1 12.7 134.0 0.2 22.2 20.3 0.2 272.3 14.8 - - -
Outer Arch Central Members Span 3 (Central Span)
Max 335.8 12.7 138.0 235.7 18.8 134.0 0.2 193.5 28.5 0.4 272.3 26.5
1.2*Max 402.9 15.2 165.6 282.9 22.6 160.8 0.2 232.2 34.2 0.4 326.7 31.8
1.2*Min -282.9 -22.6 -114.9 -397.8 -15.2 -107.1 -0.4 -325.1 -48.1 -0.2 -232.2 -52.3
Usage Variance 7% - 42% - 19% -
InnerArch End Members Span 1 (Shore Span) 95.838 13.572 51.182 281.447 19.107 52.285 0.281 457.244 29.647 0.195 161.71 28.188 Inner Arch FX (kN) FY (kN) FZ (kN) MX (kNm)MY (kNm)MZ (kNm)
Inner Arch End Members Span 2 (Intermediate Span) 391.292 7.98 70.3 39.056 11.314 67.56 0.218 51.542 18.622 0.181 647.8 14.554 Previous Assessment Loads 7011.0 - 213.0 - 1333.0 -
Inner Arch End Members Span 3 (Central Span) Previous Assessment Resistance 7618.0 - 1240.0 - 3656.0 -
Max 391.3 13.6 70.3 281.4 19.1 67.6 0.3 457.2 29.6 0.2 647.8 28.2 Additonal Load 469.6 - 81.1 - 777.4 -
1.2*Max 469.6 16.3 84.4 337.7 22.9 81.1 0.3 548.7 35.6 0.2 777.4 33.8 % Increase 6.3% - 27.6% - 36.8% -
1.2*Min -337.7 -22.9 -80.6 -465.6 -16.3 -80.3 -0.2 -310.1 -45.7 -0.3 -548.7 -48.5 Total Load 7480.6 - 294.1 - 2110.4 -
InnerArch Central Members Span 1 (Shore Span) 95.838 13.572 51.182 281.447 19.107 52.285 0.281 457.244 29.647 0.195 161.71 28.188 Usage 0.98 - 0.24 - 0.58 -
Inner Arch Central Members Span 2 (Intermediate Span) 391.292 7.98 70.3 39.056 11.314 67.56 0.218 51.542 18.622 0.181 647.8 14.554 - - -
Inner Arch Central Members Span 3 (Central Span)
Max 391.3 13.6 70.3 281.4 19.1 67.6 0.3 457.2 29.6 0.2 647.8 28.2
1.2*Max 469.6 16.3 84.4 337.7 22.9 81.1 0.3 548.7 35.6 0.2 777.4 33.8
1.2*Min -337.7 -22.9 -65.9 -302.6 -16.3 -61.4 -0.2 -773.4 -45.7 -0.3 -548.7 -48.5
Usage Variance 6% - 23% - 33% -
10"x6"x42lbs-verticals Span 1 (Shore Span) 137.996 15.118 25.848 63.091 14.904 25.626 0.016 8.529 3.867 0.009 12.184 2.257 10"x6"x42lbs-verticals
FX (kN)
Comp
FX (kN)
Tens MY (kN) FX+MY
10"x6"x42lbs-verticals Span 2 (Intermediate Span) 77.822 2.777 27.976 195.619 3.208 27.946 0.005 13.651 0.862 0.006 17.386 1.23 Previous Assessment Loads 516.0 516.0 54.0 -
10"x6"x42lbs-verticals Span 3 (Central Span) Previous Assessment Resistance 1190.0 1190.0 121.0 0.88
Max 138.0 15.1 28.0 195.6 14.9 27.9 0.0 13.7 3.9 0.0 17.4 2.3 Additonal Load 165.6 234.7 20.9 -
1.2*Max 165.6 18.1 33.6 234.7 17.9 33.5 0.0 16.4 4.6 0.0 20.9 2.7 % Increase 24.3% 31.3% 27.9% 26.15%
1.2*Min -232.8 -17.9 -33.2 -165.6 -18.1 -33.4 0.0 -16.2 -4.6 0.0 -20.6 -2.7 Total Load 681.6 750.7 74.9 1.19
Usage 0.57 0.63 0.62 1.19
FAILS
Usage Variance 21% 29% -34% 23%
3.5"x3.5"x716" Bracing Span 1 (Shore Span) 9.781 0.316 0.142 12.432 0.157 0.158 0.001 0.139 0.289 0.001 0.14 0.267 3.5"x3.5"x716" Bracing FX (kN) FX Connection
3.5"x3.5"x716" Bracing Span 2 (Intermediate Span) 15.989 0.201 0.27 9.921 0.202 0.252 0 0.25 0.141 0 0.253 0.124 Previous Assessment Loads -
3.5"x3.5"x716" Bracing Span 3 (Central Span) Condition Factor Considered 1 0.95 0.9 0.85 -
Max 16.0 0.3 0.3 12.4 0.2 0.3 0.0 0.3 0.3 0.0 0.3 0.3 Assessment Resistance 154.5 147.3 140.0 125.3 81.2
1.2*Max 19.2 0.4 0.3 14.9 0.2 0.3 0.0 0.3 0.3 0.0 0.3 0.3 Additonal Load 19.2 19.2 19.2 19.2 19.2
1.2*Min -14.9 -0.2 -0.2 -15.5 -0.4 -0.2 0.0 -0.2 -0.2 0.0 -0.2 -0.2 % Increase 12.4% 13.0% 13.7% 15.3% 23.6%
8"x6"x35lbs Floor Joist Span 1 (Shore Span) 15.992 1.351 3.354 9.371 1.304 1.962 0.006 2.63 1.175 0.006 0.908 1.202 8"x6"x35lbs Floor Joist FX (kN) FY (kN) FZ (kN) MX (kNm)MY (kNm)MZ (kNm)
8"x6"x35lbs Floor Joist Span 2 (Intermediate Span) 6.541 1.4 2.256 9.652 1.323 2.549 0.001 0.883 1.2 0.001 3.831 1.207 Previous Assessment Loads - - 178.0 - 83.6 -
8"x6"x35lbs Floor Joist Span 3 (Central Span) Previous Assessment Resistance - - 201.0 - 90.3 -
Max 16.0 1.4 3.4 9.7 1.3 2.5 0.0 2.6 1.2 0.0 3.8 1.2 Additonal Load - - 4.0 - 5.4 -
1.2*Max 19.2 1.7 4.0 11.6 1.6 3.1 0.0 3.2 1.4 0.0 4.6 1.4 % Increase - - 2.2% - 6.1% -
1.2*Min -11.2 -1.6 -3.0 -19.2 -1.7 -4.0 0.0 -5.4 -1.4 0.0 -3.0 -1.4 Total Load - - 182.0 - 89.0 -
Usage - - 0.91 - 0.99 -
- - - -
Section 5
Section 6
Section 7
Section 1
Section 2
Section 3
Section 4
End 1 End 2 End 1 End 2
Job ref
5099103
Previous Assessment
does not consider loading
in this member.
Therefore this calculation
just considers percentage
increase in load
compared with overall
Output

Appendices
Vauxhall Bridge - Assessment Report 315-RG-TPI-BR010-000001 Revision - AF Date approved -
Page 43 Uncontrolled when printed Printed 26/10/2012
DRAFT AND CONFIDENTIAL
12"x6"x52lbs Inner beam Span 1 (Shore Span) 37.354 14.137 10.686 14.211 18.397 9.044 0.027 13.112 35.982 0.02 14.394 40.569 12"x6"x52lbs Inner beam FX (kN) FY (kN) FZ (kN) MX (kNm)MY (kNm)MZ (kNm)
12"x6"x52lbs Inner beam Span 2 (Intermediate Span) 4.927 13.019 92.238 57.279 11.435 94.378 0.01 43.21 32.574 0.008 16.187 9.711 Previous Assessment Loads - - 366.0 - 242.0 -
12"x6"x52lbs Inner beam Span 3 (Central Span) Previous Assessment Resistance - - 358.0 - 204.7 -
Max 37.4 14.1 92.2 57.3 18.4 94.4 0.0 43.2 36.0 0.0 16.2 40.6 Additonal Load 68.7 17.0 113.3 - 51.9 43.2
F 44.8 17.0 110.7 68.7 22.1 113.3 0.0 51.9 43.2 0.0 19.4 48.7 % Increase - - 23.6% - 17.6% -
1.2*Min -68.4 -22.1 -112.4 -44.8 -17.0 -110.0 0.0 -19.1 -49.5 0.0 -50.4 -45.6 Total Load - - 479.3 - 293.9 -
Usage - - 1.34 - 1.44 -
- - FAILS - FAILS -
Usage Variance - - 22% - 1% -
18"x7"x78lbs outer beam Span 1 (Shore Span) 72.46 2.397 66.854 26.829 2.988 74.621 0.085 39.007 0.778 0.086 104.682 0.897 18"x7"x78lbs outer beam FX (kN) FY (kN) FZ (kN) MX (kNm)MY (kNm)MZ (kNm)
18"x7"x78lbs outer beam Span 2 (Intermediate Span) 10.429 3.392 100.235 118.017 3.26 98.069 0.683 154.608 0.907 0.725 24.808 0.959 Previous Assessment Loads - - 366.0 - 242.0 -
18"x7"x78lbs outer beam Span 3 (Central Span) Assessment Resistance - - 814.3 - 447.6 -
Max 72.5 3.4 100.2 118.0 3.3 98.1 0.7 154.6 0.9 0.7 104.7 1.0 Additonal Load - - 120.3 - 185.5 -
1.2*Max 87.0 4.1 120.3 141.6 3.9 117.7 0.8 185.5 1.1 0.9 125.6 1.2 % Increase - - 24.7% - 43.4% -
1.2*Min -140.4 -3.8 -117.0 -87.0 -4.0 -119.2 -0.8 -140.8 -1.2 -0.7 -180.4 -1.1 Total Load - - 486.3 - 427.5 -
Usage - - 0.60 - 0.96 -
- - - -
Usage Variance - - 21% - 41% -
Cross Beam 1 Span 1 (Shore Span) 24.275 8.91 6.426 11.892 3.596 6.237 0.004 10.841 8.889 0.004 7.87 8.877 Cross Beam 1 FX (kN) FY (kN) FZ (kN) MX (kNm)MY (kNm)MZ (kNm)
Cross Beam 1 Span 2 (Intermediate Span) 6.236 2.261 9.079 42.32 1.576 6.637 0 11.221 2.257 0 9.361 2.185 Previous Assessment Loads - - -
Cross Beam 1 Span 3 (Central Span) Previous Assessment Resistance 4367.0 1662.0 1813.5
Max 24.3 8.9 9.1 42.3 3.6 6.6 0.0 11.2 8.9 0.0 9.4 8.9 Additonal Load 50.8 10.9 15.8
1.2*Max 29.1 10.7 10.9 50.8 4.3 8.0 0.0 13.5 10.7 0.0 11.2 10.7 % Increase 1.2% - 0.7% - 0.9% -
1.2*Min -48.7 -4.8 -7.9 -29.1 -10.7 -10.8 0.0 -10.8 -4.7 0.0 -15.8 -4.7 Total Load - - -
Usage - - -
- - -
Cross Beam 2 Span 1 (Shore Span) 27.164 14.967 11.745 30.932 11.353 7.56 0.022 8.568 13.415 0.019 9.121 13.084 Cross Beam 2 FX (kN) FY (kN) FZ (kN) MX (kNm)MY (kNm)MZ (kNm)
Cross Beam 2 Span 2 (Intermediate Span) 45.296 14.544 14.204 44.75 10.512 14.406 0.1 22.543 12.799 0.005 18.653 13.007 Previous Assessment Loads - - -
Cross Beam 2 Span 3 (Central Span) Previous Assessment Resistance 3775.0 1049.2 1096.0
Max 45.3 15.0 14.2 44.8 11.4 14.4 0.1 22.5 13.4 0.0 18.7 13.1 Additonal Load 54.4 17.3 27.1
1.2*Max 54.4 18.0 17.0 53.7 13.6 17.3 0.1 27.1 16.1 0.0 22.4 15.7 % Increase 1.4% - 1.6% - 2.5% -
1.2*Min -52.8 -13.6 -17.0 -52.7 -18.0 -16.9 0.0 -22.2 -12.1 -0.1 -26.9 -12.0 Total Load - - -
Usage - - -
- - -
Usage Variance - - - - - -
Cross Bracing 1 Span 1 (Shore Span) 89.131 0.32 2.775 91.144 0.15 1.914 0.002 11.541 0.905 0.001 8.746 0.285 Cross Bracing 1 FX (kN) FY (kN) FZ (kN) MX (kNm)MY (kNm)MZ (kNm)
Cross Bracing 1 Span 2 (Intermediate Span) 135.932 0.214 4.426 124.565 0.154 7.448 0 6.292 0.367 0 34.104 0.624 Previous Assessment Loads - - - - -
Cross Bracing 1 Span 3 (Central Span) Previous Assessment Resistance 656.0
Max 135.9 0.3 4.4 124.6 0.2 7.4 0.0 11.5 0.9 0.0 34.1 0.6 Additonal Load 135.8
1.2*Max 163.1 0.4 5.3 149.5 0.2 8.9 0.0 13.8 1.1 0.0 40.9 0.7 % Increase 20.7% - - - - -
1.2*Min -141.7 -0.2 -8.9 -162.4 -0.4 -5.3 0.0 -33.0 -0.5 0.0 -14.7 -0.3 Total Load - - - - -
Usage - - - - -
- - - - -
Cross Bracing 2 Span 1 (Shore Span) 60.782 0.427 4.755 60.918 0.218 5.486 0.001 31.577 1.118 0.001 16.684 1.09 Cross Bracing 2 FX (kN) FY (kN) FZ (kN) MX (kNm)MY (kNm)MZ (kNm)
Cross Bracing 2 Span 2 (Intermediate Span) 25.601 0.007 1.450 4.424 0.006 2.347 0 2.718 0.018 0 42.857 0.011 Previous Assessment Loads - - - - -
Cross Bracing 2 Span 3 (Central Span) Previous Assessment Resistance 656.0
Max 60.8 0.4 4.8 60.9 0.2 5.5 0.0 31.6 1.1 0.0 42.9 1.1 Additonal Load 81.5
1.2*Max 72.9 0.5 5.7 73.1 0.3 6.6 0.0 37.9 1.3 0.0 51.4 1.3 % Increase 12.4% - - - - -
1.2*Min -73.1 -0.3 -9.6 -72.9 -0.5 -9.7 0.0 -72.1 -0.6 0.0 -39.9 -0.5 Total Load - - - - -
Usage - - - - -
- - - - -
Usage Variance - - - - - -
Note: For Fx: end 1, tension is negative and compression is positive. For End
2, the signs are reversed.
Section 12
Section 13
Section 14
Section 8
Section 11
Section 9 Note that the loading is
assummed the same as for
section 8 and the resistances
have been calculated. This
section was not considered in
the previous calculations
Previous Assessment does not
consider loading in this member.
Therefore this calculation just
considers percentage increase in
load compared with overall
resistance
Previous Assessment does not
consider loading in this member.
Therefore this calculation just
considers percentage increase in
load compared with overall
resistance
Previous Assessment does not
consider loading in this member.
Therefore this calculation just
considers percentage increase in
load compared with overall
resistance
Previous Assessment does not
consider loading in this member.
Therefore this calculation just
considers percentage increase in
load compared with overall
resistance
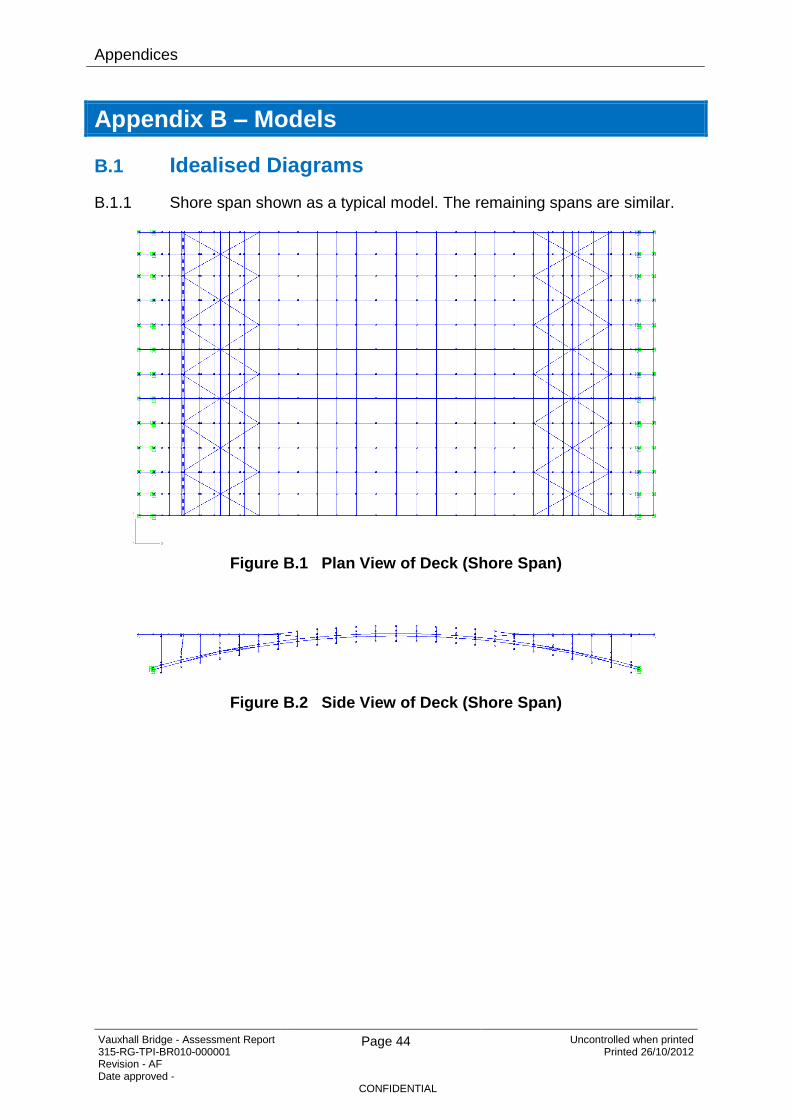
Appendices
Vauxhall Bridge - Assessment Report 315-RG-TPI-BR010-000001 Revision - AF Date approved -
Page 44 Uncontrolled when printed Printed 26/10/2012
CONFIDENTIAL
Appendix B – Models
B.1 Idealised Diagrams
B.1.1 Shore span shown as a typical model. The remaining spans are similar.
Figure B.1 Plan View of Deck (Shore Span)
Figure B.2 Side View of Deck (Shore Span)

Appendices
Vauxhall Bridge - Assessment Report 315-RG-TPI-BR010-000001 Revision - AF Date approved -
Page 45 Uncontrolled when printed Printed 26/10/2012
CONFIDENTIAL
Figure B.3 Overall 3D Deck Model (Shore Span)

Appendices
Vauxhall Bridge - Assessment Report 315-RG-TPI-BR010-000001 Revision - AF Date approved -
Page 46 Uncontrolled when printed Printed 26/10/2012
CONFIDENTIAL
Appendix C – Geotechnical Assessment Results (Thames Tunnel)
C.1 Introduction
C.1.1 This appendix sets out the assessment of the impact the proposed Thames Tideway Tunnel will have on the pier and abutment footings of Vauxhall Road Bridge. The Thames Tideway tunnel will pass beneath the Vauxhall Road Bridge at a level of -40.95mAOD, with an intersection angle of approximately 85o1‟50”.
C.2 Reference Information
Parameters Values
θ 85o1‟50”
Excavated Diameter 8.8 m
VL % 1.0
K 0.5
Depth to Tunnel Axis, z 40.95 m
Table C.1 Thames Tunnel assessment parameters
Element Dimensions (m) Foundation Levels (mAOD)
Pier 2 43.434 x 11.582 x 2.007 -8.839
Pier 3 43.434 x 11.582 x 1.397 -8.33
Lambeth Pier 42.9 x 11.278 x 2.134 -8.992
Lambeth Abutment 35.027 x 17.069 x 5.105 -6.096
Table C.2 Foundation Information
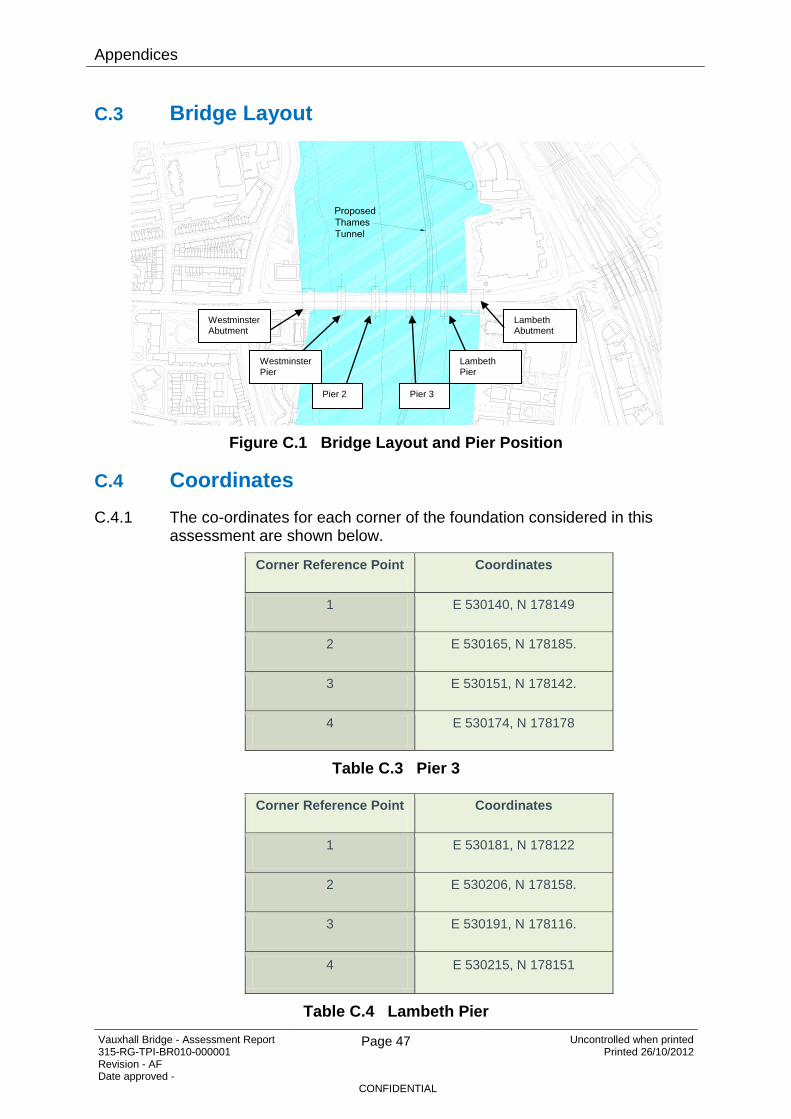
Appendices
Vauxhall Bridge - Assessment Report 315-RG-TPI-BR010-000001 Revision - AF Date approved -
Page 47 Uncontrolled when printed Printed 26/10/2012
CONFIDENTIAL
C.3 Bridge Layout
Figure C.1 Bridge Layout and Pier Position
C.4 Coordinates
C.4.1 The co-ordinates for each corner of the foundation considered in this assessment are shown below.
Corner Reference Point Coordinates
1 E 530140, N 178149
2 E 530165, N 178185.
3 E 530151, N 178142.
4 E 530174, N 178178
Table C.3 Pier 3
Corner Reference Point Coordinates
1 E 530181, N 178122
2 E 530206, N 178158.
3 E 530191, N 178116.
4 E 530215, N 178151
Table C.4 Lambeth Pier
Westminster Abutment
Westminster
Pier
Lambeth Pier
Lambeth Abutment
Pier 2 Pier 3
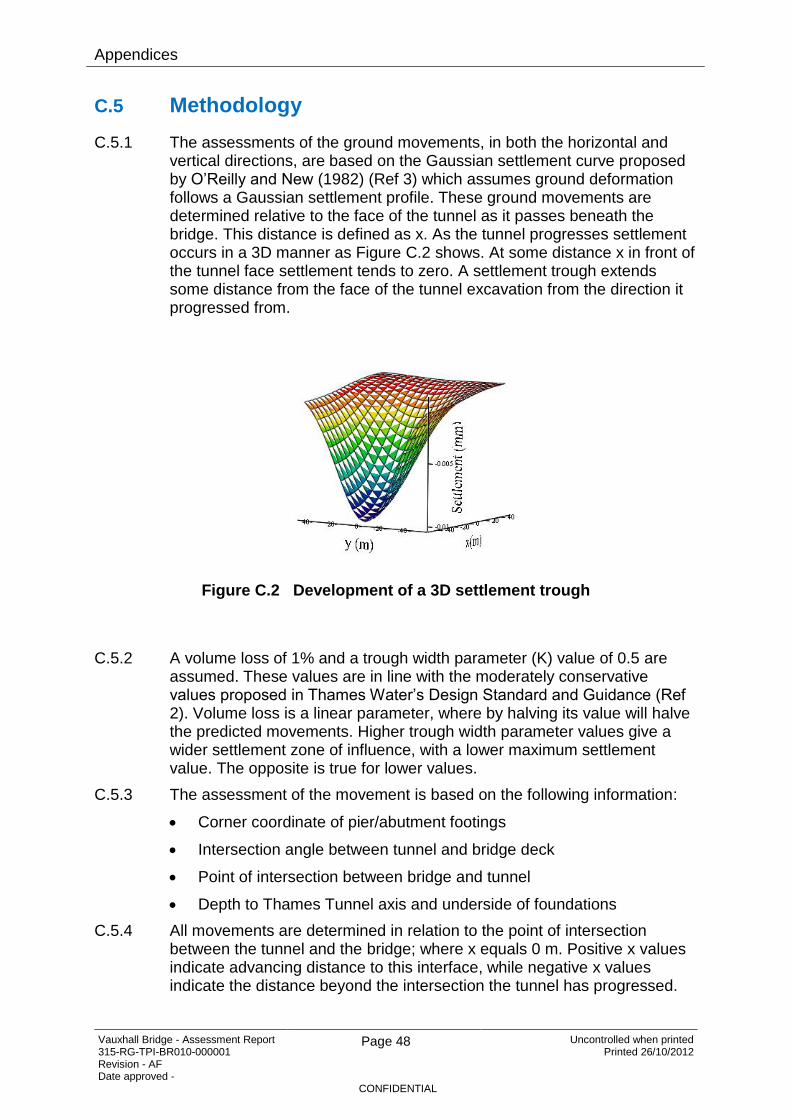
Appendices
Vauxhall Bridge - Assessment Report 315-RG-TPI-BR010-000001 Revision - AF Date approved -
Page 48 Uncontrolled when printed Printed 26/10/2012
CONFIDENTIAL
C.5 Methodology
C.5.1 The assessments of the ground movements, in both the horizontal and vertical directions, are based on the Gaussian settlement curve proposed by O‟Reilly and New (1982) (Ref 3) which assumes ground deformation follows a Gaussian settlement profile. These ground movements are determined relative to the face of the tunnel as it passes beneath the bridge. This distance is defined as x. As the tunnel progresses settlement occurs in a 3D manner as Figure C.2 shows. At some distance x in front of the tunnel face settlement tends to zero. A settlement trough extends some distance from the face of the tunnel excavation from the direction it progressed from.
Figure C.2 Development of a 3D settlement trough
C.5.2 A volume loss of 1% and a trough width parameter (K) value of 0.5 are assumed. These values are in line with the moderately conservative values proposed in Thames Water‟s Design Standard and Guidance (Ref 2). Volume loss is a linear parameter, where by halving its value will halve the predicted movements. Higher trough width parameter values give a wider settlement zone of influence, with a lower maximum settlement value. The opposite is true for lower values.
C.5.3 The assessment of the movement is based on the following information:
Corner coordinate of pier/abutment footings
Intersection angle between tunnel and bridge deck
Point of intersection between bridge and tunnel
Depth to Thames Tunnel axis and underside of foundations
C.5.4 All movements are determined in relation to the point of intersection between the tunnel and the bridge; where x equals 0 m. Positive x values indicate advancing distance to this interface, while negative x values indicate the distance beyond the intersection the tunnel has progressed.

Appendices
Vauxhall Bridge - Assessment Report 315-RG-TPI-BR010-000001 Revision - AF Date approved -
Page 49 Uncontrolled when printed Printed 26/10/2012
CONFIDENTIAL
C.5.5 Using the corner points coordinates given; the centre point of each pier was calculated. The settlement of the pier corners was then calculated using the centre point of the pier, the angle of intersection between the bridge and the tunnel, and the advancing tunnel face. These are defined as S1, S2, S3 and S4, with the same numbering as the coordinates provided.
C.5.6 The horizontal movements in the transverse and longitudinal directions were calculated for the corners of each pier. An average value for each of these was taken, and was assumed to act from the centre of the pier. These new average horizontal transverse and longitudinal movements were then resolved in terms of movements parallel to the bridge decking (R1) and movements perpendicular to the bridge decking (R2). The values of R1 vary depending on the piers location in relation to the tunnel centreline. As the pier will tend to move towards the tunnel (due to the excavation of the soil), the direction of movement will be different either side of the tunnel, hence the change in sign. The value of R2 will decreases as the tunnel face progresses, and increases in the long term
Figure C.3 R1, R2 in relation to approaching tunnel
C.5.7 For the purpose of analysis significant movement has been defined as 1 mm. Piers which show movements less than 1mm are not considered significant and are omitted from the results section.
xy
v
u
90
90
v
u
90
90
R1 = v cos ( - 90) - u sin ( - 90)
R2 = v sin ( - 90) + u cos ( - 90)
R1 = v cos ( - 90) - u sin ( - 90)
R2 = v sin ( - 90) + u cos ( - 90)
x
y
v
u
90
90
R1 = v cos (90 - ) + u sin (90 - )
R2 = -v sin (90 - ) + u cos (90 - )
R2
R1
v
u
90
90
R2
R1
R2
R1
R2
R1
R1 = v cos (90 - ) + u sin (90 - )
R2 = -v sin (90 - ) + u cos (90 - )
< 90°
> 90°
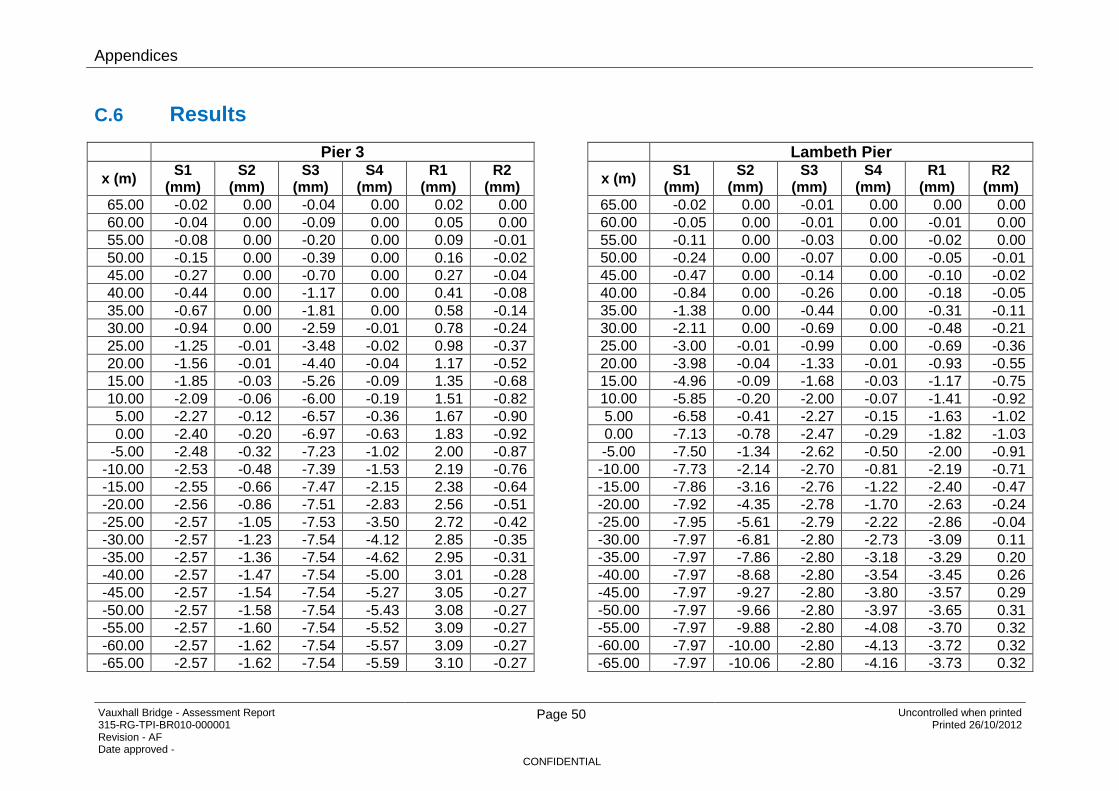
Appendices
Vauxhall Bridge - Assessment Report 315-RG-TPI-BR010-000001 Revision - AF Date approved -
Page 50 Uncontrolled when printed Printed 26/10/2012
CONFIDENTIAL
C.6 Results
Pier 3 Lambeth Pier
x (m) S1
(mm) S2
(mm) S3
(mm) S4
(mm) R1
(mm) R2
(mm)
x (m) S1
(mm) S2
(mm) S3
(mm) S4
(mm) R1
(mm) R2
(mm)
65.00 -0.02 0.00 -0.04 0.00 0.02 0.00 65.00 -0.02 0.00 -0.01 0.00 0.00 0.00
60.00 -0.04 0.00 -0.09 0.00 0.05 0.00 60.00 -0.05 0.00 -0.01 0.00 -0.01 0.00
55.00 -0.08 0.00 -0.20 0.00 0.09 -0.01 55.00 -0.11 0.00 -0.03 0.00 -0.02 0.00
50.00 -0.15 0.00 -0.39 0.00 0.16 -0.02 50.00 -0.24 0.00 -0.07 0.00 -0.05 -0.01
45.00 -0.27 0.00 -0.70 0.00 0.27 -0.04 45.00 -0.47 0.00 -0.14 0.00 -0.10 -0.02
40.00 -0.44 0.00 -1.17 0.00 0.41 -0.08 40.00 -0.84 0.00 -0.26 0.00 -0.18 -0.05
35.00 -0.67 0.00 -1.81 0.00 0.58 -0.14 35.00 -1.38 0.00 -0.44 0.00 -0.31 -0.11
30.00 -0.94 0.00 -2.59 -0.01 0.78 -0.24 30.00 -2.11 0.00 -0.69 0.00 -0.48 -0.21
25.00 -1.25 -0.01 -3.48 -0.02 0.98 -0.37 25.00 -3.00 -0.01 -0.99 0.00 -0.69 -0.36
20.00 -1.56 -0.01 -4.40 -0.04 1.17 -0.52 20.00 -3.98 -0.04 -1.33 -0.01 -0.93 -0.55
15.00 -1.85 -0.03 -5.26 -0.09 1.35 -0.68 15.00 -4.96 -0.09 -1.68 -0.03 -1.17 -0.75
10.00 -2.09 -0.06 -6.00 -0.19 1.51 -0.82 10.00 -5.85 -0.20 -2.00 -0.07 -1.41 -0.92
5.00 -2.27 -0.12 -6.57 -0.36 1.67 -0.90 5.00 -6.58 -0.41 -2.27 -0.15 -1.63 -1.02
0.00 -2.40 -0.20 -6.97 -0.63 1.83 -0.92 0.00 -7.13 -0.78 -2.47 -0.29 -1.82 -1.03
-5.00 -2.48 -0.32 -7.23 -1.02 2.00 -0.87 -5.00 -7.50 -1.34 -2.62 -0.50 -2.00 -0.91
-10.00 -2.53 -0.48 -7.39 -1.53 2.19 -0.76 -10.00 -7.73 -2.14 -2.70 -0.81 -2.19 -0.71
-15.00 -2.55 -0.66 -7.47 -2.15 2.38 -0.64 -15.00 -7.86 -3.16 -2.76 -1.22 -2.40 -0.47
-20.00 -2.56 -0.86 -7.51 -2.83 2.56 -0.51 -20.00 -7.92 -4.35 -2.78 -1.70 -2.63 -0.24
-25.00 -2.57 -1.05 -7.53 -3.50 2.72 -0.42 -25.00 -7.95 -5.61 -2.79 -2.22 -2.86 -0.04
-30.00 -2.57 -1.23 -7.54 -4.12 2.85 -0.35 -30.00 -7.97 -6.81 -2.80 -2.73 -3.09 0.11
-35.00 -2.57 -1.36 -7.54 -4.62 2.95 -0.31 -35.00 -7.97 -7.86 -2.80 -3.18 -3.29 0.20
-40.00 -2.57 -1.47 -7.54 -5.00 3.01 -0.28 -40.00 -7.97 -8.68 -2.80 -3.54 -3.45 0.26
-45.00 -2.57 -1.54 -7.54 -5.27 3.05 -0.27 -45.00 -7.97 -9.27 -2.80 -3.80 -3.57 0.29
-50.00 -2.57 -1.58 -7.54 -5.43 3.08 -0.27 -50.00 -7.97 -9.66 -2.80 -3.97 -3.65 0.31
-55.00 -2.57 -1.60 -7.54 -5.52 3.09 -0.27 -55.00 -7.97 -9.88 -2.80 -4.08 -3.70 0.32
-60.00 -2.57 -1.62 -7.54 -5.57 3.09 -0.27 -60.00 -7.97 -10.00 -2.80 -4.13 -3.72 0.32
-65.00 -2.57 -1.62 -7.54 -5.59 3.10 -0.27 -65.00 -7.97 -10.06 -2.80 -4.16 -3.73 0.32

Appendices
Vauxhall Bridge - Assessment Report 315-RG-TPI-BR010-000001 Revision - AF Date approved -
Page 51 Uncontrolled when printed Printed 26/10/2012
CONFIDENTIAL
C.6.1 Lambeth Abutment
No significant movement was recorded at Lambeth Abutment.
C.6.2 Pier 2
No significant movement was recorded at Pier 2.
C.7 Maximum Settlement
C.7.1 The maximum settlement calculated using Gaussian Greenfield settlement analysis was 15.2 mm.
C.7.2 A Trough Width (3.K.z), perpendicular to the tunnel, of 47.9m was also calculated either side of the tunnel centre line.

Appendices
Vauxhall Bridge - Assessment Report 315-RG-TPI-BR010-000001 Revision - AF Date approved -
Page 52 Uncontrolled when printed Printed 26/10/2012
CONFIDENTIAL
Graphical Results – Pier 3
C.7.3 Settlements
X +ve : TBM approaching bridge and tunnel intersection
X = 0 m : TBM at intersection of bridge and tunnel
X –ve : TBM beyond bridge and tunnel intersection
Tunnel Approach rection

Appendices
Vauxhall Bridge - Assessment Report 315-RG-TPI-BR010-000001 Revision - AF Date approved -
Page 53 Uncontrolled when printed Printed 26/10/2012
CONFIDENTIAL
C.7.4 Rotations
Graphical Results – Lambeth Pier
C.7.5 Settlements
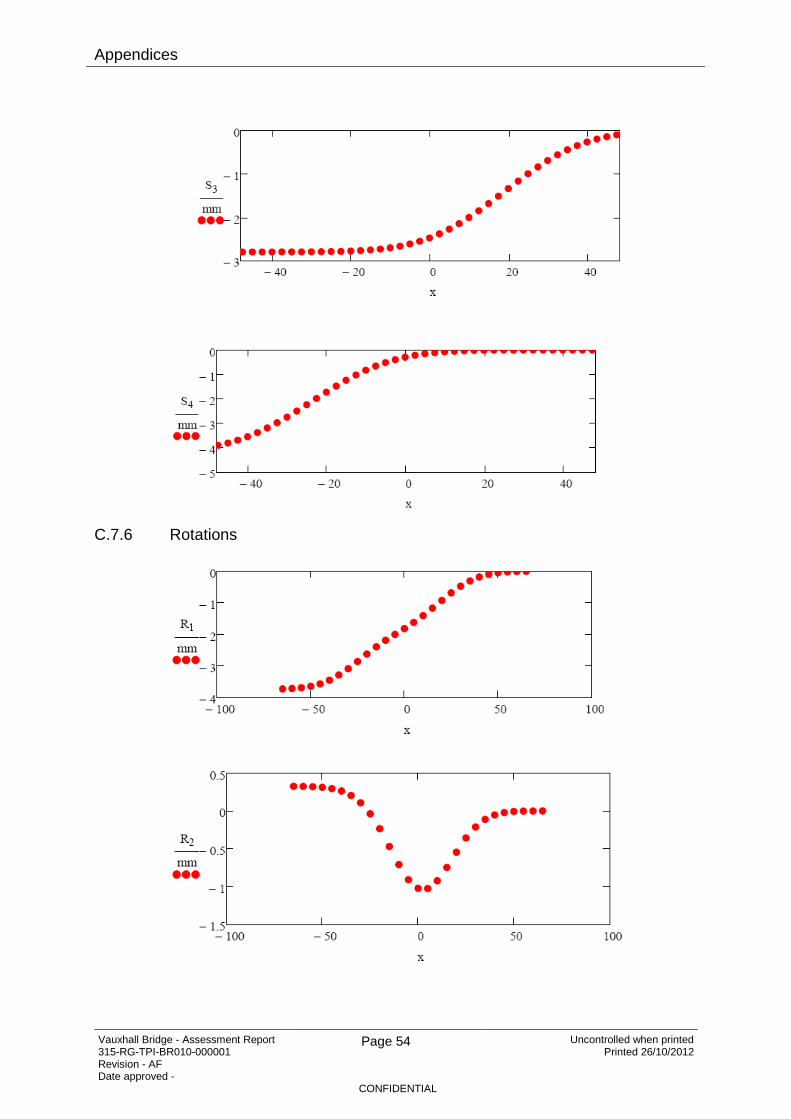
Appendices
Vauxhall Bridge - Assessment Report 315-RG-TPI-BR010-000001 Revision - AF Date approved -
Page 54 Uncontrolled when printed Printed 26/10/2012
CONFIDENTIAL
C.7.6 Rotations
Appendices
Vauxhall Bridge - Assessment Report 315-RG-TPI-BR010-000001 Revision - AF Date approved -
Page 55 Uncontrolled when printed Printed 26/10/2012
CONFIDENTIAL
C.8 References
1. Tunnelling in Soil – Attewell & Yeates 1986
2. Design Standard and Guidance – Thames Water (Document Number 100-PS-
DES-00000-000008, 4th May, 2010)
3. Settlements above Tunnels in United Kingdom – Their magnitude and
Prediction – O‟Reilly, P and New, B.M., Tunnelling 1982, pp173-181, 1982
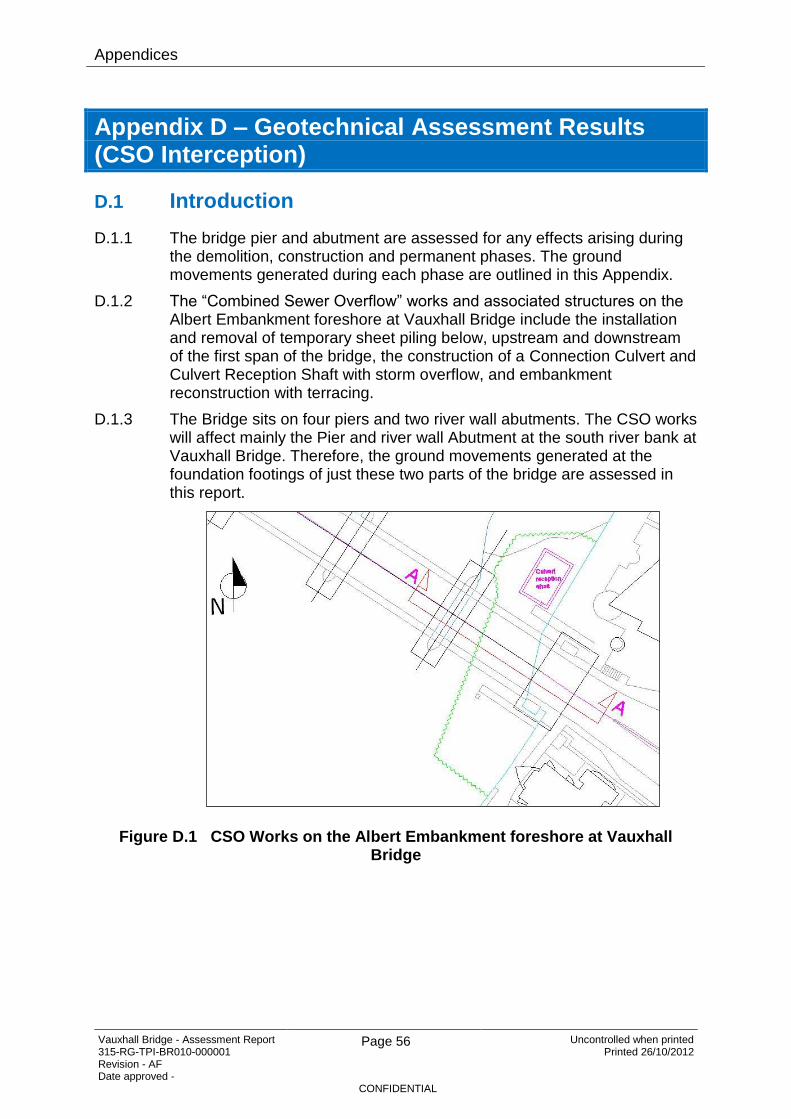
Appendices
Vauxhall Bridge - Assessment Report 315-RG-TPI-BR010-000001 Revision - AF Date approved -
Page 56 Uncontrolled when printed Printed 26/10/2012
CONFIDENTIAL
Appendix D – Geotechnical Assessment Results (CSO Interception)
D.1 Introduction
D.1.1 The bridge pier and abutment are assessed for any effects arising during the demolition, construction and permanent phases. The ground movements generated during each phase are outlined in this Appendix.
D.1.2 The “Combined Sewer Overflow” works and associated structures on the Albert Embankment foreshore at Vauxhall Bridge include the installation and removal of temporary sheet piling below, upstream and downstream of the first span of the bridge, the construction of a Connection Culvert and Culvert Reception Shaft with storm overflow, and embankment reconstruction with terracing.
D.1.3 The Bridge sits on four piers and two river wall abutments. The CSO works will affect mainly the Pier and river wall Abutment at the south river bank at Vauxhall Bridge. Therefore, the ground movements generated at the foundation footings of just these two parts of the bridge are assessed in this report.
Figure D.1 CSO Works on the Albert Embankment foreshore at Vauxhall Bridge

Appendices
Vauxhall Bridge - Assessment Report 315-RG-TPI-BR010-000001 Revision - AF Date approved -
Page 57 Uncontrolled when printed Printed 26/10/2012
CONFIDENTIAL
D.2 Reference Information
D.2.1 The reference information used in the assessment is provided by Thames Tunnel and normal assumptions have been made to cover any further data, necessary to carry out a complete analysis. The parameters used in the assessment are presented in Table D.1
Parameters Values
Culvert Reception Shaft dimensions 13.0m x 20.0m
Approximate Cofferdam excavation area 2700 m2
Approximate river bed level 99.000mATD
Excavation level - Culvert Reception Shaft (Thames Tunnel, 2011) 15.3
Depth level - Culvert Reception Shaft (Thames Tunnel, 2011) 84.200mATD
Final Construction level (Thames Tunnel, 2011) 104.600mATD
Table D.1 CSO Works assessment parameters
Figure D.2 Cross section of CSO Works.

Appendices
Vauxhall Bridge - Assessment Report 315-RG-TPI-BR010-000001 Revision - AF Date approved -
Page 58 Uncontrolled when printed Printed 26/10/2012
CONFIDENTIAL
D.3 Calculation Phases
D.3.1 The construction phases considered in the assessment of ground movement are as described by Thames Tunnel, and normal assumptions regarding the calculation phases.
D.3.2 The calculation phases considered are six, and they represent the “CSO” works:
a. Installation of the temporary sheet pile walls under the south span of the bridge and dredging of 1.0m to 1.5m of the river bed inside the cofferdam;
b. Secant pile installation for the Culvert Reception Shaft construction;
c. Movement behind the secant piles due to excavation of the Culvert Reception Shaft;
d. Heave due to the excavation of the Culvert reception Shaft;
e. Short term movements due to Embankment reconstruction;
f. Long term settlements due to the Embankment reconstruction.
D.3.3 These construction phases are considered in the pier and abutment footing assessment of Vauxhall Bridge.
D.4 Modelling of CSO Works
D.4.1 Ground movements that affect the Albert Embankment foreshore at Vauxhall Bridge due to the CSO Works have been estimated along lines defining the perimeter of the pier and abutment foundations. The loading and unloading of the Bridge foundations at each construction phase is modelled by load areas. The Culvert Reception Shaft construction is modelled by an embedded wall excavation, defined by a polygon describing its plan area, top and bottom levels, and its associated vertical and horizontal ground movement curves.
D.4.2 Each line of the pier and abutment foundation has been divided into intervals of around 1.0m length to obtain a better deformation shape of the footing perimeter, although the exact dimensions and subdivision of the foundations is not clear from the historical drawings of Vauxhall Bridge provided by Thames Tunnel.
D.4.3 The ground movements have been assessed at each construction phase of the CSO Works for the perimeter of the pier and abutment foundation level. The settlement analysis is carried out by the input of linear elastic parameters for the soil layers at the proposed CSO works location. The levels of the stratum are provided by Thames Tunnel, and the two soil layers of interest to the analysis are the river terrace deposits and the London clay. The geotechnical parameters used in the calculation are the Poisson‟s ratio and Elastic modulus, which is considered to vary linearly with depth for the London clay. The assessment of the long term effects on the London clay layer are considered by the input of the drained elastic modulus (E‟). The other construction phases are analysed by the undrained elastic modulus (Eu). The geotechnical parameters assigned to
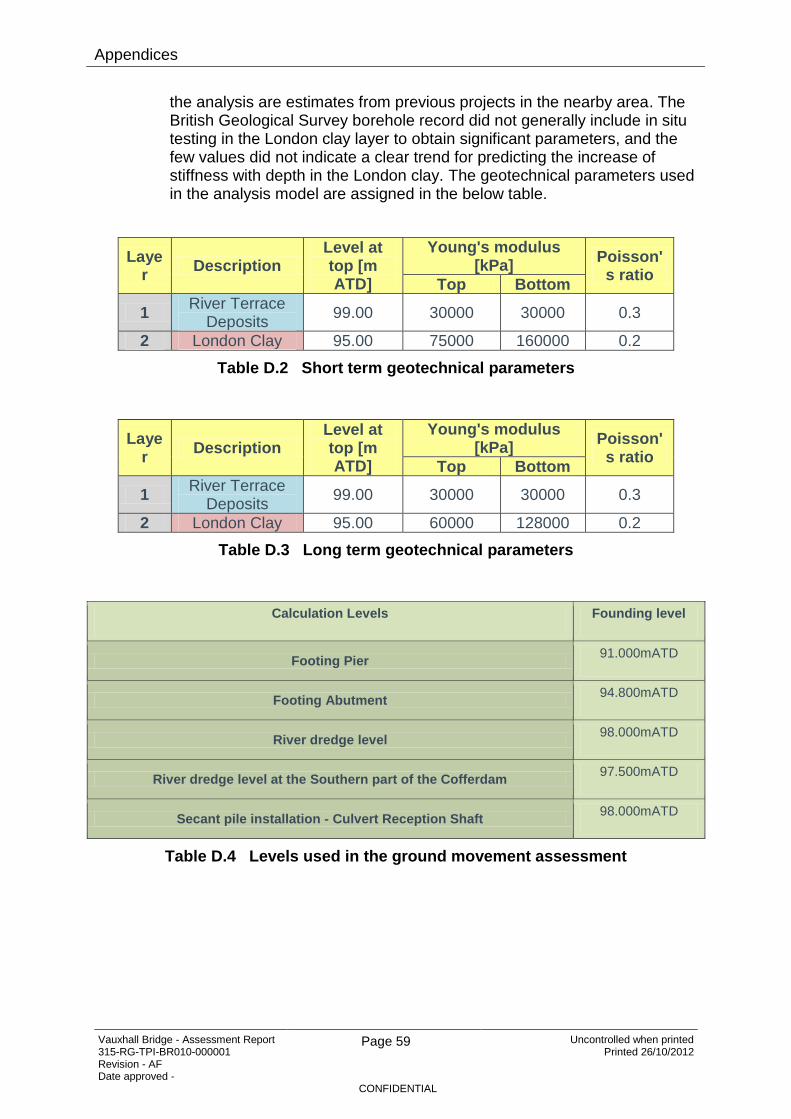
Appendices
Vauxhall Bridge - Assessment Report 315-RG-TPI-BR010-000001 Revision - AF Date approved -
Page 59 Uncontrolled when printed Printed 26/10/2012
CONFIDENTIAL
the analysis are estimates from previous projects in the nearby area. The British Geological Survey borehole record did not generally include in situ testing in the London clay layer to obtain significant parameters, and the few values did not indicate a clear trend for predicting the increase of stiffness with depth in the London clay. The geotechnical parameters used in the analysis model are assigned in the below table.
Layer
Description Level at top [m ATD]
Young's modulus [kPa]
Poisson's ratio
Top Bottom
1 River Terrace
Deposits 99.00 30000 30000 0.3
2 London Clay 95.00 75000 160000 0.2
Table D.2 Short term geotechnical parameters
Layer
Description Level at top [m ATD]
Young's modulus [kPa]
Poisson's ratio
Top Bottom
1 River Terrace
Deposits 99.00 30000 30000 0.3
2 London Clay 95.00 60000 128000 0.2
Table D.3 Long term geotechnical parameters
Calculation Levels Founding level
Footing Pier 91.000mATD
Footing Abutment 94.800mATD
River dredge level 98.000mATD
River dredge level at the Southern part of the Cofferdam 97.500mATD
Secant pile installation - Culvert Reception Shaft 98.000mATD
Table D.4 Levels used in the ground movement assessment

Appendices
Vauxhall Bridge - Assessment Report 315-RG-TPI-BR010-000001 Revision - AF Date approved -
Page 60 Uncontrolled when printed Printed 26/10/2012
CONFIDENTIAL
Figure D.3 Pier & Abutment Calculation Lines
D.5 Construction phases model
D.5.1 The Pier and Abutment footing are modelled in the calculation by lines, which represent the perimeter of the foundation footing. The excavations are modelled by rectangular load areas, which represent approximately the excavation shape. The heave effect caused by the excavation processes is modelled by a negative distribute load. The following loadings are applied in the model:
-19 kN/m2 at Phase 1 (1.0m dredge of the river bed);
-28.5 kN/m2 at Phase 1 (1.5m dredge of the river bed at the southern part of the cofferdam);
-276 kN/m2 at Phase 4 (excavation of the Culvert Reception Shaft, 98.00 ATD piles installation – 84.20 ATD final excavation Shaft level x 20 kN/m3 unit weight);
72 kN/m2 at Phase 5 (in the cases that the armour is 4.0m depth);
54 kN/m2 at Phase 5 (in the cases that the armour is 3.0m depth);
18 kN/m2 at Phase 5 (in the cases that the armour is 1.0m depth);
27 kN/m2 at Phase 5 (in the cases that the armour is 1.5m depth at the southern part of the cofferdam).

Appendices
Vauxhall Bridge - Assessment Report 315-RG-TPI-BR010-000001 Revision - AF Date approved -
Page 61 Uncontrolled when printed Printed 26/10/2012
CONFIDENTIAL
Figure D.4 Model of Calculation Phase 1
Figure D.5 Model of Calculation Phase 2, 3, & 4

Appendices
Vauxhall Bridge - Assessment Report 315-RG-TPI-BR010-000001 Revision - AF Date approved -
Page 62 Uncontrolled when printed Printed 26/10/2012
CONFIDENTIAL
Figure D.6 Model of Calculation Phase 5 & 6
D.6 Methodology
D.6.1 The effects of the CSO works on the pier and abutment foundation on the Albert Foreshore Embankment at Vauxhall Bridge are estimated by two different software programmes. Construction phase 1, 4, 5 and 6 are analysed by the software “Vdisp” of Oasys, which calculates the settlements within a linear or non linear soil mass. Vdisp uses the Boussinesq (1985) analysis method for the displacements estimation. Phase 2 and 3 are analysed by the software “Xdisp” of Oasys, which calculates the ground movements induced by an embedded wall excavation. The method used by Xdisp to estimate the ground movements beside an embedded retaining wall is the proposed method in the CIRIA Report C580. It calculates movements due to the installation of an embedded wall and due to excavation in front of the embedded wall.

Appendices
Vauxhall Bridge - Assessment Report 315-RG-TPI-BR010-000001 Revision - AF Date approved -
Page 63 Uncontrolled when printed Printed 26/10/2012
CONFIDENTIAL
D.7 Assumptions
i The geotechnical data used in the analysis is considered from previous projects in the nearby area;
ii The general layout of the project and the calculation levels are provided by Thames Tunnel drawings and reports;
iii It is assumed in the calculations that in Phase 1 after the installation of the temporary sheet pile wall there would be a 1.0m to 1.5m dredge of the river bed;
iv The Embankment construction at Phase 5 will use crushed stone of 18 kN/m3 unit weight to form protective terraces;
v The Culvert Reception Shaft construction in Phase 2 is assumed to be done by the Installation of secant bored pile wall in stiff clay (CIRIA 580 Fig. 2.8(a));
vi The Culvert Reception Shaft excavation in Phase 3 is modelled as excavation in front of a high stiffness wall in stiff clay (CIRIA 580 Fig. 2.11(a));
vii The vertical ground movements (settlements) generated by each calculation phase are analysed, plus the horizontal movements in Phase 2 and 3;
viii The Thames River tidal level is considered in the calculations not to affect the cofferdams, and the excavated clay is assumed to have a bulk unit weight;
ix The tidal cycle effect in the cofferdam area will not generate any overpore pressure in the London Clay;
x The Short term settlement profile at Phase 5 is obtained by adding to Phase 5 the contribution of the previous calculations;
xi The Long term settlement profile at Phase 6 is obtained by adding to Phase 6 the contribution of the previous calculations, except Phase 5;
xii It is assumed in V-disp analysis a rigid boundary at 0.00 m ATD.
D.8 Analysis
D.8.1 Each calculation has been divided into intervals of around 1.0m length; this will give the ground movements for the Pier and the Abutment.
D.8.2 In the analysis vertical ground movements are shown as positive if they are settlements (S), while heave effects are shown as negative.
D.8.3 The ground movements for each line have been calculated for each progressive calculation phase. The displacements of the calculation lines change for each of the 6 phases of the CSO Works construction.
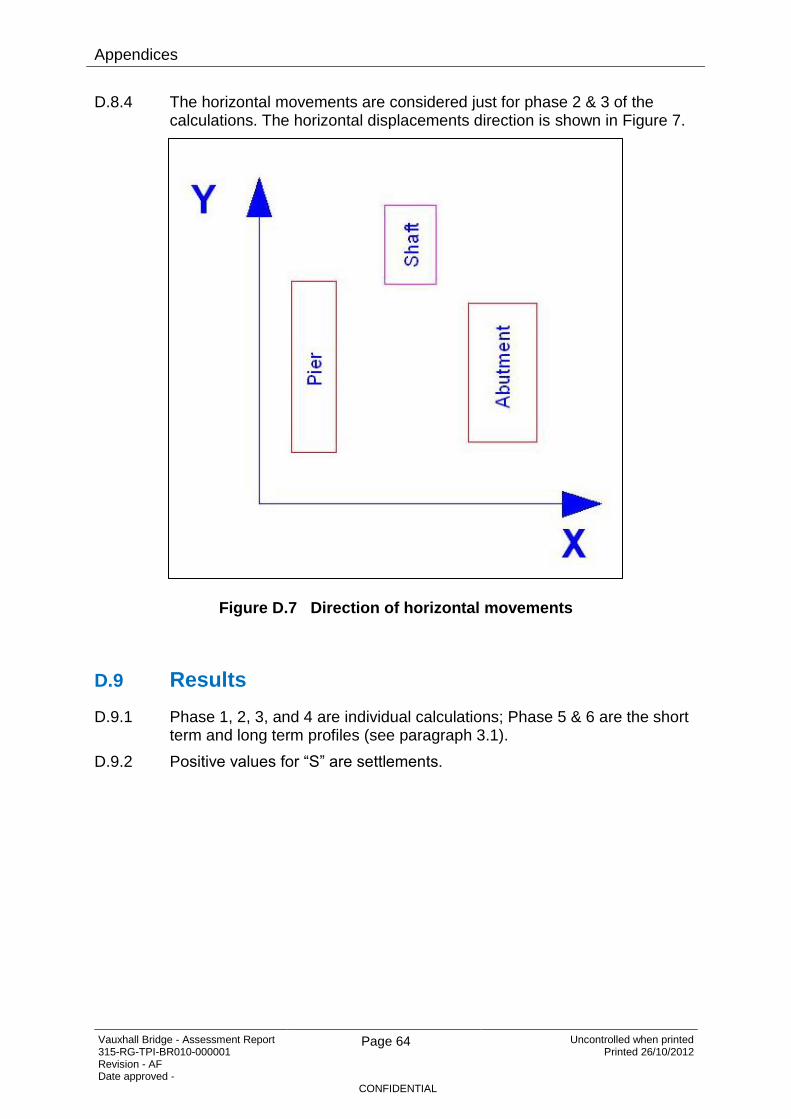
Appendices
Vauxhall Bridge - Assessment Report 315-RG-TPI-BR010-000001 Revision - AF Date approved -
Page 64 Uncontrolled when printed Printed 26/10/2012
CONFIDENTIAL
D.8.4 The horizontal movements are considered just for phase 2 & 3 of the calculations. The horizontal displacements direction is shown in Figure 7.
Figure D.7 Direction of horizontal movements
D.9 Results
D.9.1 Phase 1, 2, 3, and 4 are individual calculations; Phase 5 & 6 are the short term and long term profiles (see paragraph 3.1).
D.9.2 Positive values for “S” are settlements.

Appendices
Vauxhall Bridge - Assessment Report 315-RG-TPI-BR010-000001 Revision - AF Date approved -
Page 65 Uncontrolled when printed Printed 26/10/2012
CONFIDENTIAL
Line 1 - Pier Line 3 - Pier S/mm Phase 1 Phase 2 Phase 3 Phase 4 Phase 5 Phase 6 S/mm Phase 1 Phase 2 Phase 3 Phase 4 Phase 5 Phase 6
0.00 -1.275 0.000 0.000 -0.429 0.072 0.536 0.00 -1.364 0.000 0.229 -2.121 -1.109 -0.549 1.13 -1.343 0.000 0.000 -0.442 0.083 0.570 1.13 -1.450 0.000 0.320 -2.269 -1.119 -0.524 2.26 -1.415 0.000 0.000 -0.454 0.097 0.609 2.26 -1.544 0.000 0.453 -2.430 -1.095 -0.464 3.38 -1.492 0.000 0.000 -0.467 0.111 0.650 3.38 -1.647 0.000 0.634 -2.603 -1.032 -0.361 4.51 -1.575 0.000 0.000 -0.479 0.127 0.694 4.51 -1.761 0.000 0.869 -2.793 -0.927 -0.214 5.64 -1.663 0.000 0.000 -0.492 0.144 0.741 5.64 -1.886 0.000 1.158 -3.001 -0.780 -0.021 6.77 -1.758 0.000 0.000 -0.504 0.163 0.792 6.77 -2.024 0.000 1.499 -3.227 -0.594 0.216 7.90 -1.860 0.000 0.000 -0.516 0.185 0.848 7.90 -2.175 0.000 1.887 -3.476 -0.375 0.488 9.02 -1.970 0.000 0.000 -0.527 0.209 0.910 9.02 -2.337 0.000 2.312 -3.746 -0.130 0.790
10.15 -2.089 0.000 0.000 -0.539 0.235 0.975 10.15 -2.509 0.283 2.763 -4.047 0.404 1.384 11.28 -2.218 0.000 0.000 -0.550 0.265 1.047 11.28 -2.686 0.565 3.225 -4.380 0.931 1.970
Line 2 - Pier Line 4 - Pier S/mm Phase 1 Phase 2 Phase 3 Phase 4 Phase 5 Phase 6 S/mm Phase 1 Phase 2 Phase 3 Phase 4 Phase 5 Phase 6
0.00 -1.275 0.000 0.000 -0.429 0.072 0.536 0.00 -2.218 0.000 0.000 -0.550 0.265 1.047 1.43 -1.285 0.000 0.000 -0.458 0.061 0.532 1.43 -2.239 0.000 0.000 -0.591 0.254 1.050 2.86 -1.295 0.000 0.000 -0.489 0.048 0.526 2.86 -2.259 0.000 0.000 -0.635 0.239 1.048 4.29 -1.304 0.000 0.000 -0.521 0.032 0.517 4.29 -2.279 0.000 0.000 -0.682 0.219 1.039 5.72 -1.312 0.000 0.000 -0.555 0.015 0.507 5.72 -2.296 0.000 0.000 -0.733 0.195 1.027 7.15 -1.319 0.000 0.000 -0.592 -0.005 0.493 7.15 -2.310 0.000 0.000 -0.788 0.168 1.011 8.58 -1.326 0.000 0.000 -0.631 -0.029 0.475 8.58 -2.323 0.000 0.000 -0.847 0.136 0.990
10.01 -1.332 0.000 0.000 -0.672 -0.054 0.456 10.01 -2.332 0.000 0.000 -0.911 0.102 0.965 11.44 -1.338 0.000 0.000 -0.715 -0.082 0.433 11.44 -2.340 0.000 0.000 -0.980 0.062 0.936 12.87 -1.343 0.000 0.000 -0.761 -0.114 0.406 12.87 -2.347 0.000 0.000 -1.053 0.019 0.902 14.30 -1.347 0.000 0.000 -0.809 -0.147 0.378 14.30 -2.352 0.000 0.000 -1.133 -0.029 0.863 15.73 -1.352 0.000 0.000 -0.860 -0.185 0.344 15.73 -2.356 0.000 0.000 -1.219 -0.083 0.819 17.16 -1.356 0.000 0.000 -0.913 -0.226 0.309 17.16 -2.360 0.000 0.000 -1.311 -0.142 0.769 18.59 -1.359 0.000 0.000 -0.969 -0.269 0.270 18.59 -2.365 0.000 0.064 -1.411 -0.146 0.774 20.02 -1.363 0.000 0.000 -1.028 -0.317 0.225 20.02 -2.370 0.000 0.119 -1.518 -0.166 0.764 21.45 -1.367 0.000 0.000 -1.089 -0.368 0.178 21.45 -2.377 0.000 0.168 -1.633 -0.203 0.736 22.88 -1.370 0.000 0.000 -1.152 -0.421 0.128 22.88 -2.385 0.000 0.235 -1.757 -0.232 0.716 24.31 -1.374 0.000 0.000 -1.218 -0.479 0.073 24.31 -2.397 0.000 0.338 -1.890 -0.239 0.718 25.74 -1.377 0.000 0.000 -1.286 -0.539 0.016 25.74 -2.412 0.000 0.487 -2.033 -0.213 0.752 27.17 -1.381 0.000 0.000 -1.357 -0.604 -0.046 27.17 -2.433 0.000 0.684 -2.186 -0.156 0.817 28.60 -1.384 0.000 0.053 -1.428 -0.616 -0.056 28.60 -2.459 0.000 0.928 -2.349 -0.066 0.915 30.03 -1.387 0.000 0.088 -1.502 -0.651 -0.089 30.03 -2.493 0.000 1.213 -2.523 0.046 1.036 31.46 -1.390 0.000 0.114 -1.576 -0.695 -0.131 31.46 -2.532 0.000 1.525 -2.708 0.171 1.168 32.89 -1.392 0.000 0.136 -1.650 -0.744 -0.179 32.89 -2.574 0.000 1.851 -2.902 0.298 1.303 34.32 -1.393 0.000 0.156 -1.724 -0.795 -0.229 34.32 -2.614 0.000 2.174 -3.106 0.415 1.427 35.75 -1.392 0.000 0.175 -1.797 -0.846 -0.280 35.75 -2.648 0.105 2.477 -3.317 0.617 1.636 37.18 -1.390 0.000 0.193 -1.869 -0.898 -0.331 37.18 -2.674 0.271 2.744 -3.534 0.846 1.872 38.61 -1.387 0.000 0.209 -1.938 -0.949 -0.383 38.61 -2.689 0.404 2.961 -3.754 1.003 2.033 40.04 -1.381 0.000 0.220 -2.004 -1.002 -0.437 40.04 -2.696 0.499 3.117 -3.972 1.074 2.109 41.47 -1.374 0.000 0.227 -2.065 -1.056 -0.492 41.47 -2.696 0.553 3.205 -4.183 1.050 2.088 42.90 -1.364 0.000 0.229 -2.121 -1.109 -0.549 42.90 -2.688 0.565 3.225 -4.384 0.928 1.968
Table D.5 Results Pier foundation level – Settlements

Appendices
Vauxhall Bridge - Assessment Report 315-RG-TPI-BR010-000001 Revision - AF Date approved -
Page 66 Uncontrolled when printed Printed 26/10/2012
CONFIDENTIAL
Line 1 - Abutment Line 3 - Abutment S/mm Phase 1 Phase 2 Phase 3 Phase 4 Phase 5 Phase 6 S/mm Phase 1 Phase 2 Phase 3 Phase 4 Phase 5
0.00 -5.079 0.000 0.125 -0.658 4.738 7.328 0.00 -2.500 2.955 7.625 -4.329 8.698 1.14 -4.870 0.000 0.114 -0.646 4.578 7.068 1.14 -2.343 2.703 7.465 -4.043 8.384 2.28 -4.662 0.000 0.100 -0.634 4.404 6.804 2.28 -2.202 2.446 7.237 -3.778 8.000 3.41 -4.458 0.000 0.083 -0.621 4.231 6.535 3.41 -2.074 2.183 6.950 -3.534 7.551 4.55 -4.253 0.000 0.064 -0.607 4.061 6.273 4.55 -1.958 1.917 6.612 -3.305 7.049 5.69 -4.037 0.000 0.040 -0.593 3.894 6.019 5.69 -1.851 1.648 6.234 -3.093 6.501 6.83 -3.803 0.000 0.011 -0.579 3.724 5.749 6.83 -1.753 1.377 5.824 -2.895 5.916 7.97 -3.544 0.000 0.000 -0.565 3.566 5.485 7.97 -1.662 1.105 5.391 -2.712 5.303 9.10 -3.265 0.000 0.000 -0.550 3.398 5.202 9.10 -1.578 0.830 4.945 -2.543 4.667
10.24 -2.987 0.000 0.000 -0.536 3.181 4.857 10.24 -1.500 0.555 4.494 -2.384 4.022 11.38 -2.736 0.000 0.000 -0.521 2.901 4.440 11.38 -1.427 0.278 4.044 -2.236 3.373 12.52 -2.519 0.000 0.000 -0.506 2.580 3.981 12.52 -1.359 0.001 3.604 -2.098 2.727 13.66 -2.332 0.000 0.000 -0.491 2.262 3.533 13.66 -1.295 0.000 3.178 -1.970 2.366 14.79 -2.169 0.000 0.000 -0.476 1.977 3.132 14.79 -1.234 0.000 2.773 -1.851 2.024 15.93 -2.026 0.000 0.000 -0.461 1.733 2.788 15.93 -1.177 0.000 2.393 -1.739 1.702 17.07 -1.897 0.000 0.000 -0.447 1.530 2.498 17.07 -1.123 0.000 2.041 -1.634 1.404
Line 2 - Abutment Line 4 - Abutment S/mm Phase 1 Phase 2 Phase 3 Phase 4 Phase 5 Phase 6 S/mm Phase 1 Phase 2 Phase 3 Phase 4 Phase 5
0.00 -1.897 0.000 0.000 -0.447 1.530 2.498 0.00 -5.079 0.000 0.125 -0.658 4.738 1.17 -1.860 0.000 0.000 -0.470 1.450 2.395 1.17 -4.827 0.000 0.173 -0.699 4.583 2.33 -1.823 0.000 0.000 -0.495 1.366 2.287 2.33 -4.607 0.000 0.215 -0.742 4.419 3.50 -1.786 0.000 0.000 -0.520 1.282 2.178 3.50 -4.428 0.000 0.261 -0.789 4.271 4.67 -1.750 0.000 0.000 -0.547 1.199 2.073 4.67 -4.285 0.000 0.318 -0.838 4.156 5.84 -1.714 0.000 0.026 -0.575 1.146 1.998 5.84 -4.168 0.000 0.391 -0.891 4.075 7.00 -1.680 0.000 0.086 -0.605 1.129 1.961 7.00 -4.072 0.000 0.487 -0.947 4.032 8.17 -1.648 0.000 0.131 -0.635 1.101 1.914 8.17 -3.990 0.000 0.608 -1.007 4.024 9.34 -1.617 0.000 0.168 -0.667 1.067 1.863 9.34 -3.919 0.000 0.759 -1.071 4.051
10.51 -1.587 0.000 0.202 -0.700 1.032 1.811 10.51 -3.857 0.000 0.942 -1.139 4.110 11.67 -1.559 0.000 0.235 -0.735 0.998 1.762 11.67 -3.801 0.000 1.157 -1.211 4.200 12.84 -1.532 0.000 0.272 -0.771 0.967 1.717 12.84 -3.751 0.000 1.407 -1.289 4.315 14.01 -1.505 0.000 0.314 -0.808 0.945 1.681 14.01 -3.704 0.000 1.689 -1.372 4.452 15.18 -1.480 0.000 0.365 -0.847 0.928 1.651 15.18 -3.661 0.000 2.003 -1.461 4.602 16.34 -1.456 0.000 0.424 -0.886 0.921 1.631 16.34 -3.619 0.000 2.347 -1.555 4.765 17.51 -1.432 0.000 0.494 -0.927 0.924 1.621 17.51 -3.579 0.000 2.718 -1.657 4.935 18.68 -1.409 0.000 0.573 -0.970 0.936 1.621 18.68 -3.539 0.000 3.111 -1.766 5.119 19.85 -1.387 0.000 0.662 -1.013 0.957 1.630 19.85 -3.499 0.000 3.522 -1.881 5.322 21.01 -1.365 0.000 0.760 -1.058 0.985 1.647 21.01 -3.458 0.217 3.946 -2.005 5.755 22.18 -1.343 0.000 0.867 -1.104 1.023 1.673 22.18 -3.415 0.483 4.376 -2.139 6.240 23.35 -1.322 0.000 0.980 -1.151 1.065 1.704 23.35 -3.368 0.746 4.806 -2.282 6.715 24.51 -1.301 0.000 1.097 -1.198 1.111 1.739 24.51 -3.316 1.004 5.229 -2.433 7.168 25.68 -1.280 0.000 1.218 -1.247 1.159 1.776 25.68 -3.256 1.259 5.637 -2.596 7.585 26.85 -1.260 0.000 1.340 -1.296 1.208 1.814 26.85 -3.185 1.508 6.024 -2.771 7.952 28.02 -1.240 0.000 1.461 -1.345 1.256 1.851 28.02 -3.097 1.750 6.381 -2.957 8.265 29.18 -1.220 0.000 1.578 -1.394 1.300 1.884 29.18 -2.990 1.985 6.702 -3.154 8.516 30.35 -1.200 0.000 1.689 -1.443 1.338 1.911 30.35 -2.869 2.209 6.981 -3.365 8.701 31.52 -1.180 0.000 1.793 -1.492 1.370 1.932 31.52 -2.750 2.422 7.213 -3.589 8.814 32.69 -1.161 0.000 1.888 -1.540 1.392 1.944 32.69 -2.648 2.619 7.397 -3.824 8.851 33.85 -1.142 0.000 1.971 -1.587 1.404 1.945 33.85 -2.566 2.798 7.533 -4.069 8.812 35.02 -1.123 0.000 2.041 -1.633 1.405 1.934 35.02 -2.499 2.955 7.625 -4.326 8.699
Table D.6 Results Abutment foundation level - Settlements

Appendices
Vauxhall Bridge - Assessment Report 315-RG-TPI-BR010-000001 Revision - AF Date approved -
Page 67 Uncontrolled when printed Printed 26/10/2012
CONFIDENTIAL
Line 1 - Pier Line 3 - Pier Line 1 - Pier Line 3 - Pier X/mm Phase 2 Phase 3 X/mm Phase 2 Phase 3 Y/mm Phase 2 Phase 3 Y/mm Phase 2 Phase 3
0.00 0.000 0.000 0.00 0.000 1.718 0.00 0.000 0.000 0.00 0.000 0.000 1.13 0.000 0.000 1.13 0.000 2.141 1.13 0.000 0.000 1.13 0.000 0.000 2.26 0.000 0.000 2.26 0.000 2.564 2.26 0.000 0.000 2.26 0.000 0.000 3.38 0.000 0.000 3.38 0.000 2.987 3.38 0.000 0.000 3.38 0.000 0.000 4.51 0.000 0.000 4.51 0.000 3.410 4.51 0.000 0.000 4.51 0.000 0.000 5.64 0.000 0.000 5.64 0.000 3.833 5.64 0.000 0.000 5.64 0.000 0.000 6.77 0.000 0.000 6.77 0.000 4.256 6.77 0.000 0.000 6.77 0.000 0.000 7.90 0.000 0.000 7.90 0.000 4.679 7.90 0.000 0.000 7.90 0.000 0.000 9.02 0.000 0.000 9.02 0.000 5.102 9.02 0.000 0.000 9.02 0.000 0.000
10.15 0.000 0.000 10.15 0.000 5.525 10.15 0.000 0.000 10.15 0.000 0.000 11.28 0.000 0.000 11.28 0.000 5.948 11.28 0.000 0.000 11.28 0.000 0.000 Line 2 - Pier Line 4 - Pier Line 2 - Pier Line 4 - Pier X/mm Phase 2 Phase 3 X/mm Phase 2 Phase 3 Y/mm Phase 2 Phase 3 Y/mm Phase 2 Phase 3
0.00 0.000 0.000 0.00 0.000 0.000 0.00 0.000 0.000 0.00 0.000 0.000 1.43 0.000 0.000 1.43 0.000 0.000 1.43 0.000 0.000 1.43 0.000 0.000 2.86 0.000 0.000 2.86 0.000 0.000 2.86 0.000 0.000 2.86 0.000 0.000 4.29 0.000 0.000 4.29 0.000 0.000 4.29 0.000 0.000 4.29 0.000 0.000 5.72 0.000 0.000 5.72 0.000 0.000 5.72 0.000 0.000 5.72 0.000 0.000 7.15 0.000 0.000 7.15 0.000 0.000 7.15 0.000 0.000 7.15 0.000 0.000 8.58 0.000 0.000 8.58 0.000 0.000 8.58 0.000 0.000 8.58 0.000 0.000
10.01 0.000 0.000 10.01 0.000 0.000 10.01 0.000 0.000 10.01 0.000 0.000 11.44 0.000 0.000 11.44 0.000 0.000 11.44 0.000 0.000 11.44 0.000 0.000 12.87 0.000 0.000 12.87 0.000 0.000 12.87 0.000 0.000 12.87 0.000 0.000 14.30 0.000 0.000 14.30 0.000 0.000 14.30 0.000 0.000 14.30 0.000 0.000 15.73 0.000 0.000 15.73 0.000 0.000 15.73 0.000 0.000 15.73 0.000 0.000 17.16 0.000 0.000 17.16 0.000 0.000 17.16 0.000 0.000 17.16 0.000 0.000 18.59 0.000 0.000 18.59 0.000 0.148 18.59 0.000 0.000 18.59 0.000 0.309 20.02 0.000 0.000 20.02 0.000 0.371 20.02 0.000 0.000 20.02 0.000 0.730 21.45 0.000 0.000 21.45 0.000 0.616 21.45 0.000 0.000 21.45 0.000 1.133 22.88 0.000 0.000 22.88 0.000 0.882 22.88 0.000 0.000 22.88 0.000 1.515 24.31 0.000 0.000 24.31 0.000 1.174 24.31 0.000 0.000 24.31 0.000 1.869 25.74 0.000 0.000 25.74 0.000 1.494 25.74 0.000 0.000 25.74 0.000 2.191 27.17 0.000 0.000 27.17 0.000 1.843 27.17 0.000 0.000 27.17 0.000 2.473 28.60 0.000 0.226 28.60 0.000 2.224 28.60 0.000 0.138 28.60 0.000 2.706 30.03 0.000 0.465 30.03 0.000 2.637 30.03 0.000 0.255 30.03 0.000 2.879 31.46 0.000 0.696 31.46 0.000 3.081 31.46 0.000 0.337 31.46 0.000 2.978 32.89 0.000 0.915 32.89 0.000 3.551 32.89 0.000 0.386 32.89 0.000 2.989 34.32 0.000 1.116 34.32 0.000 4.037 34.32 0.000 0.401 34.32 0.000 2.894 35.75 0.000 1.296 35.75 0.000 4.525 35.75 0.000 0.385 35.75 0.000 2.679 37.18 0.000 1.449 37.18 0.000 4.989 37.18 0.000 0.339 37.18 0.000 2.330 38.61 0.000 1.571 38.61 0.000 5.398 38.61 0.000 0.269 38.61 0.000 1.847 40.04 0.000 1.658 40.04 0.000 5.715 40.04 0.000 0.181 40.04 0.000 1.242 41.47 0.000 1.707 41.47 0.000 5.904 41.47 0.000 0.079 41.47 0.000 0.545 42.90 0.000 1.718 42.90 0.000 5.948 42.90 0.000 0.000 42.90 0.000 0.000
Table D.7 Results Pier foundation level – Horizontal Movements
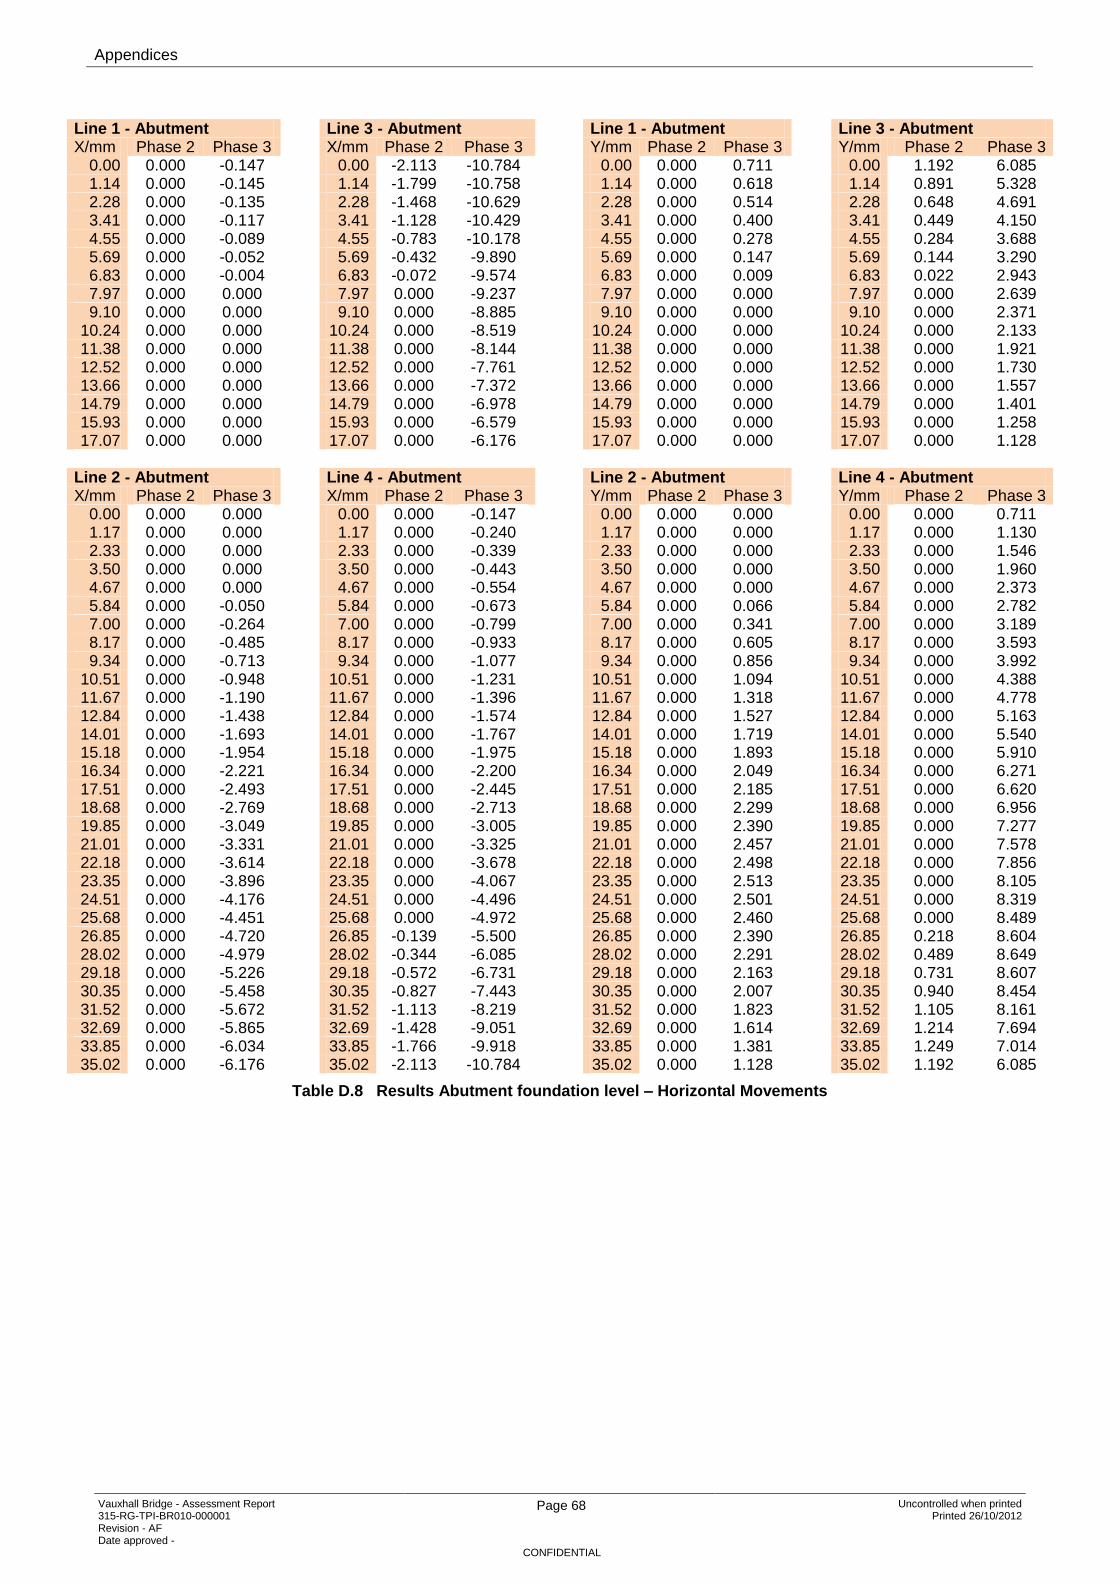
Appendices
Vauxhall Bridge - Assessment Report 315-RG-TPI-BR010-000001 Revision - AF Date approved -
Page 68 Uncontrolled when printed Printed 26/10/2012
CONFIDENTIAL
Line 1 - Abutment Line 3 - Abutment Line 1 - Abutment Line 3 - Abutment X/mm Phase 2 Phase 3 X/mm Phase 2 Phase 3 Y/mm Phase 2 Phase 3 Y/mm Phase 2 Phase 3
0.00 0.000 -0.147 0.00 -2.113 -10.784 0.00 0.000 0.711 0.00 1.192 6.085 1.14 0.000 -0.145 1.14 -1.799 -10.758 1.14 0.000 0.618 1.14 0.891 5.328 2.28 0.000 -0.135 2.28 -1.468 -10.629 2.28 0.000 0.514 2.28 0.648 4.691 3.41 0.000 -0.117 3.41 -1.128 -10.429 3.41 0.000 0.400 3.41 0.449 4.150 4.55 0.000 -0.089 4.55 -0.783 -10.178 4.55 0.000 0.278 4.55 0.284 3.688 5.69 0.000 -0.052 5.69 -0.432 -9.890 5.69 0.000 0.147 5.69 0.144 3.290 6.83 0.000 -0.004 6.83 -0.072 -9.574 6.83 0.000 0.009 6.83 0.022 2.943 7.97 0.000 0.000 7.97 0.000 -9.237 7.97 0.000 0.000 7.97 0.000 2.639 9.10 0.000 0.000 9.10 0.000 -8.885 9.10 0.000 0.000 9.10 0.000 2.371
10.24 0.000 0.000 10.24 0.000 -8.519 10.24 0.000 0.000 10.24 0.000 2.133 11.38 0.000 0.000 11.38 0.000 -8.144 11.38 0.000 0.000 11.38 0.000 1.921 12.52 0.000 0.000 12.52 0.000 -7.761 12.52 0.000 0.000 12.52 0.000 1.730 13.66 0.000 0.000 13.66 0.000 -7.372 13.66 0.000 0.000 13.66 0.000 1.557 14.79 0.000 0.000 14.79 0.000 -6.978 14.79 0.000 0.000 14.79 0.000 1.401 15.93 0.000 0.000 15.93 0.000 -6.579 15.93 0.000 0.000 15.93 0.000 1.258 17.07 0.000 0.000 17.07 0.000 -6.176 17.07 0.000 0.000 17.07 0.000 1.128
Line 2 - Abutment Line 4 - Abutment Line 2 - Abutment Line 4 - Abutment X/mm Phase 2 Phase 3 X/mm Phase 2 Phase 3 Y/mm Phase 2 Phase 3 Y/mm Phase 2 Phase 3
0.00 0.000 0.000 0.00 0.000 -0.147 0.00 0.000 0.000 0.00 0.000 0.711 1.17 0.000 0.000 1.17 0.000 -0.240 1.17 0.000 0.000 1.17 0.000 1.130 2.33 0.000 0.000 2.33 0.000 -0.339 2.33 0.000 0.000 2.33 0.000 1.546 3.50 0.000 0.000 3.50 0.000 -0.443 3.50 0.000 0.000 3.50 0.000 1.960 4.67 0.000 0.000 4.67 0.000 -0.554 4.67 0.000 0.000 4.67 0.000 2.373 5.84 0.000 -0.050 5.84 0.000 -0.673 5.84 0.000 0.066 5.84 0.000 2.782 7.00 0.000 -0.264 7.00 0.000 -0.799 7.00 0.000 0.341 7.00 0.000 3.189 8.17 0.000 -0.485 8.17 0.000 -0.933 8.17 0.000 0.605 8.17 0.000 3.593 9.34 0.000 -0.713 9.34 0.000 -1.077 9.34 0.000 0.856 9.34 0.000 3.992
10.51 0.000 -0.948 10.51 0.000 -1.231 10.51 0.000 1.094 10.51 0.000 4.388 11.67 0.000 -1.190 11.67 0.000 -1.396 11.67 0.000 1.318 11.67 0.000 4.778 12.84 0.000 -1.438 12.84 0.000 -1.574 12.84 0.000 1.527 12.84 0.000 5.163 14.01 0.000 -1.693 14.01 0.000 -1.767 14.01 0.000 1.719 14.01 0.000 5.540 15.18 0.000 -1.954 15.18 0.000 -1.975 15.18 0.000 1.893 15.18 0.000 5.910 16.34 0.000 -2.221 16.34 0.000 -2.200 16.34 0.000 2.049 16.34 0.000 6.271 17.51 0.000 -2.493 17.51 0.000 -2.445 17.51 0.000 2.185 17.51 0.000 6.620 18.68 0.000 -2.769 18.68 0.000 -2.713 18.68 0.000 2.299 18.68 0.000 6.956 19.85 0.000 -3.049 19.85 0.000 -3.005 19.85 0.000 2.390 19.85 0.000 7.277 21.01 0.000 -3.331 21.01 0.000 -3.325 21.01 0.000 2.457 21.01 0.000 7.578 22.18 0.000 -3.614 22.18 0.000 -3.678 22.18 0.000 2.498 22.18 0.000 7.856 23.35 0.000 -3.896 23.35 0.000 -4.067 23.35 0.000 2.513 23.35 0.000 8.105 24.51 0.000 -4.176 24.51 0.000 -4.496 24.51 0.000 2.501 24.51 0.000 8.319 25.68 0.000 -4.451 25.68 0.000 -4.972 25.68 0.000 2.460 25.68 0.000 8.489 26.85 0.000 -4.720 26.85 -0.139 -5.500 26.85 0.000 2.390 26.85 0.218 8.604 28.02 0.000 -4.979 28.02 -0.344 -6.085 28.02 0.000 2.291 28.02 0.489 8.649 29.18 0.000 -5.226 29.18 -0.572 -6.731 29.18 0.000 2.163 29.18 0.731 8.607 30.35 0.000 -5.458 30.35 -0.827 -7.443 30.35 0.000 2.007 30.35 0.940 8.454 31.52 0.000 -5.672 31.52 -1.113 -8.219 31.52 0.000 1.823 31.52 1.105 8.161 32.69 0.000 -5.865 32.69 -1.428 -9.051 32.69 0.000 1.614 32.69 1.214 7.694 33.85 0.000 -6.034 33.85 -1.766 -9.918 33.85 0.000 1.381 33.85 1.249 7.014 35.02 0.000 -6.176 35.02 -2.113 -10.784 35.02 0.000 1.128 35.02 1.192 6.085
Table D.8 Results Abutment foundation level – Horizontal Movements
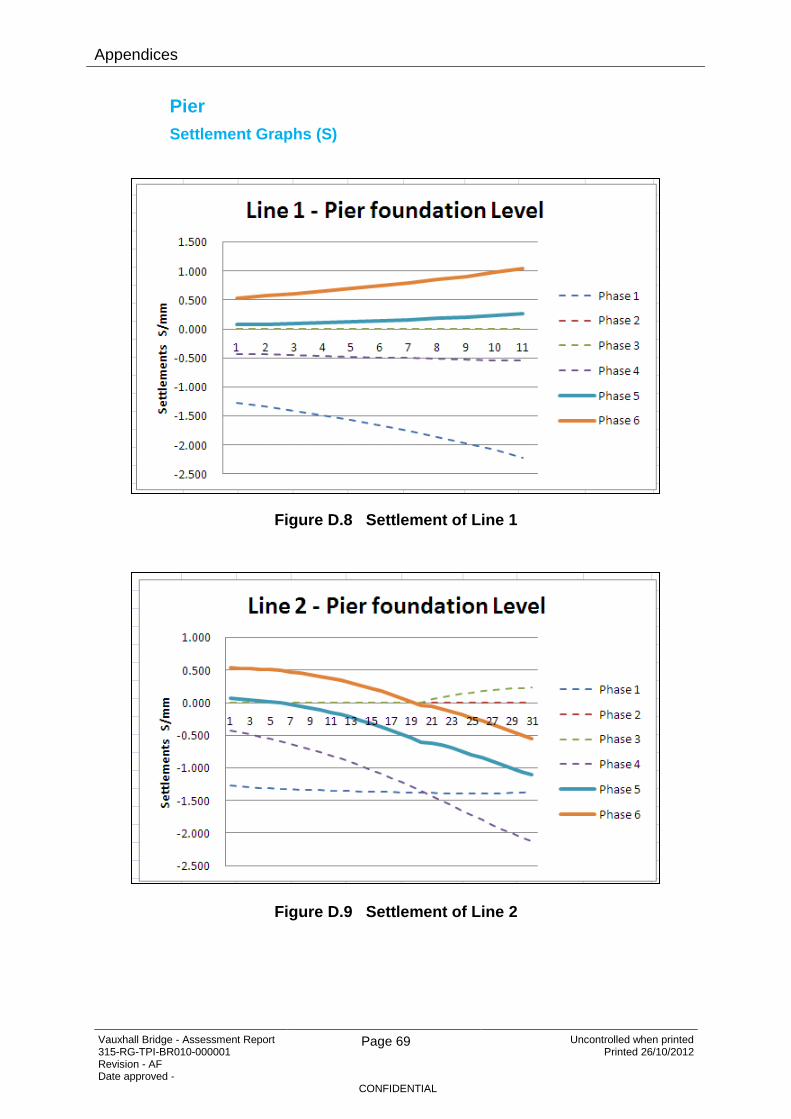
Appendices
Vauxhall Bridge - Assessment Report 315-RG-TPI-BR010-000001 Revision - AF Date approved -
Page 69 Uncontrolled when printed Printed 26/10/2012
CONFIDENTIAL
Pier
Settlement Graphs (S)
Figure D.8 Settlement of Line 1
Figure D.9 Settlement of Line 2
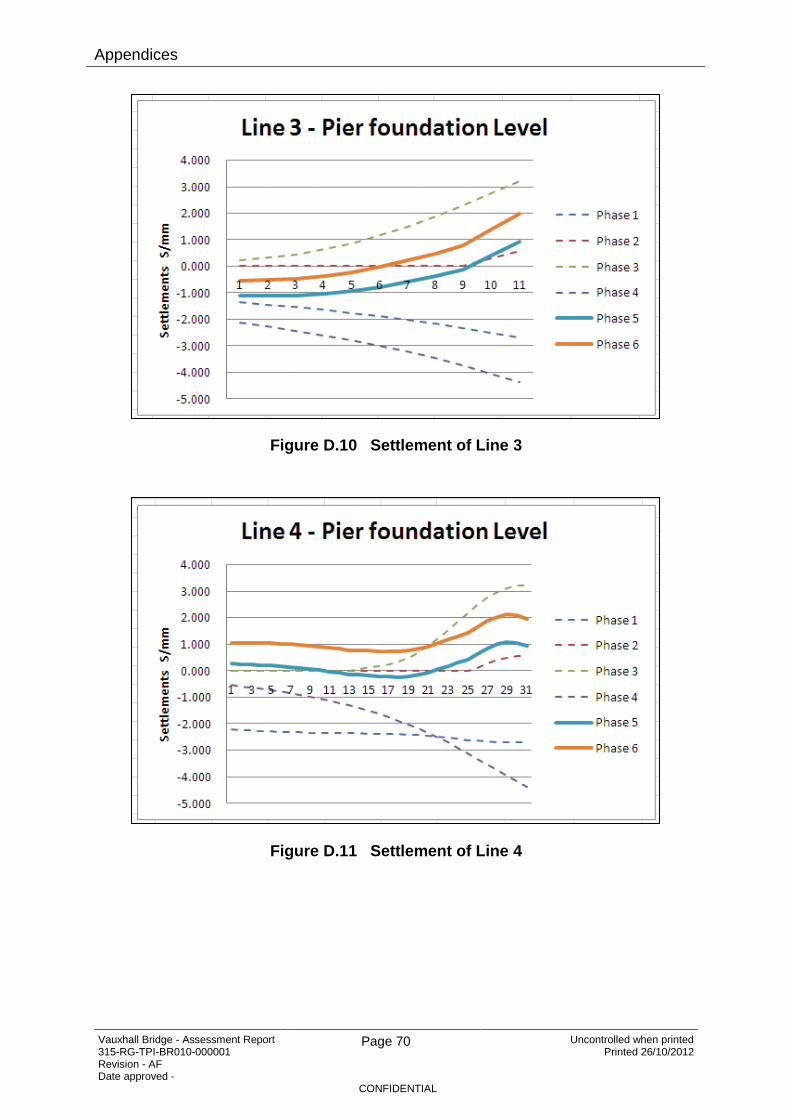
Appendices
Vauxhall Bridge - Assessment Report 315-RG-TPI-BR010-000001 Revision - AF Date approved -
Page 70 Uncontrolled when printed Printed 26/10/2012
CONFIDENTIAL
Figure D.10 Settlement of Line 3
Figure D.11 Settlement of Line 4
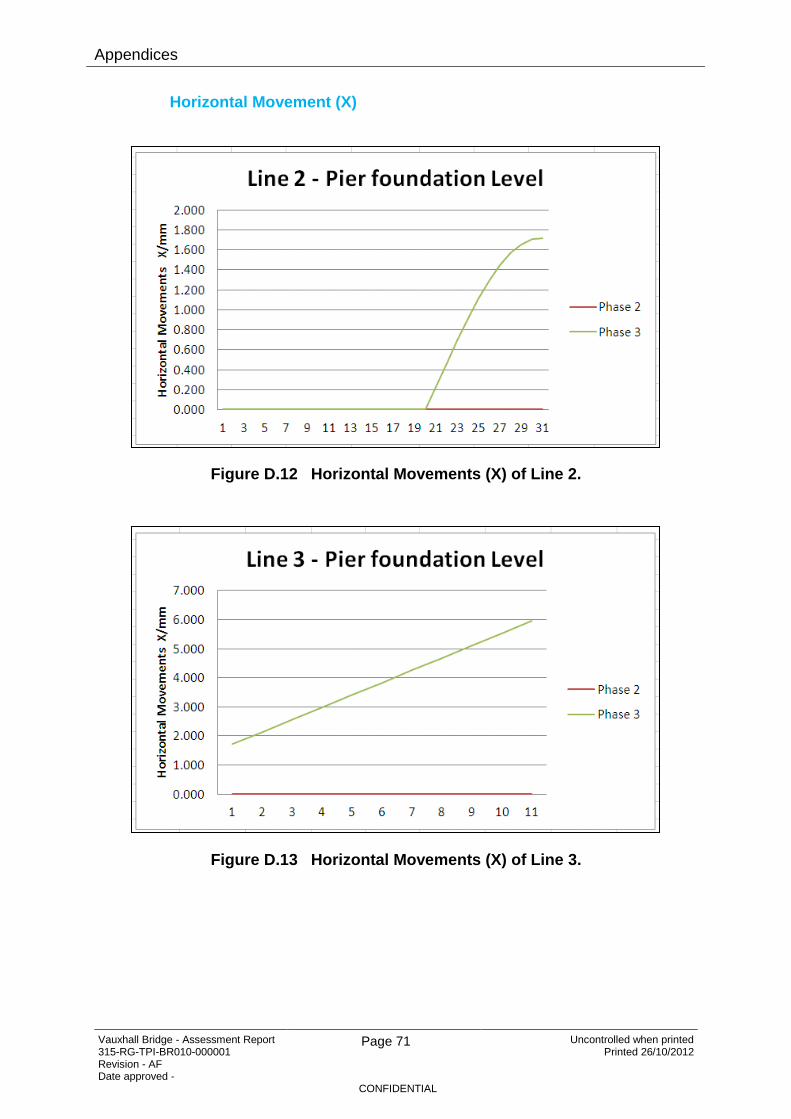
Appendices
Vauxhall Bridge - Assessment Report 315-RG-TPI-BR010-000001 Revision - AF Date approved -
Page 71 Uncontrolled when printed Printed 26/10/2012
CONFIDENTIAL
Horizontal Movement (X)
Figure D.12 Horizontal Movements (X) of Line 2.
Figure D.13 Horizontal Movements (X) of Line 3.
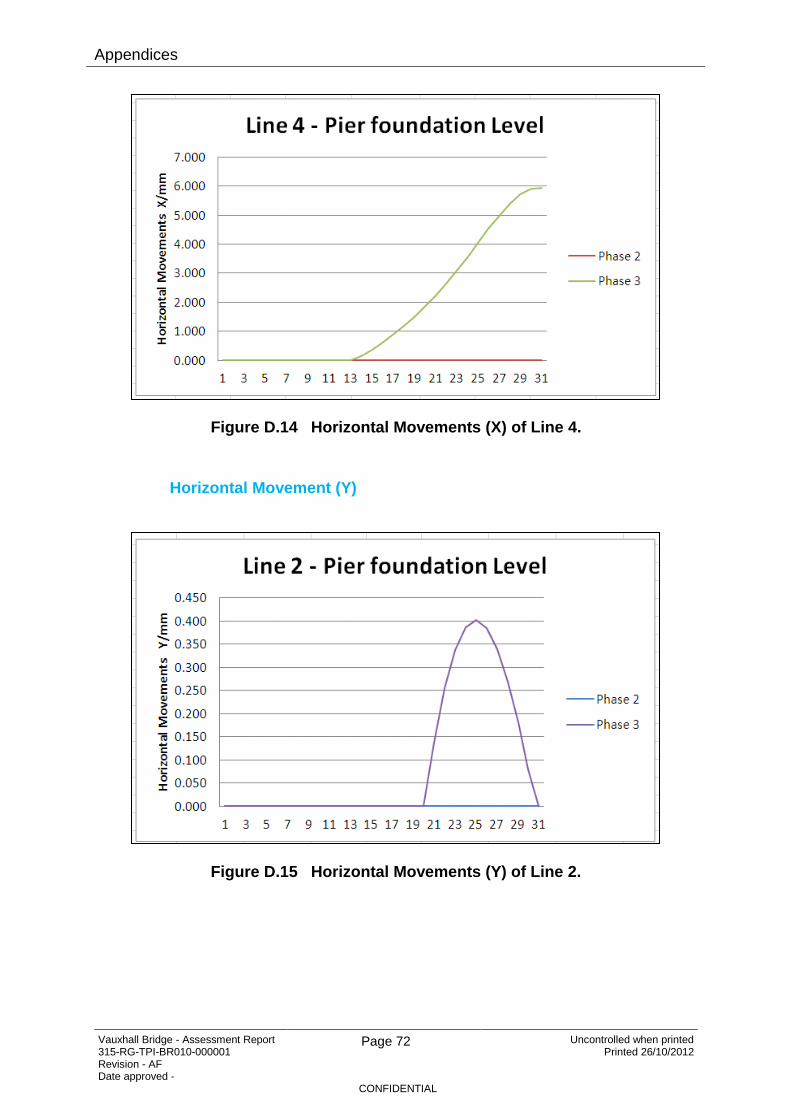
Appendices
Vauxhall Bridge - Assessment Report 315-RG-TPI-BR010-000001 Revision - AF Date approved -
Page 72 Uncontrolled when printed Printed 26/10/2012
CONFIDENTIAL
Figure D.14 Horizontal Movements (X) of Line 4.
Horizontal Movement (Y)
Figure D.15 Horizontal Movements (Y) of Line 2.

Appendices
Vauxhall Bridge - Assessment Report 315-RG-TPI-BR010-000001 Revision - AF Date approved -
Page 73 Uncontrolled when printed Printed 26/10/2012
CONFIDENTIAL
Figure D.16 Horizontal Movements (Y) of Line 4.
D.9.3 Phase 1, 2, 3, and 4 are individual calculations; Phase 5 & 6 are the short term and long term profiles (see paragraph 3.1).
Abutment
Settlement Graphs (S)
Figure D.17 Settlement of Line 1

Appendices
Vauxhall Bridge - Assessment Report 315-RG-TPI-BR010-000001 Revision - AF Date approved -
Page 74 Uncontrolled when printed Printed 26/10/2012
CONFIDENTIAL
Figure D.18 Settlement of Line 2
Figure D.19 Settlement of Line 3
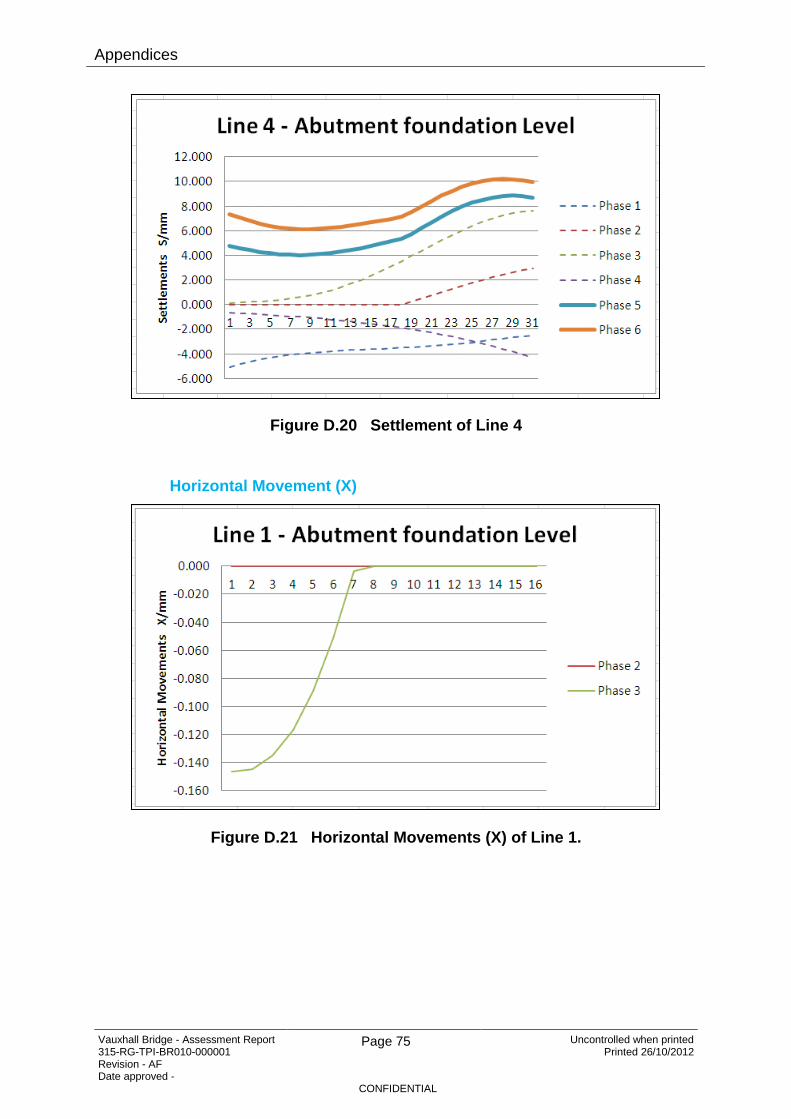
Appendices
Vauxhall Bridge - Assessment Report 315-RG-TPI-BR010-000001 Revision - AF Date approved -
Page 75 Uncontrolled when printed Printed 26/10/2012
CONFIDENTIAL
Figure D.20 Settlement of Line 4
Horizontal Movement (X)
Figure D.21 Horizontal Movements (X) of Line 1.

Appendices
Vauxhall Bridge - Assessment Report 315-RG-TPI-BR010-000001 Revision - AF Date approved -
Page 76 Uncontrolled when printed Printed 26/10/2012
CONFIDENTIAL
Figure D.22 Horizontal Movements (X) of Line 2.
Figure D.23 Horizontal Movements (X) of Line 3.
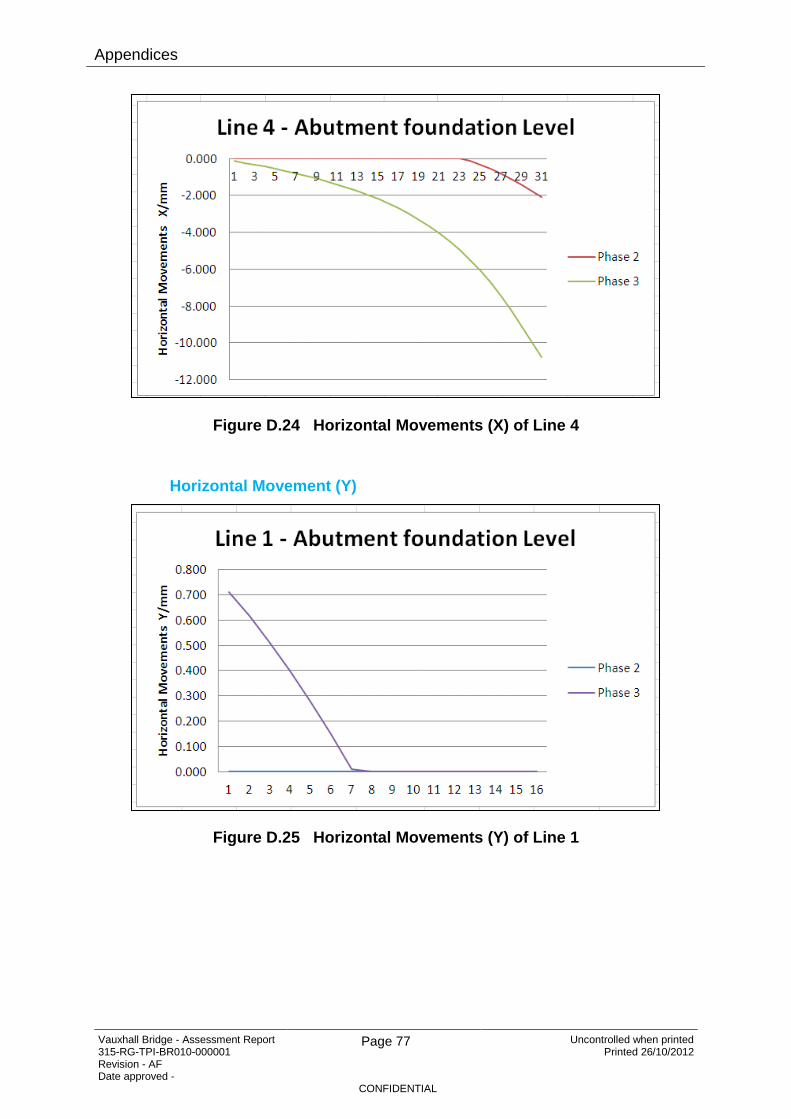
Appendices
Vauxhall Bridge - Assessment Report 315-RG-TPI-BR010-000001 Revision - AF Date approved -
Page 77 Uncontrolled when printed Printed 26/10/2012
CONFIDENTIAL
Figure D.24 Horizontal Movements (X) of Line 4
Horizontal Movement (Y)
Figure D.25 Horizontal Movements (Y) of Line 1
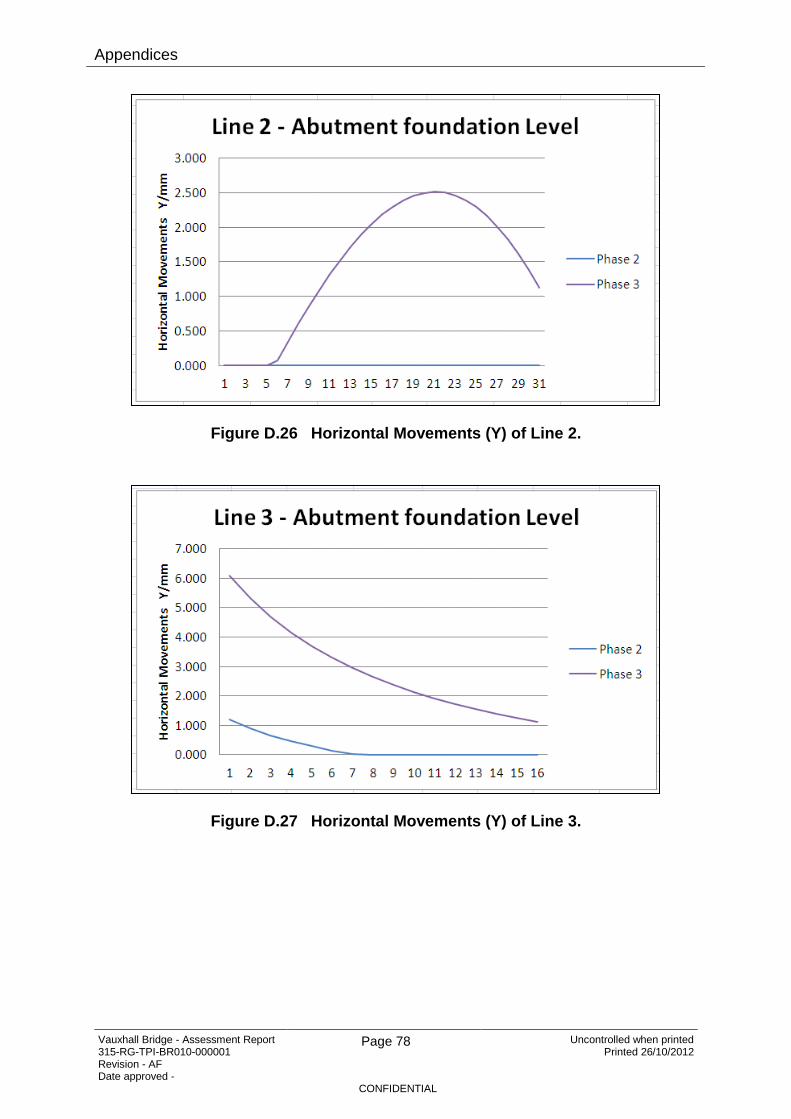
Appendices
Vauxhall Bridge - Assessment Report 315-RG-TPI-BR010-000001 Revision - AF Date approved -
Page 78 Uncontrolled when printed Printed 26/10/2012
CONFIDENTIAL
Figure D.26 Horizontal Movements (Y) of Line 2.
Figure D.27 Horizontal Movements (Y) of Line 3.

Appendices
Vauxhall Bridge - Assessment Report 315-RG-TPI-BR010-000001 Revision - AF Date approved -
Page 79 Uncontrolled when printed Printed 26/10/2012
CONFIDENTIAL
Figure D.28 Horizontal Movements (Y) of Line 4.
D.9.4 Phase 1, 2, 3, and 4 are individual calculations; Phase 5 & 6 are the short term and long term profiles (see paragraph 3.1).
Appendices
Vauxhall Bridge - Assessment Report 315-RG-TPI-BR010-000001 Revision - AF Date approved -
Page 80 Uncontrolled when printed Printed 26/10/2012
CONFIDENTIAL
D.10 Bibliography
Atkins H&T. (2012). Historical drawings of Vauxhall Bridge received from Atkins Highways & Transportation. Thames Tunnel Information.
Davis, P. a. (1974). Elastic Solutions for Soil and Rock Mechanics. Wiley and Sons Inc. (p16);.
Oasys. (2007). Vdisp Manual – Version 18.2. Newcastle Upon Tyne: Oasys Ltd.
Oasys. (2011). Xdisp Manual - Version 19.2. Newcastle Upon Tyne: Oasys Ltd.
Thames Tunnel. (2011). Construction Phases - Phase 1. 100-DA-CNS-PLH1X-259105_AH . London: Thames Tunnel.
Thames Tunnel. (2011). Construction Phases - Phase 2. 100-DA-CNS-PLH1X-259106_AH . London: Thames Tunnel.
Thames Tunnel. (2011). Construction Phases - Phase 3. 100-DA-CNS-PLH1X-259107_AH . London: Thames Tunnel.
Thames Tunnel. (2011). Construction report - Albert Embankment Foreshore. 100-RG-CNL-PLH1X-000010_AC . London: Thames Tunnel.
Thames Tunnel. (2011). Existing site plan - Sheet 1 of 2. 100-DA-CVL-PLH1X-359005_AA . London: Thames Tunnel.
Thames Tunnel. (2011). Proposed landscape plan [interception location]. 100-DA-ARC-PLH1X-759150_AC . London: Thames Tunnel.
Thames Tunnel. (2011). Vauxhall Bridge/CSO Works: interface Assessment - Scope Document. London: 100-RU-TPI-BR010-000001_AA.

Appendices
Vauxhall Bridge - Assessment Report 315-RG-TPI-BR010-000001 Revision - AF Date approved -
Page 81 Uncontrolled when printed Printed 26/10/2012
CONFIDENTIAL
Appendix E – Settlement Summary
Figure E.1 Axis System relative to bridge deck
Shore Span Settlements
DX
(mm) DY
(mm) DZ
(mm) RX (deg) RY (deg) RZ (deg)
Maximum Settlement -0.452 0.816 0 0.005 0.07 0.003
Minimum Settlement -6.265 -1.916 -5.5 -0.002 -0.078 -0.004
Intermediate Span
Settlements
DX
(mm) DY
(mm) DZ
(mm) RX (deg) RY (deg) RZ (deg)
Maximum Settlement 0.406 1.06 -0.395 0.019 0.135 0.005
Minimum Settlement -1.852 -2.941 -7.92 -0.02 -0.132 -0.006
Centre Span Settlements
DX
(mm) DY
(mm) DZ
(mm) RX (deg) RY (deg) RZ (deg)
Maximum Settlement 5.225 -0.201 0 0.007 0.058 0.005
Minimum Settlement 0.663 -1.856 -3.72 -0.005 -0.053 -0.001
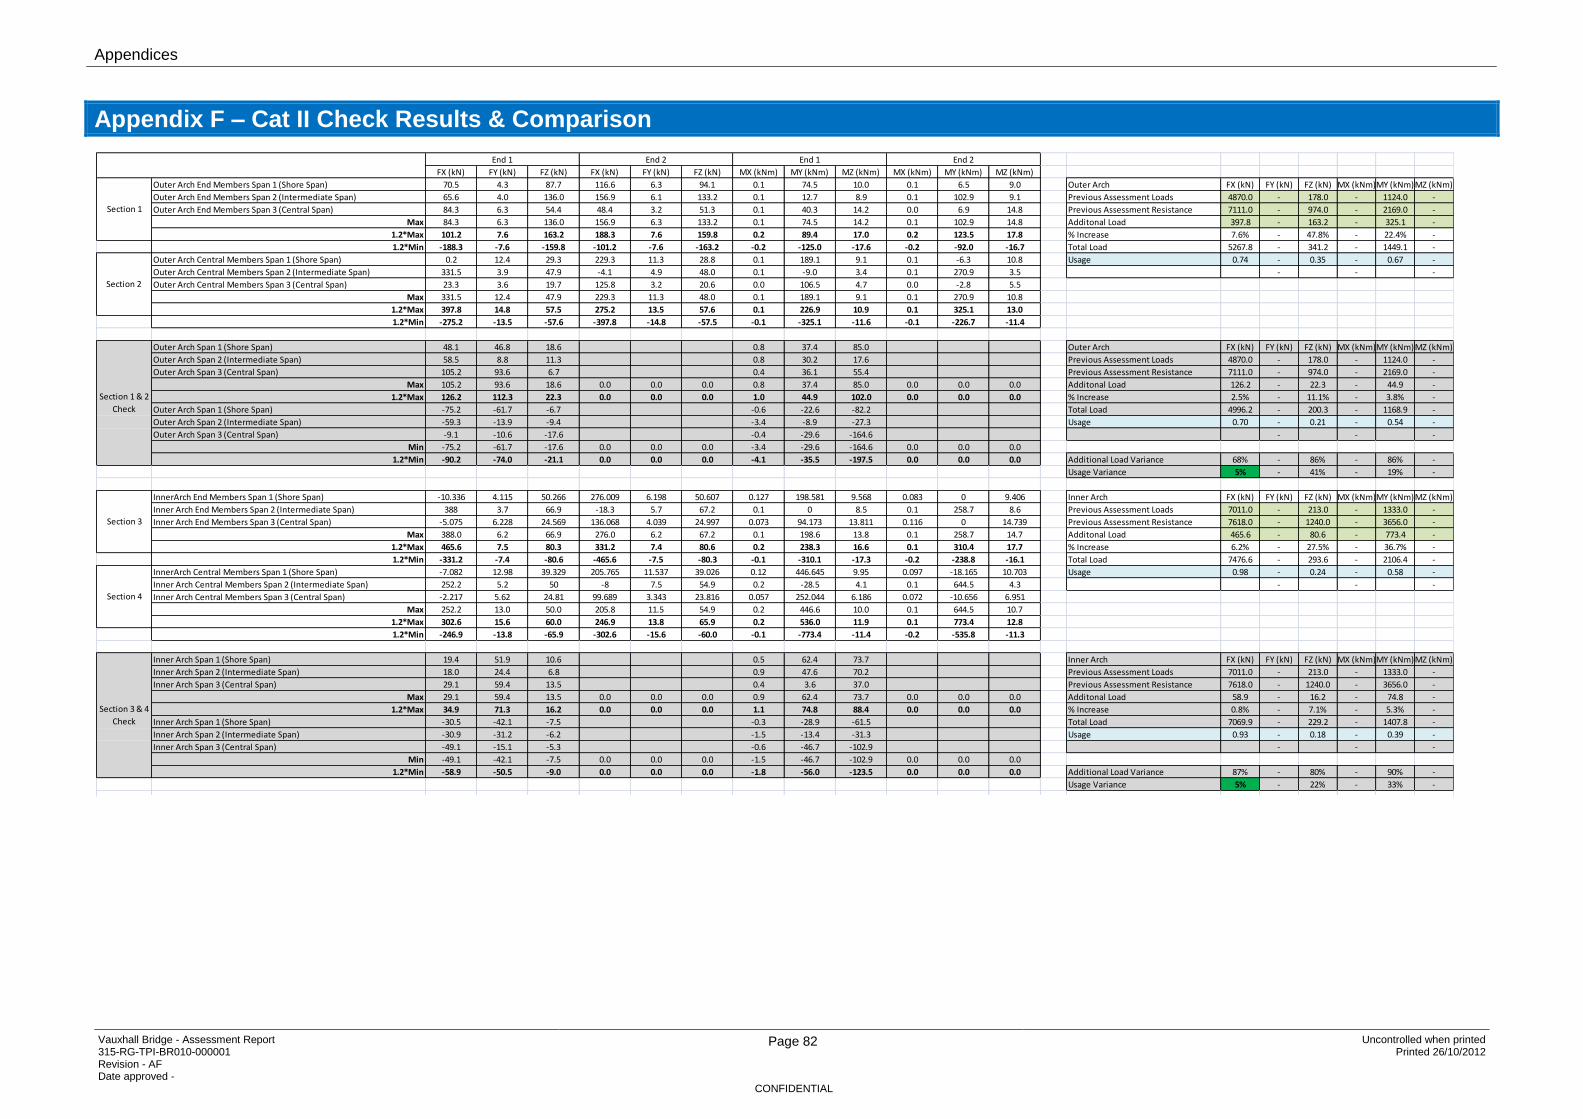
Appendices
Vauxhall Bridge - Assessment Report 315-RG-TPI-BR010-000001 Revision - AF Date approved -
Page 82 Uncontrolled when printed Printed 26/10/2012
CONFIDENTIAL
Appendix F – Cat II Check Results & Comparison
FX (kN) FY (kN) FZ (kN) FX (kN) FY (kN) FZ (kN) MX (kNm) MY (kNm) MZ (kNm) MX (kNm) MY (kNm) MZ (kNm)
Outer Arch End Members Span 1 (Shore Span) 70.5 4.3 87.7 116.6 6.3 94.1 0.1 74.5 10.0 0.1 6.5 9.0 Outer Arch FX (kN) FY (kN) FZ (kN) MX (kNm)MY (kNm)MZ (kNm)
Outer Arch End Members Span 2 (Intermediate Span) 65.6 4.0 136.0 156.9 6.1 133.2 0.1 12.7 8.9 0.1 102.9 9.1 Previous Assessment Loads 4870.0 - 178.0 - 1124.0 -
Outer Arch End Members Span 3 (Central Span) 84.3 6.3 54.4 48.4 3.2 51.3 0.1 40.3 14.2 0.0 6.9 14.8 Previous Assessment Resistance 7111.0 - 974.0 - 2169.0 -
Max 84.3 6.3 136.0 156.9 6.3 133.2 0.1 74.5 14.2 0.1 102.9 14.8 Additonal Load 397.8 - 163.2 - 325.1 -
1.2*Max 101.2 7.6 163.2 188.3 7.6 159.8 0.2 89.4 17.0 0.2 123.5 17.8 % Increase 7.6% - 47.8% - 22.4% -
1.2*Min -188.3 -7.6 -159.8 -101.2 -7.6 -163.2 -0.2 -125.0 -17.6 -0.2 -92.0 -16.7 Total Load 5267.8 - 341.2 - 1449.1 -
Outer Arch Central Members Span 1 (Shore Span) 0.2 12.4 29.3 229.3 11.3 28.8 0.1 189.1 9.1 0.1 -6.3 10.8 Usage 0.74 - 0.35 - 0.67 -
Outer Arch Central Members Span 2 (Intermediate Span) 331.5 3.9 47.9 -4.1 4.9 48.0 0.1 -9.0 3.4 0.1 270.9 3.5 - - -
Outer Arch Central Members Span 3 (Central Span) 23.3 3.6 19.7 125.8 3.2 20.6 0.0 106.5 4.7 0.0 -2.8 5.5
Max 331.5 12.4 47.9 229.3 11.3 48.0 0.1 189.1 9.1 0.1 270.9 10.8
1.2*Max 397.8 14.8 57.5 275.2 13.5 57.6 0.1 226.9 10.9 0.1 325.1 13.0
1.2*Min -275.2 -13.5 -57.6 -397.8 -14.8 -57.5 -0.1 -325.1 -11.6 -0.1 -226.7 -11.4
Outer Arch Span 1 (Shore Span) 48.1 46.8 18.6 0.8 37.4 85.0 Outer Arch FX (kN) FY (kN) FZ (kN) MX (kNm)MY (kNm)MZ (kNm)
Outer Arch Span 2 (Intermediate Span) 58.5 8.8 11.3 0.8 30.2 17.6 Previous Assessment Loads 4870.0 - 178.0 - 1124.0 -
Outer Arch Span 3 (Central Span) 105.2 93.6 6.7 0.4 36.1 55.4 Previous Assessment Resistance 7111.0 - 974.0 - 2169.0 -
Max 105.2 93.6 18.6 0.0 0.0 0.0 0.8 37.4 85.0 0.0 0.0 0.0 Additonal Load 126.2 - 22.3 - 44.9 -
1.2*Max 126.2 112.3 22.3 0.0 0.0 0.0 1.0 44.9 102.0 0.0 0.0 0.0 % Increase 2.5% - 11.1% - 3.8% -
Outer Arch Span 1 (Shore Span) -75.2 -61.7 -6.7 -0.6 -22.6 -82.2 Total Load 4996.2 - 200.3 - 1168.9 -
Outer Arch Span 2 (Intermediate Span) -59.3 -13.9 -9.4 -3.4 -8.9 -27.3 Usage 0.70 - 0.21 - 0.54 -
Outer Arch Span 3 (Central Span) -9.1 -10.6 -17.6 -0.4 -29.6 -164.6 - - -
Min -75.2 -61.7 -17.6 0.0 0.0 0.0 -3.4 -29.6 -164.6 0.0 0.0 0.0
1.2*Min -90.2 -74.0 -21.1 0.0 0.0 0.0 -4.1 -35.5 -197.5 0.0 0.0 0.0 Additional Load Variance 68% - 86% - 86% -
Usage Variance 5% - 41% - 19% -
InnerArch End Members Span 1 (Shore Span) -10.336 4.115 50.266 276.009 6.198 50.607 0.127 198.581 9.568 0.083 0 9.406 Inner Arch FX (kN) FY (kN) FZ (kN) MX (kNm)MY (kNm)MZ (kNm)
Inner Arch End Members Span 2 (Intermediate Span) 388 3.7 66.9 -18.3 5.7 67.2 0.1 0 8.5 0.1 258.7 8.6 Previous Assessment Loads 7011.0 - 213.0 - 1333.0 -
Inner Arch End Members Span 3 (Central Span) -5.075 6.228 24.569 136.068 4.039 24.997 0.073 94.173 13.811 0.116 0 14.739 Previous Assessment Resistance 7618.0 - 1240.0 - 3656.0 -
Max 388.0 6.2 66.9 276.0 6.2 67.2 0.1 198.6 13.8 0.1 258.7 14.7 Additonal Load 465.6 - 80.6 - 773.4 -
1.2*Max 465.6 7.5 80.3 331.2 7.4 80.6 0.2 238.3 16.6 0.1 310.4 17.7 % Increase 6.2% - 27.5% - 36.7% -
1.2*Min -331.2 -7.4 -80.6 -465.6 -7.5 -80.3 -0.1 -310.1 -17.3 -0.2 -238.8 -16.1 Total Load 7476.6 - 293.6 - 2106.4 -
InnerArch Central Members Span 1 (Shore Span) -7.082 12.98 39.329 205.765 11.537 39.026 0.12 446.645 9.95 0.097 -18.165 10.703 Usage 0.98 - 0.24 - 0.58 -
Inner Arch Central Members Span 2 (Intermediate Span) 252.2 5.2 50 -8 7.5 54.9 0.2 -28.5 4.1 0.1 644.5 4.3 - - -
Inner Arch Central Members Span 3 (Central Span) -2.217 5.62 24.81 99.689 3.343 23.816 0.057 252.044 6.186 0.072 -10.656 6.951
Max 252.2 13.0 50.0 205.8 11.5 54.9 0.2 446.6 10.0 0.1 644.5 10.7
1.2*Max 302.6 15.6 60.0 246.9 13.8 65.9 0.2 536.0 11.9 0.1 773.4 12.8
1.2*Min -246.9 -13.8 -65.9 -302.6 -15.6 -60.0 -0.1 -773.4 -11.4 -0.2 -535.8 -11.3
Inner Arch Span 1 (Shore Span) 19.4 51.9 10.6 0.5 62.4 73.7 Inner Arch FX (kN) FY (kN) FZ (kN) MX (kNm)MY (kNm)MZ (kNm)
Inner Arch Span 2 (Intermediate Span) 18.0 24.4 6.8 0.9 47.6 70.2 Previous Assessment Loads 7011.0 - 213.0 - 1333.0 -
Inner Arch Span 3 (Central Span) 29.1 59.4 13.5 0.4 3.6 37.0 Previous Assessment Resistance 7618.0 - 1240.0 - 3656.0 -
Max 29.1 59.4 13.5 0.0 0.0 0.0 0.9 62.4 73.7 0.0 0.0 0.0 Additonal Load 58.9 - 16.2 - 74.8 -
1.2*Max 34.9 71.3 16.2 0.0 0.0 0.0 1.1 74.8 88.4 0.0 0.0 0.0 % Increase 0.8% - 7.1% - 5.3% -
Inner Arch Span 1 (Shore Span) -30.5 -42.1 -7.5 -0.3 -28.9 -61.5 Total Load 7069.9 - 229.2 - 1407.8 -
Inner Arch Span 2 (Intermediate Span) -30.9 -31.2 -6.2 -1.5 -13.4 -31.3 Usage 0.93 - 0.18 - 0.39 -
Inner Arch Span 3 (Central Span) -49.1 -15.1 -5.3 -0.6 -46.7 -102.9 - - -
Min -49.1 -42.1 -7.5 0.0 0.0 0.0 -1.5 -46.7 -102.9 0.0 0.0 0.0
1.2*Min -58.9 -50.5 -9.0 0.0 0.0 0.0 -1.8 -56.0 -123.5 0.0 0.0 0.0 Additional Load Variance 87% - 80% - 90% -
Usage Variance 5% - 22% - 33% -
Section 3 & 4
Check
Section 1
Section 2
Section 3
Section 4
Section 1 & 2
Check
End 1 End 2 End 1 End 2
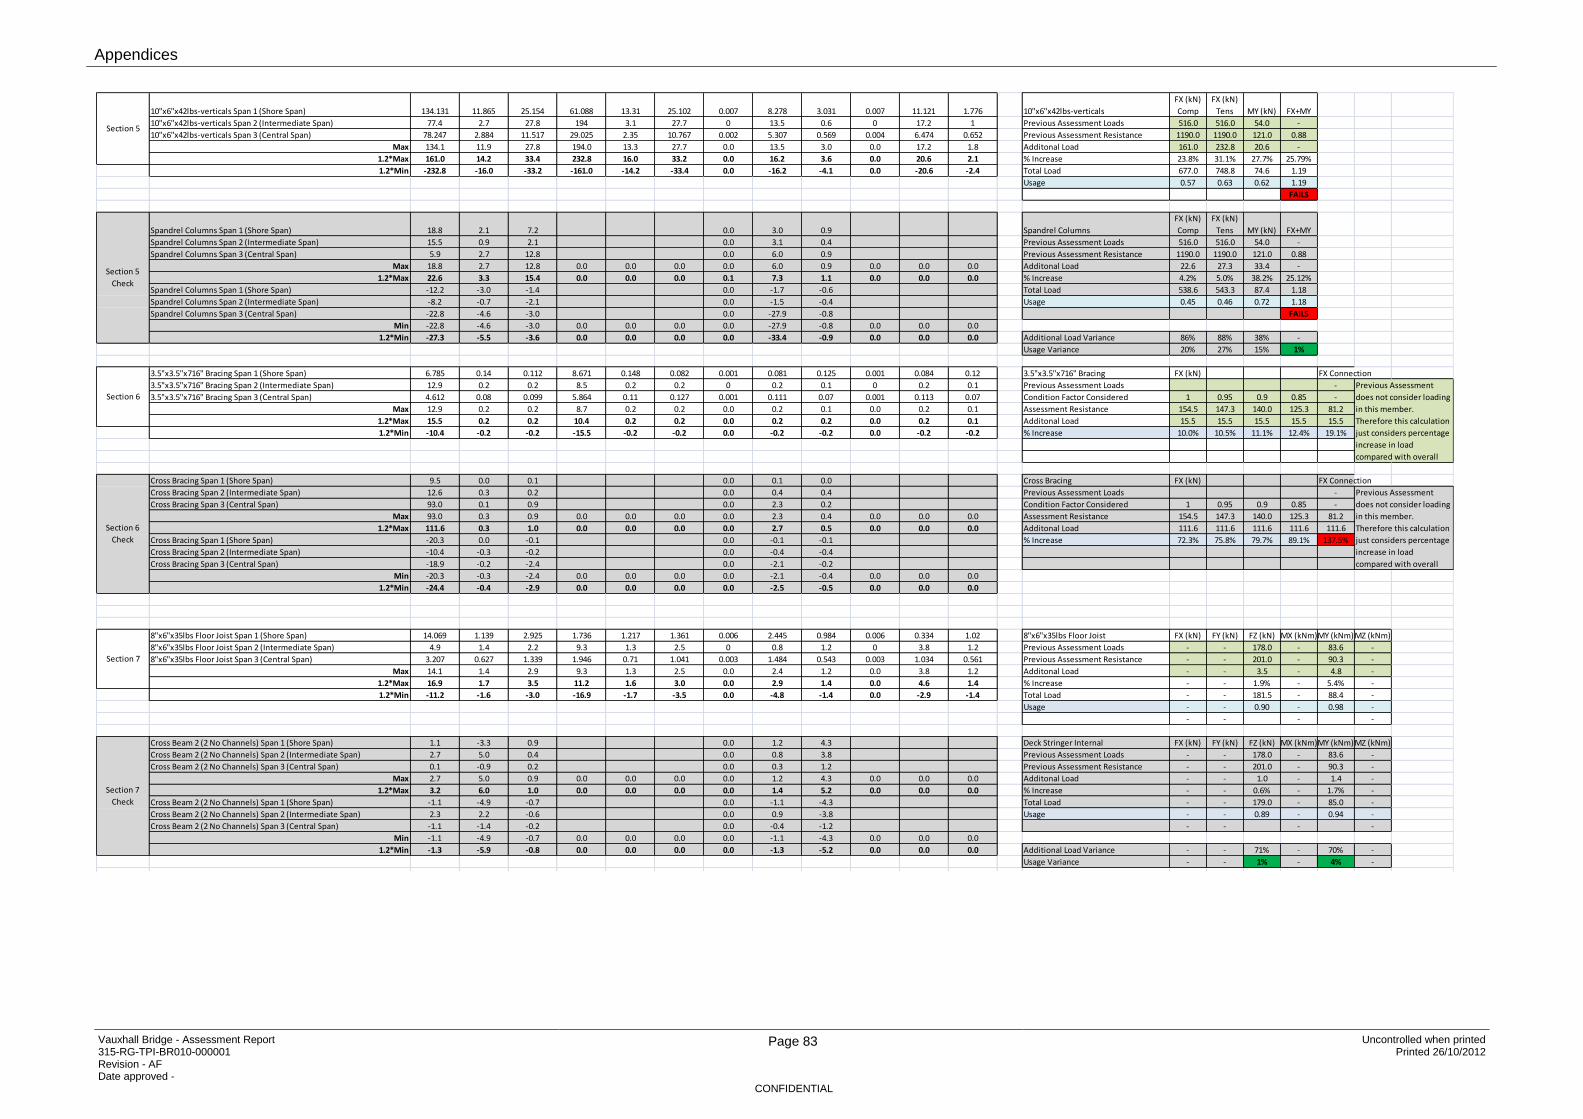
Appendices
Vauxhall Bridge - Assessment Report 315-RG-TPI-BR010-000001 Revision - AF Date approved -
Page 83 Uncontrolled when printed Printed 26/10/2012
CONFIDENTIAL
10"x6"x42lbs-verticals Span 1 (Shore Span) 134.131 11.865 25.154 61.088 13.31 25.102 0.007 8.278 3.031 0.007 11.121 1.776 10"x6"x42lbs-verticals
FX (kN)
Comp
FX (kN)
Tens MY (kN) FX+MY
10"x6"x42lbs-verticals Span 2 (Intermediate Span) 77.4 2.7 27.8 194 3.1 27.7 0 13.5 0.6 0 17.2 1 Previous Assessment Loads 516.0 516.0 54.0 -
10"x6"x42lbs-verticals Span 3 (Central Span) 78.247 2.884 11.517 29.025 2.35 10.767 0.002 5.307 0.569 0.004 6.474 0.652 Previous Assessment Resistance 1190.0 1190.0 121.0 0.88
Max 134.1 11.9 27.8 194.0 13.3 27.7 0.0 13.5 3.0 0.0 17.2 1.8 Additonal Load 161.0 232.8 20.6 -
1.2*Max 161.0 14.2 33.4 232.8 16.0 33.2 0.0 16.2 3.6 0.0 20.6 2.1 % Increase 23.8% 31.1% 27.7% 25.79%
1.2*Min -232.8 -16.0 -33.2 -161.0 -14.2 -33.4 0.0 -16.2 -4.1 0.0 -20.6 -2.4 Total Load 677.0 748.8 74.6 1.19
Usage 0.57 0.63 0.62 1.19
FAILS
Spandrel Columns Span 1 (Shore Span) 18.8 2.1 7.2 0.0 3.0 0.9 Spandrel Columns
FX (kN)
Comp
FX (kN)
Tens MY (kN) FX+MY
Spandrel Columns Span 2 (Intermediate Span) 15.5 0.9 2.1 0.0 3.1 0.4 Previous Assessment Loads 516.0 516.0 54.0 -
Spandrel Columns Span 3 (Central Span) 5.9 2.7 12.8 0.0 6.0 0.9 Previous Assessment Resistance 1190.0 1190.0 121.0 0.88
Max 18.8 2.7 12.8 0.0 0.0 0.0 0.0 6.0 0.9 0.0 0.0 0.0 Additonal Load 22.6 27.3 33.4 -
1.2*Max 22.6 3.3 15.4 0.0 0.0 0.0 0.1 7.3 1.1 0.0 0.0 0.0 % Increase 4.2% 5.0% 38.2% 25.12%
Spandrel Columns Span 1 (Shore Span) -12.2 -3.0 -1.4 0.0 -1.7 -0.6 Total Load 538.6 543.3 87.4 1.18
Spandrel Columns Span 2 (Intermediate Span) -8.2 -0.7 -2.1 0.0 -1.5 -0.4 Usage 0.45 0.46 0.72 1.18
Spandrel Columns Span 3 (Central Span) -22.8 -4.6 -3.0 0.0 -27.9 -0.8 FAILS
Min -22.8 -4.6 -3.0 0.0 0.0 0.0 0.0 -27.9 -0.8 0.0 0.0 0.0
1.2*Min -27.3 -5.5 -3.6 0.0 0.0 0.0 0.0 -33.4 -0.9 0.0 0.0 0.0 Additional Load Variance 86% 88% 38% -
Usage Variance 20% 27% 15% 1%
3.5"x3.5"x716" Bracing Span 1 (Shore Span) 6.785 0.14 0.112 8.671 0.148 0.082 0.001 0.081 0.125 0.001 0.084 0.12 3.5"x3.5"x716" Bracing FX (kN) FX Connection
3.5"x3.5"x716" Bracing Span 2 (Intermediate Span) 12.9 0.2 0.2 8.5 0.2 0.2 0 0.2 0.1 0 0.2 0.1 Previous Assessment Loads -
3.5"x3.5"x716" Bracing Span 3 (Central Span) 4.612 0.08 0.099 5.864 0.11 0.127 0.001 0.111 0.07 0.001 0.113 0.07 Condition Factor Considered 1 0.95 0.9 0.85 -
Max 12.9 0.2 0.2 8.7 0.2 0.2 0.0 0.2 0.1 0.0 0.2 0.1 Assessment Resistance 154.5 147.3 140.0 125.3 81.2
1.2*Max 15.5 0.2 0.2 10.4 0.2 0.2 0.0 0.2 0.2 0.0 0.2 0.1 Additonal Load 15.5 15.5 15.5 15.5 15.5
1.2*Min -10.4 -0.2 -0.2 -15.5 -0.2 -0.2 0.0 -0.2 -0.2 0.0 -0.2 -0.2 % Increase 10.0% 10.5% 11.1% 12.4% 19.1%
Cross Bracing Span 1 (Shore Span) 9.5 0.0 0.1 0.0 0.1 0.0 Cross Bracing FX (kN) FX Connection
Cross Bracing Span 2 (Intermediate Span) 12.6 0.3 0.2 0.0 0.4 0.4 Previous Assessment Loads -
Cross Bracing Span 3 (Central Span) 93.0 0.1 0.9 0.0 2.3 0.2 Condition Factor Considered 1 0.95 0.9 0.85 -
Max 93.0 0.3 0.9 0.0 0.0 0.0 0.0 2.3 0.4 0.0 0.0 0.0 Assessment Resistance 154.5 147.3 140.0 125.3 81.2
1.2*Max 111.6 0.3 1.0 0.0 0.0 0.0 0.0 2.7 0.5 0.0 0.0 0.0 Additonal Load 111.6 111.6 111.6 111.6 111.6
Cross Bracing Span 1 (Shore Span) -20.3 0.0 -0.1 0.0 -0.1 -0.1 % Increase 72.3% 75.8% 79.7% 89.1% 137.5%
Cross Bracing Span 2 (Intermediate Span) -10.4 -0.3 -0.2 0.0 -0.4 -0.4
Cross Bracing Span 3 (Central Span) -18.9 -0.2 -2.4 0.0 -2.1 -0.2
Min -20.3 -0.3 -2.4 0.0 0.0 0.0 0.0 -2.1 -0.4 0.0 0.0 0.0
1.2*Min -24.4 -0.4 -2.9 0.0 0.0 0.0 0.0 -2.5 -0.5 0.0 0.0 0.0
8"x6"x35lbs Floor Joist Span 1 (Shore Span) 14.069 1.139 2.925 1.736 1.217 1.361 0.006 2.445 0.984 0.006 0.334 1.02 8"x6"x35lbs Floor Joist FX (kN) FY (kN) FZ (kN) MX (kNm)MY (kNm)MZ (kNm)
8"x6"x35lbs Floor Joist Span 2 (Intermediate Span) 4.9 1.4 2.2 9.3 1.3 2.5 0 0.8 1.2 0 3.8 1.2 Previous Assessment Loads - - 178.0 - 83.6 -
8"x6"x35lbs Floor Joist Span 3 (Central Span) 3.207 0.627 1.339 1.946 0.71 1.041 0.003 1.484 0.543 0.003 1.034 0.561 Previous Assessment Resistance - - 201.0 - 90.3 -
Max 14.1 1.4 2.9 9.3 1.3 2.5 0.0 2.4 1.2 0.0 3.8 1.2 Additonal Load - - 3.5 - 4.8 -
1.2*Max 16.9 1.7 3.5 11.2 1.6 3.0 0.0 2.9 1.4 0.0 4.6 1.4 % Increase - - 1.9% - 5.4% -
1.2*Min -11.2 -1.6 -3.0 -16.9 -1.7 -3.5 0.0 -4.8 -1.4 0.0 -2.9 -1.4 Total Load - - 181.5 - 88.4 -
Usage - - 0.90 - 0.98 -
- - - -
Cross Beam 2 (2 No Channels) Span 1 (Shore Span) 1.1 -3.3 0.9 0.0 1.2 4.3 Deck Stringer Internal FX (kN) FY (kN) FZ (kN) MX (kNm)MY (kNm)MZ (kNm)
Cross Beam 2 (2 No Channels) Span 2 (Intermediate Span) 2.7 5.0 0.4 0.0 0.8 3.8 Previous Assessment Loads - - 178.0 - 83.6 -
Cross Beam 2 (2 No Channels) Span 3 (Central Span) 0.1 -0.9 0.2 0.0 0.3 1.2 Previous Assessment Resistance - - 201.0 - 90.3 -
Max 2.7 5.0 0.9 0.0 0.0 0.0 0.0 1.2 4.3 0.0 0.0 0.0 Additonal Load - - 1.0 - 1.4 -
1.2*Max 3.2 6.0 1.0 0.0 0.0 0.0 0.0 1.4 5.2 0.0 0.0 0.0 % Increase - - 0.6% - 1.7% -
Cross Beam 2 (2 No Channels) Span 1 (Shore Span) -1.1 -4.9 -0.7 0.0 -1.1 -4.3 Total Load - - 179.0 - 85.0 -
Cross Beam 2 (2 No Channels) Span 2 (Intermediate Span) 2.3 2.2 -0.6 0.0 0.9 -3.8 Usage - - 0.89 - 0.94 -
Cross Beam 2 (2 No Channels) Span 3 (Central Span) -1.1 -1.4 -0.2 0.0 -0.4 -1.2 - - - -
Min -1.1 -4.9 -0.7 0.0 0.0 0.0 0.0 -1.1 -4.3 0.0 0.0 0.0
1.2*Min -1.3 -5.9 -0.8 0.0 0.0 0.0 0.0 -1.3 -5.2 0.0 0.0 0.0 Additional Load Variance - - 71% - 70% -
Usage Variance - - 1% - 4% -
12"x6"x52lbs Inner beam Span 1 (Shore Span) 36.612 10.533 9.819 0.306 11.332 8.794 0.015 12.754 26.699 0.015 13.988 27.524 12"x6"x52lbs Inner beam FX (kN) FY (kN) FZ (kN) MX (kNm)MY (kNm)MZ (kNm)
12"x6"x52lbs Inner beam Span 2 (Intermediate Span) 0.3 11.1 91.7 57 11.1 93.7 0 42.9 31.4 0 16.1 6.9 Previous Assessment Loads - - 366.0 - 242.0 -
12"x6"x52lbs Inner beam Span 3 (Central Span) 31.11 10.281 5.032 0.088 5.374 5.833 0.014 6.24 9.969 0.016 7.543 25.728 Previous Assessment Resistance - - 358.0 - 204.7 -
Max 36.6 11.1 91.7 57.0 11.3 93.7 0.0 42.9 31.4 0.0 16.1 27.5 Additonal Load 68.4 13.3 112.4 - 51.5 37.7
F 43.9 13.3 110.0 68.4 13.6 112.4 0.0 51.5 37.7 0.0 19.3 33.0 % Increase - - 23.5% - 17.5% -
1.2*Min -68.4 -13.6 -112.4 -43.9 -13.3 -110.0 0.0 -19.1 -32.2 0.0 -50.4 -37.8 Total Load - - 478.4 - 293.5 -
Usage - - 1.34 - 1.43 -
- - FAILS - FAILS -
Deck Stringer - Internal Span 1 (Shore Span) 1.5 12.2 1.1 0.0 1.0 2.6 Deck Stringer Internal FX (kN) FY (kN) FZ (kN) MX (kNm)MY (kNm)MZ (kNm)
Deck Stringer - Internal Span 2 (Intermediate Span) 6.7 3.8 1.4 0.0 45.1 5.5 Previous Assessment Loads - - 366.0 - 242.0 -
Deck Stringer - Internal Span 3 (Central Span) 0.4 11.6 1.7 0.2 6.8 1.9 Previous Assessment Resistance - - 358.0 - 204.7 -
Max 6.7 12.2 1.7 0.0 0.0 0.0 0.2 45.1 5.5 0.0 0.0 0.0 Additonal Load 16.6 14.7 7.2 - 54.1 6.6
1.2*Max 8.1 14.7 2.0 0.0 0.0 0.0 0.3 54.1 6.6 0.0 0.0 0.0 % Increase - - 1.9% - 18.3% -
Deck Stringer - Internal Span 1 (Shore Span) -1.4 -9.6 -6.0 0.0 -0.9 -2.2 Total Load - - 373.2 - 296.1 -
Deck Stringer - Internal Span 2 (Intermediate Span) -13.8 -5.2 -1.3 0.0 -4.2 -5.4 Usage - - 1.04 - 1.45 -
Deck Stringer - Internal Span 3 (Central Span) -2.8 -6.9 -3.0 -1.4 -2.5 -1.3 - - FAILS - FAILS -
Min -13.8 -9.6 -6.0 0.0 0.0 0.0 -1.4 -4.2 -5.4 0.0 0.0 0.0
1.2*Min -16.6 -11.5 -7.2 0.0 0.0 0.0 -1.7 -5.0 -6.5 0.0 0.0 0.0 Additional Load Variance - - 94% - 5% -
Usage Variance - - 22% - 1% -
Section 5
Check
Section 6
Check
Section 8
Check
Section 5
Section 6
Section 7
Section 8
Section 7
Check
Previous Assessment
does not consider loading
in this member.
Therefore this calculation
just considers percentage
increase in load
compared with overall
Previous Assessment
does not consider loading
in this member.
Therefore this calculation
just considers percentage
increase in load
compared with overall
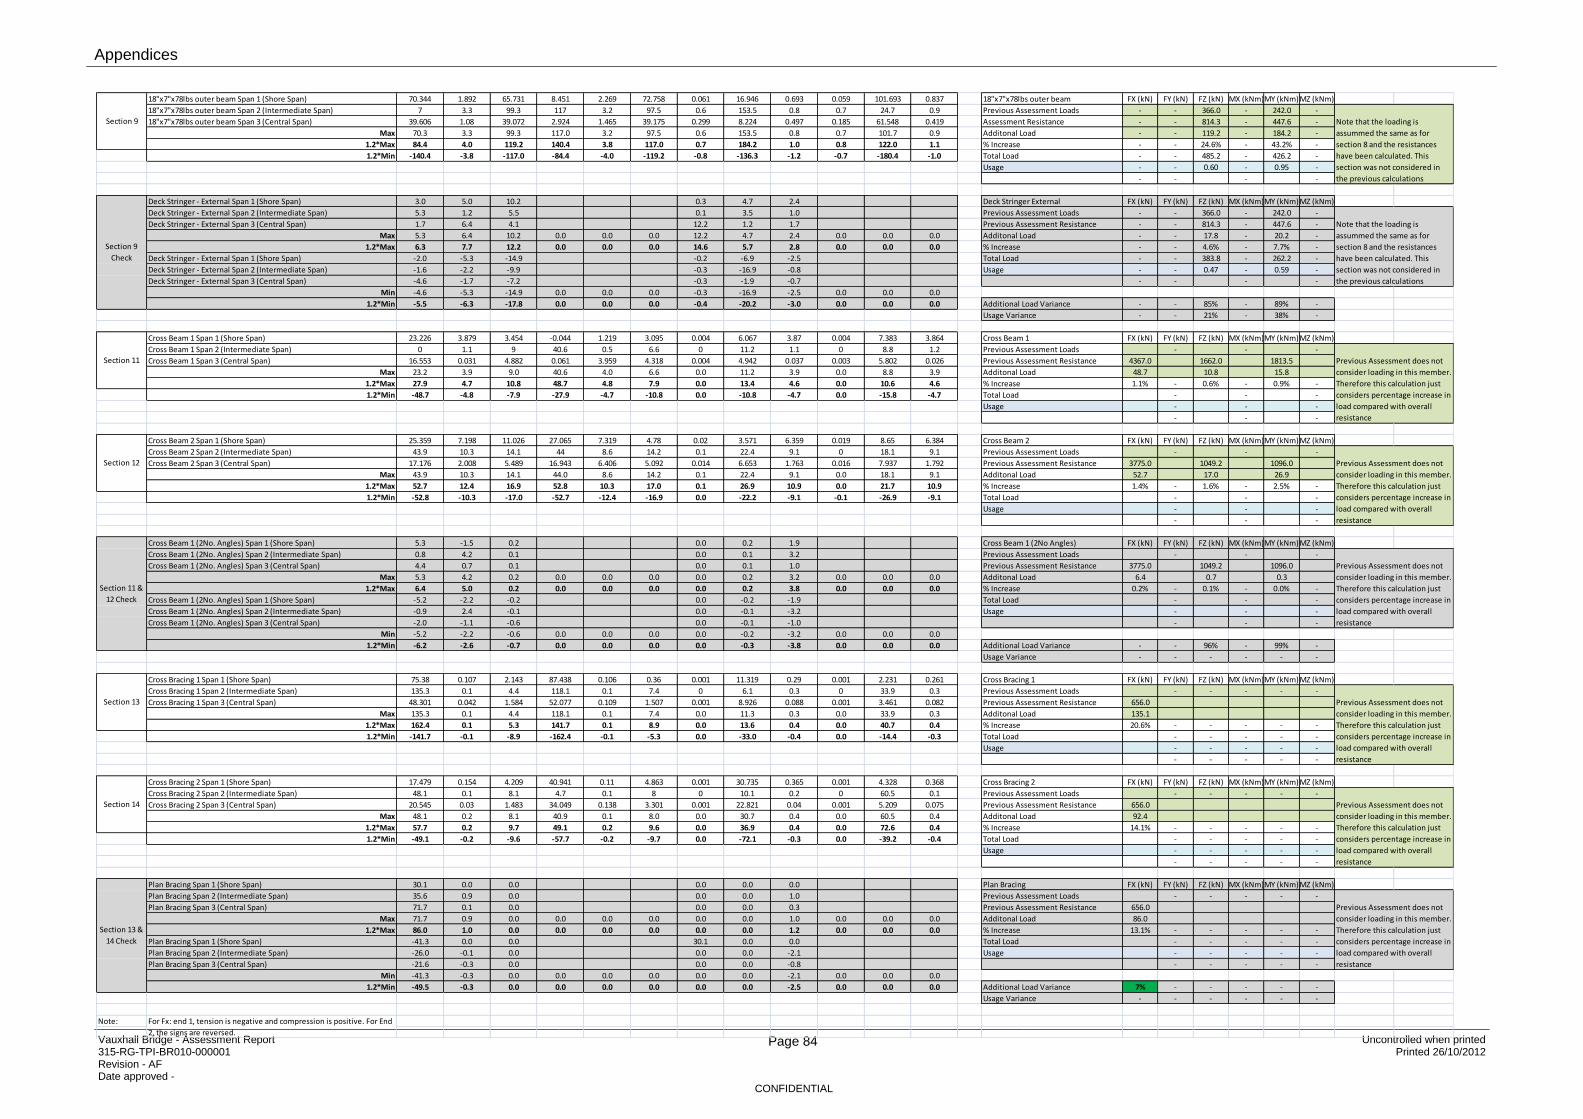
Appendices
Vauxhall Bridge - Assessment Report 315-RG-TPI-BR010-000001 Revision - AF Date approved -
Page 84 Uncontrolled when printed Printed 26/10/2012
CONFIDENTIAL
18"x7"x78lbs outer beam Span 1 (Shore Span) 70.344 1.892 65.731 8.451 2.269 72.758 0.061 16.946 0.693 0.059 101.693 0.837 18"x7"x78lbs outer beam FX (kN) FY (kN) FZ (kN) MX (kNm)MY (kNm)MZ (kNm)
18"x7"x78lbs outer beam Span 2 (Intermediate Span) 7 3.3 99.3 117 3.2 97.5 0.6 153.5 0.8 0.7 24.7 0.9 Previous Assessment Loads - - 366.0 - 242.0 -
18"x7"x78lbs outer beam Span 3 (Central Span) 39.606 1.08 39.072 2.924 1.465 39.175 0.299 8.224 0.497 0.185 61.548 0.419 Assessment Resistance - - 814.3 - 447.6 -
Max 70.3 3.3 99.3 117.0 3.2 97.5 0.6 153.5 0.8 0.7 101.7 0.9 Additonal Load - - 119.2 - 184.2 -
1.2*Max 84.4 4.0 119.2 140.4 3.8 117.0 0.7 184.2 1.0 0.8 122.0 1.1 % Increase - - 24.6% - 43.2% -
1.2*Min -140.4 -3.8 -117.0 -84.4 -4.0 -119.2 -0.8 -136.3 -1.2 -0.7 -180.4 -1.0 Total Load - - 485.2 - 426.2 -
Usage - - 0.60 - 0.95 -
- - - -
Deck Stringer - External Span 1 (Shore Span) 3.0 5.0 10.2 0.3 4.7 2.4 Deck Stringer External FX (kN) FY (kN) FZ (kN) MX (kNm)MY (kNm)MZ (kNm)
Deck Stringer - External Span 2 (Intermediate Span) 5.3 1.2 5.5 0.1 3.5 1.0 Previous Assessment Loads - - 366.0 - 242.0 -
Deck Stringer - External Span 3 (Central Span) 1.7 6.4 4.1 12.2 1.2 1.7 Previous Assessment Resistance - - 814.3 - 447.6 -
Max 5.3 6.4 10.2 0.0 0.0 0.0 12.2 4.7 2.4 0.0 0.0 0.0 Additonal Load - - 17.8 - 20.2 -
1.2*Max 6.3 7.7 12.2 0.0 0.0 0.0 14.6 5.7 2.8 0.0 0.0 0.0 % Increase - - 4.6% - 7.7% -
Deck Stringer - External Span 1 (Shore Span) -2.0 -5.3 -14.9 -0.2 -6.9 -2.5 Total Load - - 383.8 - 262.2 -
Deck Stringer - External Span 2 (Intermediate Span) -1.6 -2.2 -9.9 -0.3 -16.9 -0.8 Usage - - 0.47 - 0.59 -
Deck Stringer - External Span 3 (Central Span) -4.6 -1.7 -7.2 -0.3 -1.9 -0.7 - - - -
Min -4.6 -5.3 -14.9 0.0 0.0 0.0 -0.3 -16.9 -2.5 0.0 0.0 0.0
1.2*Min -5.5 -6.3 -17.8 0.0 0.0 0.0 -0.4 -20.2 -3.0 0.0 0.0 0.0 Additional Load Variance - - 85% - 89% -
Usage Variance - - 21% - 38% -
Cross Beam 1 Span 1 (Shore Span) 23.226 3.879 3.454 -0.044 1.219 3.095 0.004 6.067 3.87 0.004 7.383 3.864 Cross Beam 1 FX (kN) FY (kN) FZ (kN) MX (kNm)MY (kNm)MZ (kNm)
Cross Beam 1 Span 2 (Intermediate Span) 0 1.1 9 40.6 0.5 6.6 0 11.2 1.1 0 8.8 1.2 Previous Assessment Loads - - -
Cross Beam 1 Span 3 (Central Span) 16.553 0.031 4.882 0.061 3.959 4.318 0.004 4.942 0.037 0.003 5.802 0.026 Previous Assessment Resistance 4367.0 1662.0 1813.5
Max 23.2 3.9 9.0 40.6 4.0 6.6 0.0 11.2 3.9 0.0 8.8 3.9 Additonal Load 48.7 10.8 15.8
1.2*Max 27.9 4.7 10.8 48.7 4.8 7.9 0.0 13.4 4.6 0.0 10.6 4.6 % Increase 1.1% - 0.6% - 0.9% -
1.2*Min -48.7 -4.8 -7.9 -27.9 -4.7 -10.8 0.0 -10.8 -4.7 0.0 -15.8 -4.7 Total Load - - -
Usage - - -
- - -
Cross Beam 2 Span 1 (Shore Span) 25.359 7.198 11.026 27.065 7.319 4.78 0.02 3.571 6.359 0.019 8.65 6.384 Cross Beam 2 FX (kN) FY (kN) FZ (kN) MX (kNm)MY (kNm)MZ (kNm)
Cross Beam 2 Span 2 (Intermediate Span) 43.9 10.3 14.1 44 8.6 14.2 0.1 22.4 9.1 0 18.1 9.1 Previous Assessment Loads - - -
Cross Beam 2 Span 3 (Central Span) 17.176 2.008 5.489 16.943 6.406 5.092 0.014 6.653 1.763 0.016 7.937 1.792 Previous Assessment Resistance 3775.0 1049.2 1096.0
Max 43.9 10.3 14.1 44.0 8.6 14.2 0.1 22.4 9.1 0.0 18.1 9.1 Additonal Load 52.7 17.0 26.9
1.2*Max 52.7 12.4 16.9 52.8 10.3 17.0 0.1 26.9 10.9 0.0 21.7 10.9 % Increase 1.4% - 1.6% - 2.5% -
1.2*Min -52.8 -10.3 -17.0 -52.7 -12.4 -16.9 0.0 -22.2 -9.1 -0.1 -26.9 -9.1 Total Load - - -
Usage - - -
- - -
Cross Beam 1 (2No. Angles) Span 1 (Shore Span) 5.3 -1.5 0.2 0.0 0.2 1.9 Cross Beam 1 (2No Angles) FX (kN) FY (kN) FZ (kN) MX (kNm)MY (kNm)MZ (kNm)
Cross Beam 1 (2No. Angles) Span 2 (Intermediate Span) 0.8 4.2 0.1 0.0 0.1 3.2 Previous Assessment Loads - - -
Cross Beam 1 (2No. Angles) Span 3 (Central Span) 4.4 0.7 0.1 0.0 0.1 1.0 Previous Assessment Resistance 3775.0 1049.2 1096.0
Max 5.3 4.2 0.2 0.0 0.0 0.0 0.0 0.2 3.2 0.0 0.0 0.0 Additonal Load 6.4 0.7 0.3
1.2*Max 6.4 5.0 0.2 0.0 0.0 0.0 0.0 0.2 3.8 0.0 0.0 0.0 % Increase 0.2% - 0.1% - 0.0% -
Cross Beam 1 (2No. Angles) Span 1 (Shore Span) -5.2 -2.2 -0.2 0.0 -0.2 -1.9 Total Load - - -
Cross Beam 1 (2No. Angles) Span 2 (Intermediate Span) -0.9 2.4 -0.1 0.0 -0.1 -3.2 Usage - - -
Cross Beam 1 (2No. Angles) Span 3 (Central Span) -2.0 -1.1 -0.6 0.0 -0.1 -1.0 - - -
Min -5.2 -2.2 -0.6 0.0 0.0 0.0 0.0 -0.2 -3.2 0.0 0.0 0.0
1.2*Min -6.2 -2.6 -0.7 0.0 0.0 0.0 0.0 -0.3 -3.8 0.0 0.0 0.0 Additional Load Variance - - 96% - 99% -
Usage Variance - - - - - -
Cross Bracing 1 Span 1 (Shore Span) 75.38 0.107 2.143 87.438 0.106 0.36 0.001 11.319 0.29 0.001 2.231 0.261 Cross Bracing 1 FX (kN) FY (kN) FZ (kN) MX (kNm)MY (kNm)MZ (kNm)
Cross Bracing 1 Span 2 (Intermediate Span) 135.3 0.1 4.4 118.1 0.1 7.4 0 6.1 0.3 0 33.9 0.3 Previous Assessment Loads - - - - -
Cross Bracing 1 Span 3 (Central Span) 48.301 0.042 1.584 52.077 0.109 1.507 0.001 8.926 0.088 0.001 3.461 0.082 Previous Assessment Resistance 656.0
Max 135.3 0.1 4.4 118.1 0.1 7.4 0.0 11.3 0.3 0.0 33.9 0.3 Additonal Load 135.1
1.2*Max 162.4 0.1 5.3 141.7 0.1 8.9 0.0 13.6 0.4 0.0 40.7 0.4 % Increase 20.6% - - - - -
1.2*Min -141.7 -0.1 -8.9 -162.4 -0.1 -5.3 0.0 -33.0 -0.4 0.0 -14.4 -0.3 Total Load - - - - -
Usage - - - - -
- - - - -
Cross Bracing 2 Span 1 (Shore Span) 17.479 0.154 4.209 40.941 0.11 4.863 0.001 30.735 0.365 0.001 4.328 0.368 Cross Bracing 2 FX (kN) FY (kN) FZ (kN) MX (kNm)MY (kNm)MZ (kNm)
Cross Bracing 2 Span 2 (Intermediate Span) 48.1 0.1 8.1 4.7 0.1 8 0 10.1 0.2 0 60.5 0.1 Previous Assessment Loads - - - - -
Cross Bracing 2 Span 3 (Central Span) 20.545 0.03 1.483 34.049 0.138 3.301 0.001 22.821 0.04 0.001 5.209 0.075 Previous Assessment Resistance 656.0
Max 48.1 0.2 8.1 40.9 0.1 8.0 0.0 30.7 0.4 0.0 60.5 0.4 Additonal Load 92.4
1.2*Max 57.7 0.2 9.7 49.1 0.2 9.6 0.0 36.9 0.4 0.0 72.6 0.4 % Increase 14.1% - - - - -
1.2*Min -49.1 -0.2 -9.6 -57.7 -0.2 -9.7 0.0 -72.1 -0.3 0.0 -39.2 -0.4 Total Load - - - - -
Usage - - - - -
- - - - -
Plan Bracing Span 1 (Shore Span) 30.1 0.0 0.0 0.0 0.0 0.0 Plan Bracing FX (kN) FY (kN) FZ (kN) MX (kNm)MY (kNm)MZ (kNm)
Plan Bracing Span 2 (Intermediate Span) 35.6 0.9 0.0 0.0 0.0 1.0 Previous Assessment Loads - - - - -
Plan Bracing Span 3 (Central Span) 71.7 0.1 0.0 0.0 0.0 0.3 Previous Assessment Resistance 656.0
Max 71.7 0.9 0.0 0.0 0.0 0.0 0.0 0.0 1.0 0.0 0.0 0.0 Additonal Load 86.0
1.2*Max 86.0 1.0 0.0 0.0 0.0 0.0 0.0 0.0 1.2 0.0 0.0 0.0 % Increase 13.1% - - - - -
Plan Bracing Span 1 (Shore Span) -41.3 0.0 0.0 30.1 0.0 0.0 Total Load - - - - -
Plan Bracing Span 2 (Intermediate Span) -26.0 -0.1 0.0 0.0 0.0 -2.1 Usage - - - - -
Plan Bracing Span 3 (Central Span) -21.6 -0.3 0.0 0.0 0.0 -0.8 - - - - -
Min -41.3 -0.3 0.0 0.0 0.0 0.0 0.0 0.0 -2.1 0.0 0.0 0.0
1.2*Min -49.5 -0.3 0.0 0.0 0.0 0.0 0.0 0.0 -2.5 0.0 0.0 0.0 Additional Load Variance 7% - - - - -
Usage Variance - - - - - -
Note:
Section 13 &
14 Check
Section 9
Check
For Fx: end 1, tension is negative and compression is positive. For End
2, the signs are reversed.
Section 12
Section 13
Section 14
Section 11
Section 9
Section 11 &
12 Check
Previous Assessment does not
consider loading in this member.
Therefore this calculation just
considers percentage increase in
load compared with overall
resistance
Note that the loading is
assummed the same as for
section 8 and the resistances
have been calculated. This
section was not considered in
the previous calculations
Previous Assessment does not
consider loading in this member.
Therefore this calculation just
considers percentage increase in
load compared with overall
resistance
Previous Assessment does not
consider loading in this member.
Therefore this calculation just
considers percentage increase in
load compared with overall
resistance
Previous Assessment does not
consider loading in this member.
Therefore this calculation just
considers percentage increase in
load compared with overall
resistance
Previous Assessment does not
consider loading in this member.
Therefore this calculation just
considers percentage increase in
load compared with overall
resistance
Previous Assessment does not
consider loading in this member.
Therefore this calculation just
considers percentage increase in
load compared with overall
resistance
Note that the loading is
assummed the same as for
section 8 and the resistances
have been calculated. This
section was not considered in
the previous calculations

Appendices
Vauxhall Bridge - Assessment Report 315-RG-TPI-BR010-000001 Revision - AF Date approved -
Page 85 Uncontrolled when printed Printed 26/10/2012
CONFIDENTIAL
Appendix G – Settlement Drawing
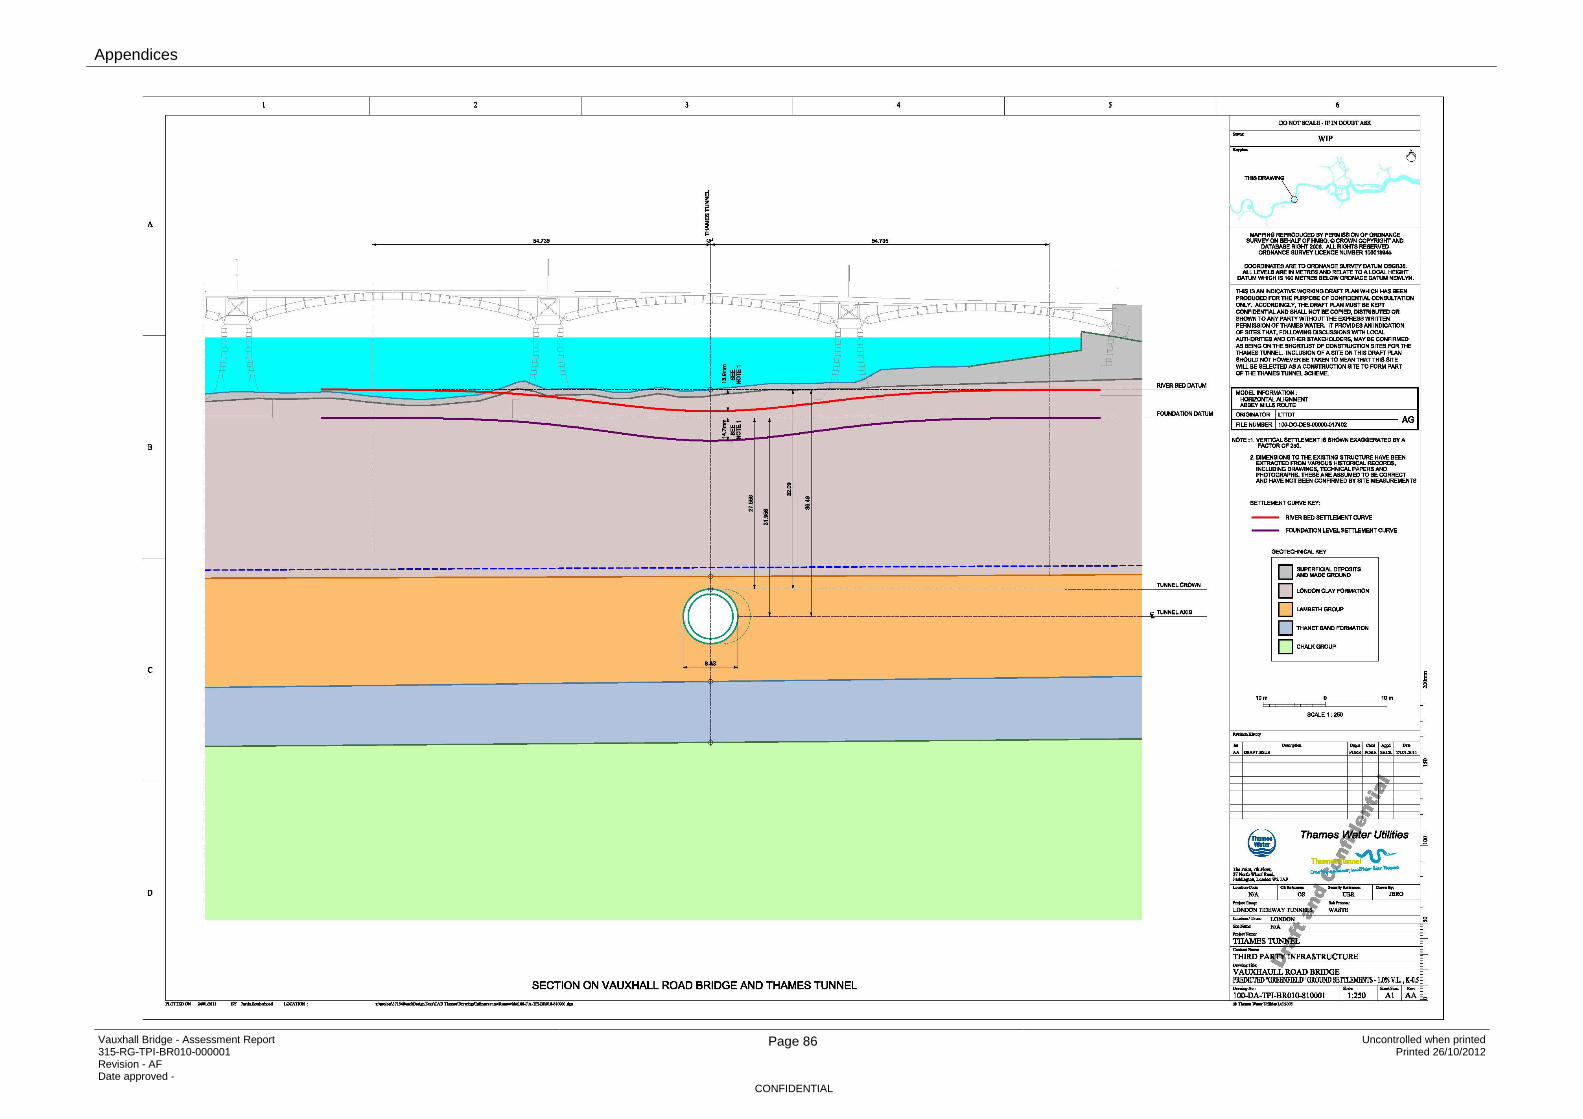
Appendices
Vauxhall Bridge - Assessment Report 315-RG-TPI-BR010-000001 Revision - AF Date approved -
Page 86 Uncontrolled when printed Printed 26/10/2012
CONFIDENTIAL

315-RI-TPI-BR010-000001 | AE | 28 March 2012
Thames Tunnel Detailed Bridge Assessments
Inspection Report for Vauxhall Road Bridge
THIS REPORT INCLUDING THE DRAWINGS AND OTHER SUPPORTING DOCUMENTATION IS PROVIDED FOR THE PURPOSE OF IDENTIFYING AND AGREEING THE LIKELY EFFECTS OF THE CONSTRUCTION OF THE THAMES TUNNEL ON THE ASSETS AND INFRASTRUCTURE OF THE PARTY IN RECEIPT OF THIS REPORT AND FOR THE PURPOSE OF SECURING APPROVAL IN PRINCIPLE TO THE DESIGN OF THE THAMES TUNNEL. THE REPORT IS CONFIDENTIAL TO THAMES WATER AND THE INTENDED RECIPIENT AND THEIR CONSULTANTS [APPOINTED WITH THE AGREEMENT OF THAMES WATER]. THE REPORT SHALL NOT BE PROVIDED TO ANY THIRD PARTY
WITHOUT THE EXPRESS WRITTEN PERMISSION OF THAMES WATER UTLIITIES LIMITED.
Inspection Report for Vauxhall Road Bridge
Printed 28/03/2012
Thames Tunnel
Inspection Report for Vauxhall Road Bridge
Name Data
Document no 315-RI-TPI-BR010-000001-AE
Status APP
Document type Report
WBS DE.03.3P
Authors Jessica Sandberg (Atkins)
Keywords Detailed Bridge Assessment, Inspection Report, Vauxhall Road Bridge
Contents amendment record
This document has been issued and amended as follows:
Revision Date Issued for/Revision details Revised by
AA 15/04/2011 Draft for Comment JMS
AB 15/04/2011 Updated for Comments JMS
AC 05/10/2011 Final Issue TA
AD 13/03/2012 Record the inspection for the site
interface assessment TA
AE 28/03/2012 Final Issue TA
Required approvals
Name – Title
Chris Brock – Atkins Team Leader
Date
28/03/2012
Name – Title
Andy Robson – Atkins Project Manager
Date
28/03/2012
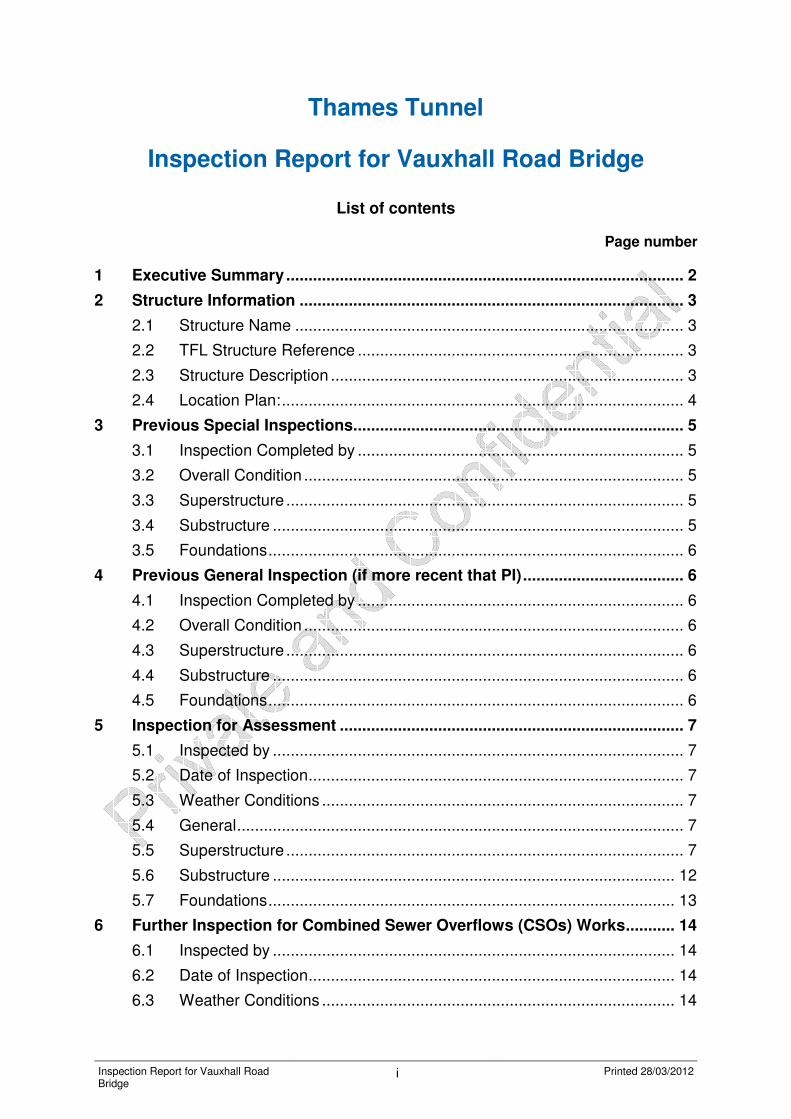
Inspection Report for Vauxhall Road Bridge
i Printed 28/03/2012
Thames Tunnel
Inspection Report for Vauxhall Road Bridge
List of contents
Page number
1 Executive Summary ......................................................................................... 2
2 Structure Information ...................................................................................... 3
2.1 Structure Name ....................................................................................... 3
2.2 TFL Structure Reference ......................................................................... 3
2.3 Structure Description ............................................................................... 3
2.4 Location Plan: .......................................................................................... 4
3 Previous Special Inspections .......................................................................... 5
3.1 Inspection Completed by ......................................................................... 5
3.2 Overall Condition ..................................................................................... 5
3.3 Superstructure ......................................................................................... 5
3.4 Substructure ............................................................................................ 5
3.5 Foundations ............................................................................................. 6
4 Previous General Inspection (if more recent that PI) .................................... 6
4.1 Inspection Completed by ......................................................................... 6
4.2 Overall Condition ..................................................................................... 6
4.3 Superstructure ......................................................................................... 6
4.4 Substructure ............................................................................................ 6
4.5 Foundations ............................................................................................. 6
5 Inspection for Assessment ............................................................................. 7
5.1 Inspected by ............................................................................................ 7
5.2 Date of Inspection .................................................................................... 7
5.3 Weather Conditions ................................................................................. 7
5.4 General .................................................................................................... 7
5.5 Superstructure ......................................................................................... 7
5.6 Substructure .......................................................................................... 12
5.7 Foundations ........................................................................................... 13
6 Further Inspection for Combined Sewer Overflows (CSOs) Works ........... 14
6.1 Inspected by .......................................................................................... 14
6.2 Date of Inspection .................................................................................. 14
6.3 Weather Conditions ............................................................................... 14

Inspection Report for Vauxhall Road Bridge
ii Printed 28/03/2012
6.4 General .................................................................................................. 14
6.5 Superstructure ....................................................................................... 15
6.6 Substructure .......................................................................................... 17
6.7 Foundations ........................................................................................... 18
7 Conclusions and Recommendations ........................................................... 19
7.1 General .................................................................................................. 19
7.2 Recommended Condition Factor ........................................................... 19
Glossary .................................................................................................................. 20
Inspection Report for Vauxhall Road Bridge
i Printed 28/03/2012
List of figures
Page number
Figure 2.1 Vauxhall Road Bridge Location ............................................................. 4
Figure 5.1 Vauxhall Bridge....................................................................................... 7
Figure 5.2 Pin Bearing at Vauxhall Bridge .............................................................. 8
Figure 5.3 Corrosion/pitting to bottom flanges and bracing ................................ 9
Figure 5.4 Birds on Pier bracing ............................................................................. 9
Figure 5.5 Typical pier expansion Joint................................................................ 10
Figure 5.6 Typical parapet section at midspan .................................................... 11
Figure 5.7 Typical parapet section at intermediate piers .................................... 11
Figure 5.8 Leakage at intermediate pier ............................................................... 12
Figure 5.9 Typical Staining at pier ........................................................................ 12
Figure 5.10 Damage to stonework at pier ............................................................. 13
Figure 6.1 Vauxhall Abutment and South Span ................................................... 14
Figure 6.2 Failing paint system and localised rust to Span 1 ............................. 15
Figure 6.3 South abutment movement joint ......................................................... 16
Figure 6.4 South abutment bearings .................................................................... 16
Figure 6.5 Algae and staining of south abutment ................................................ 17
Figure 6.6 CSOs (West, left and East, right) ......................................................... 17
1 Executive Summary
Inspection Report for Vauxhall Road Bridge
2 Printed 28/03/2012
1 Executive Summary
1.1.1 The inspection for assessment was carried out to verify the current condition of the structure. This was done to ensure that an accurate condition of the structure could be taken into account in the assessment calculations.
1.1.2 Particular emphasis was given to inspecting items likely to be most affected by the tunnelling works and not all parts of the bridge were inspected. The elements considered to be most affected by the tunnelling work include the deck elements with particular consideration given to expansion joints and bearings. It is expected that there will be a minimal effect on abutments and piers.
1.1.3 This document sets out the findings from the Inspection for Assessment carried out on 21/03/11. The methodology for the inspection is set out in 315-PE-TPI-BR000-000002-AB Inspection Methodology.
1.1.4 The structure was found to be in fair condition
1.1.5 The Inspection report has been revised (Rev AD) to incorporate the further Inspection for Assessment carried out on 12/03/12 specifically for the localised regions of the structure affected by the proposed Combined Sewer Overflow (CSOs) works. The methodology for the inspection is set out in 315-PE-TPI-BR010-000001-AA Inspection Methodology.
1.1.6 This localised inspection confirmed the parts of the structure affected by the proposed CSO works (south abutment, southern span and south pier can be considered as in fair condition.

Appendices
Inspection Report for Vauxhall Road Bridge
3 Printed 28/03/2012
2 Structure Information
2.1 Structure Name
2.1.1 Vauxhall Road Bridge
2.2 TFL Structure Reference
2.2.1 A202/01.50 Vauxhall Bridge
2.3 Structure Description
2.3.1 The current Vauxhall Bridge was designed by Sir Alexander Binnie. It was constructed between 1898 and 1906 and is located between Lambeth Bridge and Grosvenor Bridge.
2.3.2 Vauxhall Bridge is a five span steel arch bridge carrying the A202 Vauxhall Bridge Road over the River Thames in Central London linking Vauxhall Cross with Pimlico. The bridge is symmetrical about its centre line with spans of 42.04m, 48.64m, 50.40m, 48.64m and 42.04m. The total structure length is 231.76m.
2.3.3 The width of the structure between parapets is 24.4m with footways of approx 2.65m wide. The structure has 4 lanes of traffic plus 2 bus lanes and one cycle lane.
2.3.4 The deck is formed from flat steel plates overlaid by mass concrete slab surfacing and protected with bituminous waterproofing below the asphalt carriageway surface. Concrete paving slabs cover the footways. There is a transverse crossfall to facilitate the drainage and gullies positioned along the entire length of the structure.
2.3.5 The main deck is supported on cross beams which are themselves supported on the main longitudinal members. The longitudinal members are supported on spandrel columns which stem from the arch ribs.
2.3.6 The ribs form the arch span and are spaced at 1.97m centres which support the spandrel column locations at 3.15m centres. The outer ribs support the footway and 11 No inner ribs support the carriageway. All the ribs and spandrel columns are cross braced vertically. There are several other cross members used in the structure, deck cross beams, spandrel vertical cross bracing, diagonal wind bracing and rib vertical cross bracing which make up the structure.
2.3.7 The structure is supported by four piers and two abutments which comprise granite face concrete chambers founded on steel caissons filled with concrete. The Westminster abutment is also supported by a series of piles.
2.3.8 Knuckle pin bearings are located at the ends of the arch ribs. The longitudinal beams are supported on rubber pad bearings at the abutment location and at each face of the intermediate piers. The deck level is supported on rubber pad bearings, sliding plate bearings and plate bearings.

Appendices
Inspection Report for Vauxhall Road Bridge
4 Printed 28/03/2012
2.3.9 There are 10 expansion joints, 2 are located at each of the piers and 1 at each abutment. This structure has a history of problems with the expansion joints; refurbishment work was carried out on the joints in 2002.
2.3.10 The parapets are made of hollow plate steelwork with vertical infill bars. The parapets are approximately one metre in height.
2.3.11 It is unknown whether there are any services within the structure.
2.4 Location Plan:
Figure 2.1 Vauxhall Road Bridge Location
Appendices
Inspection Report for Vauxhall Road Bridge
5 Printed 28/03/2012
3 Previous Special Inspections
3.1 Inspection Completed by
3.1.1 Mouchel Parkman in October 2006 and WSP Civils in October 2008.
3.2 Overall Condition
3.2.1 Fair
3.3 Superstructure
3.3.1 The following items were reported in the Inspection Reports:
a. Some corrosion to deck plating, particularly under the footway.
b. Some corrosion to top and bottom flanges of arch ribs and to attached stiffeners. Some staining and localised breakdown of the protective paint system. These are mostly in areas on the outer beams exposed to weather.
c. Heavy concentrations of corrosion at cross beams located beneath the expansion joints.
d. Some surface corrosion to bearings. Some corrosion pitting the support bracket to the bearing. Protective paintwork flaking or missing.
e. Water ingress particularly over piers noted.
f. Longitudinal cracks in surfacing, and several patch repairs.
g. Localised breakdown to the corrosion protection system on parapets.
h. Partially blocked drainage and vegetation growth.
i. Cracking around expansion joint – this structure has a history of problems with the expansion joints , with refurbishment work carried out on the joints in 2002.
3.4 Substructure
3.4.1 The reports identified the following issues regarding the substructure:
a. Some loss of pointing and indentations to stonework at abutments. Also some algae staining.
b. Leachate staining on both abutments.
c. North abutment shows signs of superficial shrapnel damage and markings from tidal debris.
d. South abutment shows signs of corrosion staining from bridge structure.
e. Piers have leachate stains and missing or loose pointing with moss algae and tidal staining.
f. North face of north pier shows signs of damage similar to north abutment.
g. Recommendation made in special inspection report from April 2005 that depth of scour alongside Vauxhall intermediate pier be monitored.

Appendices
Inspection Report for Vauxhall Road Bridge
6 Printed 28/03/2012
Scour is mentioned as a potential problem in the assessment report written in 1994 and in an inspection report from 1987. The scour has occurred at the north side of Vauxhall intermediate pier and is mentioned here as being approximately 20m of scour.
h. Some staining on bearing shelf at piers.
i. Abutment bearing shelf shows large quantities of staining and water ingress.
j. Leachate staining to wingwalls.
3.5 Foundations
3.5.1 Not inspected, but no evidence of movement or settlement within abutments or superstructure.
4 Previous General Inspection (if more recent that PI)
4.1 Inspection Completed by
4.1.1 2008 Principal Inspection is the most recent inspection report.
4.2 Overall Condition
4.2.1 N/A
4.3 Superstructure
4.3.1 N/A
4.4 Substructure
4.4.1 N/A
4.5 Foundations
4.5.1 N/A

Appendices
Inspection Report for Vauxhall Road Bridge
7 Printed 28/03/2012
5 Inspection for Assessment
5.1 Inspected by
5.1.1 J. Sandberg & M. Cobb
5.2 Date of Inspection
5.2.1 21/03/11
5.3 Weather Conditions
5.3.1 Dry and mild.
5.4 General
5.4.1 The condition of the structure had not notably changed since the previous special inspection. The structure was found to be in fair condition. Figure 5.1 shows a general view of Vauxhall Bridge.
Figure 5.1 Vauxhall Bridge
5.4.2 The emphasis of the inspection for assessment was to inspect the elements most likely to be adversely affected by the tunnelling works and not all parts of the bridge was inspected. The elements considered to be most affected by the tunnelling work include the deck elements with particular consideration given to expansion joints and bearings. It is expected that there will be a minimal effect on abutments and piers.
5.4.3 There was no evidence of services found during the inspections.
5.5 Superstructure
5.5.1 The superstructure is generally in fair condition. Specific Comments are set out below

Appendices
Inspection Report for Vauxhall Road Bridge
8 Printed 28/03/2012
5.5.2 There is some corrosion to the pin bearings at the main arch connection to the pier. It is likely that the joints are leaking water causing the corrosion to the pin bearings. Figure 5.2 shows a typical pin bearing.
Figure 5.2 Pin Bearing at Vauxhall Bridge
5.5.3 The deck level bearings were not inspected as they were not accessible from the public footways.
5.5.4 Corrosion damage/pitting damage is also present on many of the main beams and bracing members. Corrosion damage is worst at the locations of the piers. Here it is likely that damaged joints are allowing water onto the structure leading to corrosion damage at these locations. Figure 5.3 shows a typical view of the arch members and the bracing at the piers. Corrosion damage is also found to be worst on the three outer beams on each side of the structure. This appears to correspond to the location of the footways.

Appendices
Inspection Report for Vauxhall Road Bridge
9 Printed 28/03/2012
Figure 5.3 Corrosion/pitting to bottom flanges and bracing
5.5.5 The bridge also appears to serve as resting area for birds. This appears to be a particular problem at the intermediate piers where birds were noted flying in and out of the pier bracing members. (See Figure 5.4)
Figure 5.4 Birds on Pier bracing
5.5.6 The expansion joints were found to be in fair condition, though the surfacing on either side of many of the joints was found to be cracked. In some cases patch repairs had been made to these areas. These repairs

Appendices
Inspection Report for Vauxhall Road Bridge
10 Printed 28/03/2012
then also cracked. The joints are also filled with debris from the road surface and need to be cleaned.
Figure 5.5 Typical pier expansion Joint
5.5.7 The surfacing on the structure is generally in fair condition. However, the surfacing in both bus lanes has had many patch repairs and is in much poorer condition than that on the remaining parts of the structure.
5.5.8 The paint on many of the parapets was found to have started flaking off the structure, and many of the parapets show signs of superficial corrosion. Most of the corrosion was found at the connection between the railing and the lower part of the parapet. See figure 5.6 for a typical parapet.

Appendices
Inspection Report for Vauxhall Road Bridge
11 Printed 28/03/2012
Figure 5.6 Typical parapet section at midspan
5.5.9 At each of the piers there is a larger steel parapet section. This parapet section consists of riveted plates that form a backing to the decorative statues which are supported off the top of the intermediate piers. These sections were generally found to have surface corrosion with flaking and missing paint. See figure 5.7 for details.
Figure 5.7 Typical parapet section at intermediate piers

Appendices
Inspection Report for Vauxhall Road Bridge
12 Printed 28/03/2012
5.6 Substructure
5.6.1 The abutments and piers are generally in good condition.
5.6.2 Corrosion staining was evident at many of the piers. It is likely that this is due to the poor condition of the deck joints allowing water leakage into the structure. This in turn is causing corrosion to the cast iron deck beams. (see Figure 5.8)
Figure 5.8 Leakage at intermediate pier
5.6.3 The faces of the piers and abutments have algae growth. The piers/abutments also show water staining due to the tidal movement of the river. (See Figure 5.9)
Figure 5.9 Typical Staining at pier

Appendices
Inspection Report for Vauxhall Road Bridge
13 Printed 28/03/2012
5.6.4 The north abutment face and the adjacent pier face show large amounts of pitting in the stonework and missing pointing between the stone blocks. (See Figure 5.10)
Figure 5.10 Damage to stonework at pier
5.7 Foundations
5.7.1 The foundations were not accessible, but there was no evidence of differential settlement or rotation causing damage to the structure.

Appendices
Inspection Report for Vauxhall Road Bridge
14 Printed 28/03/2012
6 Further Inspection for Combined Sewer Overflows (CSOs) Works
6.1 Inspected by
6.1.1 C. Brock and T. Argyle
6.2 Date of Inspection
6.2.1 12/03/12
6.3 Weather Conditions
6.3.1 Warm and Fair
6.4 General
6.4.1 The Inspection report has been revised to incorporate parts of the structure considered to be affected by the proposed CSO works interface. The emphasis of this additional inspection for assessment was to inspect the elements most likely to be adversely affected by the demolition, construction and permanent phase proposals of the CSO works. The elements considered to be most affected by the tunnelling work include the south shore span, south pier and south abutment.
6.4.2 The inspection was undertaken from river wall, St Georges Wharf pier and from the carriageway level over spans 1 and 2. It was not possible to access the foreshore for a close up inspection of the south abutment and CSOs.
6.4.3 The condition of the aspects of the structure inspected had not notably changed since the previous inspection. The structure was found to be in fair condition. Figure 6.1 shows a general view of the Vauxhall Abutment with Clapham CSO.
Figure 6.1 Vauxhall Abutment and South Span

Appendices
Inspection Report for Vauxhall Road Bridge
15 Printed 28/03/2012
6.5 Superstructure
6.5.1 No significant visible changes were identified to Span 1 and 2 from the previous inspection. The condition of specific aspects of the structure potentially affected by the proposed CSO works are noted below.
6.5.2 Paintwork is in fair condition with localised rust and corrosion on structural elements. The paintwork on the parapets is generally in poor condition. See Figure 6.2 for details.
Figure 6.2 Failing paint system and localised rust to Span 1
6.5.3 Carriageway surfacing is in fair condition although locally breaking up at the expansion joints. It was noted deterioration was predominantly occurring within the bus lanes as observed during previous inspection.
6.5.4 It was observed that the bridge drainage was blocked on west side of south span. Footway paving irregular over Span 1 and Span 2.
6.5.5 The movement joint at the South abutment has deteriorated, with the adjacent nosing deteriorated and breaking up. See Figure 6.3 for details.

Appendices
Inspection Report for Vauxhall Road Bridge
16 Printed 28/03/2012
Figure 6.3 South abutment movement joint
6.5.6 Bearing plates were observed to be heavily corroded due to extensive leaking from abutment onto bearings. Litter has collected below the structure. See Figure 6.4 for details.
Figure 6.4 South abutment bearings

Appendices
Inspection Report for Vauxhall Road Bridge
17 Printed 28/03/2012
6.6 Substructure
6.6.1 Algae and staining observed on abutment faces and piers due to tidal range. See Figure 6.5 for details.
Figure 6.5 Algae and staining of south abutment
6.6.2 Existing CSOs are visible on foreshore on both sides of structure. See Figure 6.6 for details. It is not clear whether these CSOs are active, or whether they have been replaced by outflows below the water level indicated by the wooden fenders positioned either side of the South abutment.
Figure 6.6 CSOs (West, left and East, right)
Appendices
Inspection Report for Vauxhall Road Bridge
18 Printed 28/03/2012
6.6.3 It was not possible to closely inspect the connection between the south abutment and river wall; however no cracking was visible to south abutment. To the east side of the shore span a sheet piled extension has been constructed which extends in front of the south abutment.
6.7 Foundations
6.7.1 The foundations were not accessible, but there was no evidence of differential settlement or rotation causing damage to the structure.

Appendices
Inspection Report for Vauxhall Road Bridge
19 Printed 28/03/2012
7 Conclusions and Recommendations
7.1 General
7.1.1 There is not significant deterioration since the previous special inspection. None of the defects set out above needs to be allowed for in the assessment. The general maintenance issues noted during the inspection should be carried out as part of the general maintenance of the structure.
7.1.2 Though the structure was found to be corroded in some areas, it is not believed that this has yet had a significant effected on the section sizes of the steel members.
7.2 Recommended Condition Factor
7.2.1 A condition factor of 1.0 is recommended for all elements of this structure.

Appendices
Inspection Report for Vauxhall Road Bridge
20 Printed 28/03/2012
Glossary
Term Description
PI Principal Inspection
GI General Inspection

Copyright notice Copyright © Thames Water Utilities Limited September 2013. All rights reserved. Any plans, drawings, designs and materials (materials) submitted by Thames Water Utilities Limited (Thames Water) as part of this application for Development Consent to the Planning Inspectorate are protected by copyright. You may only use this material (including making copies of it) in order to (a) inspect those plans, drawings, designs and materials at a more convenient time or place; or (b) to facilitate the exercise of a right to participate in the pre-examination or examination stages of the application which is available under the Planning Act 2008 and related regulations. Use for any other purpose is prohibited and further copies must not be made without the prior written consent of Thames Water. Thames Water Utilities LimitedClearwater Court, Vastern Road, Reading RG1 8DB The Thames Water logo and Thames Tideway Tunnel logo are © Thames Water Utilities Limited. All rights reserved.
Copyright notice Copyright © Thames Water Utilities Limited September 2013. All rights reserved. Any plans, drawings, designs and materials (materials) submitted by Thames Water Utilities Limited (Thames Water) as part of this application for Development Consent to the Planning Inspectorate are protected by copyright. You may only use this material (including making copies of it) in order to (a) inspect those plans, drawings, designs and materials at a more convenient time or place; or (b) to facilitate the exercise of a right to participate in the pre-examination or examination stages of the application which is available under the Planning Act 2008 and related regulations. Use for any other purpose is prohibited and further copies must not be made without the prior written consent of Thames Water. Thames Water Utilities LimitedClearwater Court, Vastern Road, Reading RG1 8DB The Thames Water logo and Thames Tideway Tunnel logo are © Thames Water Utilities Limited. All rights reserved.
10243-A4P-Copyright-imp-V01.pdf p1 12:03:39 September 21, 2013