Embed Size (px)
Citation preview
APPLICATION TO ENVIRONMENT AUSTRALIA ON THE
PEARL OYSTER FISHERY
Against the Commonwealth Guidelines for the Ecologically Sustainable Management of Fisheries
For Consideration Under Part 13A of the Environment
Protection and Biodiversity Conservation Act 19991
OCTOBER 2002
DEPARTMENT OF FISHERIES, WESTERN AUSTRALIA LOCKED BAG 39, CLOISTERS SQUARE WA 6850
•
1 WHICH UNTIL RECENTLY WAS THE WILDLIFE PROTECTION (REGULATION OF EXPORTS AND IMPORTS) ACT 1982, and listed on Schedule 4 of this Act.
Application to Environment Australia for the Pearl Oyster Fishery
Department of Fisheries, W.A. October 2002 2
TABLE OF CONTENTS
TABLE OF CONTENTS ............................................................................................................. 2 FIGURES.................................................................................................................................... 4 TABLES ..................................................................................................................................... 5
1. INTRODUCTION TO THE APPLICATION ....................................................................... 6 1.1 DESCRIPTION OF INFORMATION PROVIDED ............................................................ 6 1.2 OVERVIEW OF APPLICATION........................................................................................ 7
2. BACKGROUND INFORMATION ........................................................................................ 8 2.1 DESCRIPTION OF THE FISHERY .................................................................................... 8 2.2 BIOLOGY OF SILVER LIPPED PEARL OYSTERS ...................................................... 17 2.3 MAJOR ENVIRONMENTS .............................................................................................. 19
2.3.1 Physical Environment .................................................................................................. 19 2.3.1.1 Description of Habitats Within the Fishery .......................................................... 20
2.3 2 Economic Environment ............................................................................................... 21 2.3.3 Social Environment...................................................................................................... 21
3. METHODOLOGY ..................................................................................................... 23 3.1 SCOPE ................................................................................................................................ 23 3.2 OVERVIEW ....................................................................................................................... 23 3.3 ISSUE IDENTIFICATION (component trees) .................................................................. 24 3.4 RISK ASSESSMENT/PRIORITISATION PROCESS...................................................... 25 3.5 COMPONENT REPORTS ................................................................................................. 26
4. ASSESSMENT OF THE PEARLING MANAGEMENT REGIME AGAINST THE COMMONWEALTH GUIDELINES FOR ASSESSING THE ECOLOGICALLY SUSTAINABLE MANAGEMENT OF FISHERIES .............................................................. 28
GENERAL REQUIREMENTS OF THE GUIDELINES....................................................... 28
PRINCIPLE 1 OF THE COMMONWEALTH GUIDELINES............................................. 31 OBJECTIVE 1 MAINTAIN VIABLE STOCK LEVELS OF TARGET SPECIES................ 31 OBJECTIVE 2 RECOVERY OF STOCKS ............................................................................. 38
PRINCIPLE 2 OF THE COMMONWEALTH GUIDELINES............................................. 39 OBJECTIVE 1 BYCATCH ...................................................................................................... 39 OBJECTIVE 2 PROTECTED, THREATENED AND ENDANGERED SPECIES ............... 41 OBJECTIVE 3 GENERAL ECOSYSTEM.............................................................................. 42
OVERVIEW TABLE ................................................................................................................. 46
5. PERFORMANCE REPORTS ............................................................................................... 48 5.1 RETAINED SPECIES........................................................................................................ 48
Application to Environment Australia for the Pearl Oyster Fishery
Department of Fisheries, W.A. October 2002 3
COMPONENT TREE FOR RETAINED SPECIES OF THE PEARL OYSTER FISHERY.. 48 5.1.1 PRIMARY SPECIES................................................................................................... 48
5.1.1.1 SILVER LIPPED (GOLD LIPPED) PEARL OYSTERS .................................... 48 5.1.1.2 GENETIC DISRUPTION TO OYSTER POPULATIONS ................................. 64
5.2 NON-RETAINED SPECIES .............................................................................................. 65 COMPONENT TREE FOR NON RETAINED SPECIES OF THE PEARL OYSTER FISHERY.................................................................................................................................. 65
5.2.1 PIGGY-BACK SPECIES ............................................................................................ 65 5.2.1.1 HABITAT FOR FOULING OR COMMENSAL SPECIES ................................ 65
5.3 GENERAL ENVIRONMENT............................................................................................ 67 COMPONENT TREE FOR GENERAL ENVIRONMENT OF THE PEARL OYSTER FISHERY.................................................................................................................................. 67
5.3.1 IMPACT OF REMOVING PEARL OYSTERS FROM THE ENVIRONMENT...... 67 5.3.1.1 TROPHIC INTERACTIONS ............................................................................... 67
5.3.2 ADDITION OF MATERIAL TO THE ENVIRONMENT......................................... 68 5.3.2.1 DISCARDING OF SHELLS ................................................................................ 68
5.3.3 DAMAGE TO HABITATS......................................................................................... 69 5.3.3.1 DIVER ACTIVITIES ........................................................................................... 69 5.3.3.2 ANCHORING....................................................................................................... 69 5.3.3.3 FISHING HOLDING SITES................................................................................ 70
5.4 GOVERNANCE................................................................................................................. 71 COMPONENT TREE FOR GOVERNANCE OF THE PEARL OYSTER FISHERY........... 71
5.4.1 DEPARTMENT OF FISHERIES - MANAGEMENT................................................ 71 5.4.1.1 MANAGEMENT EFFECTIVENESS (OUTCOMES) ........................................ 71 5.4.1.2 MANAGEMENT ARRANGEMENTS................................................................ 74 5.4.1.3 COMPLIANCE..................................................................................................... 77 5.4.1.4 ALLOCATION AMONG USERS ....................................................................... 79
DEPARTMENT OF FISHERIES - LEGAL ARRANGEMENTS ...................................... 79 5.4.2.1 OCS ARRANGEMENTS..................................................................................... 79
5.4.3 DEPARTMENT OF FISHERIES - CONSULTATION.............................................. 80 5.4.3.1 CONSULTATION................................................................................................ 80
5.4.4 DEPARTMENT OF FISHERIES- REPORTING....................................................... 83 5.4.4.1 ASSESSMENTS AND REVIEWS ...................................................................... 83
6. REFERENCES........................................................................................................................ 86
APPENDIX 1 – ATTENDEES LIST......................................................................................... 88 A1.1 Workshop 1 ...................................................................................................................... 88
APPENDIX 2 - ACRONYMS .................................................................................................... 89
APPENDIX 3 – RESEARCH SUMMARY TABLE................................................................ 90
APPENDIX 4 – DETAILS OF CONSEQUENCE TABLE .................................................... 93
Application to Environment Australia for the Pearl Oyster Fishery
Department of Fisheries, W.A. October 2002 4
FIGURES Figure 1. Mother of Pearl catches from 1900 to 1991. ................................................................... 9 Figure 2. The Pearl Oyster Fishery fishing zones in WA. ............................................................ 14 Figure 3. Distribution of pearl oysters in WA. ............................................................................. 18 Figure 4. Summary of the ESD reporting framework processes. ................................................. 24 Figure 5. Example of a component tree structure. ........................................................................ 25 Figure 6. Component tree for the retained species. ...................................................................... 48 Figure 7. Principal fishing areas for the Pearl Oyster Fishery and distribution of Pearl Oysters
abundance. ............................................................................................................................ 55 Figure 8. Pearl Oyster size frequency sampling by region in 2001. ............................................. 59 Figure 9. Component tree for non-retained species. ..................................................................... 65 Figure 10. Component tree for the general environment. ............................................................. 67 Figure 11. Component Tree for Governance. ............................................................................... 71
Application to Environment Australia for the Pearl Oyster Fishery
Department of Fisheries, W.A. October 2002 5
TABLES Table 1. National ESD reporting framework components............................................................ 23 Table 2. Risk ranking definitions.................................................................................................. 26 Table 3. The National ESD reporting framework headings used in this report............................ 27 Table 4. Summary of risk assessment outcomes for environmental issues related to the Pearl
Oyster Fishery....................................................................................................................... 43 Table 5. Pearl shell catch and effort - Broome area (Zone 2/3).................................................... 56 Table 6. Pearl shell catch and effort in Zone 1 since the 1993 quota increase. ............................ 56
Application to Environment Australia for the Pearl Oyster Fishery
Department of Fisheries, W.A. October 2002 6
1. INTRODUCTION TO THE APPLICATION
1.1 DESCRIPTION OF INFORMATION PROVIDED This is an application to Environment Australia (EA) to assess the Pearl Oyster Fishery (wild harvest only) against the Commonwealth guidelines for sustainable fisheries. The submission of a successful application against these guidelines is now needed to meet the requirements under Part 13A of the Environment Protection and Biodiversity Conservation Act 1999 (EPBC), to enable Silver lipped pearl oyster (Pinctada maxima) to remain on the section 303DB list of species exempt from export regulations (previously Schedule 4 of the Wildlife Protection (Regulation of Exports and Imports) Act, 1982) past December 2003. The information provided in this application covers all the elements specified in the Guidelines for the Ecologically Sustainable Management of Fisheries (located on the EA website www.ea.gov.au/coasts/fisheries/assessment/guidelines.html) along with other information (at a variety of levels of complexity) considered relevant to those who wish to gain an understanding of the management of this fishery. The application includes:
• Comprehensive background information on the biology of the silver lipped pearl oyster, the history of the Pearl Oyster Fishery and a description of the management arrangements, which provides the context for assessing this application (see Section 2 for details).
• A description of the National Ecologically Sustainable Development (ESD) reporting framework and methodology that was used to generate the information presented in the application (see Section 3 and www.fisheries-esd.com for details).
• Specific supporting statements relevant to each of the criteria within the Commonwealth Guidelines. These criteria include the “General Requirements”, which cover many of the governance aspects related to the management of the Pearl Oyster Fishery, plus each of the objectives listed under “Principle 1” (target species issues) and “Principle 2” (broader ecosystem issues) of the Guidelines (see Section 4).
• Section 4 has, where appropriate, specific links and reference to the detailed component reports contained in Section 5. Referral to this additional information is facilitated by the incorporation of appropriately placed hyperlinks (electronic version only).
• At the end of Section 4 there is an OVERVIEW TABLE that for each issue, outlines which EA Guidelines are relevant; if there is an operational objective, the availability of suitable data for the indicators, whether the current performance against the limit/measure chosen is acceptable, and a summary of what (if any) future actions are required.
• Section 5 includes a comprehensive account of the risk assessment outcomes and current performance of the Pearl Oyster Fishery, presented in the National ESD Reporting Framework format, covering each of the environmental and governance issues relevant to this application for the Pearl Oyster fishery. These reports include either the explicit objectives, indicators, performance measures, current and future management responses and
Application to Environment Australia for the Pearl Oyster Fishery
Department of Fisheries, W.A. October 2002 7
justification for each major component or a full justification for why specific management of this issue within the Pearl Oyster fishery is not required.
1.2 OVERVIEW OF APPLICATION The silver-lipped pearl oyster is the only species targeted by this fishery, which in terms of economic value is the second highest grossing fishery in WA, with an average annual value of around $220 million. The fishery has operated under a detailed and sophisticated management regime since 1982 when quotas were first introduced into the fishery. Management of the commercial fishery today is based on a quota system, minimum and maximum size limits, data collection, wild shell stock-hatchery quota substitution, compliance and hatchery operations. Each of these has been refined through time, and is subject to regular reviews to achieve overall aim of successful management. The Western Australian Pearling Act 1990 provides the legislative framework to implement the management arrangements for this fishery and the Pearling General Regulations 1991 supports this Act by providing the framework for the management of administrative and technical matters. The combination of having a large amount of relevant and accurate information on the biology of the silver lipped pearl oyster, extensive knowledge about the history of this fishery (in excess of 30 years for the culture shell fishery and almost 100 years for the Mother Of Pearl fishery), combined with the extensive catch and effort data and the sophisticated suite of management arrangements in place, have resulted in the maintenance of pearl oyster stocks as well as the successful continuation of the fishery. While this fishery has minimal impacts to the wider ecosystem, largely due to the selective method of fishing used, the fishery continues to take positive steps to minimise its impacts. A Code of Conduct/Practice is currently being developed by the industry. This code once finalised, will provide instruction as well as the opportunity for the industry to minimise, or in some cases, eliminate, the potential for impacts on other species and habitats within the fishing grounds. Consequently, the management regime for the Pearl Oyster Fishery should meet the Guidelines for the Ecologically Sustainable Management of Fisheries. Detailed justification for this conclusion is documented within the remainder of this application.
Application to Environment Australia for the Pearl Oyster Fishery
Department of Fisheries, W.A. October 2002 8
2. BACKGROUND INFORMATION
2.1 DESCRIPTION OF THE FISHERY Introduction The Western Australian pearl oyster industry is the world’s top producer of the highly prized, silver-white South Sea pearls that come from the silver lipped pearl oyster Pinctada maxima. Western Australian companies have an enviable record for producing a high quality product with an average annual value of around $220 million. This makes the WA pearl industry one of the largest and most successful aquaculture industries in Australia. In terms of economic value, the fishery is second in WA only to the Western Rock Lobster Managed Fishery. The pearl industry in WA is ‘vertically integrated’ and involves four basic activities:
• Collection of pearl oysters from the wild stocks; • Seeding process of implanting nuclei; • Grow-on phase to produce pearls; • Marketing of the product.
The industry currently relies on the collection of wild caught pearl oyster shells for the majority of the shells it uses for pearl production, although some hatchery produced shell is now utilised to supplement the wild shell quota in Zone 1 (currently around 50% of the quota for this zone). In order to meet the export requirements of the EPBC Act, this application will only address the environmental issues associated with the collection of pearl oysters from the wild stocks, up to the stage of shells being placed in fishing holding sites awaiting the implantation process. The environmental considerations related to the latter stages of the pearling process are the subject of a separate Environmental Management System analysis being developed by the WA Pearl Oyster industry. History The collection of pearl oysters has a long history in WA dating back to 1850, with the first recorded operations being in Shark Bay. In the early years, natural pearls were collected from the related species Pinctada albina, which were abundant in the shallows near Freshwater Camp (now Denham). Shells were either collected from intertidal banks at low tide or dredged from the shallow water. Early methods of obtaining natural pearls from the oysters were primitive. One technique widely used was to simply place the animals in large vats and allow them to rot. Once the animals had rotted, pearls were collected from the decaying residue in the bottom of the vats. Later when shells became more valuable than the pearls, the industry was based on the collection of mother of pearl (MOP) shell. During this time, no regulations were in place to manage the industry and ensure that the harvest was sustainable. As a result, the Pinctada albina pearl stocks became depleted and the fishery collapsed. This prompted two independent studies of the fishery and resulted in the Shark Bay Pearl Fishery Act, 1892 (SBPFA).
Application to Environment Australia for the Pearl Oyster Fishery
Department of Fisheries, W.A. October 2002 9
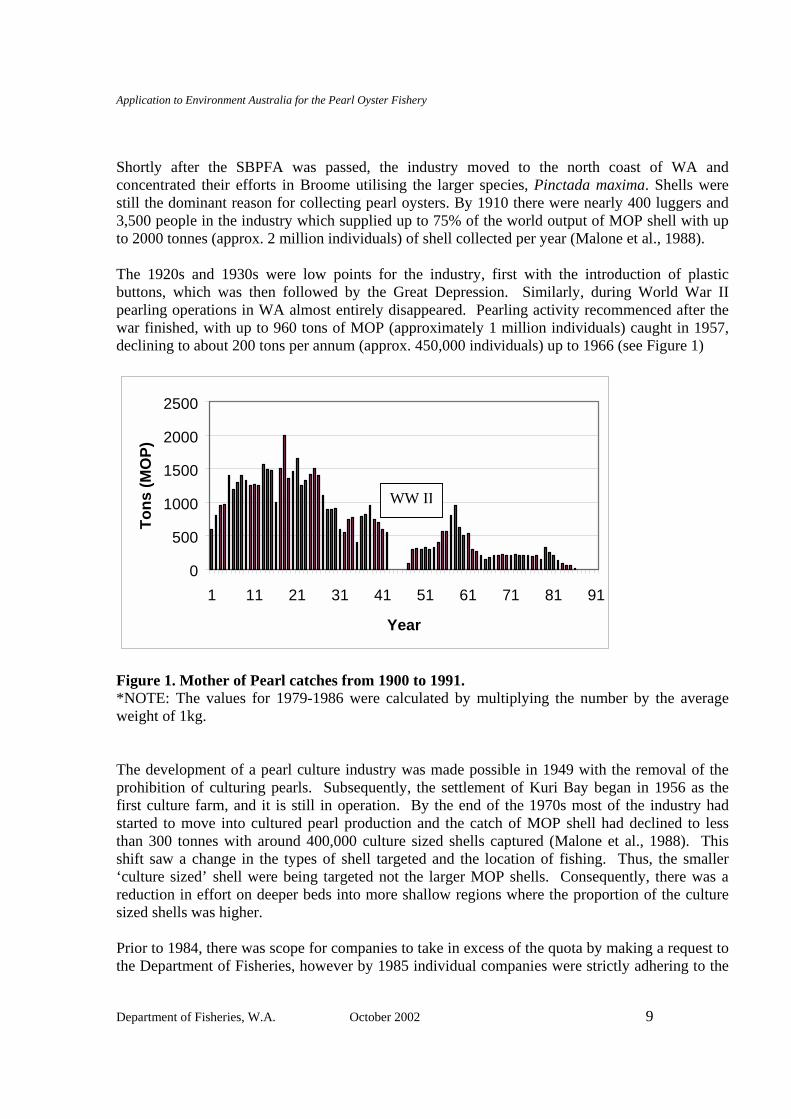
Shortly after the SBPFA was passed, the industry moved to the north coast of WA and concentrated their efforts in Broome utilising the larger species, Pinctada maxima. Shells were still the dominant reason for collecting pearl oysters. By 1910 there were nearly 400 luggers and 3,500 people in the industry which supplied up to 75% of the world output of MOP shell with up to 2000 tonnes (approx. 2 million individuals) of shell collected per year (Malone et al., 1988). The 1920s and 1930s were low points for the industry, first with the introduction of plastic buttons, which was then followed by the Great Depression. Similarly, during World War II pearling operations in WA almost entirely disappeared. Pearling activity recommenced after the war finished, with up to 960 tons of MOP (approximately 1 million individuals) caught in 1957, declining to about 200 tons per annum (approx. 450,000 individuals) up to 1966 (see Figure 1)
0
500
1000
1500
2000
2500
1 11 21 31 41 51 61 71 81 91
Year
Tons
(MO
P)
Figure 1. Mother of Pearl catches from 1900 to 1991. *NOTE: The values for 1979-1986 were calculated by multiplying the number by the average weight of 1kg. The development of a pearl culture industry was made possible in 1949 with the removal of the prohibition of culturing pearls. Subsequently, the settlement of Kuri Bay began in 1956 as the first culture farm, and it is still in operation. By the end of the 1970s most of the industry had started to move into cultured pearl production and the catch of MOP shell had declined to less than 300 tonnes with around 400,000 culture sized shells captured (Malone et al., 1988). This shift saw a change in the types of shell targeted and the location of fishing. Thus, the smaller ‘culture sized’ shell were being targeted not the larger MOP shells. Consequently, there was a reduction in effort on deeper beds into more shallow regions where the proportion of the culture sized shells was higher. Prior to 1984, there was scope for companies to take in excess of the quota by making a request to the Department of Fisheries, however by 1985 individual companies were strictly adhering to the
WW II
Application to Environment Australia for the Pearl Oyster Fishery
Department of Fisheries, W.A. October 2002 10
total allowable catch (TAC). Further management actions included banning the take of MOP in the Southern Sector in 1984 and south of Broome in 1985. In some zones, the TAC at this time included access to the larger MOP as well as culture shell. By 1987 allowances for MOP were eliminated, as licence owners believed that stocks of breeding size oysters should be strengthened. Since this time MOP has not been taken by the fishery. Consequently, there are a large number of areas where pearl shell used to be collected that are no longer harvested. The fishery was reviewed in the late 1980s (Malone et al, 1988) from which a series of recommendations about the management of the resource were developed. This included recommendations for the quotas to be set by annual stock assessments using the catches and catch rates, the complete phasing out of MOP collection and the zoning of the fishery to provide more precise management. During the last decade the total number of oysters fished annually from the main fishing grounds of the Pearl Oyster Fishery (Zone 2/3) has remained stable, varying by less than 10% around a mean catch of 476,560 pearl oysters. At the southern extremity of the fishery in Zone 1, which comprises around 20% of the Pearl Oyster Fishery, the annual catch of approximately 100,000 shells (1993-2000) has fluctuated by 30%. This fluctuation in landings is driven largely by more variable and sporadic recruitment and cyclone-induced habitat damage, resulting in lost fishing areas. This impact resulted in several management changes and the encouragement of pearling companies to substitute the wild quota allocations with hatchery-reared oysters. In summary, the early decades the pearl fishery went through cycles of boom and bust, with the loss of men and boats through cyclones and other storms, loss of life and permanent injuries through diving mishaps and the bends, labour problems, racial tensions, fluctuating prices, and more recently, competition from cultured pearls. While there are still variations in the economic cycles, the industry is now highly organised and geared to maintaining sustainable production on an economically and environmentally sound basis. Current Fishing Operation The Pearl Oyster Fishery of Western Australia (WA) operates in shallow coastal waters along Western Australia’s North-West Shelf (see Figure 2). The WA pearling industry currently comprises 16 licensees that can collect pearl oyster shell from Exmouth Gulf to the Northern Territory border. In any given year, there can be between 6 to 10 vessels fishing for pearl oysters. There is only one target species in this fishery, the silver lipped pearl oyster Pinctada maxima, which are individually collected by highly trained divers being towed behind large tender boats. These pearling vessels are up to about 35 m long, many of which are custom designed for the pearling industry. The total crew on the boats is usually 10 to 12 people: these include the skipper, engineer, a number of deckhand(s), cook(s), and six divers. Fishing for pearl oysters generally involves the extension of booms outwards from each side of the vessel with a number of weighted ropes hung vertically from each boom to a height of approximately one to two metres from the seabed. Most boats use three lines per boom, which allows six divers to work simultaneously. Divers operate on hookah, or air supplied from a

Application to Environment Australia for the Pearl Oyster Fishery
Department of Fisheries, W.A. October 2002 11
surface compressor. Coded signals are used by the head diver to communicate with the crew on the boat to control the speed and direction of the boat, height of the weights, etc. Since water clarity is paramount to divers being able to capture the pearl oysters efficiently (i.e. identify the appropriate sized oysters) significant effort is put in place to ensure the weight does not strike the sea floor. Therefore the diver will signal to the vessel to raise the weight according to the sea floor height- thus preventing the weight from striking the bottom. Not only does this practice prevent damage to the bottom, but also allows the diver to efficiently fish for pearl oysters. Each diver wears a neck bag during the dive. As pearl oysters are collected, they are kept in the neck bag until it is full. Only pearl oysters that are deemed of ‘culture shell’ quality – the appropriate size and health - are collected (see later for details). The collected shells are transferred to the holding bag at the end of each weighted rope. The divers swim about 1.5 m off the seabed to obtain the maximum field of view. Even in murky water when the divers swim closer to the bottom they are still above the bottom substrate. A good diver aims to collect an average of 250 ‘culture shell’ pearl oysters per day. The areas where pearl oysters are collected are subject to extreme tidal ranges (up to 9 m), and consequently have very strong tidal currents. Diving is too difficult and dangerous during the spring tidal periods, and is only undertaken for six to twelve days on the neap cycle when currents are substantially reduced. Fishing for live pearl oysters begins early in January and continues for up to seven months. The vessel begins “drifting” (towing) at one end of a pearl oyster patch and moves slowly across the patch at a rate of about one knot. The engine remains in gear to maintain steerage of the vessel, but even at minimum speed the boat moves too fast for the divers, and so a stern drogue is deployed to act as a sea anchor and slow the boat. Ropes attached to the drogue can be manipulated to open the drogue fully and slow the boat or partially close it to increase speed. Each diver makes an average of eight to 10 dives in depths of less than 23m per day. A code of practice for diving in the industry has been developed and the industry has appointed both a dive safety officer and a specialist dive doctor. Considerable problems were encountered in the pearling industry in the early years before diving physiology was understood. Many divers died or were permanently injured through lack of understanding of diving medicine. With the benefit of past experience and modern medical knowledge, a standardised technique has been designed specifically for pearl oyster divers in Western Australian tidal conditions. Dives shallower than 23m last for no more than 40 minutes, followed by a stringent ascent and surface interval while the boat is repositioned for the next dive; dives in very shallow water at 8m can be longer. Time limits are strictly adhered to as extending the diving time by even a few minutes will significantly add to the total bottom time over a 10-dive day and increase the risk of decompression sickness. If dives are conducted in deeper water they are for substantially shorter periods and many deeper pearl shell beds are not fished at all.
At the end of the dives the pearl oysters that have been collected are recovered and graded. Shells that are too big or too small are returned immediately to the vicinity from which they were taken from. Shells of the target size are cleaned with a cleaver by scraping off encrusting organisms on
Application to Environment Australia for the Pearl Oyster Fishery
Department of Fisheries, W.A. October 2002 12
the pearl shell. A high-pressure hose is then used to wash the shells; no chemicals are used in the process. The shells are placed in transport panels on the boat holding six animals each, and every panel is individually tagged to indicate which company has collected the shell. The tags are numbered, and each company is only issued sufficient tags by the Department of Fisheries, to match its quota. The transport panels are wire frames with plastic coating which hold two pearl shells across and three down (some operators use panels which hold 8 oysters). Light netting of about 2 mm diameter is used to hold the shells into place. A 6 mm rope is used to make a handle. All treatments take place in the shade to prevent the animals from becoming overheated in the sun. Once they have been cleaned and placed in panels, the shells are kept in the shade and continuously rinsed with water. An alternative method is to hold the shells in tanks. Shells are out of the water for less than an hour. Once all the shells have been placed in the frames, they are taken to a shell “fishing holding site” within 2nm of the fishing vessel where they are placed on the seabed using divers in a marked area for later usage. Transportation is in an open boat, but the animals are kept under a shade cloth and there is a padded covering on the floor of the boat to minimise jarring. At the fishing holding site the pearl oysters are returned to the sea. A surface buoy is placed at each end to mark the line, which may be several hundred metres long. To place the panels on the lines, each handle is tied to the rope at 900 mm intervals and then lowered into the water. Divers later move down the line on the bottom to ensure the pearl oysters are in the proper orientation and are not on any corals. The sea floor at the fishing holding sites is deliberately selected to be very similar to that found on the fishing grounds. Thus, they are mostly sand bottom with occasional sponges, soft corals, sea fans, and other fauna present, including some Turbinaria corals. The period of up to two months that the pearl oysters remain at the fishing holding sites minimises the physiological effect on the oysters from having been collected, and it also allows the animals to recover before the nucleus is inserted. Additional fishing holding sites are used as the boat works different areas. Under the Pearling Regulations, a buoy must mark the fishing holding site and the Department must be notified of its location. Management During the period from 13 February 1991 to 2 February 1995, the Western Australian pearling industry was administered under the Western Australian Pearling Act 1912 in two parts:
• The catching sector by a Joint Authority, established under the Offshore Constitutional Settlement and comprising the Commonwealth and Western Australian Ministers responsible for fisheries, including pearling; and
Application to Environment Australia for the Pearl Oyster Fishery
Department of Fisheries, W.A. October 2002 13
• The remaining aspects of the pearling industry, such as farm leases and hatcheries, by the Western Australian Minister for Fisheries.
Since 3 February 1995, all aspects of the industry have been managed solely by Western Australia in accordance with the Western Australian Pearling Act 1990. The Executive Director of Fisheries has adopted the decisions from the Joint Authority taken prior to 3 February 1995. The Pearling General (Regulations) 1991 support the Act and provide the framework for the management of administrative and technical matters. The definition of P. maxima in the act includes any hybrids of P. maxima produced through laboratory technology. All aspects of the management of other species of pearl oysters (e.g. P. margaritifera) are managed under the provisions of the Fish Resources Management Act 1994. The Executive Director (ED) of the Department of Fisheries may grant leases, licences and permits under Section 23 of the Pearling Act 1990 subject to a number of conditions being satisfied and the Executive Director having regard to any policy guidelines issued by the Minister for Fisheries under the Act. These guidelines are detailed in the Pearl Oyster Fishing Ministerial Policy Guidelines (April, 1997). These guidelines deal with the elements of fishing and farming and focus on the establishment of zones in the fishery, quota allocation and transfer of shell. Marketing has a very important role to play in the management of the fishery. WA pearls achieve a premium price, in part due to their rarity. Thus, there is little incentive to increase pearl oyster catches and to produce a higher quantity of pearls because this would likely reduce the value of this product. Management of the commercial fishery is based on the following: Quota System The wild stock pearl oyster fishery is managed on a system of individual quotas with an annual TAC. The total number of quota units in the Pearl Oyster Fishery is 572, allocated between 16 pearling companies. Generally, 1 quota unit equates to 1000 pearl oysters. The status of stocks on the fished grounds is reviewed each year by the Department of Fisheries in liaison with the Pearling Industry Advisory Committee (PIAC) and the annual quota is adjusted accordingly. For example in Zones 2 and 3 for 2001, the fishing unit quota was increased to 1100 pearl oysters due to an increase in pearl oyster abundance. Each operator has an annual quota of live pearl shell, which is collected according to each operator’s access to the four zones.

Application to Environment Australia for the Pearl Oyster Fishery
Department of Fisheries, W.A. October 2002 14
Zone Restrictions
Figure 2. The Pearl Oyster Fishery fishing zones in WA. The fishery is separated into four zones (Figure 2) in order to manage wild shell stocks and translocation issues. In Zones 1 and 2 there is an overlap region between 118o10’ E and 119o30’E. The zones are:
- Pearl Oyster Zone 1: 5 licensees - NW Cape (including Exmouth Gulf) to longitude 119o30’ E.
- Pearl Oyster Zone 2: 9 licensees - East of Cape Thouin (118o10’ E) and south of latitude 18o14’ S. Note: full access for Zone 2 licence holders to Zone 3.
- Pearl Oyster Zone 3: 2 licensees - West of longitude 125o20’ E and north of latitude 18o14’ S. Note: partial access for Zone 3 licence holders to Zone 2.
- Pearl Oyster Zone 4: East of longitude 125o20’ E to WA/NT border. Note: although all licensees have access to this zone, exploratory fishing has shown that stocks in this area are not commercially viable. However, pearl farming does occur.
Minimum and Maximum Size Limits Pearling is managed as a ‘gauntlet’ fishery, to allow the oysters to be caught at the optimum size, 120-160 mm (the shell size can grow to 270 mm, see below for details). The minimum size limit for collection of pearl oysters is 120 mm, when the animals are three to four years old. Although there is generally no regulated maximum size for collection of pearl oysters, in practice few individuals are taken over 160 mm because they are too slow growing to produce high quality pearls. This has a beneficial effect because oysters larger than this size form the basis of the breeding stock.
Application to Environment Australia for the Pearl Oyster Fishery
Department of Fisheries, W.A. October 2002 15
An exception to this is in Exmouth Gulf where a legal maximum size limit of 160 mm is in place. This was introduced some time ago following a period when recruitment in this zone was low and it was thought that some operators were collecting oversized oysters to compensate for a shortage of culture-sized pearl oyster. Data Collection The tracking of catch and effort data against the quotas set is vital to ensure the integrity of the management strategy. Catch and effort data must be provided to the Department of Fisheries on each dive made during the collecting season. Details are logged using square blocks of 10 nautical miles divided into sub-blocks of squares with sides of 2.5 nautical miles. (More details on these data are provided in the performance reports). Wild Shell Stock-Hatchery Quota Substitution With the advent of techniques to produce hatchery-reared pearl oyster, the demand for wild caught individuals may decrease. However, the demand will likely fluctuate from year to year for the wild pearl oysters (Pinctada maxima). Operators have the option of substituting a proportion of their wild shell quota with hatchery individuals, thus resulting in less individuals being harvested from the wild, but the same number of oysters are farmed for pearls (so that production does not increase, resulting in reduced prices). Compliance During 1999/2000, a staff commitment equivalent to 4.6 officers based in Broome and Karratha delivered the compliance program monitoring across all zones of the pearl oyster fishery. Companies have continued to increase production against the quotas of hatchery-reared shell in line with government policy and the compliance focus has shifted to the monitoring and control of this product. Major compliance issues are the verification of shell numbers and size prior to seeding operations, and the movement of hatchery shell within and also between farms. Regular nursery site audits are conducted to monitor hatchery shell growout and to verify progress for the conversion of hatchery options to hatchery quota. Approvals to allow the use of hatchery shell for technician training and for mantle tissue in seeding operations have also increased compliance requirements in this area. Quotas are monitored through a combination of quota tags and a paper audit trail using catch, holding site, transport and seeding operations logbooks submitted by licensees to the Department. Field officers based in Karratha and Broome patrol from Exmouth Gulf (Zone 1) to the Kimberley development zone (Zone 4). Patrols to verify compliance with tagging and associated logbook systems utilise diving inspections, aircraft, both large and small Departmental patrol vessels and industry boats. The majority of at-sea inspections and patrols are carried out using the Department of Fisheries ocean-going patrol vessels, with small Departmental vessels being used as dive platforms.
Application to Environment Australia for the Pearl Oyster Fishery
Department of Fisheries, W.A. October 2002 16
In the future, there may be a shift in the focus on the wild stock compliance program, with a greater use of Vessel Monitoring Systems (VMS) to monitor vessel movements and placement of trained observers on industry vessels to verify wild stock catches. In addition, the introduction of electronic tags is currently being investigated. This would likely reduce the chance of tags being falsified and/or tampered with. Hatchery Operations Several companies have now converted their hatchery options to fill quota and there has been an increase in the quantity of hatchery-reared shell being used for seeding operations in preference of wild stock. As previously mentioned, around 50% of last year’s wild harvest quota for Zone 1 was converted to hatchery-reared shells as encouraged by government policy in this region. The production and translocation of hatchery-produced pearl oysters are monitored by the system of hatchery and transport logbooks combined with a system for disease testing, quarantine and health certificate clearances. Conversion of hatchery options to hatchery quota is monitored by a combination of operations logbooks, nursery and operations audits, and at-sea compliance presence during operations. Research Research for managing the pearl oyster stocks utilises detailed diver logbook records (catch and effort), at-sea sampling of catches and information gathered during research projects. This information is used annually to monitor the status of the stocks and to review and set catch quotas. The research and development strategy by the Department of Fisheries for the WA pearling industry is outlined in a number of categories (Biological, Environmental, Industry Development, Fish Health, Hatchery and Marketing) within which gaps in knowledge are identified, and research is planned, prioritised, scheduled and allocated to suitable research agencies. Appendix 3 contains a spreadsheet of the current and proposed Pearling Research and Development Projects. A summary of the research projects completed to date includes:
• biology of pearl oysters (CSIRO - 1950’s), • catch statistics (FWA 1970’s +), • disease (FWA / Murdoch University/FIRTA - 1980’s), • hatchery culture and grow-out (FWA - 1980’s) • pearl oyster / prawn habitat survey (FWA 1980’s), and • general stock biology (FWA / FRDC - 80’s-90’s).
Current research projects have concentrated on:
• ongoing stock monitoring, • growth of pearl oysters, • MOP stocks (FRDC-1998), and • Recruitment levels and future catch rate forecasting (FRDC - 1996 – on going).
More complete descriptions of these research projects are presented below.
Application to Environment Australia for the Pearl Oyster Fishery
Department of Fisheries, W.A. October 2002 17
On-going Stock Monitoring The core business of the research section is monitoring the performance of the fishery through analysis of detailed diver logbook records. The monitoring of stocks is based on an assessment of Catch per Unit Effort (CPUE) on an annual basis. In addition to the CPUE analysis, the research section undertakes periodic length-frequency surveys of the catch, on board industry vessels. These data provide an understanding of the size composition of pearl oysters, which are being collected and can show years when low recruitment has occurred. Years of low recruitment are seen some years later in the commercial catch indicated by a lack of individuals in the optimal size range (120-140 mm). Mother of Pearl Research A FRDC (1998/153) funded research project initiated in 1998 is continuing to undertake research into the MOP component of the pearl oyster stocks. Currently, it has the specific focus of determining the shell size structure of stocks off the 80 Mile beach and deepwater fishing grounds Recruitment Index In order to establish more certainty around stock predictions, the Department of Fisheries is assessing recruitment variation (FRDC 2000/127 - spat project) by determining if there is a predictable relationship (positive correlation) between levels of spat observed on fished culture shells and subsequent availability of pearl oysters to the fishery (two years ahead). This information would greatly assist managers in determining quota allocations, as there is currently a heavy reliance on retrospective catch rate data to determine future management controls. In a fishery that targets pearl oysters for approximately 3 years once they reach legal size, projections based on retrospective catch rate data can underestimate or overestimate available stock.
2.2 BIOLOGY OF SILVER LIPPED PEARL OYSTERS Distribution and Stock Structure The Silver lipped (sometimes called Gold lipped) pearl oysters (Pinctada maxima) belong to the Family Pteriidae, which is a small family of bivalve molluscs. Five species of the genus Pinctada occur in WA and they are: Pinctada albina, P. fucata, P. maculata, P. maxima, and P. margaritifera (Hynd, 1955; Wells, unpublished data). Of these only P. maxima, P. margaritifera and P. albina are currently being used for pearl production in Western Australia. A related species, the wing shell (Pteria penguin), is also now being trialed in WA.
Application to Environment Australia for the Pearl Oyster Fishery
Department of Fisheries, W.A. October 2002 18
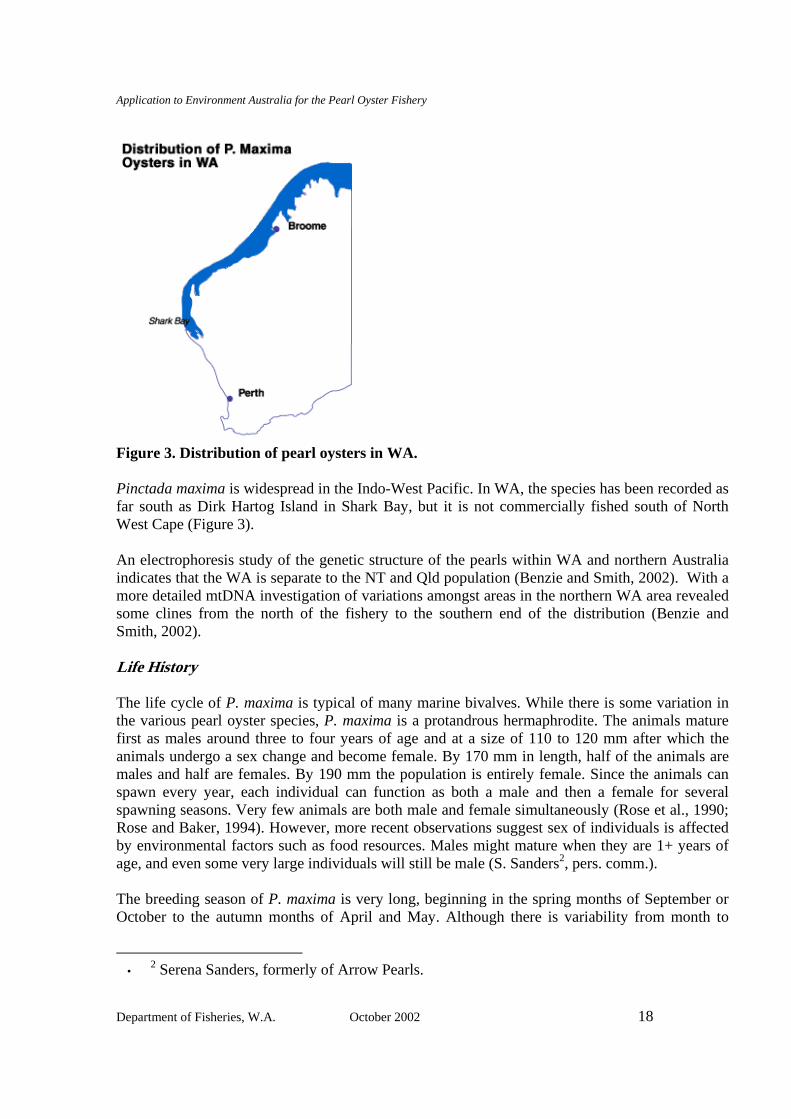
Figure 3. Distribution of pearl oysters in WA. Pinctada maxima is widespread in the Indo-West Pacific. In WA, the species has been recorded as far south as Dirk Hartog Island in Shark Bay, but it is not commercially fished south of North West Cape (Figure 3). An electrophoresis study of the genetic structure of the pearls within WA and northern Australia indicates that the WA is separate to the NT and Qld population (Benzie and Smith, 2002). With a more detailed mtDNA investigation of variations amongst areas in the northern WA area revealed some clines from the north of the fishery to the southern end of the distribution (Benzie and Smith, 2002). Life History The life cycle of P. maxima is typical of many marine bivalves. While there is some variation in the various pearl oyster species, P. maxima is a protandrous hermaphrodite. The animals mature first as males around three to four years of age and at a size of 110 to 120 mm after which the animals undergo a sex change and become female. By 170 mm in length, half of the animals are males and half are females. By 190 mm the population is entirely female. Since the animals can spawn every year, each individual can function as both a male and then a female for several spawning seasons. Very few animals are both male and female simultaneously (Rose et al., 1990; Rose and Baker, 1994). However, more recent observations suggest sex of individuals is affected by environmental factors such as food resources. Males might mature when they are 1+ years of age, and even some very large individuals will still be male (S. Sanders2, pers. comm.). The breeding season of P. maxima is very long, beginning in the spring months of September or October to the autumn months of April and May. Although there is variability from month to
•
2 Serena Sanders, formerly of Arrow Pearls.
Application to Environment Australia for the Pearl Oyster Fishery
Department of Fisheries, W.A. October 2002 19
month, the primary spawning occurs from the middle of October to December. A smaller secondary spawning occurs in February and March (Rose et al., 1990; Rose and Baker, 1994). Collection of settling spat in the field has confirmed the spawning periodicity (Knuckey, 1995). During the spawning season, gametes (both sperm and eggs) are spawned into the water column, where fertilisation occurs. Egg production by an individual female is extremely high. Laboratory studies have shown that females can release from two to 12 million ova (Rose and Baker, 1994). The animals develop into a tiny veliger stage. This planktonic veliger stage is a distributional phase that allows the young pearl oysters to colonise new areas if suitable bottom can be found. Since losses in the water column are extremely high only a tiny fraction, far less than 1% of the fertilised eggs, actually survive the veliger stage. The length of the planktonic stage in P. maxima suggests its distributional potential is intermediate. Settlement usually occurs around days 28 to 35. When they are ready to metamorphose they settle to the bottom and test for a suitable habitat. If an appropriate area is found, they settle on it and metamorphose into the juvenile stage. If no suitable settlement site is located within a short period the animals will metamorphose and die. In laboratory studies, 4% of the initial larval population settled and grew successfully to 5 mm in shell length. In field trials of laboratory-raised animals, juveniles reached a mean size of 56 mm after six months. Twenty to 25% of these grew to an average size of 102 mm in 19 months (Rose and Baker, 1994). During the juvenile and adult phases of the life cycle for Pinctada maxima, it attaches to the sea bottom by tiny threads. P. maxima requires a hard surface for attachment and once it is attached to the bottom, the connection is permanent. The animals have no further ability to colonise new habitats or move to a more favourable position. Pinctada maxima lives on shallow rocky pavements on the continental shelf where there are small crevices into which the young animals can settle and develop. Like most bivalves, pearl oysters are filter feeders. They use their gills to filter small food particles out of the surrounding water. Growth rates are initially fast. Field measurements at Eighty Mile Beach have shown that the animals reach the minimum legal size of 120 mm in their third year of life. They are fished for three to four years before growing to a size where they are no longer suitable for round pearl culture. Large oysters of 200 mm are 15 to 20 years old (Joll, 1996). The animals can reach a shell height of 270 mm (Rose and Baker, 1994).
2.3 MAJOR ENVIRONMENTS
2.3.1 PHYSICAL ENVIRONMENT The Pearl Oyster Fishery extends over 3 bioregions of Western Australia – the Gascoyne, Pilbara and Kimberley and as a result there is a vast variation in the environmental conditions over this large area.
Application to Environment Australia for the Pearl Oyster Fishery
Department of Fisheries, W.A. October 2002 20
The Gascoyne Region is significant because it represents the transition zone from tropical and warm temperate areas. The climate in the region ranges from hot, arid conditions to warm semi-arid conditions. The annual average minimum and maximum temperature for the region is approximately 17°C and 27°C respectively, with the coolest month being July. Rainfall averages 300 mm annually with peak falls occurring in both winter and summer because of the influence of tropical cyclones, the incursion of warm moist air from the Kimberley Region, and mid-latitude depressions. Tropical cyclones in the north around Exmouth Gulf (Zone 1) with wind speeds in excess of 40-50 knots occur every three to five years, with less intensive systems occurring annually during January to March. The Ningaloo Marine Park slightly overlaps Zone 1 of this fishery and oyster fishing is permitted within this area. There are three ecologically sensitive habitats in the Pilbara and Kimberley regions where the pearling industry operates: mangroves, seagrasses and coral reefs. While mangroves and seagrasses are plants the coral reefs are based on coral animals, the symbiotic zoocanthellae that live in the coral tissues are primary producers. Seagrasses are widely distributed along the Pilbara and Kimberley coasts and offshore islands. However, in contrast to the dense meadows formed in south-western Australia, most of the tropical species found along the north coast form only patchy associations in which the plants have 10% or less of the biomass of southern seagrass communities. The only exceptions are an extensive meadow of dense seagrass near Onslow and second, very large meadow in the area off Sunday Island, north of Cape Leveque (Walker and Prince, 1987; Walker et al., 1996). Neither of these seagrass ecosystems is near the Pearl Oyster functional fishing area. Corals are diverse in both the Kimberley and Pilbara regions, and form extensive reefs in many areas. Coral reefs are well known to harbour a biologically diverse and ecologically productive community in areas where nutrient supplies are low. Some of the major coral reefs in the Pilbara are protected as marine parks: Rowley Shoals Marine Park. While some species of corals can survive as small individual communities in turbid areas, the only extensive coral reefs are in offshore waters where the water is clear. Studies undertaken by the Western Australian Museum in conjunction with the University of Western Australia and the Museums and Art Galleries of the Northern Territory (Wells, 1989; Morgan, 1992; Wells et al., 1995; Walker et al., 1996b; Walker, 1997) have documented the distributions of many species of marine plants and animals in the Kimberley region. 2.3.1.1 DESCRIPTION OF HABITATS WITHIN THE FISHERY Pearl oysters are commonly found in areas where the seabed has crevices that allow the young animals to settle into a protected environment and a hard substratum for them to attach. The seabed is typically a flat basement rock with very little relief. Fine sediment accumulates on it to a depth of a few millimeters, obscuring the underlying rock surface. A variety of organisms attach to the rock. These organisms provide a vertical relief of up to 1m off the bottom. There can be a substantial overlap in the fauna on the various bottom types, the types are determined by the dominant species present. The industry has recognised the variety of bottom types within the
Application to Environment Australia for the Pearl Oyster Fishery
Department of Fisheries, W.A. October 2002 21
fishing grounds and developed names for them over the years such as potato bottom, garden bottom etc. The dominant species on the potato bottom is a low, round densely packed ascidian species, which lives attached on the bottom. The sea floor in this bottom type has a flat plate of underlying rock overlain with a few millimeters of sand. In areas of heavy potato bottom the ascidian are almost completely dominant. Sponges are the next dominant group, with a large variety of vase shaped, basket sponges and massive sponges up to 0.5m high interspersed with smaller sponges of only a few centimeters. A variety of other diversity of the taxa present, total density is low. Very few corals (Turbinaria) are present. Faunal density rapidly decreases in areas where the sediment is 2-3 cm deep. Bare sand patches can be interspersed between areas of potato bottom. The garden bottom is a very diverse assemblage dominated by hydroids. Distance between hydroids is variable, but on average they grow about one metre apart. The hydroids grow rapidly to up to one metre in height and quickly become encrusted with a variety of organisms, some very colourful, so the bottom does in fact resemble in garden. Other than hydroids, a variety of sponges are present on the bottom. Ascidians are present, but are a larger species than that found on potato bottom. Other fauna present include soft corals, sea pens and crinoids. No hard corals are generally present. While potato and garden bottom dominate in the fishing area, several other bottom types are recognised by the industry including collar, asparagus etc. All share the common feature of being located on a bottom with underlying rock and are composed of a wide variety of invertebrates. None of the habitats are in ecological sensitive areas such as seagrasses, coral reefs or mangroves. None of these habitats types, apart from potato and garden bottom, have commercial quantities of pearl oysters.
2.3 2 ECONOMIC ENVIRONMENT The value of cultured pearls and by-products is considered to be approximately $220 million for the year 2000. However, the precise estimate of the value of product is difficult to achieve owing to the variable time lags, which occur between harvesting and sale to offshore buyers, and the costs incurred in marketing before sales take place. While the oyster meat is sold within Australia, the mother of pearl shell (product from the end phase of culture) is sent to the US, Japan, SE Asia, France and the Middle East for buttons and inlay work.
2.3.3 SOCIAL ENVIRONMENT Pearl oyster fishing vessels operate from the Lacepedes north of Broome down to Exmouth Gulf in the south. There are 6–10 fishing vessels presently operating within the fishery and each vessel has around 10-14 crew members involved with the fishing of oysters between January and July each year. These vessels also support a number of other pearl farm functions throughout the year. Fleet managers are employed by pearling companies to coordinate and support vessel operations.
Application to Environment Australia for the Pearl Oyster Fishery
Department of Fisheries, W.A. October 2002 22
The pearling industry employs approximately 1500 people from Regional centers, primarily from Broome.
Application to Environment Australia for the Pearl Oyster Fishery
Department of Fisheries, W.A. October 2002 23
3. METHODOLOGY
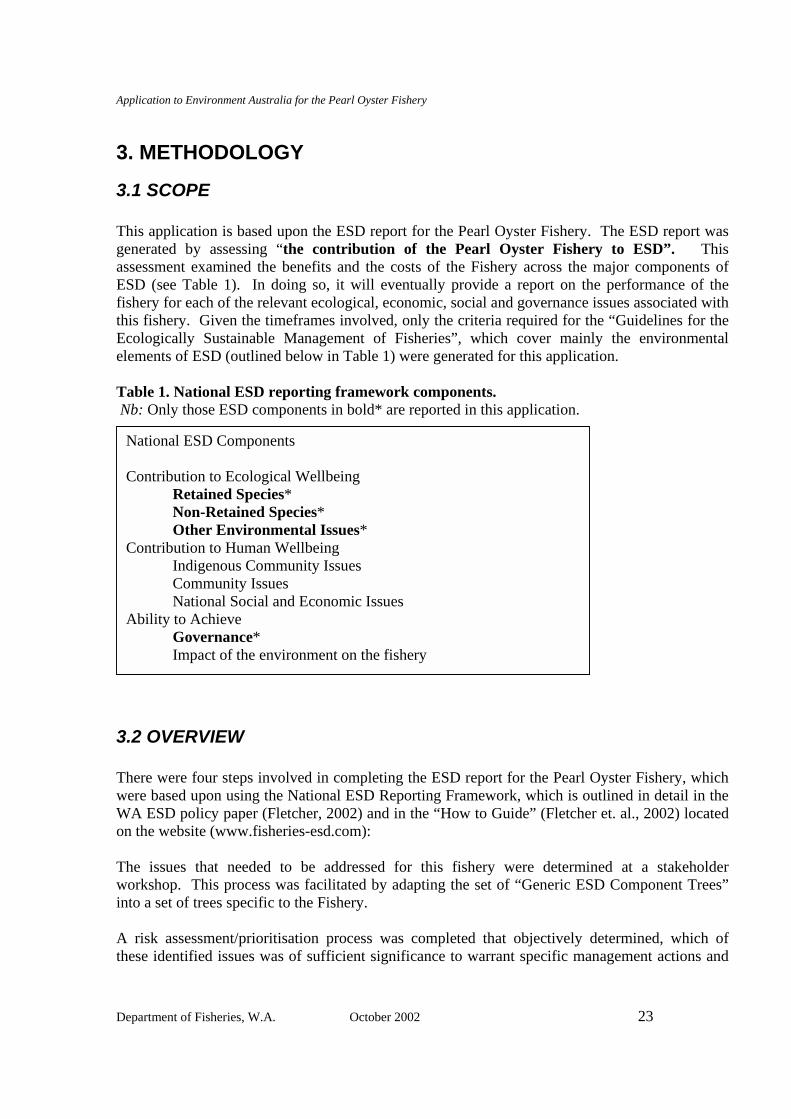
3.1 SCOPE This application is based upon the ESD report for the Pearl Oyster Fishery. The ESD report was generated by assessing “the contribution of the Pearl Oyster Fishery to ESD”. This assessment examined the benefits and the costs of the Fishery across the major components of ESD (see Table 1). In doing so, it will eventually provide a report on the performance of the fishery for each of the relevant ecological, economic, social and governance issues associated with this fishery. Given the timeframes involved, only the criteria required for the “Guidelines for the Ecologically Sustainable Management of Fisheries”, which cover mainly the environmental elements of ESD (outlined below in Table 1) were generated for this application. Table 1. National ESD reporting framework components. Nb: Only those ESD components in bold* are reported in this application.
3.2 OVERVIEW There were four steps involved in completing the ESD report for the Pearl Oyster Fishery, which were based upon using the National ESD Reporting Framework, which is outlined in detail in the WA ESD policy paper (Fletcher, 2002) and in the “How to Guide” (Fletcher et. al., 2002) located on the website (www.fisheries-esd.com): The issues that needed to be addressed for this fishery were determined at a stakeholder workshop. This process was facilitated by adapting the set of “Generic ESD Component Trees” into a set of trees specific to the Fishery. A risk assessment/prioritisation process was completed that objectively determined, which of these identified issues was of sufficient significance to warrant specific management actions and
National ESD Components Contribution to Ecological Wellbeing Retained Species* Non-Retained Species* Other Environmental Issues* Contribution to Human Wellbeing Indigenous Community Issues Community Issues National Social and Economic Issues Ability to Achieve Governance* Impact of the environment on the fishery
Application to Environment Australia for the Pearl Oyster Fishery
Department of Fisheries, W.A. October 2002 24
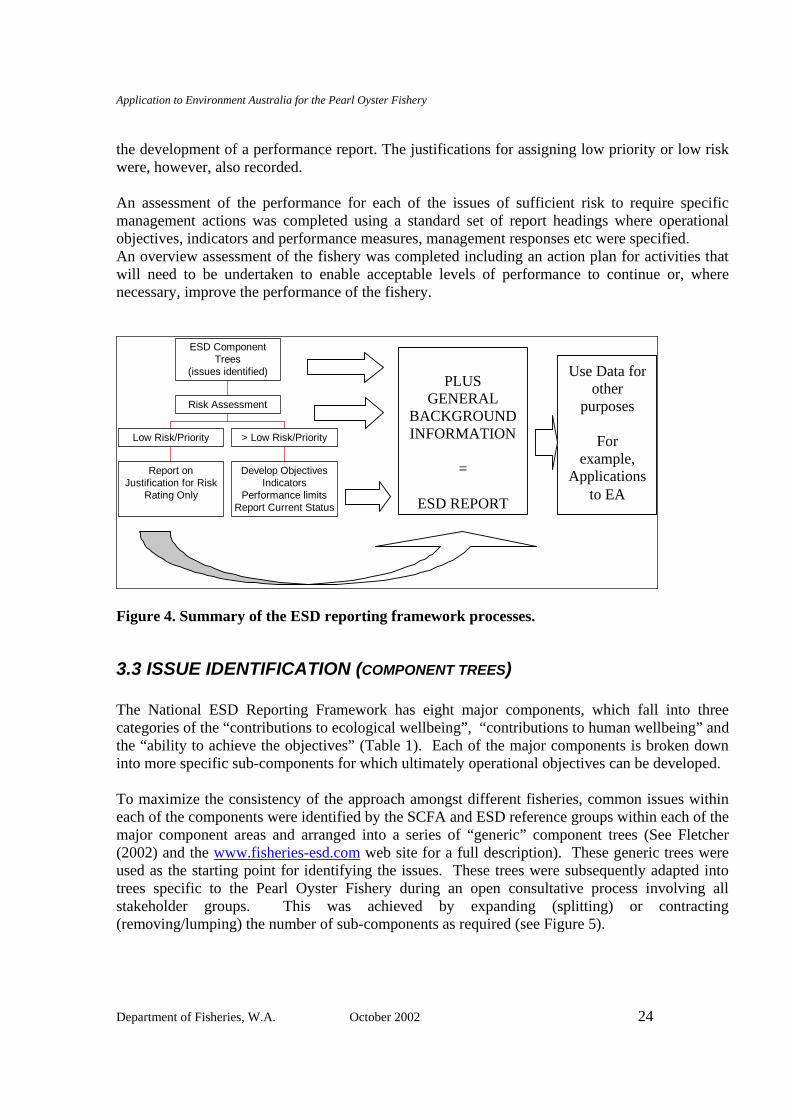
the development of a performance report. The justifications for assigning low priority or low risk were, however, also recorded. An assessment of the performance for each of the issues of sufficient risk to require specific management actions was completed using a standard set of report headings where operational objectives, indicators and performance measures, management responses etc were specified. An overview assessment of the fishery was completed including an action plan for activities that will need to be undertaken to enable acceptable levels of performance to continue or, where necessary, improve the performance of the fishery.
Report onJustification for Risk
Rating Only
Low Risk/Priority
Develop ObjectivesIndicators
Performance limitsReport Current Status
> Low Risk/Priority
Risk Assessment
ESD ComponentTrees
(issues identified) PLUS
GENERAL BACKGROUND INFORMATION
=
ESD REPORT
Use Data for other
purposes
For example,
Applications to EA
Figure 4. Summary of the ESD reporting framework processes.
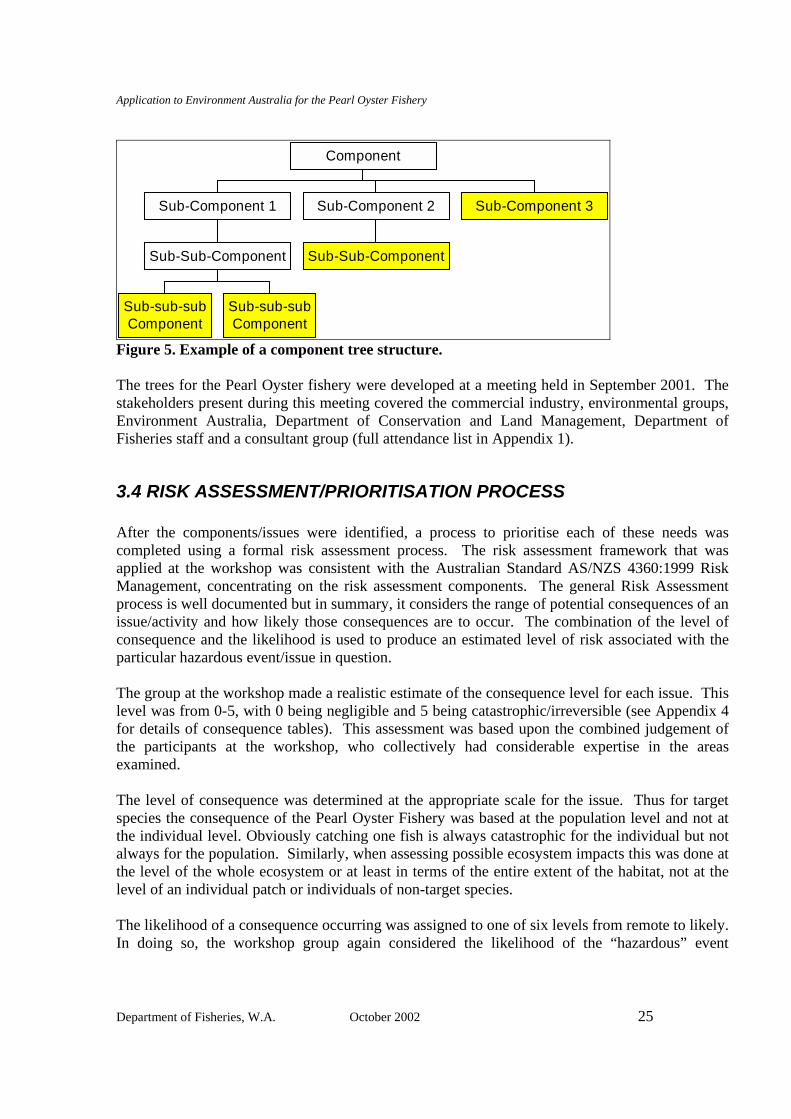
3.3 ISSUE IDENTIFICATION (COMPONENT TREES) The National ESD Reporting Framework has eight major components, which fall into three categories of the “contributions to ecological wellbeing”, “contributions to human wellbeing” and the “ability to achieve the objectives” (Table 1). Each of the major components is broken down into more specific sub-components for which ultimately operational objectives can be developed. To maximize the consistency of the approach amongst different fisheries, common issues within each of the components were identified by the SCFA and ESD reference groups within each of the major component areas and arranged into a series of “generic” component trees (See Fletcher (2002) and the www.fisheries-esd.com web site for a full description). These generic trees were used as the starting point for identifying the issues. These trees were subsequently adapted into trees specific to the Pearl Oyster Fishery during an open consultative process involving all stakeholder groups. This was achieved by expanding (splitting) or contracting (removing/lumping) the number of sub-components as required (see Figure 5).
Application to Environment Australia for the Pearl Oyster Fishery
Department of Fisheries, W.A. October 2002 25
Sub-sub-subComponent
Sub-sub-subComponent
Sub-Sub-Component
Sub-Component 1
Sub-Sub-Component
Sub-Component 2 Sub-Component 3
Component
Figure 5. Example of a component tree structure. The trees for the Pearl Oyster fishery were developed at a meeting held in September 2001. The stakeholders present during this meeting covered the commercial industry, environmental groups, Environment Australia, Department of Conservation and Land Management, Department of Fisheries staff and a consultant group (full attendance list in Appendix 1).
3.4 RISK ASSESSMENT/PRIORITISATION PROCESS After the components/issues were identified, a process to prioritise each of these needs was completed using a formal risk assessment process. The risk assessment framework that was applied at the workshop was consistent with the Australian Standard AS/NZS 4360:1999 Risk Management, concentrating on the risk assessment components. The general Risk Assessment process is well documented but in summary, it considers the range of potential consequences of an issue/activity and how likely those consequences are to occur. The combination of the level of consequence and the likelihood is used to produce an estimated level of risk associated with the particular hazardous event/issue in question. The group at the workshop made a realistic estimate of the consequence level for each issue. This level was from 0-5, with 0 being negligible and 5 being catastrophic/irreversible (see Appendix 4 for details of consequence tables). This assessment was based upon the combined judgement of the participants at the workshop, who collectively had considerable expertise in the areas examined. The level of consequence was determined at the appropriate scale for the issue. Thus for target species the consequence of the Pearl Oyster Fishery was based at the population level and not at the individual level. Obviously catching one fish is always catastrophic for the individual but not always for the population. Similarly, when assessing possible ecosystem impacts this was done at the level of the whole ecosystem or at least in terms of the entire extent of the habitat, not at the level of an individual patch or individuals of non-target species. The likelihood of a consequence occurring was assigned to one of six levels from remote to likely. In doing so, the workshop group again considered the likelihood of the “hazardous” event
Application to Environment Australia for the Pearl Oyster Fishery
Department of Fisheries, W.A. October 2002 26
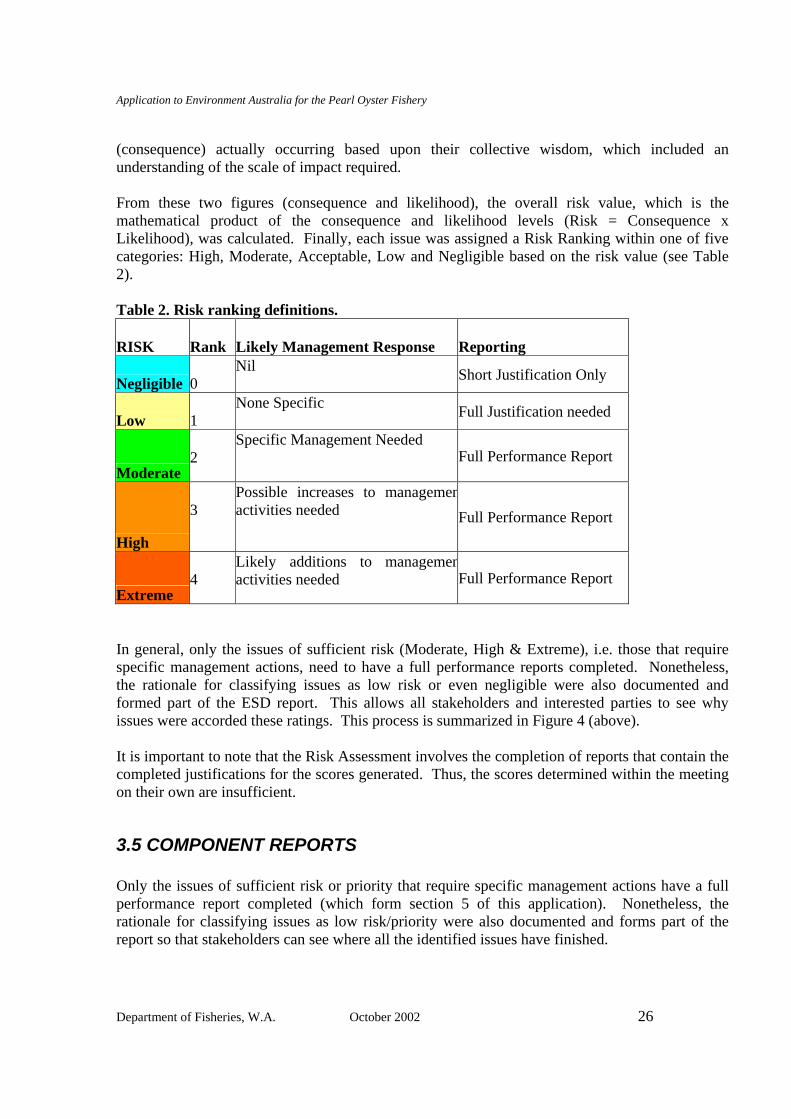
(consequence) actually occurring based upon their collective wisdom, which included an understanding of the scale of impact required. From these two figures (consequence and likelihood), the overall risk value, which is the mathematical product of the consequence and likelihood levels (Risk = Consequence x Likelihood), was calculated. Finally, each issue was assigned a Risk Ranking within one of five categories: High, Moderate, Acceptable, Low and Negligible based on the risk value (see Table 2). Table 2. Risk ranking definitions.
RISK Rank Likely Management Response Reporting
Negligible 0
Nil Short Justification Only
Low 1
None Specific Full Justification needed
Moderate
2
Specific Management Needed Full Performance Report
High
3
Possible increases to managemenactivities needed Full Performance Report
Extreme
4
Likely additions to managemenactivities needed Full Performance Report
In general, only the issues of sufficient risk (Moderate, High & Extreme), i.e. those that require specific management actions, need to have a full performance reports completed. Nonetheless, the rationale for classifying issues as low risk or even negligible were also documented and formed part of the ESD report. This allows all stakeholders and interested parties to see why issues were accorded these ratings. This process is summarized in Figure 4 (above). It is important to note that the Risk Assessment involves the completion of reports that contain the completed justifications for the scores generated. Thus, the scores determined within the meeting on their own are insufficient.
3.5 COMPONENT REPORTS Only the issues of sufficient risk or priority that require specific management actions have a full performance report completed (which form section 5 of this application). Nonetheless, the rationale for classifying issues as low risk/priority were also documented and forms part of the report so that stakeholders can see where all the identified issues have finished.
Application to Environment Australia for the Pearl Oyster Fishery
Department of Fisheries, W.A. October 2002 27
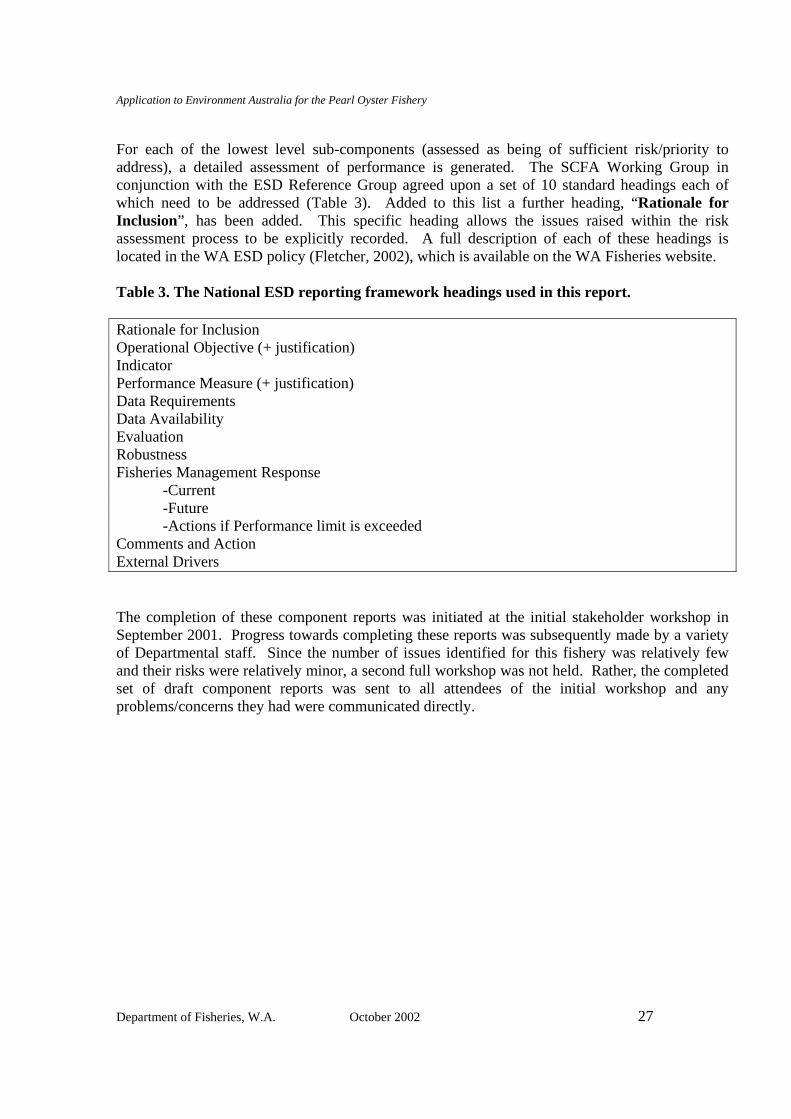
For each of the lowest level sub-components (assessed as being of sufficient risk/priority to address), a detailed assessment of performance is generated. The SCFA Working Group in conjunction with the ESD Reference Group agreed upon a set of 10 standard headings each of which need to be addressed (Table 3). Added to this list a further heading, “Rationale for Inclusion”, has been added. This specific heading allows the issues raised within the risk assessment process to be explicitly recorded. A full description of each of these headings is located in the WA ESD policy (Fletcher, 2002), which is available on the WA Fisheries website. Table 3. The National ESD reporting framework headings used in this report. Rationale for Inclusion Operational Objective (+ justification) Indicator Performance Measure (+ justification) Data Requirements Data Availability Evaluation Robustness Fisheries Management Response
-Current -Future -Actions if Performance limit is exceeded
Comments and Action External Drivers The completion of these component reports was initiated at the initial stakeholder workshop in September 2001. Progress towards completing these reports was subsequently made by a variety of Departmental staff. Since the number of issues identified for this fishery was relatively few and their risks were relatively minor, a second full workshop was not held. Rather, the completed set of draft component reports was sent to all attendees of the initial workshop and any problems/concerns they had were communicated directly.
Application to Environment Australia for the Pearl Oyster Fishery
Department of Fisheries, W.A. October 2002 28
4. ASSESSMENT OF THE PEARLING MANAGEMENT REGIME AGAINST THE COMMONWEALTH GUIDELINES FOR ASSESSING THE ECOLOGICALLY SUSTAINABLE MANAGEMENT OF FISHERIES
GENERAL REQUIREMENTS OF THE GUIDELINES The management arrangements must be: Documented, publicly available and transparent The provisions of the Pearling Act 1990, Pearling (General) Regulations 1991 and the Ministerial Policy Guidelines (MPG) govern the Pearl Oyster Fishery (Pinctada maxima). Interested parties can purchase copies of the Act and Regulations from the State Law Publisher. The legislation is also accessible through the Internet by accessing www.slp.wa.gov.au. The policies relating to the management of the fishery are contained in the Pearl Oyster Fishery Ministerial Policy Guideline No.17, which is regularly updated through a process involving input from industry, the peak industry body (Pearl Producers Association) and the PIAC. The Guidelines are distributed to all pearling licensees, the Pearl Producers Association (PPA) and PIAC members and copies are available free of charge from the Department of Fisheries upon request. The Guidelines are also posted on the Department of Fisheries web site www.fish.wa.gov.au/aqua/brodspecies/pearls/index. Once completed, the full ESD Report on the Pearl Oyster Fishery will be made publicly available via publication and electronically from the Departmental website. This will provide increased transparency through explicitly stating objectives, indicators, performance measures and management arrangements for each issue and how the fishery is currently performing against these criteria. Developed through a consultative process providing opportunity to all interested and affected parties, including the general public
The Pearling Act 1990 defines the requirement for procedures that must be undertaken before determining or amending all management arrangements. More specifically, the management arrangements for the Pearl Oyster fishery have been developed through formal consultation with the industry, PIAC and PPA. The ESD Report for the Pearl Oyster Fishery was developed through a consultative process that included a wide variety of stakeholders including members of the pearling industry, industry representative groups (i.e. PPA, Recfishwest), government (Departments of Fisheries, Conservation and Land Management and Environmental Protection), non-government
Application to Environment Australia for the Pearl Oyster Fishery
Department of Fisheries, W.A. October 2002 29
environment groups (Conservation Council of WA) and Environment Australia. Details of the methodology used to generate this report including how the issues were identified, how these issues were subjected to a risk assessment, and how the objectives, etc. were developed are described in the Department’s ESD Policy (Fletcher, 2002) Ensure that a range of expertise and community interests are involved in individual fishery management committees and during the stock assessment process.
The range of expertise and community interests that have been involved in the process of determining management and reviewing stock assessments is extensive. The groups that have been involved in the generation and review of the information contained in this application include:
• Department of Fisheries, WA; • Department of Environmental Protection, WA (DEP); • Environment Australia; • Pearl Producers Association (PPA); • International Risk Consultants; • Paspaley Pearling Company (PPC); • MG Kailis Group of Companies; • Conservation Council of WA; • Recfishwest; and • Department of Conservation and Land Management, WA (CALM).
Individuals from the organisations listed above were involved in identifying issues for the Pearl Oyster Fishery and then developing the risk ratings for each issue. All of these individuals either have a background or interest in the environment or pearling industry. The general consultation methods used for this fishery are summarised in the Governance Section 5.4. Be strategic, containing objectives and performance criteria by which the effectiveness of the management arrangements is measured.
The ESD Component Reports (see Section 5) contain the objectives, indicators and performance measures for measuring the effectiveness of the management arrangements for the Pearl Oyster Fishery. For the main components, the objectives, indicators and performance measures are well established and the data are available to demonstrate levels of performance over time. The justification for each of these is documented within each of the individual component reports within the ESD Reports in Section 5. Be capable of controlling the level of harvest in the fishery using input and/or output controls.
The Pearling Act 1990 provides the legislative ability to control the level of harvest within this fishery. This is achieved through the use of a sophisticated and effective combination of input control measures based upon limiting the number of licences allowed to operate in the fishery, setting of maximum and minimum size limits and quota limitations or total allowable catch.
Application to Environment Australia for the Pearl Oyster Fishery
Department of Fisheries, W.A. October 2002 30
Contain the means of enforcing critical aspects of the management arrangements. The Department of Fisheries ensures the legislative basis and employs a large number of operational staff to ensure compliance with the critical aspects of the management arrangements for the Pearl Oyster Fishery. Quotas are monitored through a combination of quota tags and a paper audit trail using catch, holding sites, transport, and seeding operations logbooks submitted by licensees to the agency. Patrols using diving inspections, aircraft, both large and small Departmental patrol vessels and industry boats are conducted to verify compliance with tagging and associated logbook systems. The production and translocation of hatchery-produced pearl oysters is monitored by the system of hatchery and transport logbooks combined with a system for disease testing, quarantine and health certificate clearances. Conversion of hatchery options to hatchery quota is monitored by a combination of operations logbooks, nursery and operations audits, and at-sea compliance presence during operations. Provide for the periodic review of the performance of the fishery management arrangements and the management strategies, objectives and criteria.
There is an annual review of the performance of the major aspects of the Pearl Oyster Fishery through the completion of the “State of the Fisheries” report (Fisheries WA, 2002). This is updated and published each year following review by the Office of the Auditor General (OAG). It forms an essential supplement to the Department’s Annual Report to the WA Parliament. The latest versions of both documents are located on the Departmental website www.fish.wa.gov.au.
The ESD Component Reports contain comprehensive performance evaluations of the Pearl Oyster Fishery based upon the framework described in the Fisheries ESD policy (Fletcher, 2002). This includes the development of objectives, indicators and performance measures for most aspects of this fishery and includes status reports for those components that are not subject to annual assessment. This full assessment, including an examination of the validity of the objectives and performance measures, will be completed and externally reviewed by other agencies (e.g. Environment Australia) every five years. The Department of Fisheries holds an annual public meeting in Broome to allow comments to be received from members of the community and to impart information to the community on the management and results Be capable of assessing, monitoring, and avoiding, remedying or mitigating any adverse impacts on the wider marine ecosystem in which the target species lives and the fishery operates.
Capabilities for the assessment, monitoring and avoidance, remedying or mitigating any adverse impacts on the wider marine ecosystem are documented in “General Environment” Section 5.3. This has been completed through a formal risk assessment analysis of the issues.
Application to Environment Australia for the Pearl Oyster Fishery
Department of Fisheries, W.A. October 2002 31
Require compliance with relevant threat abatement plans, the National Policy on Fisheries Bycatch, and bycatch action strategies developed under that policy. The methods used in this fishery with divers collecting pearl oysters directly from the bottom results in there being little to no contact with other species. Details on the interactions are provided within the non-retained species section of the report. There are no threatened species affected by this fishery and as a result, no Threat Abatement Plans or Bycatch Action Plans are required.
PRINCIPLE 1 OF THE COMMONWEALTH GUIDELINES
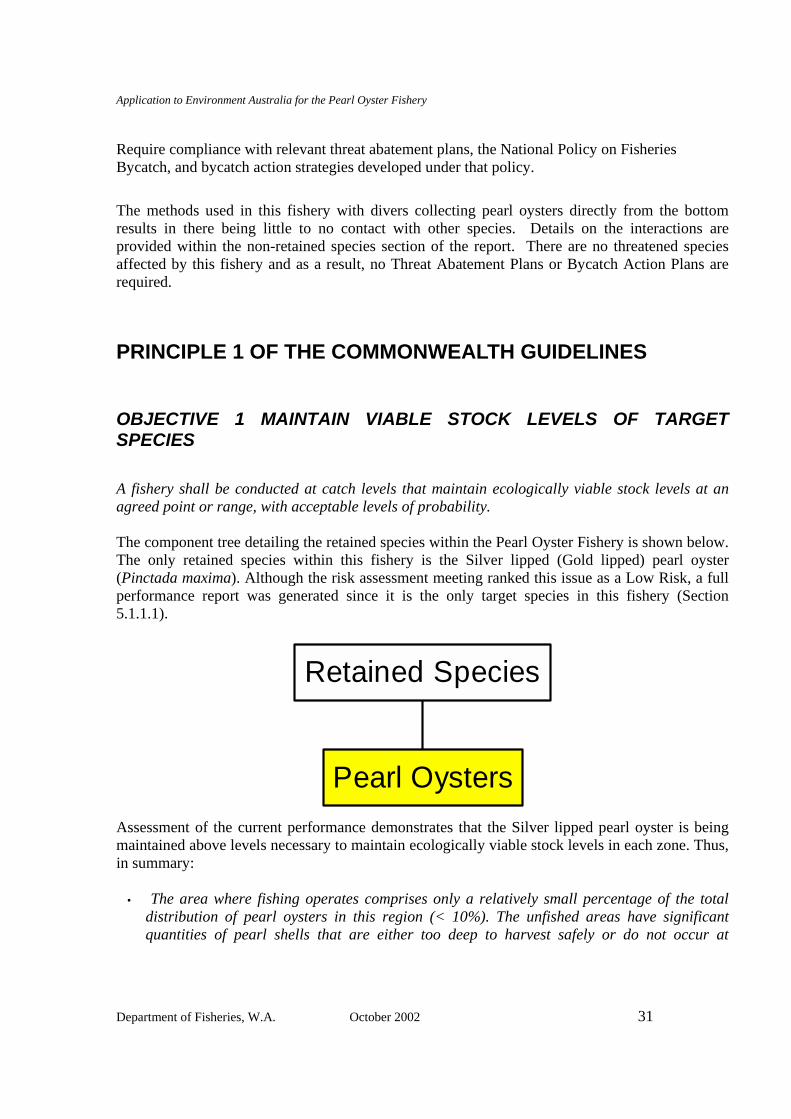
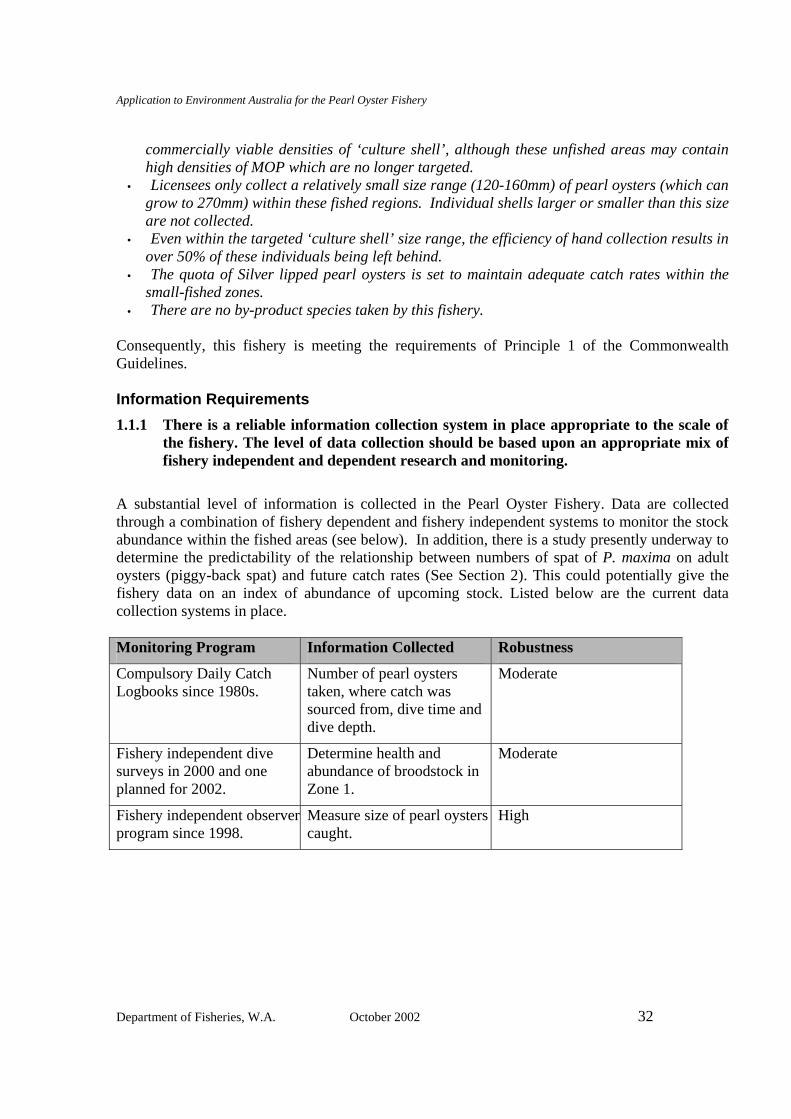
OBJECTIVE 1 MAINTAIN VIABLE STOCK LEVELS OF TARGET SPECIES A fishery shall be conducted at catch levels that maintain ecologically viable stock levels at an agreed point or range, with acceptable levels of probability. The component tree detailing the retained species within the Pearl Oyster Fishery is shown below. The only retained species within this fishery is the Silver lipped (Gold lipped) pearl oyster (Pinctada maxima). Although the risk assessment meeting ranked this issue as a Low Risk, a full performance report was generated since it is the only target species in this fishery (Section 5.1.1.1).
Pearl Oysters
Retained Species
Assessment of the current performance demonstrates that the Silver lipped pearl oyster is being maintained above levels necessary to maintain ecologically viable stock levels in each zone. Thus, in summary:
• The area where fishing operates comprises only a relatively small percentage of the total distribution of pearl oysters in this region (< 10%). The unfished areas have significant quantities of pearl shells that are either too deep to harvest safely or do not occur at
Application to Environment Australia for the Pearl Oyster Fishery
Department of Fisheries, W.A. October 2002 32
commercially viable densities of ‘culture shell’, although these unfished areas may contain high densities of MOP which are no longer targeted.
• Licensees only collect a relatively small size range (120-160mm) of pearl oysters (which can grow to 270mm) within these fished regions. Individual shells larger or smaller than this size are not collected.
• Even within the targeted ‘culture shell’ size range, the efficiency of hand collection results in over 50% of these individuals being left behind.
• The quota of Silver lipped pearl oysters is set to maintain adequate catch rates within the small-fished zones.
• There are no by-product species taken by this fishery. Consequently, this fishery is meeting the requirements of Principle 1 of the Commonwealth Guidelines. Information Requirements 1.1.1 There is a reliable information collection system in place appropriate to the scale of
the fishery. The level of data collection should be based upon an appropriate mix of fishery independent and dependent research and monitoring.
A substantial level of information is collected in the Pearl Oyster Fishery. Data are collected through a combination of fishery dependent and fishery independent systems to monitor the stock abundance within the fished areas (see below). In addition, there is a study presently underway to determine the predictability of the relationship between numbers of spat of P. maxima on adult oysters (piggy-back spat) and future catch rates (See Section 2). This could potentially give the fishery data on an index of abundance of upcoming stock. Listed below are the current data collection systems in place. Monitoring Program Information Collected Robustness
Compulsory Daily Catch Logbooks since 1980s.
Number of pearl oysters taken, where catch was sourced from, dive time and dive depth.
Moderate
Fishery independent dive surveys in 2000 and one planned for 2002.
Determine health and abundance of broodstock in Zone 1.
Moderate
Fishery independent observer program since 1998.
Measure size of pearl oysters caught.
High
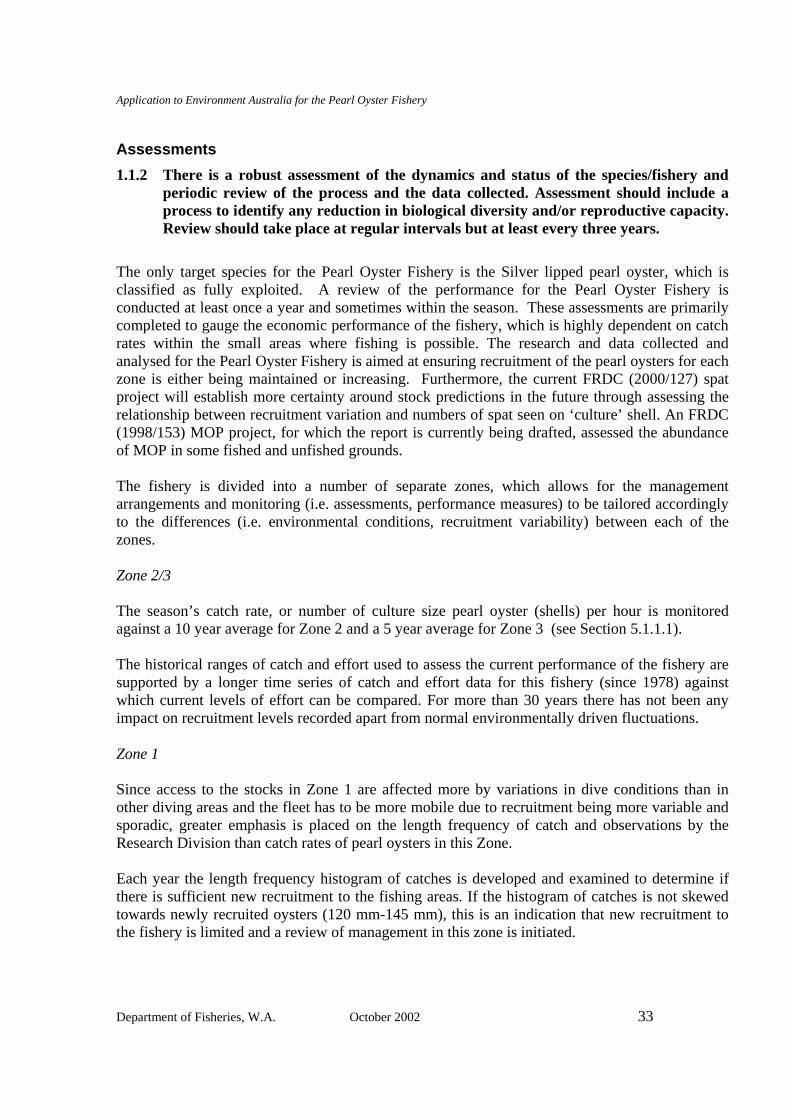
Application to Environment Australia for the Pearl Oyster Fishery
Department of Fisheries, W.A. October 2002 33
Assessments 1.1.2 There is a robust assessment of the dynamics and status of the species/fishery and
periodic review of the process and the data collected. Assessment should include a process to identify any reduction in biological diversity and/or reproductive capacity. Review should take place at regular intervals but at least every three years.
The only target species for the Pearl Oyster Fishery is the Silver lipped pearl oyster, which is classified as fully exploited. A review of the performance for the Pearl Oyster Fishery is conducted at least once a year and sometimes within the season. These assessments are primarily completed to gauge the economic performance of the fishery, which is highly dependent on catch rates within the small areas where fishing is possible. The research and data collected and analysed for the Pearl Oyster Fishery is aimed at ensuring recruitment of the pearl oysters for each zone is either being maintained or increasing. Furthermore, the current FRDC (2000/127) spat project will establish more certainty around stock predictions in the future through assessing the relationship between recruitment variation and numbers of spat seen on ‘culture’ shell. An FRDC (1998/153) MOP project, for which the report is currently being drafted, assessed the abundance of MOP in some fished and unfished grounds. The fishery is divided into a number of separate zones, which allows for the management arrangements and monitoring (i.e. assessments, performance measures) to be tailored accordingly to the differences (i.e. environmental conditions, recruitment variability) between each of the zones. Zone 2/3 The season’s catch rate, or number of culture size pearl oyster (shells) per hour is monitored against a 10 year average for Zone 2 and a 5 year average for Zone 3 (see Section 5.1.1.1). The historical ranges of catch and effort used to assess the current performance of the fishery are supported by a longer time series of catch and effort data for this fishery (since 1978) against which current levels of effort can be compared. For more than 30 years there has not been any impact on recruitment levels recorded apart from normal environmentally driven fluctuations. Zone 1 Since access to the stocks in Zone 1 are affected more by variations in dive conditions than in other diving areas and the fleet has to be more mobile due to recruitment being more variable and sporadic, greater emphasis is placed on the length frequency of catch and observations by the Research Division than catch rates of pearl oysters in this Zone. Each year the length frequency histogram of catches is developed and examined to determine if there is sufficient new recruitment to the fishing areas. If the histogram of catches is not skewed towards newly recruited oysters (120 mm-145 mm), this is an indication that new recruitment to the fishery is limited and a review of management in this zone is initiated.
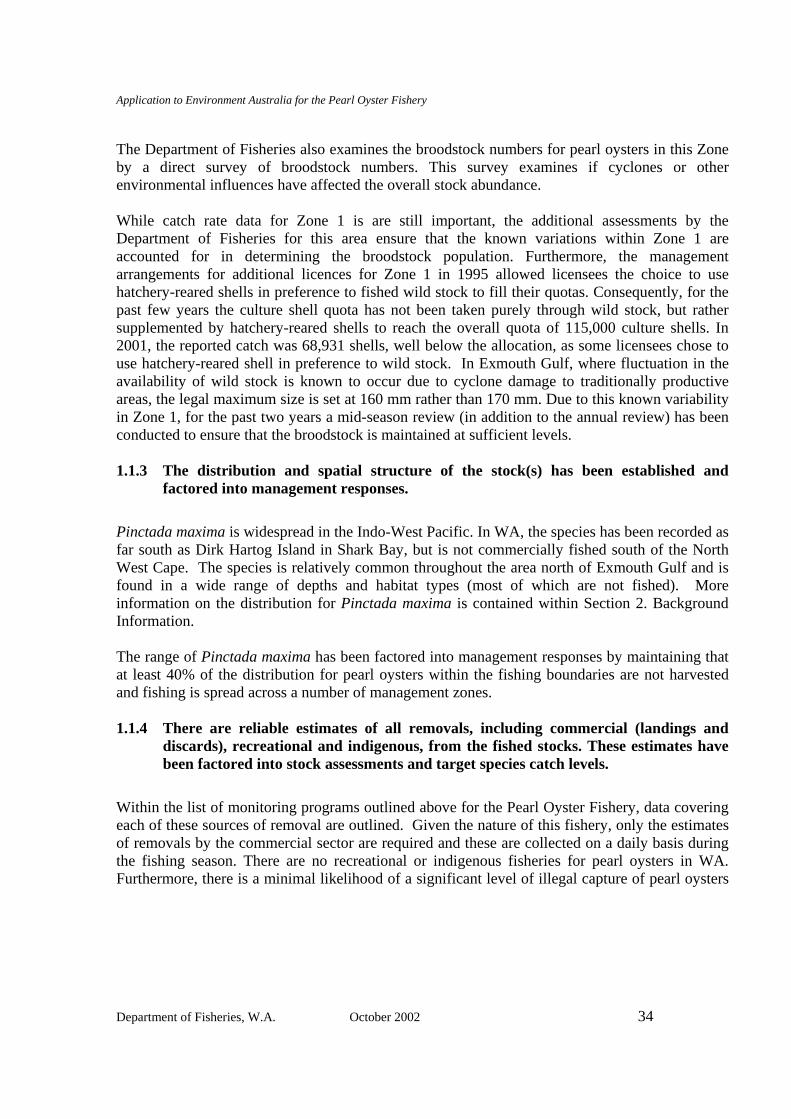
Application to Environment Australia for the Pearl Oyster Fishery
Department of Fisheries, W.A. October 2002 34
The Department of Fisheries also examines the broodstock numbers for pearl oysters in this Zone by a direct survey of broodstock numbers. This survey examines if cyclones or other environmental influences have affected the overall stock abundance. While catch rate data for Zone 1 is are still important, the additional assessments by the Department of Fisheries for this area ensure that the known variations within Zone 1 are accounted for in determining the broodstock population. Furthermore, the management arrangements for additional licences for Zone 1 in 1995 allowed licensees the choice to use hatchery-reared shells in preference to fished wild stock to fill their quotas. Consequently, for the past few years the culture shell quota has not been taken purely through wild stock, but rather supplemented by hatchery-reared shells to reach the overall quota of 115,000 culture shells. In 2001, the reported catch was 68,931 shells, well below the allocation, as some licensees chose to use hatchery-reared shell in preference to wild stock. In Exmouth Gulf, where fluctuation in the availability of wild stock is known to occur due to cyclone damage to traditionally productive areas, the legal maximum size is set at 160 mm rather than 170 mm. Due to this known variability in Zone 1, for the past two years a mid-season review (in addition to the annual review) has been conducted to ensure that the broodstock is maintained at sufficient levels. 1.1.3 The distribution and spatial structure of the stock(s) has been established and
factored into management responses.
Pinctada maxima is widespread in the Indo-West Pacific. In WA, the species has been recorded as far south as Dirk Hartog Island in Shark Bay, but is not commercially fished south of the North West Cape. The species is relatively common throughout the area north of Exmouth Gulf and is found in a wide range of depths and habitat types (most of which are not fished). More information on the distribution for Pinctada maxima is contained within Section 2. Background Information. The range of Pinctada maxima has been factored into management responses by maintaining that at least 40% of the distribution for pearl oysters within the fishing boundaries are not harvested and fishing is spread across a number of management zones. 1.1.4 There are reliable estimates of all removals, including commercial (landings and
discards), recreational and indigenous, from the fished stocks. These estimates have been factored into stock assessments and target species catch levels.
Within the list of monitoring programs outlined above for the Pearl Oyster Fishery, data covering each of these sources of removal are outlined. Given the nature of this fishery, only the estimates of removals by the commercial sector are required and these are collected on a daily basis during the fishing season. There are no recreational or indigenous fisheries for pearl oysters in WA. Furthermore, there is a minimal likelihood of a significant level of illegal capture of pearl oysters
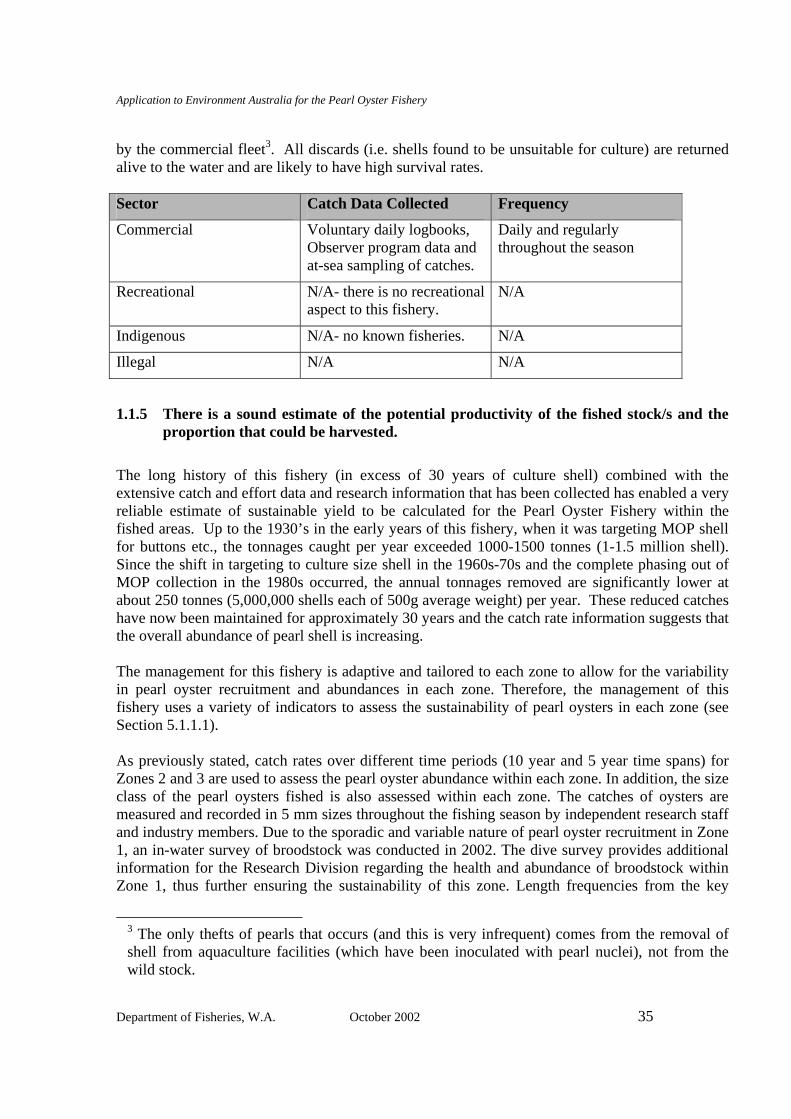
Application to Environment Australia for the Pearl Oyster Fishery
Department of Fisheries, W.A. October 2002 35
by the commercial fleet3. All discards (i.e. shells found to be unsuitable for culture) are returned alive to the water and are likely to have high survival rates. Sector Catch Data Collected Frequency
Commercial Voluntary daily logbooks, Observer program data and at-sea sampling of catches.
Daily and regularly throughout the season
Recreational N/A- there is no recreational aspect to this fishery.
N/A
Indigenous N/A- no known fisheries. N/A
Illegal N/A N/A
1.1.5 There is a sound estimate of the potential productivity of the fished stock/s and the proportion that could be harvested.
The long history of this fishery (in excess of 30 years of culture shell) combined with the extensive catch and effort data and research information that has been collected has enabled a very reliable estimate of sustainable yield to be calculated for the Pearl Oyster Fishery within the fished areas. Up to the 1930’s in the early years of this fishery, when it was targeting MOP shell for buttons etc., the tonnages caught per year exceeded 1000-1500 tonnes (1-1.5 million shell). Since the shift in targeting to culture size shell in the 1960s-70s and the complete phasing out of MOP collection in the 1980s occurred, the annual tonnages removed are significantly lower at about 250 tonnes (5,000,000 shells each of 500g average weight) per year. These reduced catches have now been maintained for approximately 30 years and the catch rate information suggests that the overall abundance of pearl shell is increasing. The management for this fishery is adaptive and tailored to each zone to allow for the variability in pearl oyster recruitment and abundances in each zone. Therefore, the management of this fishery uses a variety of indicators to assess the sustainability of pearl oysters in each zone (see Section 5.1.1.1). As previously stated, catch rates over different time periods (10 year and 5 year time spans) for Zones 2 and 3 are used to assess the pearl oyster abundance within each zone. In addition, the size class of the pearl oysters fished is also assessed within each zone. The catches of oysters are measured and recorded in 5 mm sizes throughout the fishing season by independent research staff and industry members. Due to the sporadic and variable nature of pearl oyster recruitment in Zone 1, an in-water survey of broodstock was conducted in 2002. The dive survey provides additional information for the Research Division regarding the health and abundance of broodstock within Zone 1, thus further ensuring the sustainability of this zone. Length frequencies from the key
3 The only thefts of pearls that occurs (and this is very infrequent) comes from the removal of shell from aquaculture facilities (which have been inoculated with pearl nuclei), not from the wild stock.
Application to Environment Australia for the Pearl Oyster Fishery
Department of Fisheries, W.A. October 2002 36
areas fished have been collected since 1998 to identify presence of favoured small culture shell (120-145 mm) in catches.
The current FRDC project 1998/153 will provide the data on the relative abundance of MOP in some areas that are not currently subject to fishing to provide a greater level of precision for estimates of the relative abundance of pearl oysters in this region. This combined with the known distribution of pearl oysters will be used to generate a more precise estimate of the relative area fished as well as the overall abundance and locations of pearl oysters within the fishing area. Management Responses
1.1.6 There are reference points (target and/or limit) that trigger management actions including a biological bottom line and/or a catch or effort upper limit beyond which the stock should not be taken.
Distribution of Fishing Fishing for pearl oysters currently occurs in less than 10% of the distribution of the species within this region. It is known that there are significant numbers of pearl shell in many of the areas not currently targeted by the fishery. These include regions, which had previously provided relatively high percentages of MOP (which are no longer collected) and the deeper and more inaccessible regions. A component of a recent FRDC project (1998/153) determined the catch rates of MOP in regions that were either currently fished or not fished. Similar catch rates of MOP were found among fished and non-fished regions in both the Lacepedes region and the 80-mile Beach region of Zone 3. A performance measure based on normal population dynamics experiences of harvested stocks suggests that a very precautionary limit would be where at least 40% of the distribution of a species is not harvested at all. While most of the suitable areas for fishing for pearl oysters within each zone are logged in the vessels with GPS, new areas are explored and fished each year since quantities and ability to access areas vary from year to year. Thus the fishery is currently at a substantial distance from triggering even this precautionary limit. Catch Rates Zone 2 and 3 The limit reference point for Zone 2 has been determined as a 50% decrease in catch rates from the historical average of 29.5 shells/hr. The limit reference point in Zone 3 is a decrease of 50% in catch rates from the historical average of 34.8 shells/hr. A decline in catch rate does not suggest unsustainable fishing levels, but rather it indicates that fishing operations are nearing uneconomic levels.
Application to Environment Australia for the Pearl Oyster Fishery
Department of Fisheries, W.A. October 2002 37
Zone 1 The combination of catch rates, shell sizes and surveys is used to determine the quota in Zone 1 (see Section 5.1.1.1). The acceptable range of hours to take the quota in this zone is 3,328-6,023 dive hours. 1.1.7 There are management strategies in place capable of controlling the level of take.
A full description of the management arrangements is located in the attached Pearling Act 1990. A full discussion of the main regulations and their justifications are located in Section 2. The following is a summary of the management arrangements for all Zones in the Pearl Oyster fishery: The fishery is managed through input controls (number of licenses capped at 16), fishing zones and output controls (quotas/TACs, minimum legal size limit, zonal management). For each annual fishing season there is a quota. The catch and effort data are assessed on an annual basis against the historical averages to determine if the relative abundance in the fished areas is being maintained at acceptable levels. Closures and quota limitations can be made mid-season by the Department of Fisheries or at the request of licensees to account for exceptional events such as cyclones and inclement weather. Compliance policing monitors both pearl oyster fishers and farms. Any significant declines or increases in the level of incoming recruitment from environmental effects are observed by the changes in catch rates and size frequency of ‘culture shell’. In the future the relative numbers of piggy-back spat may be used to supplement this data, if the research shows this to be a reliable indicator of recruitment. Interventions are generally made by changes to the quota value. The performance of the fishery is reviewed annually by the ministerial advisory committee, PIAC, taking into account information gathered from meetings involving industry and fisheries staff being held throughout the season to discuss current catch rates, locations of fishing and size structures of the catch. Significant effort is put into ensuring adequate compliance with these regulations. Quotas are monitored through a combination of quota tags and a paper audit trail using catch, fishing holding sites, transport and seeding operations logbooks submitted by licensees to the Department. In addition, patrols are used to verify compliance with tagging and associated logbook systems, using diving inspections, aircraft, patrol vessels and industry boats. 1.1.8 Fishing is conducted in a manner that does not threaten stocks of by-product species.
There is no by-product species taken in this fishery.
Application to Environment Australia for the Pearl Oyster Fishery
Department of Fisheries, W.A. October 2002 38
1.1.9 The management response, considering uncertainties in the assessment and precautionary management actions, has a high chance of achieving the objective.
The overall management is very precautionary with a high degree of industry participation, acceptance and support. The management approach taken within this fishery has been in progress for more than 30 years and has been extremely effective resulting in a very high probability that it will continue to achieve the main objective of maintaining the spawning stocks of the pearl oyster. As previously mentioned in the above sections (1.1.1-1.1.8), the Department of Fisheries monitors the recruitment and stocks of pearl oysters within the fishing grounds annually by assessing and analysing the distribution of fishing, catch rates, shell sizes and surveys against agreed indicators. The management responses that are currently in place for the Pearl Oyster Fishery are very detailed, both for current actions, future actions and if the performance limits are reached/approached (see Section 5.1.1.1). This fishery is managed on a real time basis, including the use of quotas, minimum legal size, maximum legal size in Exmouth Gulf and daily catch rates of the fleet. The use of limit reference catch rates for pearl oysters provides a mechanism for protecting on-going recruitment of culture shell into the fishery each year within the fished areas.
Strategies to offer further protection of the breeding stock for pearl oysters and exploitable stocks within the fished areas, if required, would include:
• Reduce TAC, either for the following season or mid-season (in exceptional circumstances).
• Additional closures (within Zone limits set). • Place a maximum shell size limit at a level less than the current ‘de-facto’ maximum size
limit to reduce the gauntlet size ranges.
OBJECTIVE 2 RECOVERY OF STOCKS Where the fished stocks are below a defined reference point, the fishery will be managed to promote recovery to ecologically viable stock levels within nominated timeframes. There are no stocks within the Pearl Oyster Fishery that are currently below defined reference points/limits.
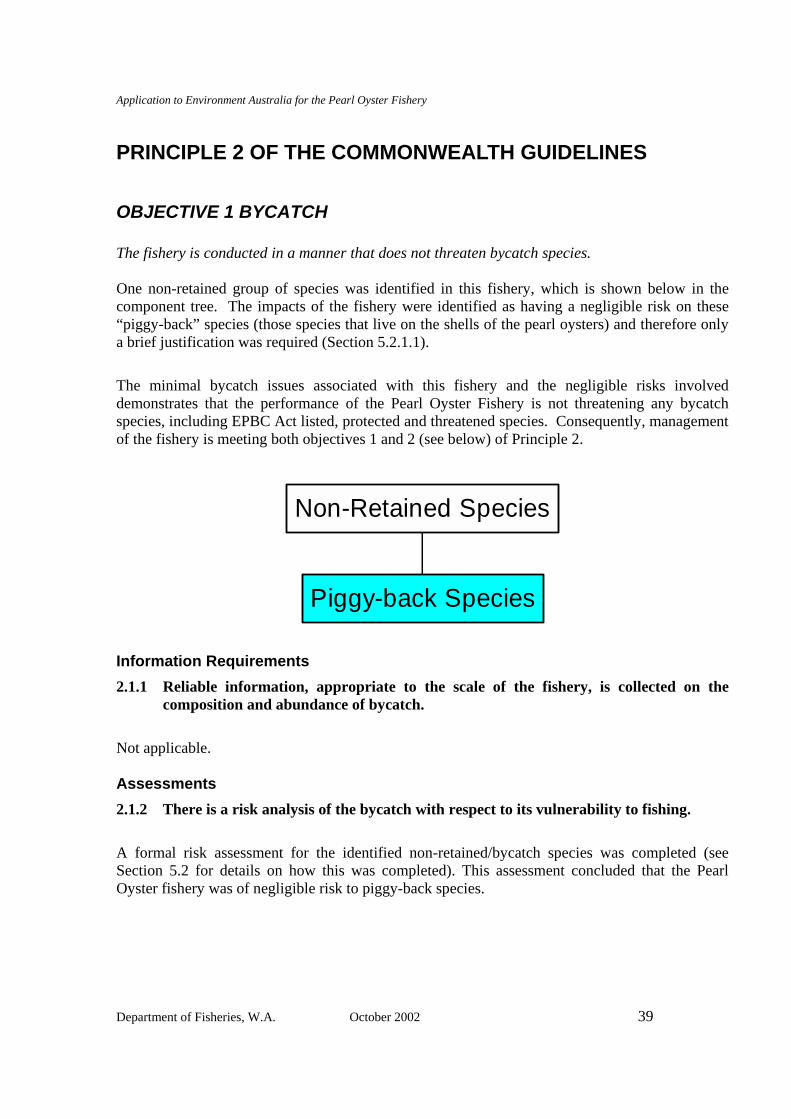
Application to Environment Australia for the Pearl Oyster Fishery
Department of Fisheries, W.A. October 2002 39
PRINCIPLE 2 OF THE COMMONWEALTH GUIDELINES
OBJECTIVE 1 BYCATCH The fishery is conducted in a manner that does not threaten bycatch species. One non-retained group of species was identified in this fishery, which is shown below in the component tree. The impacts of the fishery were identified as having a negligible risk on these “piggy-back” species (those species that live on the shells of the pearl oysters) and therefore only a brief justification was required (Section 5.2.1.1).
The minimal bycatch issues associated with this fishery and the negligible risks involved demonstrates that the performance of the Pearl Oyster Fishery is not threatening any bycatch species, including EPBC Act listed, protected and threatened species. Consequently, management of the fishery is meeting both objectives 1 and 2 (see below) of Principle 2.
Piggy-back Species
Non-Retained Species
Information Requirements 2.1.1 Reliable information, appropriate to the scale of the fishery, is collected on the
composition and abundance of bycatch.
Not applicable. Assessments 2.1.2 There is a risk analysis of the bycatch with respect to its vulnerability to fishing.
A formal risk assessment for the identified non-retained/bycatch species was completed (see Section 5.2 for details on how this was completed). This assessment concluded that the Pearl Oyster fishery was of negligible risk to piggy-back species.
Application to Environment Australia for the Pearl Oyster Fishery
Department of Fisheries, W.A. October 2002 40
Piggy-back Species – Summary
ERA Risk Rating (C0 L1 NEGLIGIBLE) Since the shell of the pearl oysters is encrusted with fouling commensal organisms including other small invertebrates, which use the shell as substrate, these organisms are harvested together with the pearl oyster. The organisms are then either scraped off or discarded and most likely do not survive this experience. It is likely that these species do not use the pearl oysters shell exclusively as a substratum. Furthermore, the fishing practices and management ensure that small and large pearl oysters are not commercially fished which allows for a large percentage of the oyster population remaining and available to provide habitat for sessile invertebrates (See Section 5.2.1.1 for more information). Management Responses 2.1.3 Measures are in place to avoid capture and mortality of bycatch species unless it is
determined that the level of catch is sustainable (except in relation to endangered, threatened or protected species). Steps must be taken to develop suitable technology if none is available.
The take of piggy-back species was identified as a negligible risk and thus does not require management responses. 2.1.4 An indicator group of bycatch species is monitored.
Not applicable. 2.1.5 There are decision rules that trigger additional management measures when there
are significant perturbations in the indicator species numbers.
Not applicable. 2.1.6 The management response, considering uncertainties in the assessment and
precautionary management actions, has a high chance of achieving the objective.
Not applicable.
Application to Environment Australia for the Pearl Oyster Fishery
Department of Fisheries, W.A. October 2002 41
OBJECTIVE 2 PROTECTED, THREATENED AND ENDANGERED SPECIES The fishery is conducted in a manner that avoids mortality of, or injuries to, endangered, threatened, or protected species and avoids or minimises impacts on threatened ecological communities. Information Requirements 2.2.1 Reliable information is collected on the interaction with endangered, threatened or
protected species and threatened ecological communities.
Due to the selective fishing method used in this fishery, no interaction with endangered, threatened or protected species including listed migratory species and threatened ecological communities were identified. 2.2.2 There is an assessment of the impact of the fishery on endangered, threatened or
protected species.
Not applicable. 2.2.3 There is an assessment of the impact of the fishery on threatened ecological
communities.
Not applicable. Management Responses 2.2.4 There are measures in place to avoid capture and/or mortality of endangered,
threatened or protected species.
Not applicable. 2.2.5 There are measures in place to avoid impact on threatened ecological communities.
Not applicable. 2.2.6 The management response, considering uncertainties in the assessment and
precautionary management actions, has a high chance of achieving the objective. Not applicable.
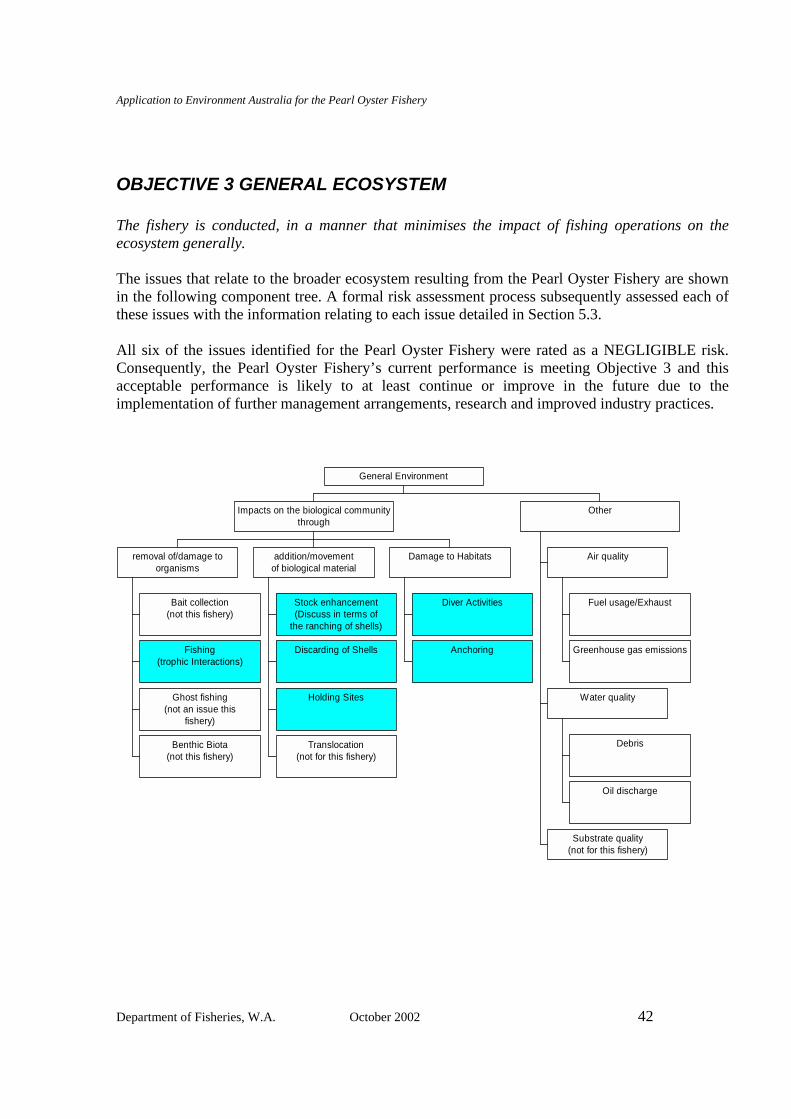
Application to Environment Australia for the Pearl Oyster Fishery
Department of Fisheries, W.A. October 2002 42
OBJECTIVE 3 GENERAL ECOSYSTEM The fishery is conducted, in a manner that minimises the impact of fishing operations on the ecosystem generally. The issues that relate to the broader ecosystem resulting from the Pearl Oyster Fishery are shown in the following component tree. A formal risk assessment process subsequently assessed each of these issues with the information relating to each issue detailed in Section 5.3. All six of the issues identified for the Pearl Oyster Fishery were rated as a NEGLIGIBLE risk. Consequently, the Pearl Oyster Fishery’s current performance is meeting Objective 3 and this acceptable performance is likely to at least continue or improve in the future due to the implementation of further management arrangements, research and improved industry practices.
Bait collection(not this fishery)
Fishing(trophic Interactions)
Ghost fishing(not an issue this
fishery)
Benthic Biota(not this fishery)
removal of/damage toorganisms
Stock enhancement(Discuss in terms of
the ranching of shells)
Discarding of Shells
Holding Sites
Translocation(not for this fishery)
addition/movementof biological material
Diver Activities
Anchoring
Damage to Habitats
Impacts on the biological communitythrough
Fuel usage/Exhaust
Greenhouse gas emissions
Air quality
Debris
Oil discharge
Water quality
Substrate quality(not for this fishery)
Other
General Environment
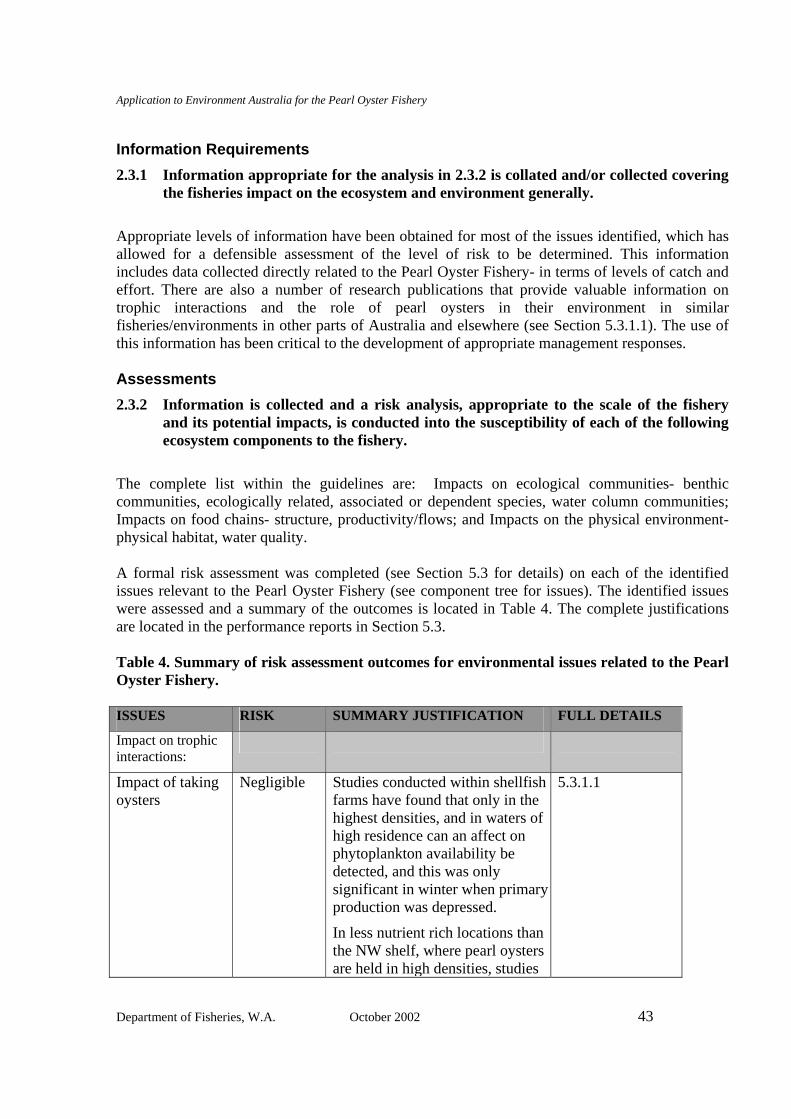
Application to Environment Australia for the Pearl Oyster Fishery
Department of Fisheries, W.A. October 2002 43
Information Requirements 2.3.1 Information appropriate for the analysis in 2.3.2 is collated and/or collected covering
the fisheries impact on the ecosystem and environment generally. Appropriate levels of information have been obtained for most of the issues identified, which has allowed for a defensible assessment of the level of risk to be determined. This information includes data collected directly related to the Pearl Oyster Fishery- in terms of levels of catch and effort. There are also a number of research publications that provide valuable information on trophic interactions and the role of pearl oysters in their environment in similar fisheries/environments in other parts of Australia and elsewhere (see Section 5.3.1.1). The use of this information has been critical to the development of appropriate management responses. Assessments 2.3.2 Information is collected and a risk analysis, appropriate to the scale of the fishery
and its potential impacts, is conducted into the susceptibility of each of the following ecosystem components to the fishery.
The complete list within the guidelines are: Impacts on ecological communities- benthic communities, ecologically related, associated or dependent species, water column communities; Impacts on food chains- structure, productivity/flows; and Impacts on the physical environment- physical habitat, water quality.
A formal risk assessment was completed (see Section 5.3 for details) on each of the identified issues relevant to the Pearl Oyster Fishery (see component tree for issues). The identified issues were assessed and a summary of the outcomes is located in Table 4. The complete justifications are located in the performance reports in Section 5.3. Table 4. Summary of risk assessment outcomes for environmental issues related to the Pearl Oyster Fishery. ISSUES RISK SUMMARY JUSTIFICATION FULL DETAILS
Impact on trophic interactions:
Impact of taking oysters
Negligible Studies conducted within shellfish farms have found that only in the highest densities, and in waters of high residence can an affect on phytoplankton availability be detected, and this was only significant in winter when primary production was depressed.
In less nutrient rich locations than the NW shelf, where pearl oysters are held in high densities, studies
5.3.1.1
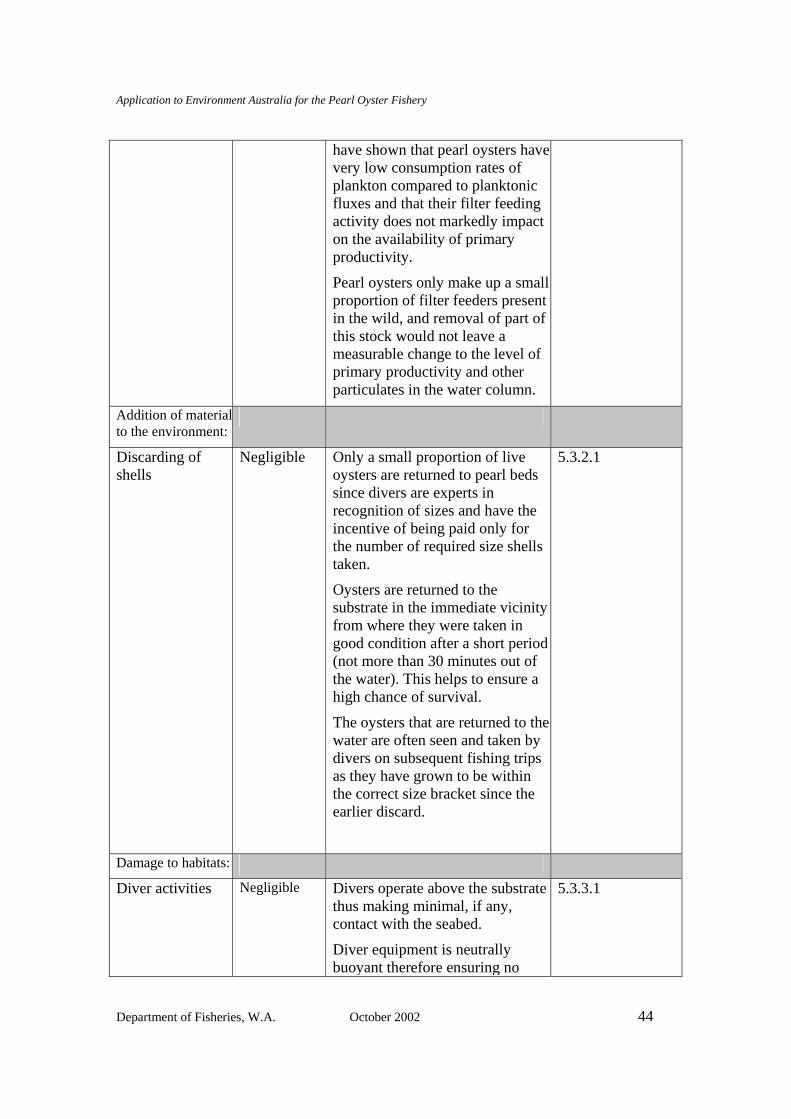
Application to Environment Australia for the Pearl Oyster Fishery
Department of Fisheries, W.A. October 2002 44
have shown that pearl oysters have very low consumption rates of plankton compared to planktonic fluxes and that their filter feeding activity does not markedly impact on the availability of primary productivity.
Pearl oysters only make up a small proportion of filter feeders present in the wild, and removal of part of this stock would not leave a measurable change to the level of primary productivity and other particulates in the water column.
Addition of materialto the environment:
Discarding of shells
Negligible Only a small proportion of live oysters are returned to pearl beds since divers are experts in recognition of sizes and have the incentive of being paid only for the number of required size shells taken.
Oysters are returned to the substrate in the immediate vicinity from where they were taken in good condition after a short period (not more than 30 minutes out of the water). This helps to ensure a high chance of survival.
The oysters that are returned to the water are often seen and taken by divers on subsequent fishing trips as they have grown to be within the correct size bracket since the earlier discard.
5.3.2.1
Damage to habitats:
Diver activities Negligible Divers operate above the substrate thus making minimal, if any, contact with the seabed.
Diver equipment is neutrally buoyant therefore ensuring no
5.3.3.1
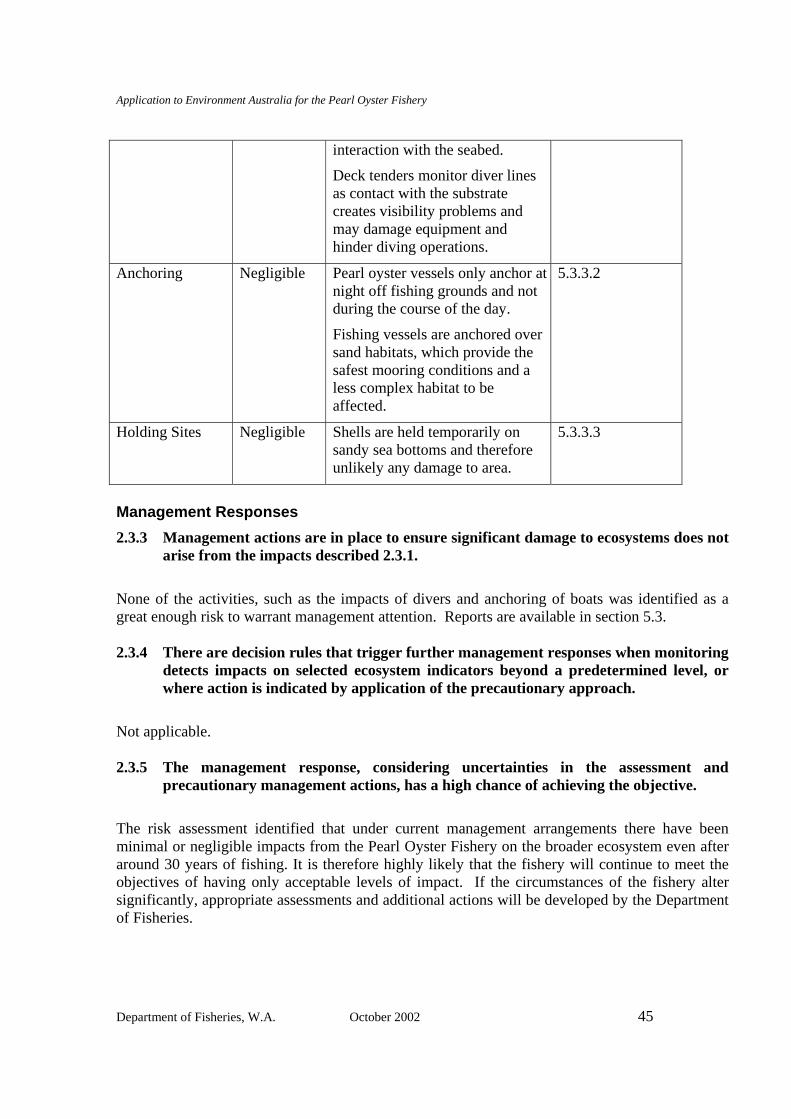
Application to Environment Australia for the Pearl Oyster Fishery
Department of Fisheries, W.A. October 2002 45
interaction with the seabed.
Deck tenders monitor diver lines as contact with the substrate creates visibility problems and may damage equipment and hinder diving operations.
Anchoring Negligible Pearl oyster vessels only anchor at night off fishing grounds and not during the course of the day.
Fishing vessels are anchored over sand habitats, which provide the safest mooring conditions and a less complex habitat to be affected.
5.3.3.2
Holding Sites Negligible Shells are held temporarily on sandy sea bottoms and therefore unlikely any damage to area.
5.3.3.3
Management Responses 2.3.3 Management actions are in place to ensure significant damage to ecosystems does not
arise from the impacts described 2.3.1.
None of the activities, such as the impacts of divers and anchoring of boats was identified as a great enough risk to warrant management attention. Reports are available in section 5.3. 2.3.4 There are decision rules that trigger further management responses when monitoring
detects impacts on selected ecosystem indicators beyond a predetermined level, or where action is indicated by application of the precautionary approach.
Not applicable. 2.3.5 The management response, considering uncertainties in the assessment and
precautionary management actions, has a high chance of achieving the objective. The risk assessment identified that under current management arrangements there have been minimal or negligible impacts from the Pearl Oyster Fishery on the broader ecosystem even after around 30 years of fishing. It is therefore highly likely that the fishery will continue to meet the objectives of having only acceptable levels of impact. If the circumstances of the fishery alter significantly, appropriate assessments and additional actions will be developed by the Department of Fisheries.
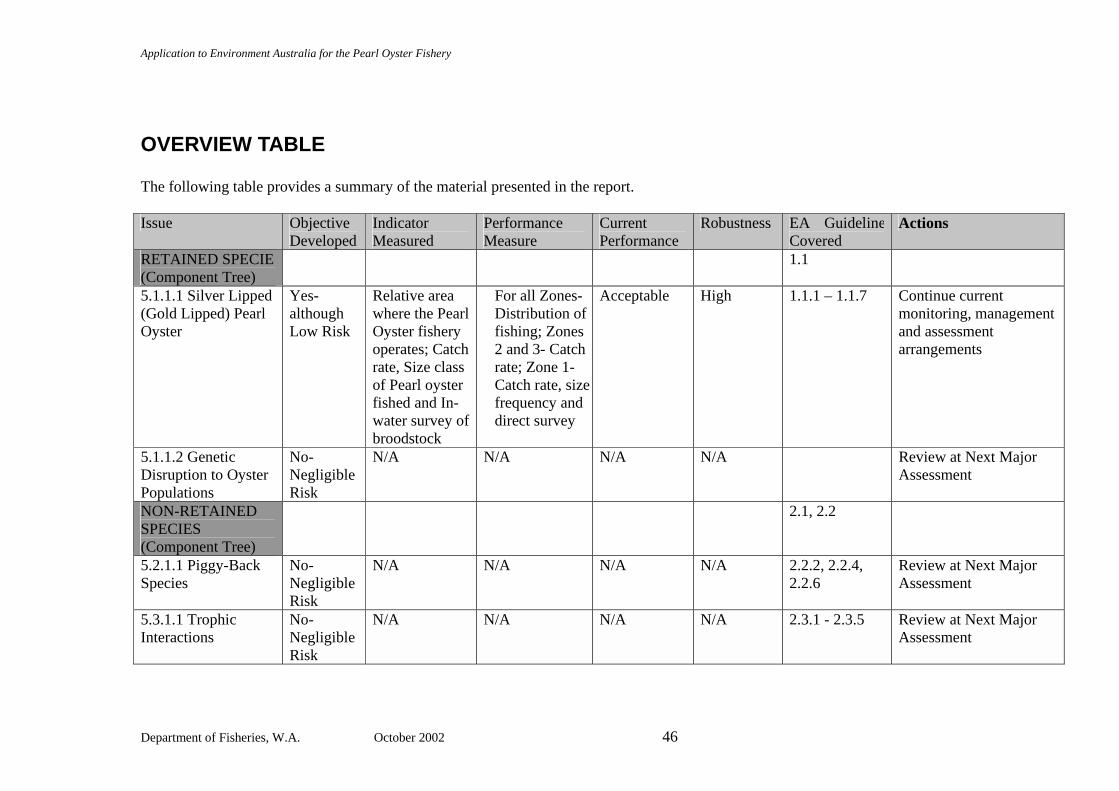
Application to Environment Australia for the Pearl Oyster Fishery
Department of Fisheries, W.A. October 2002 46
OVERVIEW TABLE The following table provides a summary of the material presented in the report. Issue Objective
Developed Indicator Measured
Performance Measure
Current Performance
Robustness EA GuidelinesCovered
Actions
RETAINED SPECIES(Component Tree)
1.1
5.1.1.1 Silver Lipped (Gold Lipped) Pearl Oyster
Yes- although Low Risk
Relative area where the Pearl Oyster fishery operates; Catch rate, Size class of Pearl oyster fished and In-water survey of broodstock
For all Zones- Distribution of fishing; Zones 2 and 3- Catch rate; Zone 1- Catch rate, size frequency and direct survey
Acceptable High 1.1.1 – 1.1.7 Continue current monitoring, management and assessment arrangements
5.1.1.2 Genetic Disruption to Oyster Populations
No- Negligible Risk
N/A N/A N/A N/A Review at Next Major Assessment
NON-RETAINED SPECIES (Component Tree)
2.1, 2.2
5.2.1.1 Piggy-Back Species
No- Negligible Risk
N/A N/A N/A N/A 2.2.2, 2.2.4, 2.2.6
Review at Next Major Assessment
5.3.1.1 Trophic Interactions
No- Negligible Risk
N/A N/A N/A N/A 2.3.1 - 2.3.5 Review at Next Major Assessment
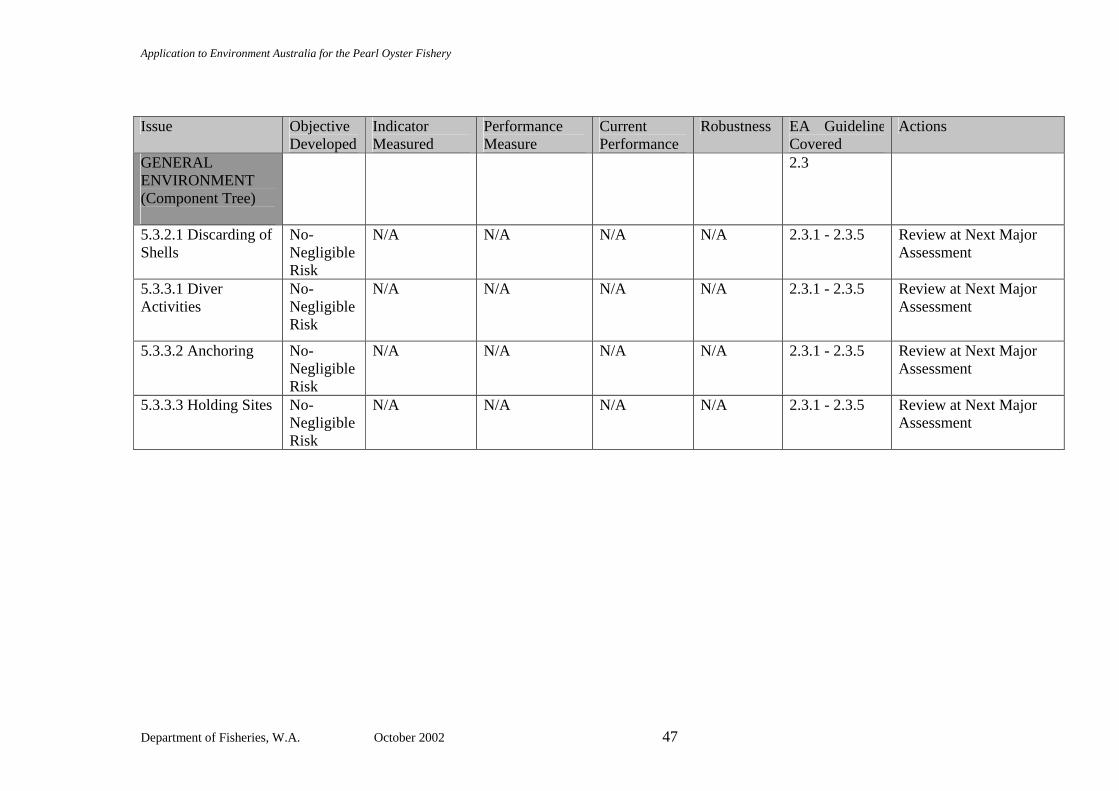
Application to Environment Australia for the Pearl Oyster Fishery
Department of Fisheries, W.A. October 2002 47
Issue Objective Developed
Indicator Measured
Performance Measure
Current Performance
Robustness EA GuidelinesCovered
Actions
GENERAL ENVIRONMENT (Component Tree)
2.3
5.3.2.1 Discarding of Shells
No- Negligible Risk
N/A N/A N/A N/A 2.3.1 - 2.3.5 Review at Next Major Assessment
5.3.3.1 Diver Activities
No- Negligible Risk
N/A N/A N/A N/A 2.3.1 - 2.3.5 Review at Next Major Assessment
5.3.3.2 Anchoring No- Negligible Risk
N/A N/A N/A N/A 2.3.1 - 2.3.5 Review at Next Major Assessment
5.3.3.3 Holding Sites No- Negligible Risk
N/A N/A N/A N/A 2.3.1 - 2.3.5 Review at Next Major Assessment
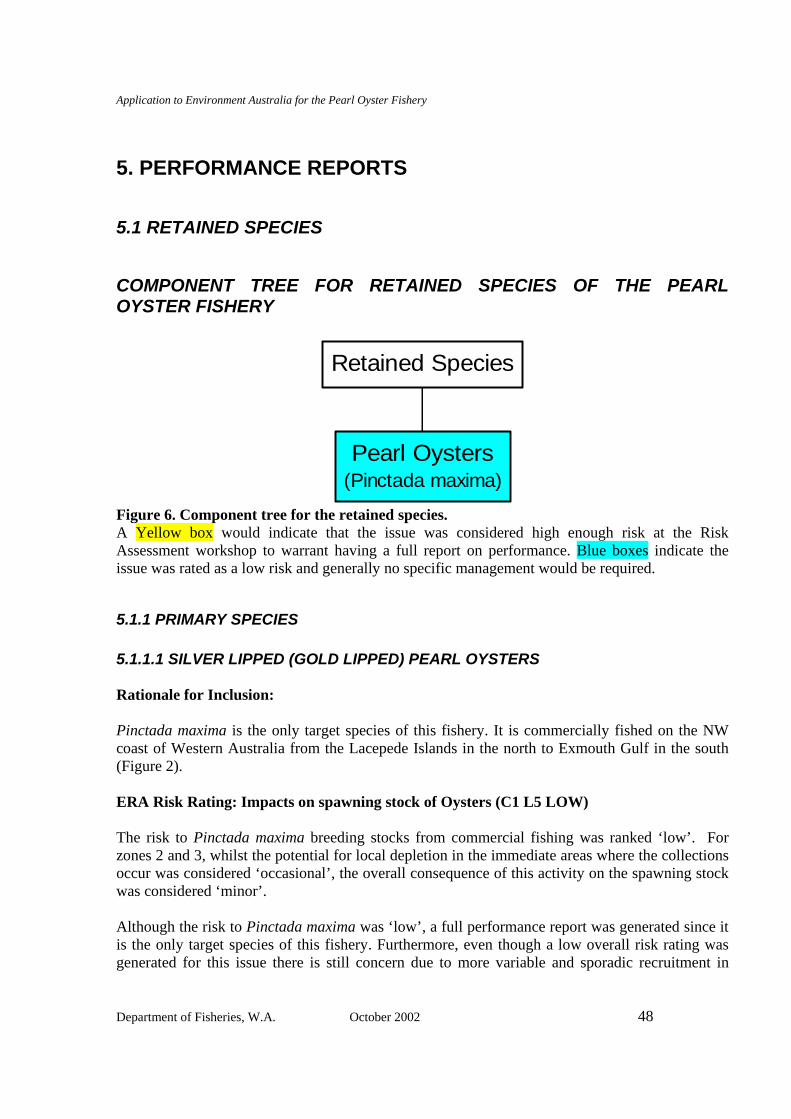
Application to Environment Australia for the Pearl Oyster Fishery
Department of Fisheries, W.A. October 2002 48
5. PERFORMANCE REPORTS
5.1 RETAINED SPECIES
COMPONENT TREE FOR RETAINED SPECIES OF THE PEARL OYSTER FISHERY
Pearl Oysters(Pinctada maxima)
Retained Species
Figure 6. Component tree for the retained species. A Yellow box would indicate that the issue was considered high enough risk at the Risk Assessment workshop to warrant having a full report on performance. Blue boxes indicate the issue was rated as a low risk and generally no specific management would be required.
5.1.1 PRIMARY SPECIES 5.1.1.1 SILVER LIPPED (GOLD LIPPED) PEARL OYSTERS Rationale for Inclusion: Pinctada maxima is the only target species of this fishery. It is commercially fished on the NW coast of Western Australia from the Lacepede Islands in the north to Exmouth Gulf in the south (Figure 2). ERA Risk Rating: Impacts on spawning stock of Oysters (C1 L5 LOW) The risk to Pinctada maxima breeding stocks from commercial fishing was ranked ‘low’. For zones 2 and 3, whilst the potential for local depletion in the immediate areas where the collections occur was considered ‘occasional’, the overall consequence of this activity on the spawning stock was considered ‘minor’. Although the risk to Pinctada maxima was ‘low’, a full performance report was generated since it is the only target species of this fishery. Furthermore, even though a low overall risk rating was generated for this issue there is still concern due to more variable and sporadic recruitment in
Application to Environment Australia for the Pearl Oyster Fishery
Department of Fisheries, W.A. October 2002 49
Zone 1 than in the other Zones. These fluctuations in recruitment in Zone 1 are the result of the more variable spat settlement in this zone and regular impacts of cyclone events that negatively impact the pearl oyster habitat. The risks to the stocks of pearl oysters in this region are minimised in two major ways. First, commercial fishers concentrate their diving activity on only a small percentage (5-10%) of the grounds where pearl oysters are found within each of the zones. This is because divers are limited by the depths that they can fish at and bottom time due to dive safety requirements. Furthermore, limits are also imposed on divers as a result of the relatively small tidal windows when visibility is suitable. Therefore, dive operations prefer relatively high concentrations of oysters to support commercial dive operations. Consequently, even the small 'patchy' habitats within the areas defined by these dive limitations, which support spawning stocks of pearl oysters are considered non-commercial, as the lower densities of oysters make fishing of such colonies less economically viable. As a result of these limitations, there remain many areas where there are significant quantities of pearl oyster spawning stocks that are not subjected to any fishing activities. The second major way that the risks to pearl oyster stocks are minimised is that even on the pearling grounds that are fished, the industry only harvests a specific component of the pearl oyster resource, which is termed 'culture shell'. These are oysters between the legislated minimum size of 120 mm and the company policy maximum of between 160 and 170 mm dorso-ventral measurement (DVM). The pearling industry has not commercially fished pearl oysters larger than 175 mm DVM – generally known as MOP - since the mid 1980's. Any remarks that relate to 'localised depletions' of pearl oysters stem from industry’s perception of the availability of culture-sized oysters for fishing and not to the total quantity of all pearl shell available. Thus, once the numbers of preferred size oysters on a pearling bank decline to a point where they can no longer be fished at economically viable levels, the bank is considered to be 'commercially' depleted and the fishing effort moves to another patch. Whilst the bank is considered ‘commercially’ depleted this does not mean that the total quantities of pearl shell are greatly reduced due to our knowledge that: • There is only a limited efficiency of detecting oysters in this size range (experimentally
estimated at <50% of available stock) ensures a significant number of culture shells remaining; and moreover;
• The numbers of oysters outside the 120-170 mm DVM size range are still present, often at high densities.
As a result, the spawning biomass and therefore the level of production of gametes from oysters remaining on fished and unfished pearling grounds more than has the potential to replace fished stock. Furthermore, each pearl oyster produces a large number of larvae that have an extended planktonic cycle (16 – 30 days) and become well dispersed across the NW shelf by tidal and wind movement.4
4 . (CSIRO Scientist - Scott Condie, preliminary model of larval movement for 80 Mile Beach, 2001).
Application to Environment Australia for the Pearl Oyster Fishery
Department of Fisheries, W.A. October 2002 50
Operational Objective To ensure there is sufficient breeding stock to continue recruitment at levels, which will replenish what is taken by fishing, predation and other environmental factors by maintaining the spawning stock of Pinctada maxima at or above a level that minimises the risk of overfishing. In addition, stocks should be maintained at levels that minimise the risk of there being insufficient concentrations of culture shell to meet on-going industry requirements. Justification: This operational objective incorporates both the environmental and commercial objectives of sustaining the Pinctada maxima resource. As with any fishery species, it is important to minimize the risk of recruitment overfishing. In addition, the operation of the pearl industry, which involves a large amount of post harvest infrastructure and planning, requires long-term consistency in the annual supply of the culture shell. Consequently, this extra requirement leads to a more conservative management approach being taken in the setting of quotas compared to a situation where the total catch was to be maximised, which would probably result in significantly more frequent and possibly larger changes to the quota among years. Indicators Relative Area where the Pearl Oyster Fishery Operates The area that is fished each year compared to the total area where pearl oysters are located in this region.
Catch Rate (Total catch and Fishing Effort) The annual catch rate (shells per hour dived) of culture shell is used as an indicator of pearl oyster abundance within the fished areas of each zone. Compulsory catch logbooks are provided by licence holders indicating the number of pearl oysters taken, where the catch was sourced from (10 x 10 mile blocks, which are further divided up into sub-blocks of squares with sides of 2.5 miles), total dive time and depth. These are all recorded on a daily basis during the fishing season. Size class of pearl oyster fished The frequency distributions of shell lengths from each of the major areas of the fishery area also provide an indication of relative recruitment strength. For each of the main locations fished (Zone 2/3, and 1), catches of oysters collected by the fishery are sampled for measurement and recorded in 5 mm size classes by research staff and industry members.
In – water survey of broodstock In Zone 1 (in the south of the fishery) where recruitment is more sporadic and cyclones often negatively impact on habitats, the Research Division has conducted dive surveys to determine the
Application to Environment Australia for the Pearl Oyster Fishery
Department of Fisheries, W.A. October 2002 51
health and abundance of pearl oyster broodstock (MOP) in the area. These dive surveys were conducted in 2000 and there are plans to conduct the surveys in 2002.
Performance Measures Distribution of Fishing- For all Zones A robust method to monitor whether stocks are being put at any risk of over-harvesting can be assessed by comparing the aerial distribution of fishing compared to the total distribution of the stock in this region (generated by logbook information and research). The performance measure, based on normal population dynamics experiences of harvested stocks, suggests that a precautionary limit would be where at least 40% of the distribution of a species is not harvested at all. Catch rates- Zones 2 & 3 The seasons catch rate, or number of culture size oysters (shells) per hour, in the main grounds of the Fishery (Zone 2) is monitored against a 10-year (1988-1997) average of 29.5 shells/hr. Zone 3 is monitored against a 5-year (1993-1997) catch rate average of 34.8 shells/hr. If the catch rates in each of these zones increases or decreases by more than 50% from the long term mean values (presented above), a review of the quota and other management measures will be initiated (see later). Catch Rate- Zone 1 In the southern extremity of the fishery, i.e. Port Hedland down to Exmouth Gulf, greater emphasis is placed on the length frequency of the catch as well as the observations conducted by the Research Division. Although catch rates are important for areas of Zone 1, the access to stocks in these areas is more affected by variations in dive conditions than in the other diving areas and the fleet has to be more mobile as recruitment is more variable and sporadic.
Size Frequency- Zone 1 Length frequency histogram of catches should be skewed towards newly recruited oysters (120 mm – 145 mm (i.e. less than 30% of the catch should be > 150mm). If this is not the case, this is an indication that new recruitment to the fishery is limited and a review of the management in this zone is initiated. (see below for details)
Direct Survey- Zone 1 Direct survey of broodstock numbers are completed as required to examine whether abundances have been affected by cyclones or other environmental influence. The most recent survey in the south of Zone 1 returned a density estimate of approximately 0.04 per m2 in 2000. The patchy distribution of broodstock (often related to bottom type) makes such styles of survey less valuable
Application to Environment Australia for the Pearl Oyster Fishery
Department of Fisheries, W.A. October 2002 52
than general assessments. More important than overall densities is an in-water assessment to ensure that pearl oysters banks are not affected by cyclone driven sand and silt movements and still hold significant numbers of MOP. Justification: Pearl oysters are known to occur in most areas throughout the region, not just the beds that are harvested by the fishery. Significant numbers of MOP shell were taken each year from beds that are no longer fished because of the shift in the 1970s to targeting shells used for culturing pearls and the ceasing of the capture of MOP in the mid 1980s. There are also many beds that contain shell that are too deep to harvest. Finally, recent research surveys have found similar catch rates of MOP shell in both fished and unfished regions in the Lacepedes and 80-mile Beach regions. This supports the notion that less than 10% of the stock is subjected to exploitation, which is a very conservative harvesting level. Pearl farmers prefer younger pearl oysters (around the 125 mm size class) in preference to the older larger oysters (150-160 mm size classes) for round pearl production and will not harvest pearl oysters larger than 175 mm DVM. Thus the fishery operates in a gauntlet style where there is a minimum size and a 'defacto' maximum size, this combined with the limited area fished, results in the majority of the breeding stock (most of which is MOP) remaining protected on the pearl beds. The historical ranges of catch and effort used to assess current performance in the fished areas are supported by a longer time series of catch and effort data for this fishery (since 1978) against which current levels of effort can be compared. During this period (> 30 years) there have not been any adverse impacts on recruitment levels recorded apart from normal environmentally driven fluctuations. Moreover, during the early part of the 20th century (1900-1940) in the order of 1000-1500 tons of pearls were removed from this region per year. The current harvest levels are only in the order of 250-300 tonnes. The 50% level of change in catch rates was chosen as the trigger because this would represent a departure from the range of values seen previously. It would also represent a severe problem for the economics of these operations. Examination of a histogram of fished shell (length) gives an indication of changes in the availability of newly recruited oysters. Changes in the relative proportions of different size classes should indicate whether stocks have received large numbers of new recruits or may be experiencing lowered recruitment. An increase in the proportion of catch from the larger sizes (150-160 mm DVM to approximately 30% or more of the total) would indicate that a major cohort of oysters was passing through the gauntlet size ranges and this information is used to temper the advice received from catch rates alone. Finally, movements of the fleet within the fishing zone from regular diving locations can also indicate potential variations in the abundance of oysters in the fishery.
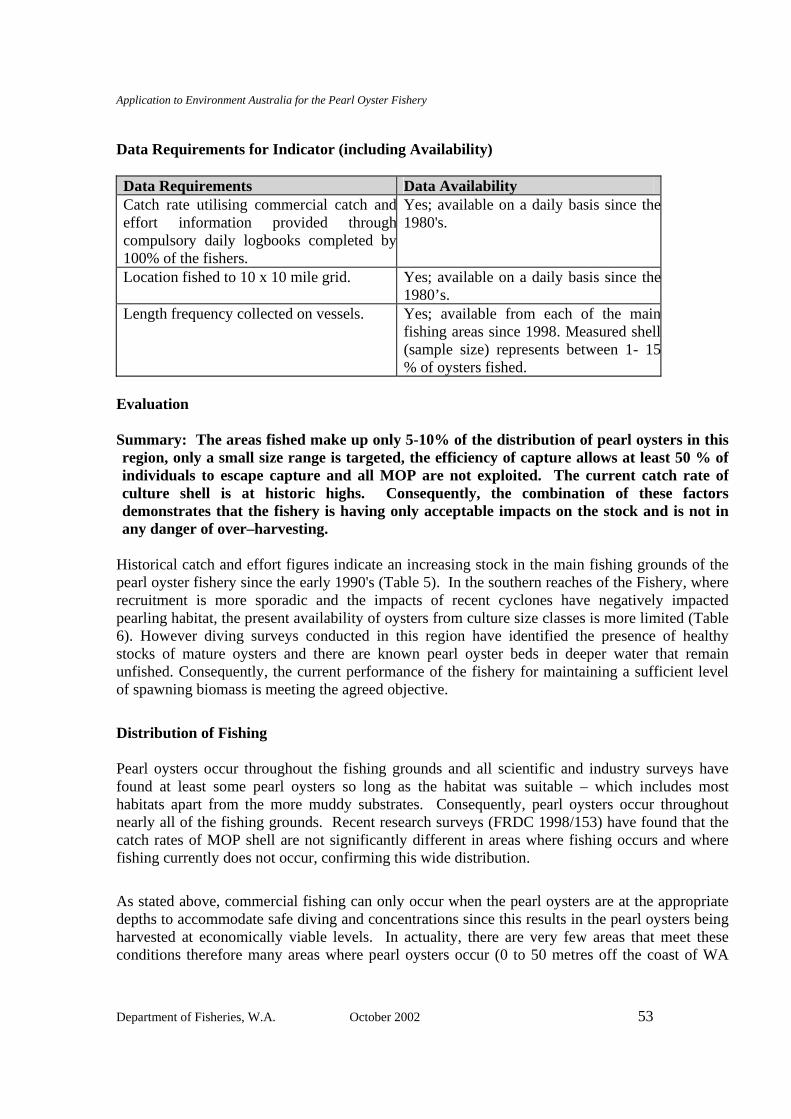
Application to Environment Australia for the Pearl Oyster Fishery
Department of Fisheries, W.A. October 2002 53
Data Requirements for Indicator (including Availability) Data Requirements Data Availability Catch rate utilising commercial catch andeffort information provided throughcompulsory daily logbooks completed by100% of the fishers.
Yes; available on a daily basis since the1980's.
Location fished to 10 x 10 mile grid. Yes; available on a daily basis since the1980’s.
Length frequency collected on vessels. Yes; available from each of the mainfishing areas since 1998. Measured shell(sample size) represents between 1- 15% of oysters fished.
Evaluation Summary: The areas fished make up only 5-10% of the distribution of pearl oysters in this region, only a small size range is targeted, the efficiency of capture allows at least 50 % of individuals to escape capture and all MOP are not exploited. The current catch rate of culture shell is at historic highs. Consequently, the combination of these factors demonstrates that the fishery is having only acceptable impacts on the stock and is not in any danger of over–harvesting.
Historical catch and effort figures indicate an increasing stock in the main fishing grounds of the pearl oyster fishery since the early 1990's (Table 5). In the southern reaches of the Fishery, where recruitment is more sporadic and the impacts of recent cyclones have negatively impacted pearling habitat, the present availability of oysters from culture size classes is more limited (Table 6). However diving surveys conducted in this region have identified the presence of healthy stocks of mature oysters and there are known pearl oyster beds in deeper water that remain unfished. Consequently, the current performance of the fishery for maintaining a sufficient level of spawning biomass is meeting the agreed objective.
Distribution of Fishing Pearl oysters occur throughout the fishing grounds and all scientific and industry surveys have found at least some pearl oysters so long as the habitat was suitable – which includes most habitats apart from the more muddy substrates. Consequently, pearl oysters occur throughout nearly all of the fishing grounds. Recent research surveys (FRDC 1998/153) have found that the catch rates of MOP shell are not significantly different in areas where fishing occurs and where fishing currently does not occur, confirming this wide distribution.
As stated above, commercial fishing can only occur when the pearl oysters are at the appropriate depths to accommodate safe diving and concentrations since this results in the pearl oysters being harvested at economically viable levels. In actuality, there are very few areas that meet these conditions therefore many areas where pearl oysters occur (0 to 50 metres off the coast of WA
Application to Environment Australia for the Pearl Oyster Fishery
Department of Fisheries, W.A. October 2002 54
shown in Figure 4) within the fishing grounds are not being fished. The current estimates are that less than 5-10% of the pearl oyster stocks are even fished (See Figure 7).
At the conclusion of the current FRDC project 1998/153 the Department of Fisheries will have a greater level of precision for estimates of the relative abundance of pearl oysters in the non-fished regions. Furthermore, this information will be combined with the known distribution of pearl oysters to generate a more precise estimate of the relative area fished.
Landings The TAC is controlled by a quota system. The zones (2/3 and 1) are analysed through the catch effort resulting in zones 2 and 3 being combined. In 2000 and 2001, the TAC, which included a 2,000 shells special allowance for tourism purposes, was 617,500 shells for the Pearl Oyster Fishery.
Zone 2/3 In 2000, the bulk of landings were taken from this zone (88% of all shell fished) (Table 5). The TAC for 2000 was 10% greater than for 1998 and 1999 (Table 5). This increase in TAC, to 502,500 shells, was allocated because average catch rates within Zone 2 for the previous season were at least 50% greater than the pre-defined 10-year average. The 2,000 shell special ‘tourism’ allowance was not increased. The reported catch for Zone 2/3 for the 2000 season was 501,419 shells (Table 5). The Zone 2/3 TAC for 2001 remained at the level set in 2000 (502,500 shell). Similar to 2000, this TAC was allocated because average catch rates within Zone 2 for the previous season were at least 50% greater than a pre-defined 10-year average. The reported catch for Zone 2/3 for the 2001 season was 502, 484 shell (Table 5). Zone 1 Zone 1 of the Pearl Oyster fishery had a TAC of 115,000 shells for 2000. The reported catch of 66,772 shells (Table 6) was well below this allocation, as some licensees chose to use hatchery-reared shells in preference to wild stock in the 2000 season. This conversion to hatchery stock, as envisaged in the management arrangements, has been caused by decreased abundance of wild stock due to cyclone damage to the benthic habitats of traditionally “productive” areas, particularly in Exmouth Gulf. In 2001, the TAC in Zone 1 was the same as for 2000 at 115,000 shells. The reported catch of 68,931 shell (Table 6) while greater than 2000 (66,772) was again well below the allocation, as some licensees chose to use hatchery-reared shell in preference to wild stock during the 2001 season, effectively resulting in a TAC of 70,000. This conversion to hatchery stock is due to a decrease in economic viability of harvesting wild stock culture shell in Zone 1 through lower availability of culture size shell and the increased effort required to fill wild stock quotas in recent seasons.
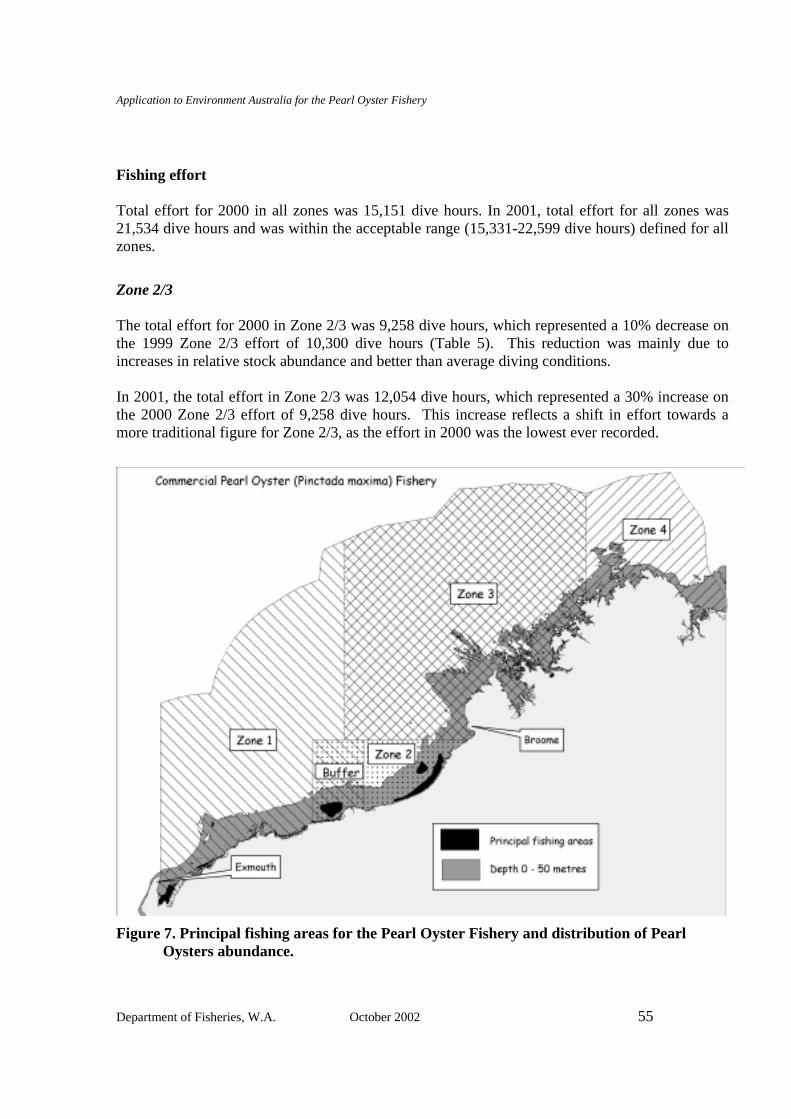
Application to Environment Australia for the Pearl Oyster Fishery
Department of Fisheries, W.A. October 2002 55
Fishing effort Total effort for 2000 in all zones was 15,151 dive hours. In 2001, total effort for all zones was 21,534 dive hours and was within the acceptable range (15,331-22,599 dive hours) defined for all zones.
Zone 2/3 The total effort for 2000 in Zone 2/3 was 9,258 dive hours, which represented a 10% decrease on the 1999 Zone 2/3 effort of 10,300 dive hours (Table 5). This reduction was mainly due to increases in relative stock abundance and better than average diving conditions. In 2001, the total effort in Zone 2/3 was 12,054 dive hours, which represented a 30% increase on the 2000 Zone 2/3 effort of 9,258 dive hours. This increase reflects a shift in effort towards a more traditional figure for Zone 2/3, as the effort in 2000 was the lowest ever recorded.
Figure 7. Principal fishing areas for the Pearl Oyster Fishery and distribution of Pearl
Oysters abundance.
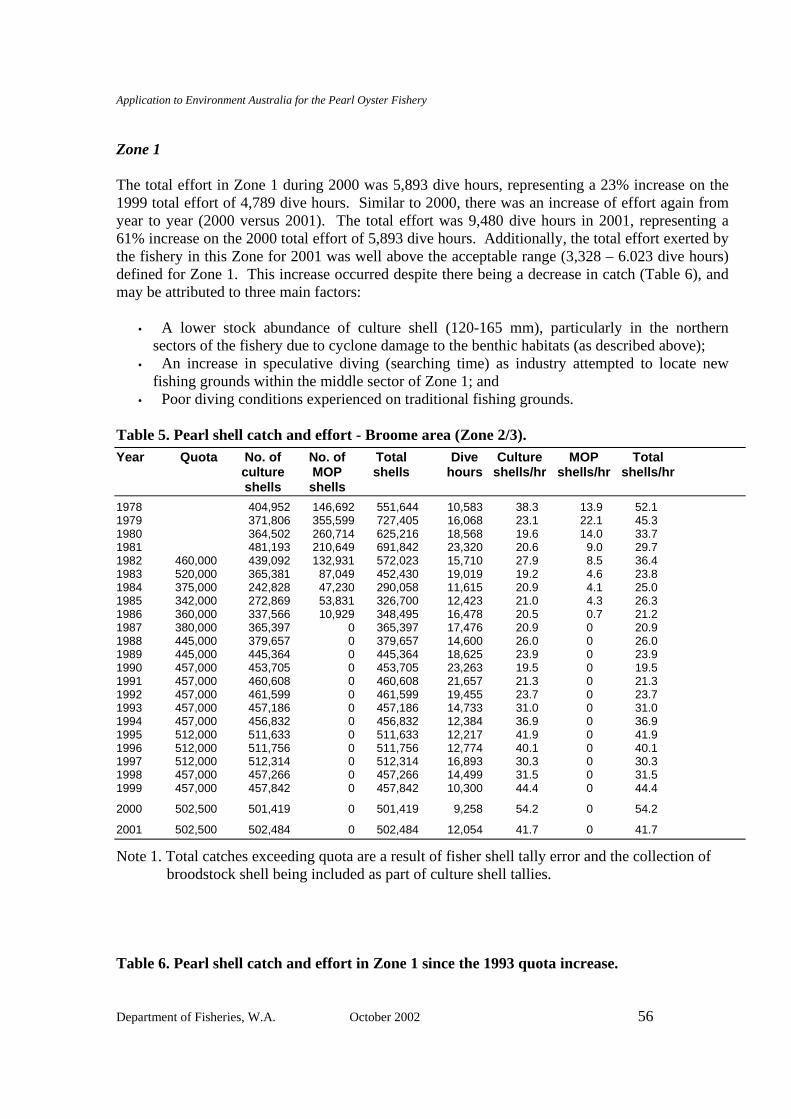
Application to Environment Australia for the Pearl Oyster Fishery
Department of Fisheries, W.A. October 2002 56
Zone 1 The total effort in Zone 1 during 2000 was 5,893 dive hours, representing a 23% increase on the 1999 total effort of 4,789 dive hours. Similar to 2000, there was an increase of effort again from year to year (2000 versus 2001). The total effort was 9,480 dive hours in 2001, representing a 61% increase on the 2000 total effort of 5,893 dive hours. Additionally, the total effort exerted by the fishery in this Zone for 2001 was well above the acceptable range (3,328 – 6.023 dive hours) defined for Zone 1. This increase occurred despite there being a decrease in catch (Table 6), and may be attributed to three main factors:
• A lower stock abundance of culture shell (120-165 mm), particularly in the northern sectors of the fishery due to cyclone damage to the benthic habitats (as described above);
• An increase in speculative diving (searching time) as industry attempted to locate new fishing grounds within the middle sector of Zone 1; and
• Poor diving conditions experienced on traditional fishing grounds. Table 5. Pearl shell catch and effort - Broome area (Zone 2/3). Year Quota No. of No. of Total Dive Culture MOP Total culture MOP shells hours shells/hr shells/hr shells/hr shells shells 1978 404,952 146,692 551,644 10,583 38.3 13.9 52.1 1979 371,806 355,599 727,405 16,068 23.1 22.1 45.3 1980 364,502 260,714 625,216 18,568 19.6 14.0 33.7 1981 481,193 210,649 691,842 23,320 20.6 9.0 29.7 1982 460,000 439,092 132,931 572,023 15,710 27.9 8.5 36.4 1983 520,000 365,381 87,049 452,430 19,019 19.2 4.6 23.8 1984 375,000 242,828 47,230 290,058 11,615 20.9 4.1 25.0 1985 342,000 272,869 53,831 326,700 12,423 21.0 4.3 26.3 1986 360,000 337,566 10,929 348,495 16,478 20.5 0.7 21.2 1987 380,000 365,397 0 365,397 17,476 20.9 0 20.9 1988 445,000 379,657 0 379,657 14,600 26.0 0 26.0 1989 445,000 445,364 0 445,364 18,625 23.9 0 23.9 1990 457,000 453,705 0 453,705 23,263 19.5 0 19.5 1991 457,000 460,608 0 460,608 21,657 21.3 0 21.3 1992 457,000 461,599 0 461,599 19,455 23.7 0 23.7 1993 457,000 457,186 0 457,186 14,733 31.0 0 31.0 1994 457,000 456,832 0 456,832 12,384 36.9 0 36.9 1995 512,000 511,633 0 511,633 12,217 41.9 0 41.9 1996 512,000 511,756 0 511,756 12,774 40.1 0 40.1 1997 512,000 512,314 0 512,314 16,893 30.3 0 30.3 1998 457,000 457,266 0 457,266 14,499 31.5 0 31.5 1999 457,000 457,842 0 457,842 10,300 44.4 0 44.4
2000 502,500 501,419 0 501,419 9,258 54.2 0 54.2
2001 502,500 502,484 0 502,484 12,054 41.7 0 41.7
Note 1. Total catches exceeding quota are a result of fisher shell tally error and the collection of broodstock shell being included as part of culture shell tallies. Table 6. Pearl shell catch and effort in Zone 1 since the 1993 quota increase.
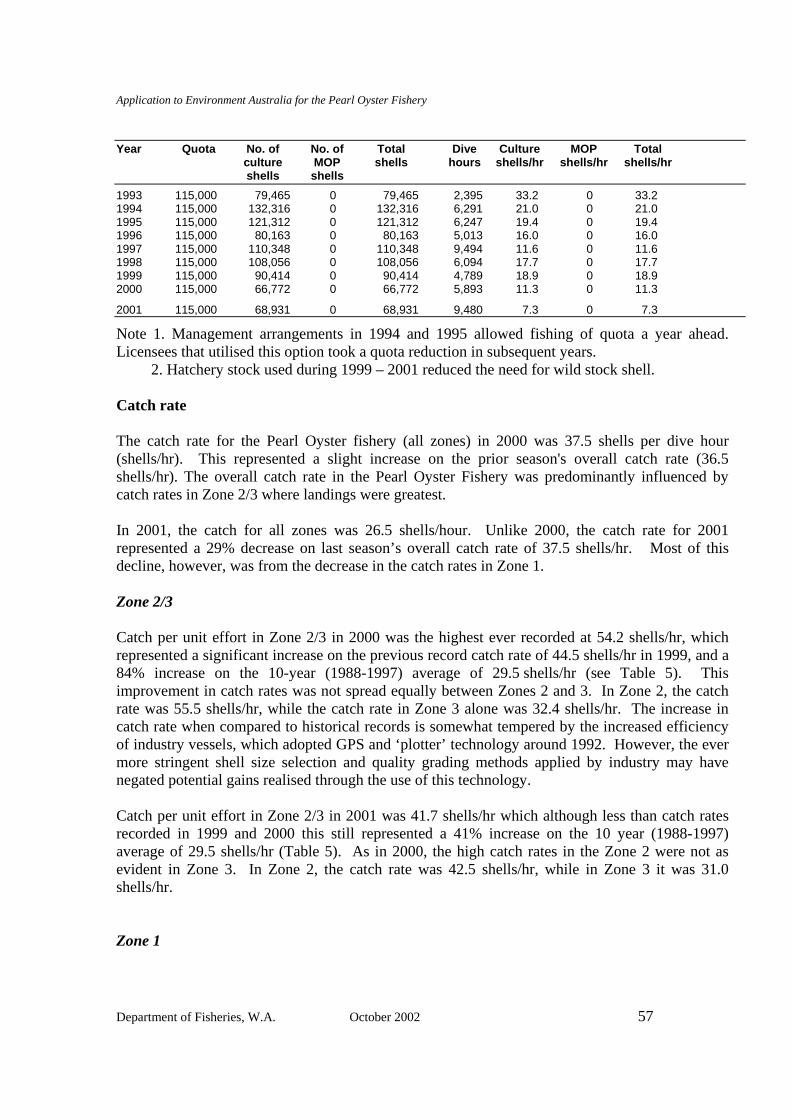
Application to Environment Australia for the Pearl Oyster Fishery
Department of Fisheries, W.A. October 2002 57
Year Quota No. of No. of Total Dive Culture MOP Total culture MOP shells hours shells/hr shells/hr shells/hr shells shells 1993 115,000 79,465 0 79,465 2,395 33.2 0 33.2 1994 115,000 132,316 0 132,316 6,291 21.0 0 21.0 1995 115,000 121,312 0 121,312 6,247 19.4 0 19.4 1996 115,000 80,163 0 80,163 5,013 16.0 0 16.0 1997 115,000 110,348 0 110,348 9,494 11.6 0 11.6 1998 115,000 108,056 0 108,056 6,094 17.7 0 17.7 1999 115,000 90,414 0 90,414 4,789 18.9 0 18.9 2000 115,000 66,772 0 66,772 5,893 11.3 0 11.3
2001 115,000 68,931 0 68,931 9,480 7.3 0 7.3
Note 1. Management arrangements in 1994 and 1995 allowed fishing of quota a year ahead. Licensees that utilised this option took a quota reduction in subsequent years. 2. Hatchery stock used during 1999 – 2001 reduced the need for wild stock shell. Catch rate The catch rate for the Pearl Oyster fishery (all zones) in 2000 was 37.5 shells per dive hour (shells/hr). This represented a slight increase on the prior season's overall catch rate (36.5 shells/hr). The overall catch rate in the Pearl Oyster Fishery was predominantly influenced by catch rates in Zone 2/3 where landings were greatest. In 2001, the catch for all zones was 26.5 shells/hour. Unlike 2000, the catch rate for 2001 represented a 29% decrease on last season’s overall catch rate of 37.5 shells/hr. Most of this decline, however, was from the decrease in the catch rates in Zone 1. Zone 2/3 Catch per unit effort in Zone 2/3 in 2000 was the highest ever recorded at 54.2 shells/hr, which represented a significant increase on the previous record catch rate of 44.5 shells/hr in 1999, and a 84% increase on the 10-year (1988-1997) average of 29.5 shells/hr (see Table 5). This improvement in catch rates was not spread equally between Zones 2 and 3. In Zone 2, the catch rate was 55.5 shells/hr, while the catch rate in Zone 3 alone was 32.4 shells/hr. The increase in catch rate when compared to historical records is somewhat tempered by the increased efficiency of industry vessels, which adopted GPS and ‘plotter’ technology around 1992. However, the ever more stringent shell size selection and quality grading methods applied by industry may have negated potential gains realised through the use of this technology. Catch per unit effort in Zone 2/3 in 2001 was 41.7 shells/hr which although less than catch rates recorded in 1999 and 2000 this still represented a 41% increase on the 10 year (1988-1997) average of 29.5 shells/hr (Table 5). As in 2000, the high catch rates in the Zone 2 were not as evident in Zone 3. In Zone 2, the catch rate was 42.5 shells/hr, while in Zone 3 it was 31.0 shells/hr. Zone 1
Application to Environment Australia for the Pearl Oyster Fishery
Department of Fisheries, W.A. October 2002 58
The Zone 1 catch per unit effort was 11.3 shells/hr in 2000, which represented a significant decrease of 40% from the 1999 figure of 18.9 shells/hr (Table 6). Effort in 1998 and 1999 shifted across Zone 1, from Exmouth Gulf in the south to the Port Hedland region (including the buffer zone extension) in the north. In 2000, Exmouth Gulf yielded just 36% of the catch (53% less than the average for 1990-1997), while the Port Hedland region was the source of 52% of the shell (11% less than last year but still 64% greater than the 1990-1997 average). In 2000, previously under-utilised areas in the middle sectors of the fishery have begun to show promise again (12% of the Zone 1 catch). Whereas the catch rate in the Port Hedland region has steadily decreased from 26.4 shells/hr in 1998 to 11.5 shells/hr in 2000, the catch rate in the middle sector of the fishery has steadily increased in the last three years from 10.8 shells/hr in 1998 to 17.2 shells/hr in 2000. Exmouth Gulf (the southern sector of the Zone 1 fishery) experienced an increased catch rate between 1998 and 1999 (from 11 shells/hr in 1998 to 19.3 shells/hr in 1999) but this has again declined to 10.1 shells/hr in 2000. Stock Assessment Assessment of shell sizes in the catch reveals that new recruitment comprises by far the majority of the catch in Zones 2/3 and that this was also the case in the central region of Zone 1 (Figure 8). Zone 2/3 The primary measure of stock abundance is catch per unit effort. In Zone 2/3 the high level of catch rate recorded in recent years (1994-1996 and 1999-2001) had previously only been experienced during the late 1970s and early 1980s when the pearling fleet was fishing both culture and mother-of-pearl shell. The increased catch rates in 1999 and 2000 are believed to have resulted from high abundance, favourable diving conditions and the influence of technological efficiencies on industry practices (probably in that order of impact). The unprecedented high catch rate results indicate that recruitment to the Zone 2/3 pearl oyster stock is at a sufficient level to maintain or increase stock levels, permitting safe and economic fishing operations. As with most bivalve fisheries, the P. maxima fishery is characterised by relatively large variability in recruitment. The high catch rates recorded in 1999 to 2001 are undoubtedly partially due to a large pulse of recruits passing through the size range targeted by the fishery. This increase in recruitment can be partially attributed to the presence of favourable environmental conditions for larval and juvenile survival in the preceding 2 years. In addition to the environmental effects on larval development, settlement, juvenile growth and survival, the weather conditions were unusually settled during the main fishing periods in 2000, which assisted divers through good water visibility. This was despite the occurrence of Cyclone Rosita in April 2000, which caused wide-scale damage to pearling facilities located near the cyclone’s path just south of Broome. Weather patterns and underwater visibility in Zone 2/3 were also again favourable during the main fishing periods in 2001, with the resulting good diving conditions (and hence increased catchability) also having a positive influence on catch rates.

Application to Environment Australia for the Pearl Oyster Fishery
Department of Fisheries, W.A. October 2002 59
2001 Pearl Oyster Size Frequency SamplingBy Region
120 125 130 135 140 145 150 155 160 165 1700
200400600800
1000120014001600
Size Class (mm)
n =7876
120 125 130 135 140 145 150 155 160 165 1700
50
100
150
200n = 746
Size Class (mm)
Freq
uenc
y
n = 3328
120 125 130 135 140 145 150 155 160 165 1700
100200300400500600700800
Middle Sector (Zone 1)
Exmouth Gulf (Zone 1)
80 Mile Beach and Lacepedes (Zone 2/3)
Size Class (mm)
Freq
uenc
yFr
eque
ncy
Figure 8. Pearl Oyster size frequency sampling by region in 2001. Increases in catch rates have occurred in Zone 2/3 as the fleet decreases the effective search and fishing area. Catches in 2000 were made in less than half the area (as reported in 10 x 10 mile grid squares) that was utilised at the beginning of the 1990s. The distribution of catch and effort in Zone 2/3 during 2001 was similar to that in 2000, with catches made in less than half the area that was utilised at the beginning of the 1990s. Fishers have concentrated fishing effort on productive pearling grounds in shallower water (< 12 m on average). In the last five years the average depth fished has fallen every year. Assessment of the sizes of oysters fished in Zone 2/3 show that around 60% of the catch comes from the 120–140 mm shell height size classes, which are the smaller, newly recruited oysters preferred for pearl culture. These results reveal that the wider range of pearl oyster grounds off the Eighty Mile Beach are subjected to low levels of fishing pressure, while yearly recruitment is supporting the fishery within its most productive locations. Within Zone 2/3 there is, however, a history of differential catch rates between major fishing areas. For example, although catch rates in Zone 3 were higher than those recorded in Zone 2 during 1994-1996 (peaking at 50.2 shells/hr in 1995), catch rates were lower in Zone 3 than in Zone 2 in 1999 to 2001, suggesting that the factors responsible for the increased catch rates in Zone 2 were not as apparent in Zone 3 during the past two years. Zone 1
Application to Environment Australia for the Pearl Oyster Fishery
Department of Fisheries, W.A. October 2002 60
The distribution of catch and effort in Zone 1 shifted considerably in 2001 when compared to 1998 - 2000. Management decisions designed to reduce fishing pressure in Exmouth Gulf were implemented in 1998, and involved setting a separate TAC of 40,000 shells for Exmouth Gulf, and extending the buffer zone for Zone 1 to 30 miles east to allow operators to access previously under-utilised grounds in the southern areas of Zone 2. Further management arrangements were introduced prior to 2001, with a TAC of 25,000 shells applied to the northern sector (which includes the buffer zone extension) of Zone 1 in an attempt to reduce fishing pressure in this area. In addition, the northern sector was divided into three sub-areas, with a TAC for each sub-area also introduced. During 1998 to 2000 the northern sector had provided 52-75% of the Zone 1 catch, although catch rates decreased every season. The catch from the northern sector decreased significantly during the 2001 season, with a sharp decline in catch rate. Catch monitoring during this period has revealed that fishers are reliant on taking a percentage of catch from larger, less sought-after shell sizes (150-165 mm shell height). In addition, trial ‘piggyback’ spat collection results were low relative to those recorded for Zone 2/3 of the fishery. The generally low spat collection results are in line with the general assessment that recruitment in Zone 1 is lower and less regular than in Zone 2/3. Catches from under-utilised areas in the middle sectors of the fishery are again nearing more promising levels (12% of the Zone 1 catch in 2000). Previously fished grounds in the middle sector of the fishery provided 86% of the overall Zone 1 catch in 2001. The significant increase in catch from this are follows steadily improving catches in recent years, and signs of increased recruitment based on length frequency sampling with a high proportion of recently recruited oysters. The middle sector had provided only limited numbers of pearl oysters during the 1990s due to poor recruitment and unfavourable diving conditions, and consequently has only been lightly fished in recent seasons. The concentration of effort in this sector during 2001 has eased fishing pressure in the previously heavily fished northern and southern sectors of Zone 1. Exmouth Gulf (southern sector of Zone 1) was lightly fished during 2001 with poor catch rates continuing the trend of declining catch rates in this area during recent seasons. In addition to the loss of productive ground through cyclone impacts on the sea floor, some traditionally productive fishing areas in the south of the Gulf are not being fished because they are contained within pearl farm lease boundaries. The shift in distribution of effort towards the middle sector in 2001 highlights the concerns regarding productivity in this zone. Although encouraging numbers of pearls were fished from the middle sector, the other sectors have declined considerably in 2001 when compared to catches taken since 1998. Management controls in the southern and northern sectors will again focus on limiting effort and encourage the rebuilding of pearl oyster stocks in these areas. In response to concerns regarding the increasing level of effort required to take wild stock quota in Zone 1, licensees have been allocated a reduced overall TAC of 55,000 shell in 2002. The overall TAC of 115,000 shells will be maintained with the substitution of wild stock with hatchery-reared stock. The wild stock TAC will be reviewed in May 2002, when any adjustment to the TAC will be made following analysis of available catch and effort data. If there is a further decline in abundance indicators in 2002, further controls in this fishery will be needed.
Application to Environment Australia for the Pearl Oyster Fishery
Department of Fisheries, W.A. October 2002 61
Robustness HIGH The indicators are considered sufficiently robust because:
• Large areas of the pearl oyster stock are at densities too low for profitable fishing or at depths that require greater use of oxygen in safety stops. The fishing of these areas is less desirable as they are less profitable or put the operators at risk of conflict with occupational safety and health standards (OSH). These pearling grounds which contain significant densities of shell (see above or details) comprise >90% of the distribution and remain unfished. They therefore act as surrogate reserves.
• The information on where fishing occurs is monitored closely with detailed records collected on the precise fishing locations (sub-blocks of 2.5 miles) and catches obtained. Furthermore, there is a large amount of information on the general distribution of pearl oysters in this region, particularly now that a MOP survey has been completed (FRDC 1998/153) from which estimates of the percentage area unfished can be determined. At present, research staff is completing the analysis of the data that were collected.
• A combination of catch and effort and shell size data over spatial scales of 10 x 10 miles is considered to be an appropriate indicator of relative abundance of Pinctada maxima within the relatively small areas that are fished compared to the large Indo-Pacific distribution of this species. Within the areas that are fished, there is a suitable minimum size and ‘de-facto’ maximum size limit and good compliance with catch quota to ensure that catch and effort data is comparable from year to year.
• The Department of Fisheries has a long time-series of accurate catch and effort information provided by 100% of the commercial fishers through compulsory daily logbooks.
• Direct dive surveys are implemented as necessary. Fisheries Management Response Current: To ensure maintenance of the required level of breeding stock and constant supplies of culture shell the following measures are employed:
• The fishery is managed through input controls (sixteen licences) and output controls (quotas, minimum legal size limits).
• The annual fishing season has a fixed quota from which the catch and effort data is assessed on an annual basis against historical averages. Closures and quota limitations can be made mid-season by the Department of Fisheries or at the request of licensees to account for exceptional events.
• Any significant declines of the incoming recruitment from environmental effects are observed in time to implement appropriate risk management interventions – for which multiple trigger points (see above) are used to determine this level.
• Compliance operations monitor both pearl oyster fishers and farms. • The minimum legal size limit of 120 mm ensures that pearl oysters have a minimum of 1
spawning season before becoming accessible to commercial fishing.
Application to Environment Australia for the Pearl Oyster Fishery
Department of Fisheries, W.A. October 2002 62
• As P. maxima are protandrous hermaphrodites, oyster stocks do not have a full complement of females until shell sizes reach approximately 180 mm shell height. Pearl oyster fishers prefer to harvest oysters between 120 and 165 mm shell height, hence oysters larger than 165-170 mm remain in the fishery as breeding stock. The fishery focus has also moved away from the deep-water pearling grounds that now remain unfished or only lightly fished. Stocks remaining on these deep-water pearl grounds are likely to contribute to overall broodstock abundance and recruitment in both shallow and deep-water areas (Condie5 pers. comm.).
• The current annual quota for the fishery is less than the annual recruitment of exploitable sized oysters, therefore the breeding stock even in the fished areas is being maintained or in some areas increased. This is especially true for Zone 2/3, which has experienced excellent recruitment in recent years. Current management arrangements for Exmouth Gulf in the southern sector of Zone 1 (160 mm maximum size) are designed to ensure that exploitable stocks in that sector are improved in the longer term.
Future: The Pearling Research Section of the Department of Fisheries is investigating the potential for generating an index capable of forecasting recruitment. This index would predict rises and falls in the upcoming recruitment to the fishery through the measurement of the abundance of juvenile pearl oysters attached to larger oysters collected as part of the fishery. An FRDC 2000/127 study is presently underway to determine the effectiveness of this technique, and will be completed in 2004. Information on factors affecting catch rates such as visibility and navigation technology will also be examined in the future. Actions if Performance Limit is Exceeded: The following approach is used when the catch rates increases or falls greater than 50% beyond the historical thresholds indicated or shell composition of catch changes dramatically: Catch Rates Increases by 50% from historical average- Reassess quotas with the potential to increase the allocation by 10% (see above for justification). Catch Rates Decrease by 50% from historical average (see above for justification) - if this happens there would be an investigation into why the catch rate had declined. This would include an evaluation of whether there had been a shift in the targeting of pearl oysters through farm requirements or for some "other" explanation. If variation were due to verifiable explanation that does not indicate a decline in stock size, then no action would be taken. If investigation revealed that there was a decline in stock sizes the current elevated quota levels (502,500) would be reduced to baseline levels (457,000). If indicators highlight a significant decrease in available stock, and in-water surveys instituted to check on broodstock numbers yielded results of concern, further protection can be given to the breeding stock. Options for further protecting breeding stock include:
• Reduce quota allocations, either for the following season or mid season (in exceptional circumstances).
•
5 Scott Condie, CSIRO Scientist Hobart.
Application to Environment Australia for the Pearl Oyster Fishery
Department of Fisheries, W.A. October 2002 63
• Additional closures (within Zone limits set). • Introducing a maximum shell size limit smaller than the de-facto maximum size limit to
reduce the gauntlet size ranges. Comments and Action There is a process of continual improvement in the on-going development and refinement of methods used to determine breeding stock estimates. This relates to both the collection of information in the field (eg. length frequencies and growth data) and the involvement of fishers in supplying further information (eg. shell measures) to the Research Division through the use of new technologies. The pearl oyster stocks underpinning the fishery in Zone 2 (88% of total pearl oyster catch in 2000) continue to provide an elevated level of production to support this major Western Australian industry. The new funded FRDC 2000/127 project, which seeks to determine the predictability of the relationship between numbers of spat of P. maxima on adult oysters (piggy-back spat) and future catch rates, will potentially give the fishery data on abundance of upcoming stock. This information would greatly assist managers in determining quota allocations, as there is currently a heavy reliance on retrospective catch data to determine future management controls. In a fishery that targets pearl oysters for approximately three years once they reach legal size, projections based on retrospective catch data can under-estimate and over-estimate available stock. There is a recognised need to document the uptake of GPS/plotter technology, and the seasonal variance in diving conditions such as visibility, to assess how the catch rate is affected by factors other than shell abundance. Documentation of the adoption and operation of GPS and plotter technology will be prepared in 2002. External Driver Check List Environmental factors such as climatic changes, ocean currents (el Nino), cyclone events and sea temperatures are known to affect the productivity of pearl oyster stocks through survival of spawning stock or recruits, and effects on growth. Mechanisms include: 1. Cyclone induced smothering of breeding stock and recruits. 2. Mortality of larvae. 3. Variation in growth (temperature or food related). Similarly, weather conditions can affect visibility for divers and the level of access fishers have to stocks.
Application to Environment Australia for the Pearl Oyster Fishery
Department of Fisheries, W.A. October 2002 64
5.1.1.2 GENETIC DISRUPTION TO OYSTER POPULATIONS Rationale for Inclusion: There have been significant movements of pearl oysters between fishing areas in Western Australia, and between fishing areas and farms in the last two decades. The impact of such movements is assessed here. ERA Risk Rating: Impacts on genetic disruption of Oysters (C0 L1 NEGLIGIBLE) With the historical movement of pearl oysters between fishing areas in WA, and between fishing areas and farms, there has been significant relocation of stocks. These movements are likely to represent an insignificant source of genetic dilution when considered alongside the fact that developing pearl oyster larvae are able to disperse from their point of production, on the strong tidal currents found in NW Western Australia, during the planktonic phase of their life cycle. This phase of development (16 – 30 days) ensures that progeny are well dispersed along the NW Coast. Previous genetic studies have shown limited genetic separation of stocks along the Western Australian Coast, and interestingly in the Northern Territory the stock is still separate from WA stock despite translocations in the last 20 years (Benzie and Smith, 2002).
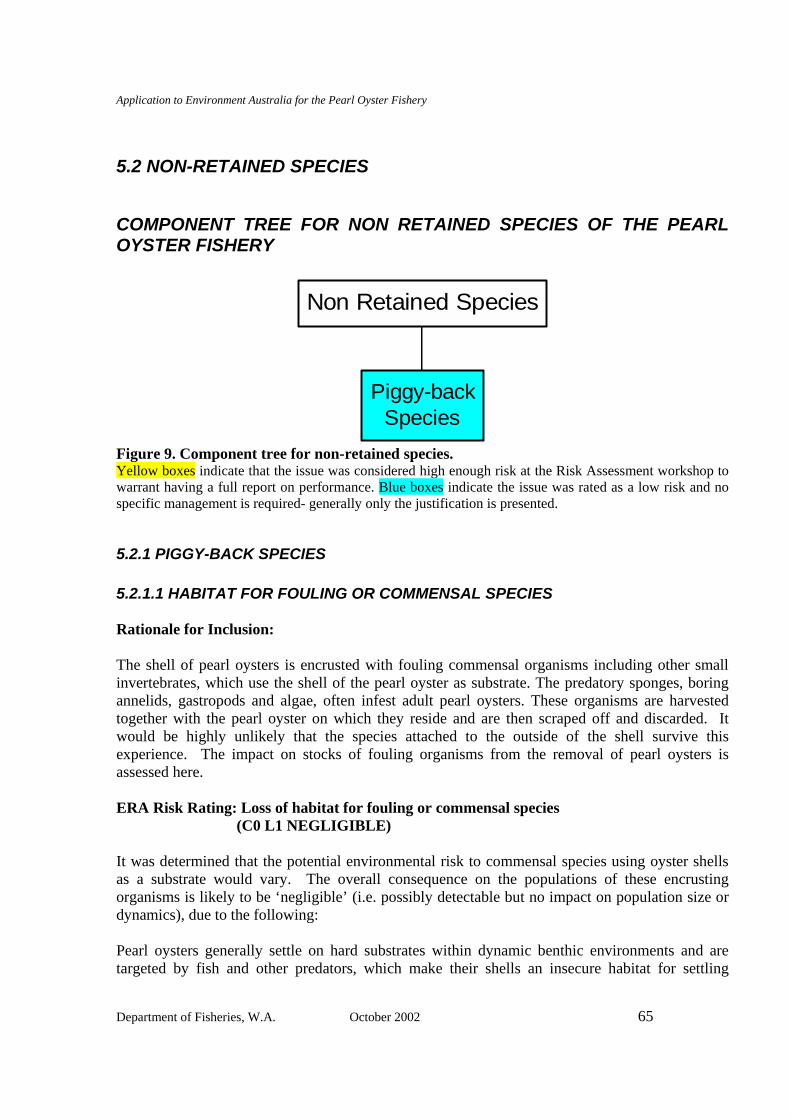
Application to Environment Australia for the Pearl Oyster Fishery
Department of Fisheries, W.A. October 2002 65
5.2 NON-RETAINED SPECIES
COMPONENT TREE FOR NON RETAINED SPECIES OF THE PEARL OYSTER FISHERY
Piggy-backSpecies
Non Retained Species
Figure 9. Component tree for non-retained species. Yellow boxes indicate that the issue was considered high enough risk at the Risk Assessment workshop to warrant having a full report on performance. Blue boxes indicate the issue was rated as a low risk and no specific management is required- generally only the justification is presented.
5.2.1 PIGGY-BACK SPECIES 5.2.1.1 HABITAT FOR FOULING OR COMMENSAL SPECIES Rationale for Inclusion: The shell of pearl oysters is encrusted with fouling commensal organisms including other small invertebrates, which use the shell of the pearl oyster as substrate. The predatory sponges, boring annelids, gastropods and algae, often infest adult pearl oysters. These organisms are harvested together with the pearl oyster on which they reside and are then scraped off and discarded. It would be highly unlikely that the species attached to the outside of the shell survive this experience. The impact on stocks of fouling organisms from the removal of pearl oysters is assessed here. ERA Risk Rating: Loss of habitat for fouling or commensal species (C0 L1 NEGLIGIBLE) It was determined that the potential environmental risk to commensal species using oyster shells as a substrate would vary. The overall consequence on the populations of these encrusting organisms is likely to be ‘negligible’ (i.e. possibly detectable but no impact on population size or dynamics), due to the following: Pearl oysters generally settle on hard substrates within dynamic benthic environments and are targeted by fish and other predators, which make their shells an insecure habitat for settling
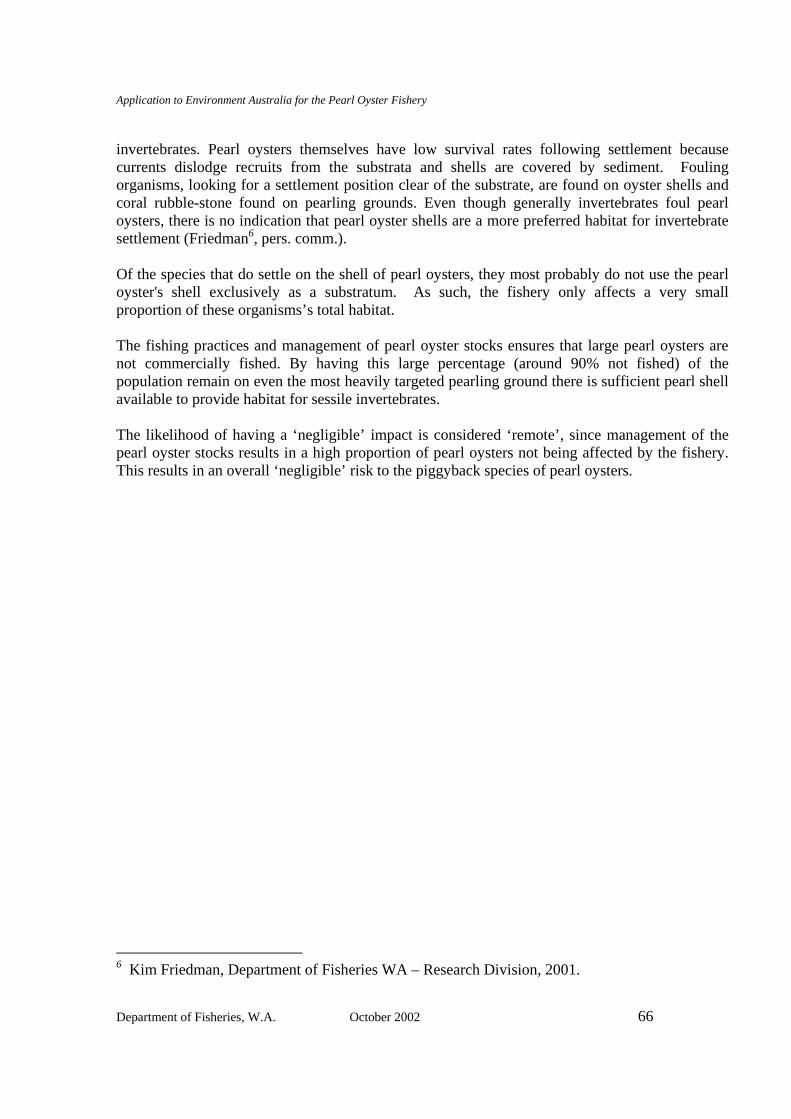
Application to Environment Australia for the Pearl Oyster Fishery
Department of Fisheries, W.A. October 2002 66
invertebrates. Pearl oysters themselves have low survival rates following settlement because currents dislodge recruits from the substrata and shells are covered by sediment. Fouling organisms, looking for a settlement position clear of the substrate, are found on oyster shells and coral rubble-stone found on pearling grounds. Even though generally invertebrates foul pearl oysters, there is no indication that pearl oyster shells are a more preferred habitat for invertebrate settlement (Friedman6, pers. comm.). Of the species that do settle on the shell of pearl oysters, they most probably do not use the pearl oyster's shell exclusively as a substratum. As such, the fishery only affects a very small proportion of these organisms’s total habitat. The fishing practices and management of pearl oyster stocks ensures that large pearl oysters are not commercially fished. By having this large percentage (around 90% not fished) of the population remain on even the most heavily targeted pearling ground there is sufficient pearl shell available to provide habitat for sessile invertebrates. The likelihood of having a ‘negligible’ impact is considered ‘remote’, since management of the pearl oyster stocks results in a high proportion of pearl oysters not being affected by the fishery. This results in an overall ‘negligible’ risk to the piggyback species of pearl oysters.
6 Kim Friedman, Department of Fisheries WA – Research Division, 2001.
Application to Environment Australia for the Pearl Oyster Fishery
Department of Fisheries, W.A. October 2002 67
5.3 GENERAL ENVIRONMENT
COMPONENT TREE FOR GENERAL ENVIRONMENT OF THE PEARL OYSTER FISHERY
Bait collection(not this fishery)
Fishing(trophic Interactions)
Ghost fishing(not an issue this
fishery)
Benthic Biota(no this fishery)
removal of/damage toorganisms
Stock enhancement(Discuss in terms of
the ranching of shells)
Discarding of Shells
Fishing Holding Sites
Translocation(not for this fishery)
addition/movementof biological material
Diver Activities
Anchoring
Damage to Habitats
Impacts on the biological communitythrough
Fuel usage/Exhaust
Greenhouse gas emissions
Air quality
Debris
Oil discharge
Water quality
Substrate quality(not for this fishery)
Other
General Environment
Figure 10. Component tree for the general environment. Yellow boxes would indicate that the risk was considered high enough risk at the Risk Assessment workshop to warrant having a full report on performance. Blue boxes indicate the issue was rated as a low risk and no specific management is required- only justification is presented. A box with a dotted line means that this issue was added after the risk assessment workshop.
5.3.1 IMPACT OF REMOVING PEARL OYSTERS FROM THE ENVIRONMENT 5.3.1.1 TROPHIC INTERACTIONS Rationale for Inclusion: As with all fisheries, the impacts of the removal of the target species on other elements of the ecosystem need to be examined. The risk assessment determined that the impacts on the environment as a result of removing oysters was not determined to be of high enough risk
Application to Environment Australia for the Pearl Oyster Fishery
Department of Fisheries, W.A. October 2002 68
rankings to justify a full management report (including objectives and performance indicators). The justification for this decision is outlined below ERA Risk Rating: Impact of taking oysters on trophic interactions (C0 L1 NEGLIGIBLE) The removal of pearl oysters could result in a reduced removal of particulates from the water column due to the removal of a portion of filter feeders from the system. The removal of oysters is unlikely to present a significant change to the trophic structure of fished areas if we consider research into the effects of shellfish farms on primary productivity (Kaspar et al., 1985; Souchu et al., 1991; Souchu et al., 2001). The studies mentioned above have assessed the impact on the planktonic food web of shellfish held at higher densities (pearl farms) than found in the wild. These studies have shown that only in the highest densities of shellfish and in waters of high residence can an effect of the removal of the shellfish be detected on phytoplankton availability. Furthermore, this result was only significant in winter when primary production was depressed. It is known that pearl oysters filter feed particulates from the water column. In less nutrient rich locations than the NW shelf, where pearl oysters are held in high densities (lagoonal pearl farms), studies have shown that pearl oysters only have a very low consumption of plankton compared to planktonic fluxes and that their filter feeding activity does not markedly impact on the availability of primary productivity (Niquil et al., 2001; Kaspar et al., 1985; Souchu et al., 1991; Souchu et al., 2001). In the wild pearl oysters make up only a small proportion of filter feeders present, and removal of only a small part of this stock would not leave a measurable change to the level of primary productivity and other particulates in the water column. This is particularly the case for pearl oysters in this region given that less than 10% of the area is fished and significant quantities of pearl oysters still remain even in these fished areas. The removal of pearl oysters is also not expected to affect predators as divers target only a small size range of oysters for round pearl production. Combined again with the relatively small areas where there are fishing operations and the lack of any obligate predator for pearl oysters suggests that this fishery is having a negligible impact on any trophic interactions in this region.
5.3.2 ADDITION OF MATERIAL TO THE ENVIRONMENT 5.3.2.1 DISCARDING OF SHELLS Rationale for Inclusion: Live oysters (termed shells) that prove to be oversize, undersize or of questionable use for pearl production (Cliona infection – shell imperfections) when they reach the deck of the vessel are returned to the pearl beds. This proportion of the catch is very small and oysters would not spend more than 30 minutes out of the water, which would not unduly stress the oysters. The impact on stocks of discarding shells is assessed here.
Application to Environment Australia for the Pearl Oyster Fishery
Department of Fisheries, W.A. October 2002 69
ERA Risk Rating: Impact on the environment of discarding shells (C0 L1 NEGLIGIBLE) Oysters are returned to the substrate in the vicinity from where they were harvested. The oysters are returned in good condition after only a short period of emersion (30 minutes or less). These oysters are returned to the water and are often seen by divers (sometimes collected if grown to be within the correct size bracket) on subsequent drifts. Such 'throwback' patches as they are termed can artificially increase the density of oysters on the bottom, which may increase the likelihood of fertilisation in subsequent spawnings but there is no evidence that returned oysters suffer from their short period of exposure.
5.3.3 DAMAGE TO HABITATS 5.3.3.1 DIVER ACTIVITIES Rationale for Inclusion: Pearl oyster divers carry with them several pieces of equipment for safety and oyster collection purposes. This includes the underwater breathing apparatus (such as surface supplied air units), and a large mesh bag for storage of the catch (with a capacity of between 100 and 200 live animals). The impact on the benthic habitat from interaction of the diver and the diver’s equipment is assessed here. ERA Risk Rating: Impact on sea bottom from diver activities C0 L2 NEGLIGIBLE) The impact to the environment, through damage to the habitat by impact from the diver and diver equipment was considered to be at most ‘rare’, with the possibility of causing a ‘negligible’ impact. This rating was chosen as divers operate above the substrate, not making contact with the bottom. This is to their advantage as contact with the bottom may cause turbidity reducing visibility and therefore their ability to locate pearl oysters. Also, diver equipment is neutrally buoyant. Divers have deck tenders to monitor their lines and assist in ensuring that contact with the substrate does not damage equipment and hinder diving operations. This, in turn, ensures that the substrate is not negatively impacted. 5.3.3.2 ANCHORING Rationale for Inclusion: Pearl oyster vessels do not anchor in the course of daily fishing but need to anchor at night when the crew and skipper are on standby. The impact on the benthic habitat from such anchoring is assessed here.
Application to Environment Australia for the Pearl Oyster Fishery
Department of Fisheries, W.A. October 2002 70
ERA Risk Rating: Impact on habitat by anchoring (C0 L1 NEGLIGIBLE) Pearl oyster vessels operating at remote pearl oyster fishing locations cannot afford to anchor over complex habitat for the fear of fouling the anchor and losing precious fishing time over the neap period. Therefore fishing boats anchor over sand, which has a less complex habitat that is less affected by the presence of an anchor and better meets the vessel safety requirements. 5.3.3.3 FISHING HOLDING SITES Rational for Inclusion: Subsequent to the workshop, the issue of fishing holding sites (i.e. areas where fished oysters are held) was raised. Pearl oysters are held in mesh panels and placed on the seabed for several weeks, prior to seeding operations. The panels are generally located on sandy patches close to the pearling grounds. The impact of the fishing holding sites is temporary and localised, and is therefore considered to be a NEGLIGIBLE risk.
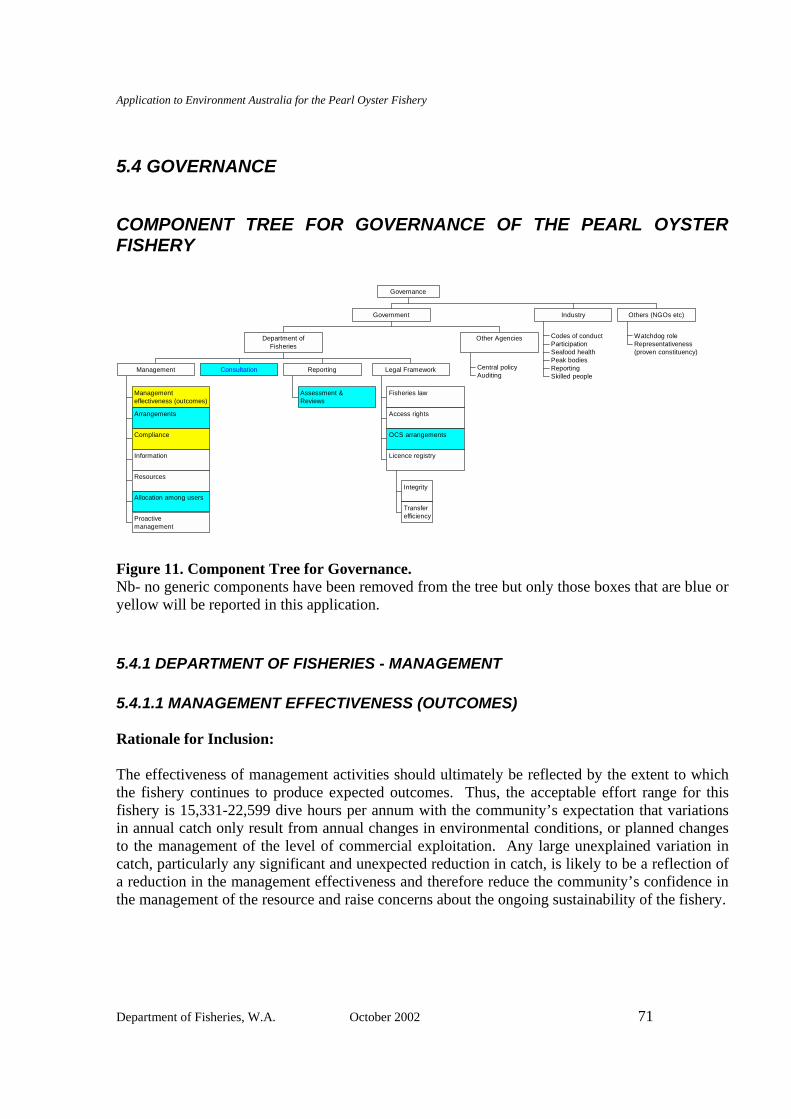
Application to Environment Australia for the Pearl Oyster Fishery
Department of Fisheries, W.A. October 2002 71
5.4 GOVERNANCE
COMPONENT TREE FOR GOVERNANCE OF THE PEARL OYSTER FISHERY
Managementeffectiveness (outcomes)
Arrangements
Compliance
Information
Resources
Allocation among users
Proactivemanagement
Management Consultation
Assessment &Reviews
Reporting
Fisheries law
Access rights
OCS arrangements
Integrity
Transferefficiency
Licence registry
Legal Framework
Department ofFisheries
Central policyAuditing
Other Agencies
Government
Codes of conductParticipationSeafood healthPeak bodiesReportingSkilled people
Industry
Watchdog roleRepresentativeness(proven constituency)
Others (NGOs etc)
Governance
Figure 11. Component Tree for Governance. Nb- no generic components have been removed from the tree but only those boxes that are blue or yellow will be reported in this application.
5.4.1 DEPARTMENT OF FISHERIES - MANAGEMENT 5.4.1.1 MANAGEMENT EFFECTIVENESS (OUTCOMES) Rationale for Inclusion: The effectiveness of management activities should ultimately be reflected by the extent to which the fishery continues to produce expected outcomes. Thus, the acceptable effort range for this fishery is 15,331-22,599 dive hours per annum with the community’s expectation that variations in annual catch only result from annual changes in environmental conditions, or planned changes to the management of the level of commercial exploitation. Any large unexplained variation in catch, particularly any significant and unexpected reduction in catch, is likely to be a reflection of a reduction in the management effectiveness and therefore reduce the community’s confidence in the management of the resource and raise concerns about the ongoing sustainability of the fishery.
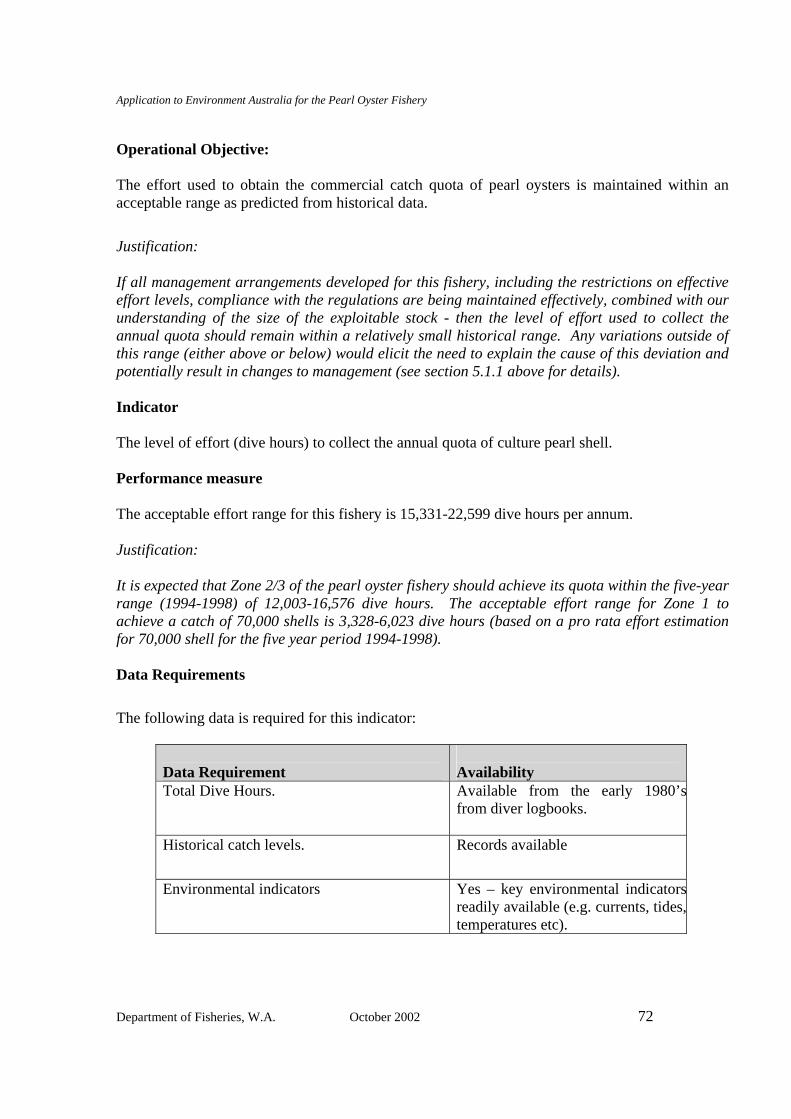
Application to Environment Australia for the Pearl Oyster Fishery
Department of Fisheries, W.A. October 2002 72
Operational Objective: The effort used to obtain the commercial catch quota of pearl oysters is maintained within an acceptable range as predicted from historical data.
Justification: If all management arrangements developed for this fishery, including the restrictions on effective effort levels, compliance with the regulations are being maintained effectively, combined with our understanding of the size of the exploitable stock - then the level of effort used to collect the annual quota should remain within a relatively small historical range. Any variations outside of this range (either above or below) would elicit the need to explain the cause of this deviation and potentially result in changes to management (see section 5.1.1 above for details). Indicator The level of effort (dive hours) to collect the annual quota of culture pearl shell. Performance measure The acceptable effort range for this fishery is 15,331-22,599 dive hours per annum. Justification: It is expected that Zone 2/3 of the pearl oyster fishery should achieve its quota within the five-year range (1994-1998) of 12,003-16,576 dive hours. The acceptable effort range for Zone 1 to achieve a catch of 70,000 shells is 3,328-6,023 dive hours (based on a pro rata effort estimation for 70,000 shell for the five year period 1994-1998). Data Requirements
The following data is required for this indicator:
Data Requirement
Availability
Total Dive Hours. Available from the early 1980’sfrom diver logbooks.
Historical catch levels. Records available
Environmental indicators Yes – key environmental indicators
readily available (e.g. currents, tides,temperatures etc).

Application to Environment Australia for the Pearl Oyster Fishery
Department of Fisheries, W.A. October 2002 73
Evaluation Summary: The total effort used to collect the quota in the 2000 season across all areas was 15,151 hours, which was below the estimated number of hours.
Catch figures in Zone 2/3 showed significantly elevated catch rate in the last two seasons, above the agreed threshold that triggers quota considerations. Due to this indication of increased stock abundance, the 2000 and 2001 quota for Zone 2/3 was increased from its traditional level by 10% to 502,500 shells (or 1000 shell/unit). If the elevated catches in 2000 were taken into account, one would expect from experience (1994-1996) that the 2001 catch rate will continue to be elevated (but not as high as 2000), reflecting the protracted time period that an elevated pulse of recruits takes to pass through the targeted size-classes of the fishery. This prediction was amended due to a declining catch rate in 2001, which lead to a decision to further reduce the Zone 2/3 quota to 479,750 shells (1050 shell/unit) in 2002. In Zone 1, approximately 66,772 shells (of the 115,000 shell TAC) were caught from wild shell stocks in 2000, with the remainder of the quota to be filled from hatchery production. The acceptable effort range for Zone 1 to achieve a catch of 70,000 shells is 3,328-6,023 dive hours (based on a pro rata effort estimation for 70,000 shell for the five year period 1994-1998). The 2002 quota was further reduced to 55,000 following indications that the catch rate had further declined in 2001. Robustness High
The data required for the indicator in most cases are readily available and the estimates of effort and catch are robust. Fisheries Management Response Current: The current management arrangements are listed below. Future: The Department is doing further work to both improve the measurement of fishing efficiency and understand the relationship between environmental factors and catch. The agency will continue to use input controls in management for the pearling industry to adjust for variations in fishing efficiency and continue to develop the predictive models to improve the reliability of the predictions. There is a recognised need to document the uptake of GPS/plotter technology and seasonal variance in diving conditions such as visibility, to assess how catch rate is affected by factors other than shell abundance.
Application to Environment Australia for the Pearl Oyster Fishery
Department of Fisheries, W.A. October 2002 74
Actions if Performance Limit is Exceeded: For Zone 2/3, if the level of effort used to collect the quota is less than the acceptable range this probably reflects a larger available stock of culture shell and the quota may be increased for the following season. Similarly, if the level of effort is larger than the acceptable range then there is likely to be relatively less culture shell available in the fished areas and the quota for the following season is likely to be reduced. If Zone 1 is not able to achieve its quota within this acceptable effort range then additional management controls would be recommended to ensure adequate numbers of oysters flow through to the breeding stock in all sections of Zone 1. This will mean that pearling companies may need to rely on greater quantities of hatchery-produced shell from the facilities established for that purpose, and work on a reduced wild stock catch quota on ever-stricter spatial controls. Comments and Action The pearl oyster stocks underpinning the fishery in Zone 2 (88% of total pearl oyster catch in 2000) continue to provide an elevated level of production to support this major Western Australian industry. The new FRDC funded project, which seeks to determine the predictability of the relationship between numbers of spat of P. maxima on adult oysters (piggyback spat) and future catch rates will potentially give the fishery data on abundance of upcoming stock. This information would greatly assist managers in determining quota allocations, as there is currently a heavy reliance on retrospective catch data to determine future management controls. In a fishery that targets pearl oysters for approx 3 years once they reach legal size, projections based on retrospective catch data can underestimate and overestimate available stock. External Driver Check List The level of recruitment of pearl oysters varies amongst years probably due to climatic/oceanographic effects. In addition, diving conditions (current, visibility etc.) vary amongst years, which affects the catch rate and hence the level of effort needed to collect the quota. 5.4.1.2 MANAGEMENT ARRANGEMENTS Rationale for Inclusion: The pearling industry in Western Australia is governed under the Pearling Act 1990, Pearling (General) Regulations 1991 and Ministerial Policy Guideline No. 17 – the Pearl Oyster Fishery Ministerial Policy Guidelines and Ministerial Policy Guideline No. 8 “Assessment of applications for authorisations for Aquaculture and Pearling in coastal waters of Western Australia” (MPG8). In addition, the Pearl Oyster Translocation Protocol outlines the disease minimisation policies relevant to the movement of pearl oysters into, within and out of the state. The Enzootic Diseases Amendment Regulations 1999 are also relevant in this regard.
Application to Environment Australia for the Pearl Oyster Fishery
Department of Fisheries, W.A. October 2002 75
(It should be noted that the Pearling Act applies only to Pinctada maxima. Management of other pearl oysters is governed by the Fish Resources Management Act 1994.) The Pearling Act does not include a statement of objectives and no management plan exists for the fishery. However, the Pearl Oyster Fishery Ministerial Policy Guidelines outline the general outcomes to be achieved for the fishery and contain the basic rules of management of pearl oyster fishery. In general terms, the Ministerial Policy Guidelines aims to achieve the following outcomes as being in the better interests of the pearling industry in WA: (a) a control on the collection of pearl oysters from the wild stocks; (b) the orderly development of pearl farms; (c) the vertical integration of the industry; (d) an approach to the growth in production of pearl oysters determined by industry, and
based on sensitivity to markets; (e) market stability; (f) the retention of the pearling industry in Australian hands. The Guidelines include the following:
• a description of the zones of the fishery; • the allocation of quota between the 16 licensees in the fishery; • guidelines on the provision of pearl oysters for research; • guidelines on the transfer of quota; • guidelines on the distance that must be maintained between pearl farm leases and holding
areas; • guidelines on the area of water that may be taken up by pearl farm leases; • guidelines on the administration of the hatchery options/hatchery quota system; • guidelines on the translocation of pearl oysters and use of quarantine sites; • guidelines on foreign investment in the industry; and • reference to a code of practice for diving.
Ministerial Policy Guideline No. 8 outlines the process for public consultation with respect to applications for pearl farm leases. Currently, the Pearling Act and Ministerial Guidelines are under review. The government’s response to the outcomes of the National Competition Policy (NCP) review of the Pearling Act will be incorporated into a new Pearling Act. The PIAC has also been established under the provisions of the Pearling Act, to provide the Minister for Fisheries and the ED with independent advice with respect to management of the pearl oyster fishery.
Application to Environment Australia for the Pearl Oyster Fishery
Department of Fisheries, W.A. October 2002 76
Operational Objective In consultation with the PIAC and other stakeholders, periodically review the legislation, regulations and Ministerial policy guidelines to ensure the management framework remains relevant and aligned with the fishery’s management objectives. Justification:
To have an effective and understandable plan for the management of this fishery.
Indicator The extent to which the management arrangements and supporting documentation addresses each of the issues and has appropriate objectives, indicators and performance measures, along with the planned management responses Performance Measure This should be 100%. Evaluation No formal evaluation of the management of the pearl oyster fishery against the general outcomes listed above has been completed. However, a review of the pearling legislation has recently been completed as part of the NCP review of the pearling industry. The Government has recently announced its decision with respect to NCP and a number of changes to the management arrangements for the industry are now being implemented. The PIAC has established a working group to review the legislative framework for pearling. This review process, culminating in a new Pearling Bill, is likely to be completed by the end of 2003. In addition to other issues, the review of the Pearling Act will look at how to incorporate issues dealing with broader community interests in the use of marine resources, as well as sustainability of the fishery. Robustness Currently medium, as no formal management objectives have yet been specified for the fishery. However with the proposed changes to the management arrangements for this fishery flowing from the NCP review, it is expected that the robustness of the management for the fishery will improve. Fisheries Management Response Although the Pearling Act 1990 does not contain a clear statement of management objectives, the legislation and related regulations and policy guidelines do represent a comprehensive set of fisheries management controls that appear to be performing well in what has been a developing
Application to Environment Australia for the Pearl Oyster Fishery
Department of Fisheries, W.A. October 2002 77
fishery. The fact that many of the management arrangements are not yet contained within legislation is one of the main reasons why the current Act is under review. The security of the rights to participate in the fishery, in particular, is an issue, which will be addressed as part of the current review of the legislation. The regulations assigned to the legislation details the enforcement and compliance of the fishery. Comments and Action The industry has been in a significant development phase and has been managed in a dynamic and consultative way (i.e. responds readily to changed circumstances). Industry has readily responded to change where there has been evidence of the need for such measures. The pearling industry has a very high level of confidence in the Department’s research activities and there is generally a very good relationship between industry members and the Departmental managers and research scientists. The management arrangements (quota) and the commercial success of the pearling industry encourages companies to be somewhat risk averse and inclined to a very conservative, long-term approach to managing the fishery (particularly given their level of investment). External Driver Check List Government’s response to NCP review of industry. Price of pearls on global market. Community attitudes to pearl farm leases. 5.4.1.3 COMPLIANCE Rationale for Inclusion: Effective compliance is vital to achieve the management objectives of any fishery. The Department spends around $1.3 million on enforcement and compliance monitoring in the pearl oyster fishery. The compliance program consists of a mix of sea patrols, hatchery inspections, covert surveillance and education programs. Operational Objective To have sufficiently high levels of compliance with the Pearling Act and regulations. Justification: The activities of the participants in the fishery need to be sufficiently consistent with the management framework and legislation to make it likely that the expected outcomes and objectives of the fishery will be achieved.
Application to Environment Australia for the Pearl Oyster Fishery
Department of Fisheries, W.A. October 2002 78
Indicators The levels of compliance with the legislation, including the estimated level of illegal activity. Degree of understanding of rules governing operation of the fishery by licensees and the broader fishing community. Performance Measure These are under development as part of the FRDC project on Fisheries Compliance Risk Assessment. Data Collection Requirements and Processes Random inspections of hatcheries, pearl farm leases and holding and dump sites. Ongoing collection of data on illegal activities. Comparative data on the relative effectiveness of certain compliance techniques. Evaluation In 2000/01 there were a total of 22 offences dealt with by the prosecution section of the Department under the Pearling Act and Regulations. Of these twenty-two offences, the fishery aspect of the Pearling industry committed seven. During 1999/2000, a staff commitment equivalent to 4.6 officers based in Broome and Karratha delivered the compliance program monitoring across all zones of the Pearl Oyster fishery. Field officers based in Karratha and Broome patrol from Exmouth Gulf (Zone 1) to the Kimberley development zone (Zone 4). Patrols to verify compliance with tagging and associated logbook systems utilise diving inspections, aircraft, both large and small departmental patrol vessels and industry boats. The majority of at-sea inspections and patrols are carried out using the Department of Fisheries ocean-going patrol vessel, with small agency vessels being used as dive platforms. Several companies have now converted their hatchery options to quota and there has been an increase in the quantity of hatchery-reared shell being used for seeding operations in lieu of wild stock. Furthermore, companies have continued to increase production of hatchery-reared shell and the compliance focus shift to the monitoring and control of this product has increased. Major compliance issues are the verification of shell numbers and size prior to seeding operations, and the movement of hatchery shell within and also between farms. Regular nursery site audits are conducted to monitor hatchery shell grow out and to verify progress for the conversion of hatchery options to hatchery quota. Approvals to allow the use of hatchery shell for technician training and for mantle tissue in seeding operations have also increased compliance requirements in this area.

Application to Environment Australia for the Pearl Oyster Fishery
Department of Fisheries, W.A. October 2002 79
Comments and Action The Department will continue to provide high standard compliance service to the Pearl Oyster fishery and industry. With the completion of the FRDC compliance study, there will be a review of the activities that are undertaken, the indicators that should be measured and the performance measures that will be used to gauge success. The legislative review is also considering options for management, which may assist with more targeted compliance activities. External Driver Check List Changes to technology that may facilitate an increase in the level of non-compliance. Changes to non-fisheries legislation (National Competition Policy) may impact upon the Department’s ability to restrict activities in a way that assists compliance. 5.4.1.4 ALLOCATION AMONG USERS Rationale for Inclusion: There are no recreational or indigenous components to the fishery.
DEPARTMENT OF FISHERIES - LEGAL ARRANGEMENTS 5.4.2.1 OCS ARRANGEMENTS Rationale for Inclusion: The Offshore Constitutional Settlement (OCS) arrangements between Western Australia and the Commonwealth Government of 1988 established that it is the sole responsibility of the State of Western Australia to manage the pearl oyster fishery. The OSC “was developed to simplify legal arrangements for the management of fisheries operating in both State and Commonwealth waters” (Anon., 1988). This OCS agreement, jointly signed by Ministers Kerin, for the Commonwealth Government, and Grill for Western Australia, prescribes that all pearl oyster fishing in Western Australia out to the limit of the AFZ is under the jurisdiction of WA. This simplified the management of the fishery from the previous system where jurisdiction was split between WA within 3 nm of the coast and the Commonwealth, outside of this area. Operational Objective To uphold the existing jurisdictional arrangements for the management of this fishery.

Application to Environment Australia for the Pearl Oyster Fishery
Department of Fisheries, W.A. October 2002 80
Indicators Approaches from the Commonwealth Government to alter the existing OCS. Performance Measure Maintenance of the existing responsibility of the State for the management of the fishery. Data Requirements None specific. Evaluation The current jurisdictional arrangements are appropriate given the distribution of the pearl oysters and the good track record that exists under these arrangements for the management of the pearl oyster fishery. Robustness Very high. Fisheries Management Response The Department has successfully managed the pearl oyster fishery for many years and sees no reason to alter the jurisdictional arrangements that currently exist as they relate to pearl oysters. Comments and Action No action required. External Driver Check List Pressure to change any of the OCS arrangements.
5.4.3 DEPARTMENT OF FISHERIES - CONSULTATION 5.4.3.1 CONSULTATION Rationale for Inclusion: The Pearling Act and Ministerial Policy Guideline No. 8 contain certain requirements with regard to consultation that must be undertaken in the course of managing the fishery. The management of the pearl oyster fishery is based around an extensive consultation and communication process.
Application to Environment Australia for the Pearl Oyster Fishery
Department of Fisheries, W.A. October 2002 81
The PIAC plays a crucial role in the development of policies relating to management of the fishery and the industry overall, particularly management of the wildstock fishery and hatchery production. Currently, the membership of the PIAC is under review as to whether there is a need to expand and broaden the level of expertise of the group. The public is given a significant role in the decision-making processes surrounding lease applications, through the Ministerial Policy Guidelines 8 processes. Operational Objective To administer a consultation process that is in accordance with the requirements of the Pearling Act and allows for the best possible advice from all relevant stakeholders to be provided to the decision maker (Minister/ED) in a timely manner. Indicators The ED conforms to the consultation requirements of the Pearling Act and Ministerial Policy Guidelines. The level to which licensees consider that they are adequately and appropriately consulted. Performance Measures Advice provided to the Minister following each PIAC meeting. Production and circulation of Chairman’s reports to all stakeholders. Adherence to annual planning cycle. Proper consultation procedures have been followed in any amendment of any Ministerial Policy Guidelines. Public meeting held annually in Broome. Data Requirements Views on the PIAC and related consultation processes collected from stakeholders at each annual public meeting. Documentation of the formal consultation procedures followed when an amendment to a policy guideline is made. Evaluation Consultation on management of the pearl oyster fishery is conducted in an open, accountable and inclusive environment where all sectors of the industry and the Departments managers collectively identify and discuss appropriate courses of action. Decision makers take due notice of advice provided on the basis of this consultation and give reasons for decisions which vary from consultation-based advice.
Application to Environment Australia for the Pearl Oyster Fishery
Department of Fisheries, W.A. October 2002 82
Robustness Medium The consultation process is relatively well understood within industry, but not so well understood by external stakeholder groups. There are relatively low levels of participation from the various external stakeholder groups.
Fisheries Management Response The Department has strong links to the pearling industry through a formal statutory process. The PIAC has certain functions under section 38 of the Pearling Act which are to provide advice to the Minister or the Executive Director in relation to:
• the management, control, protection, regulation or development of pearling or hatchery activities;
• pearl oysters; • pearl oyster hatcheries; and • pearl oyster fisheries, in the State, or in Western Australian waters or in any waters
adjacent thereto. To that end, PIAC plays an integral part in guiding the service delivery of the Department and setting priorities for management, research, enforcement and development. The Department does, however, also provide independent advice to the Minister on the implications of any proposal from PIAC, or other body. Membership of the PIAC is not specified in the Act, but currently is comprised of 11 members appointed by the Minister with the exception of the ED, including an independent Chairperson; four individuals nominated by industry, two individuals with industry experience appointed by the Minister and three individuals independent of the industry (appointed by the Minister). Terms of appointment are usually for three years however members can seek to be reappointed for additional terms. PIAC has a number of sub-committees, which are chaired by PIAC members but appointments are made from various external groups including industry groups to assist the expertise make up of the sub-committees. In addition, the Department must, in accordance with section 33 of the Act, consult with the Pearl Producers Association on some matters relating to appeals. Comments and Action Mechanisms for industry input to the management of the pearl oyster fishery are well established and are functioning effectively. To date, the public have not been as actively involved in management issues, however, the level of input, particularly regarding pearl farm leases, is increasing, as members of the public become more familiar with the consultative processes available.

Application to Environment Australia for the Pearl Oyster Fishery
Department of Fisheries, W.A. October 2002 83
The PIAC and the Department will continue to educate and inform the public and industry members about management issues relevant to the fishery, to ensure that the community understands and supports the management approaches adopted. External Driver Check List Growing community interest and concern regarding sustainable fisheries management, conservation issues, management of protected species, marine area usage and maintenance of wilderness values.
5.4.4 DEPARTMENT OF FISHERIES- REPORTING 5.4.4.1 ASSESSMENTS AND REVIEWS Rationale for Inclusion: It is important that the outcomes of the fisheries management processes administered by the Department for the pearl oyster fishery are available for review by external parties. It is also important that the community is sufficiently informed on the status of this fishery, given that it is utilising a community resource. The reports that are currently provided annually are:
• The State of the Fisheries Report; • The Annual report to the Auditor General; • Irregular reports include the Parliamentary Inquiry; • The ESD report, FRDC project reports and scientific publications; and • This application to EA.
There is a long-term plan to have the entire system of fisheries management audited by the WA Environmental Protection Agency. Operational Objective Current - To report annually to the Parliament and community on the status of the fishery. Future - To develop an independent audit process for the fishery at appropriate intervals. Indicators
• The extent to which external bodies with knowledge on the management of fisheries resources have access to relevant material.
• Level of acceptance within the community. Performance Measure General understanding and acceptance of the management system by the community.
Application to Environment Australia for the Pearl Oyster Fishery
Department of Fisheries, W.A. October 2002 84
Data Requirements The majority of data required to generate reports is already collected in the course of pursuing resource management objectives. The Department conducts an annual survey of the community with respect to its opinion on the status of the State’s fisheries and their attitudes to the performance of the Department. Where appropriate, the Department of Fisheries reviews its management strategies for the fishery following the annual survey. Evaluation The Department has implemented more than one process to report on the performance of this fishery and in doing so has ensured that the community has access to this information. The Department has been the recipient of a number of awards for excellence for its standard of reporting - Premiers Awards in 1998, 1999 for Public Service excellence, Category Awards in Annual Reporting in 1998, 1999, 2000; Lonnie Awards in 2000, 2001. Current Reporting Arrangements for this fishery include: State of Fisheries Annual reporting on the performance of the fishery against the agreed objectives within the STATE OF THE FISHERY REPORT. This document is available in hard copy format but is also available from the Department’s web site in PDF format. Annual Report A summary of this report is presented within the Department’s Annual Report and is used in some of the Performance Indicators that are reviewed annually by the Office of the Auditor General (OAG). The OAG also periodically audits the information (both the data and processes) used to generate these reports. ESD The Department is currently completing a full ESD report (of which the material presented in this application is a subset), which will cover not only the environmental aspects of the fishery but the full social and economic issues. Once completed this too will be available from the web site. Reports to Industry Each year, the status of the resource, effectiveness of current management, predictions for future years catches and any proposals for alterations to arrangements are presented to members of the pearling industry and the public at an open meeting in Broome. Robustness High
Application to Environment Australia for the Pearl Oyster Fishery
Department of Fisheries, W.A. October 2002 85
Fisheries Management Response Current: For many years the Department has produced substantial and high quality documents that report on the operation of the Department and the status of its fisheries (including the pearl oyster fishery) – these reports are the Annual Report and the State of the Fisheries. Future: In line with the new Commonwealth Government requirements the Department of Fisheries is in the process of developing a tri-partite memorandum with the Western Australian Environmental Protection Authority and the Office of the Auditor General to conduct a regular audit of the fishery. Comments and Action The processes already established and those new external review processes that are all but established ensure that there will be many opportunities for appropriateness of the management regime and the importantly the results it produces to be reviewed. External Driver Check List The assessments provided by independent review bodies and the community.
Application to Environment Australia for the Pearl Oyster Fishery
Department of Fisheries, W.A. October 2002 86
6. REFERENCES Benzie, John A.H. and Smith, Carolyn (2002) Pearl oyster genetics. FRDC project report 97/344. AIMS Townsville, 112p. Fisheries WA (2002) State of Fisheries Report, 2000-2001. Fletcher, W.J. (2001) Policy for the Implementation of Ecologically Sustainable Development for Fisheries and Aquaculture within Western Australia. Fisheries Management Paper, No. 157. Fletcher, W., Chesson, J., Sainsbury, K., Fisher, M., Hundloe, T., and Whitworth, B. (2002) Reporting on Ecologically Sustainable Development: A “How to Guide” for fisheries in Australia. FRDC project report 2000/145 (in press). Friedman, K. and Skepper, C. (2000) Pearl Oyster Fishery Status Report. In: Penn, J. (Ed) State of the Fisheries Report Western Australia 1999-2000. pp.137-141. Hynd, J.S. (1955) a revision of the Austrlian pearl-shells, genus Pinctada (Lamellibranchia). Australian Journal of Marine and Freshwater Research 6: 98-137. Joll, L.M. (1996) Stock evaluation and recruitment measurement in the W.A. pearl oyster fishery. FDWA Final report to Fisheries research and Development Corporation for project 92/147. 62 pages. Kaspar, H.F., Gillespie, P.A., Boyer, I.C. and Mackenzie, A.L. (1985) Effects of mussel aquaculture on the nitrogen cycle and benthic communities in Kenepuru Sound, Marlborough Sound, New Zealand. Marine Biology 85: 127-136. Knuckley, I.A. 1995. Settlement of Pinctada maxima (Jameson) and other bivalves on artificial collectors in the Timor Sea, Northern Australia. Journal of Shellfish Research 14:411-416. Malone, F.J., Hancock, D.A., Jeffriess, B. (1988) Final report of the Pearling Industry Review Committee. Fisheries Management Paper, Fish. Dept. W.A. No. 17, 216pp. Niquil N., Pouvreau S., Sakka A., Legendre L., Addessi L., Le Borgne R., Charpy L. and Delesalle B. (2001) Trophic web and carrying capacity in a pearl oyster farming lagoon (Takapoto, French Polynesia). Aquatic Living Resources 14: 165-174.
Application to Environment Australia for the Pearl Oyster Fishery
Department of Fisheries, W.A. October 2002 87
Rose, R.A., Dybdahl, R.E. and Harders, S. (1990) Reproductive cycle of the western Australian Silverlip Pearl Oyster, Pinctada maxima (Jameson) (Mollusca: Pteriidae). J. Shellfish Res. 9 (2): 261-272. Rose, R.A. and Baker, S. (1994) Larval and spat culture of the Western Australian silver-or goldlip pearl oyster, Pinctada maxima (Jameson) (Mullusca:Pteriidae). Aquaculture 126:35-50. Souchu, P., Vaquer, A., Collos, Y., Landrein, S., Deslous-Paoli, J., and Bibent, B. (2001) Influence of shellfish farming activities on the biogeochemical composition of the water column in Thau lagoon. Mar Ecol Prog Ser. 218: 141-152. Souchu, P., Mayzaud, P., and Roy, S. (1991) Environment physicochimique et trophique d'un site myticole, Iles-de-la Madeleine (Quebec). I. Evolution estivale des composes de l'azote, du phosphore et du silicium.In: Therriault JC (ed) Le golfe du Saint-Laurent: petit ocean ou grand estuaire? Publ Spec Can Sci Halieut Aquat 113:209-218.
Application to Environment Australia for the Pearl Oyster Fishery
Department of Fisheries, W.A. October 2002 88
APPENDIX 1 – ATTENDEES LIST
A1.1 WORKSHOP 1 Attendees: * denotes individuals who were invited but did not attend. Andrew Bartleet, Department of Fisheries Astrida Mednis, Environment Australia Brett McCallum, Pearl Producers Association Brian Jones*, Department of Fisheries Chris Simpson*, Department of Conservation and Land Management Colin Chalmers, Department of Fisheries WA David Mills, Paspaley Pearls Edwina Davies-Ward*, Marine and Coastal Community Network Emma Hopkins*, Department of Environment Protection Dr. Fred Wells*, WA Museum Greg Finlay, Department of Fisheries WA Guy Leland*, WA Fishing Industry Council Harriet Patterson, Conservation Council of WA Jane Prince*, Consultant Jennie Cary, Department of Conservation and Land Management Dr. Jim Penn, Department of Fisheries WA Jo Bunting, Department of Fisheries WA Dr. John Humphrey*, Northern Territory DPIF John Kelly, Paspaley Pearls Dr. Kim Friedman, Department of Fisheries WA Mark Jefferies*, Department of Environment Protection Matin Holtz*, Recfishwest Mick Buckley*, former Executive Officer for PPA Dr.Murray Barton*, Northern Territory DPIF Dr. Nic Dunlop, Conservation Council of WA Nick Miller*, Maxima Pearls Owen Bunter, MG Kailis Paul Bowers*, Aboriginal Lands Trust Penny Arrow*, Arrow Pearl Co. Dr. Peter Jernakoff, International Risk Consultants Dr. Rick Fletcher, Department of Fisheries WA Robin Clark, Department of Fisheries WA Ross Gould, Department of Fisheries WA Ross McCulloch*, WA Tourism Commission Sarah Brown, International Risk Consultants Steve Riley*, Kimberley Charter Boasts Association
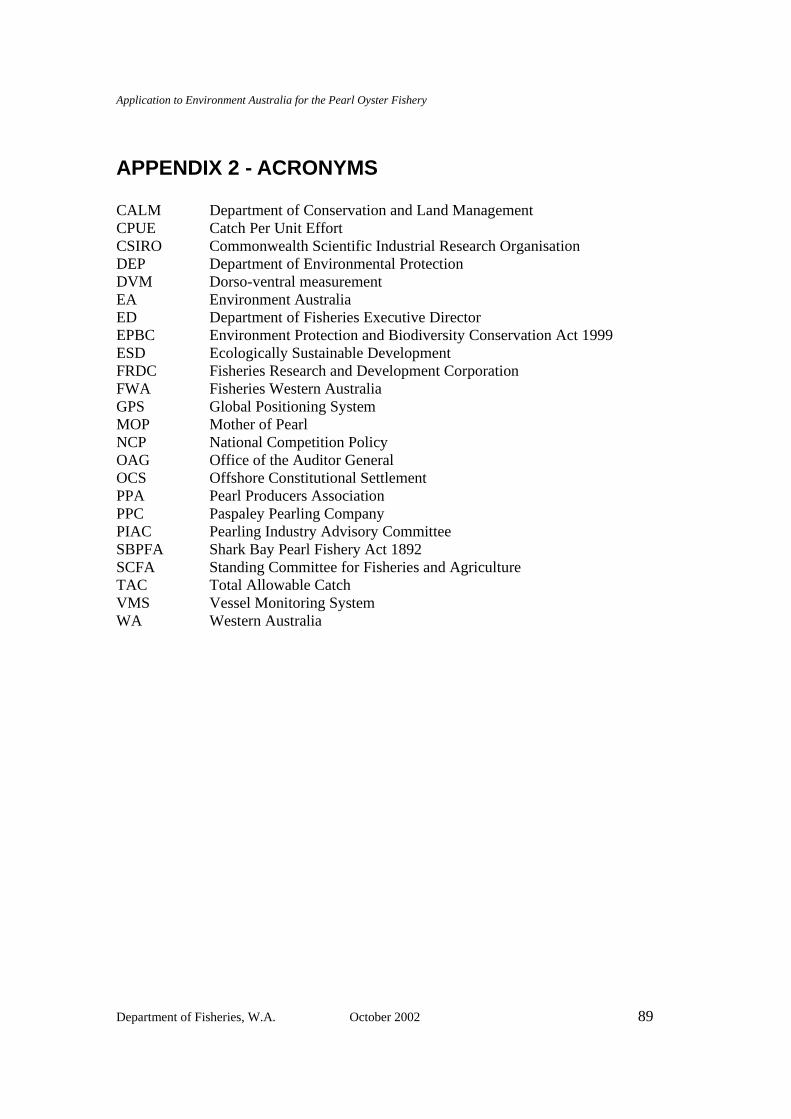
Application to Environment Australia for the Pearl Oyster Fishery
Department of Fisheries, W.A. October 2002 89
APPENDIX 2 - ACRONYMS CALM Department of Conservation and Land Management CPUE Catch Per Unit Effort CSIRO Commonwealth Scientific Industrial Research Organisation DEP Department of Environmental Protection DVM Dorso-ventral measurement EA Environment Australia ED Department of Fisheries Executive Director EPBC Environment Protection and Biodiversity Conservation Act 1999 ESD Ecologically Sustainable Development FRDC Fisheries Research and Development Corporation FWA Fisheries Western Australia GPS Global Positioning System MOP Mother of Pearl NCP National Competition Policy OAG Office of the Auditor General OCS Offshore Constitutional Settlement PPA Pearl Producers Association PPC Paspaley Pearling Company PIAC Pearling Industry Advisory Committee SBPFA Shark Bay Pearl Fishery Act 1892 SCFA Standing Committee for Fisheries and Agriculture TAC Total Allowable Catch VMS Vessel Monitoring System WA Western Australia
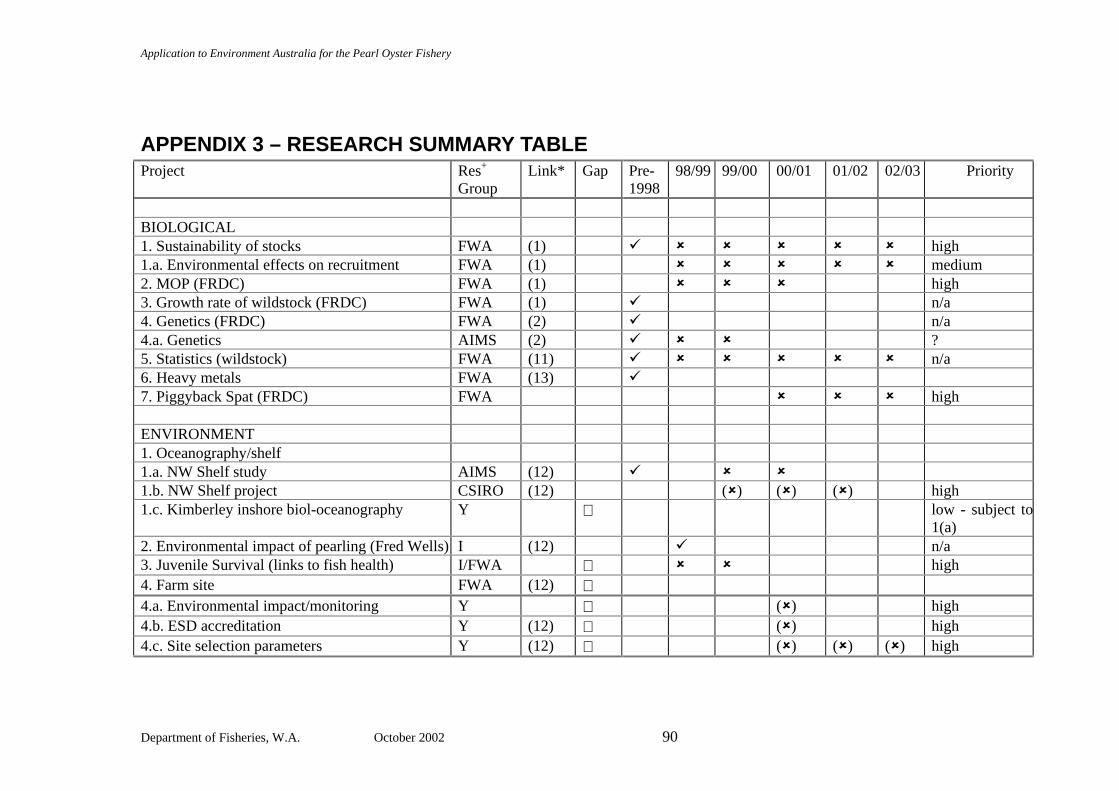
Application to Environment Australia for the Pearl Oyster Fishery
Department of Fisheries, W.A. October 2002 90
APPENDIX 3 – RESEARCH SUMMARY TABLE Project Res+
Group Link* Gap Pre-
1998 98/99 99/00 00/01 01/02 02/03 Priority
BIOLOGICAL 1. Sustainability of stocks FWA (1) ! " " " " " high 1.a. Environmental effects on recruitment FWA (1) " " " " " medium 2. MOP (FRDC) FWA (1) " " " high 3. Growth rate of wildstock (FRDC) FWA (1) ! n/a 4. Genetics (FRDC) FWA (2) ! n/a 4.a. Genetics AIMS (2) ! " " ? 5. Statistics (wildstock) FWA (11) ! " " " " " n/a 6. Heavy metals FWA (13) ! 7. Piggyback Spat (FRDC) FWA " " " high ENVIRONMENT 1. Oceanography/shelf 1.a. NW Shelf study AIMS (12) ! " " 1.b. NW Shelf project CSIRO (12) (") (") (") high 1.c. Kimberley inshore biol-oceanography Y ∗ low - subject to
1(a) 2. Environmental impact of pearling (Fred Wells) I (12) ! n/a 3. Juvenile Survival (links to fish health) I/FWA ∗ " " high 4. Farm site FWA (12) ∗ 4.a. Environmental impact/monitoring Y ∗ (") high 4.b. ESD accreditation Y (12) ∗ (") high 4.c. Site selection parameters Y (12) ∗ (") (") (") high
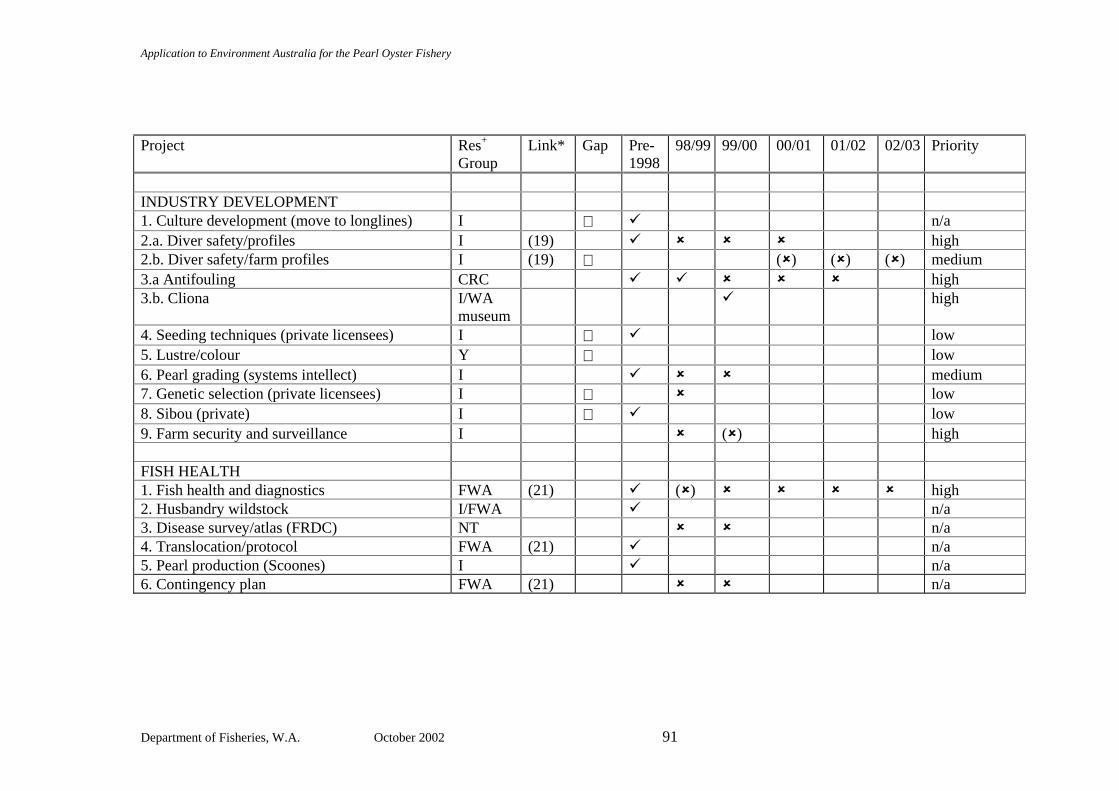
Application to Environment Australia for the Pearl Oyster Fishery
Department of Fisheries, W.A. October 2002 91
Project Res+
Group Link* Gap Pre-
1998 98/99 99/00 00/01 01/02 02/03 Priority
INDUSTRY DEVELOPMENT 1. Culture development (move to longlines) I ∗ ! n/a 2.a. Diver safety/profiles I (19) ! " " " high 2.b. Diver safety/farm profiles I (19) ∗ (") (") (") medium 3.a Antifouling CRC ! ! " " " high 3.b. Cliona I/WA
museum ! high
4. Seeding techniques (private licensees) I ∗ ! low 5. Lustre/colour Y ∗ low 6. Pearl grading (systems intellect) I ! " " medium 7. Genetic selection (private licensees) I ∗ " low 8. Sibou (private) I ∗ ! low 9. Farm security and surveillance I " (") high FISH HEALTH 1. Fish health and diagnostics FWA (21) ! (") " " " " high 2. Husbandry wildstock I/FWA ! n/a 3. Disease survey/atlas (FRDC) NT " " n/a 4. Translocation/protocol FWA (21) ! n/a 5. Pearl production (Scoones) I ! n/a 6. Contingency plan FWA (21) " " n/a
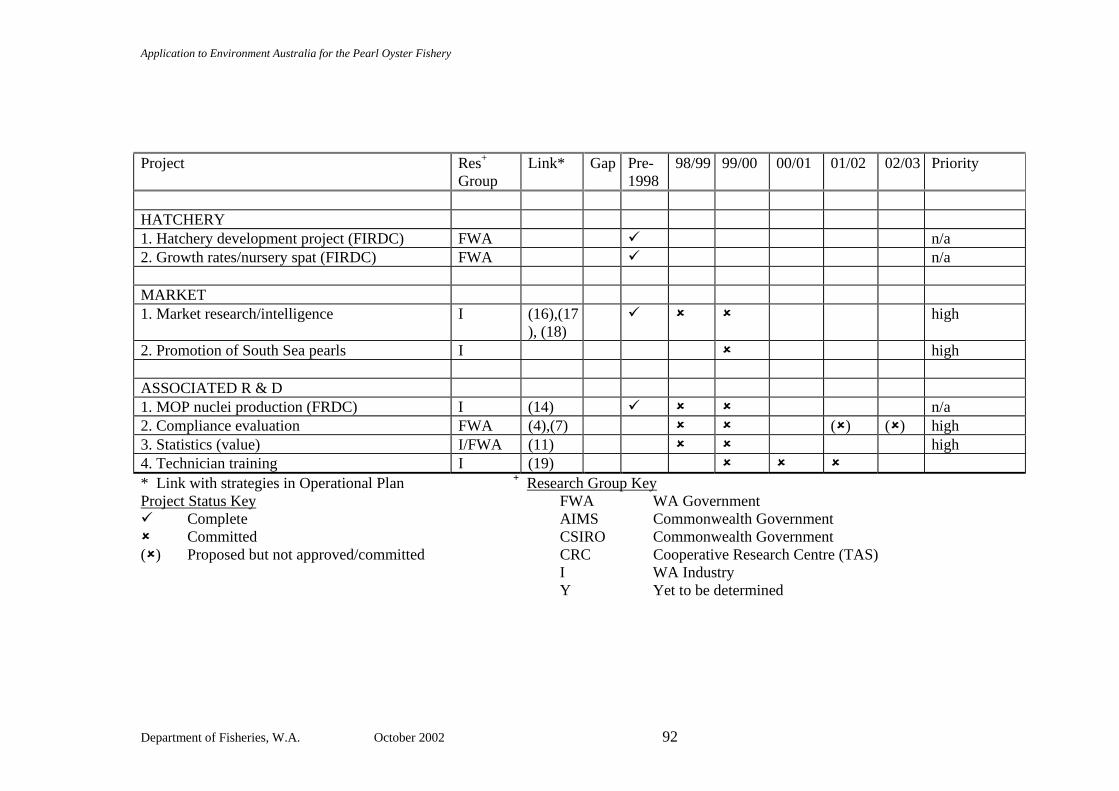
Application to Environment Australia for the Pearl Oyster Fishery
Department of Fisheries, W.A. October 2002 92
Project Res+
Group Link* Gap Pre-
1998 98/99 99/00 00/01 01/02 02/03 Priority
HATCHERY 1. Hatchery development project (FIRDC) FWA ! n/a 2. Growth rates/nursery spat (FIRDC) FWA ! n/a MARKET 1. Market research/intelligence I (16),(17
), (18) ! " " high
2. Promotion of South Sea pearls I " high ASSOCIATED R & D 1. MOP nuclei production (FRDC) I (14) ! " " n/a 2. Compliance evaluation FWA (4),(7) " " (") (") high 3. Statistics (value) I/FWA (11) " " high 4. Technician training I (19) " " " * Link with strategies in Operational Plan + Research Group Key Project Status Key FWA WA Government ! Complete AIMS Commonwealth Government " Committed CSIRO Commonwealth Government (") Proposed but not approved/committed CRC Cooperative Research Centre (TAS) I WA Industry Y Yet to be determined
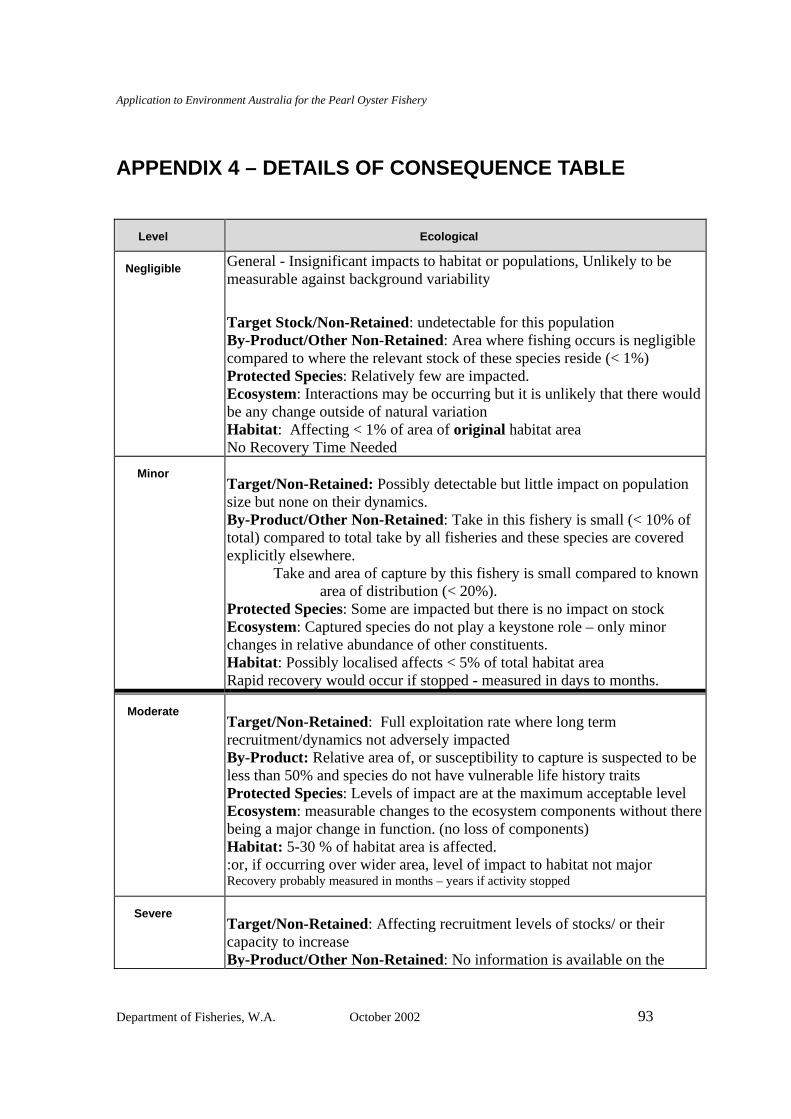
Application to Environment Australia for the Pearl Oyster Fishery
Department of Fisheries, W.A. October 2002 93
APPENDIX 4 – DETAILS OF CONSEQUENCE TABLE
Level Ecological
Negligible General - Insignificant impacts to habitat or populations, Unlikely to be measurable against background variability
Target Stock/Non-Retained: undetectable for this population By-Product/Other Non-Retained: Area where fishing occurs is negligible compared to where the relevant stock of these species reside (< 1%) Protected Species: Relatively few are impacted. Ecosystem: Interactions may be occurring but it is unlikely that there would be any change outside of natural variation Habitat: Affecting < 1% of area of original habitat area No Recovery Time Needed
Minor Target/Non-Retained: Possibly detectable but little impact on population size but none on their dynamics. By-Product/Other Non-Retained: Take in this fishery is small (< 10% of total) compared to total take by all fisheries and these species are covered explicitly elsewhere.
Take and area of capture by this fishery is small compared to known area of distribution (< 20%).
Protected Species: Some are impacted but there is no impact on stock Ecosystem: Captured species do not play a keystone role – only minor changes in relative abundance of other constituents. Habitat: Possibly localised affects < 5% of total habitat area Rapid recovery would occur if stopped - measured in days to months.
Moderate Target/Non-Retained: Full exploitation rate where long term recruitment/dynamics not adversely impacted By-Product: Relative area of, or susceptibility to capture is suspected to be less than 50% and species do not have vulnerable life history traits Protected Species: Levels of impact are at the maximum acceptable level Ecosystem: measurable changes to the ecosystem components without there being a major change in function. (no loss of components) Habitat: 5-30 % of habitat area is affected. :or, if occurring over wider area, level of impact to habitat not major Recovery probably measured in months – years if activity stopped
Severe Target/Non-Retained: Affecting recruitment levels of stocks/ or their capacity to increase By-Product/Other Non-Retained: No information is available on the
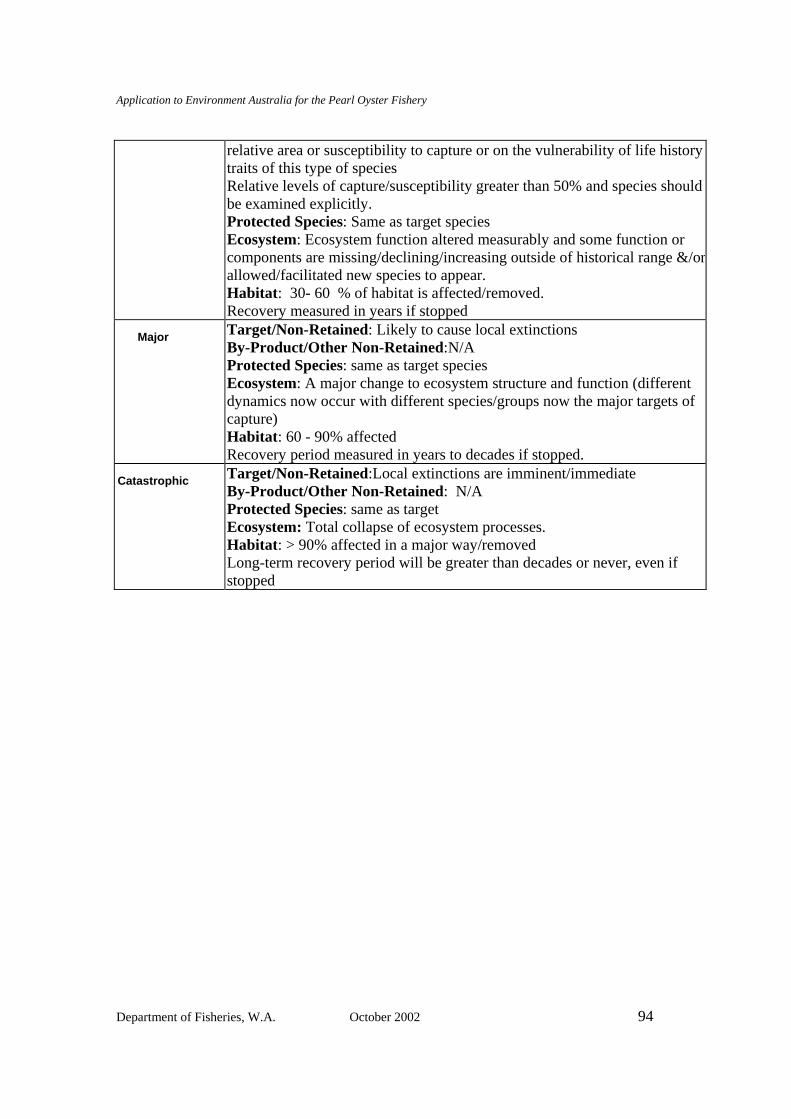
Application to Environment Australia for the Pearl Oyster Fishery
Department of Fisheries, W.A. October 2002 94
relative area or susceptibility to capture or on the vulnerability of life history traits of this type of species Relative levels of capture/susceptibility greater than 50% and species should be examined explicitly. Protected Species: Same as target species Ecosystem: Ecosystem function altered measurably and some function or components are missing/declining/increasing outside of historical range &/orallowed/facilitated new species to appear. Habitat: 30- 60 % of habitat is affected/removed. Recovery measured in years if stopped
Major Target/Non-Retained: Likely to cause local extinctions By-Product/Other Non-Retained:N/A Protected Species: same as target species Ecosystem: A major change to ecosystem structure and function (different dynamics now occur with different species/groups now the major targets of capture) Habitat: 60 - 90% affected Recovery period measured in years to decades if stopped.
Catastrophic Target/Non-Retained:Local extinctions are imminent/immediate By-Product/Other Non-Retained: N/A Protected Species: same as target Ecosystem: Total collapse of ecosystem processes. Habitat: > 90% affected in a major way/removed Long-term recovery period will be greater than decades or never, even if stopped