Embed Size (px)
Citation preview

Volume 4, Issue 7, July – 2019 International Journal of Innovative Science and Research Technology
ISSN No:-2456-2165
IJISRT19JUL331 www.ijisrt.com 1314
Application Total Productive Maintenance (TPM) To
Increase the Effectiveness of Engines with OEE as A
Tool to Measure in the Industrial Packaging Cans
Mohamad Nasir, Haryo Tuwanggono Morrow, Erry Rimawan
Master Program in Industrial Engineering, Univeristy Mercubuana Abstract:- Competition in the tin packaging industry is
very tight so that every industry must improve the
effectiveness of the machine in order to survive,
compete and dominate the market. The purpose of this
study is to calculate the level of effectiveness of the
engine, the factors causing low effectiveness, the root of
the problems encountered and the settlement related to
the treatment machine in the packaging industry cans.
The approach used to solve the problems is Total
Productive Maintenance. Total Productive Maintenance
is one of the elements of manufacturing aimed at
improving the effectiveness of the machine. The main
indicator is the Overall Equipment Effectiveness TPM.
OEE calculation results in this study was 65.43%. Six
Analysis of the dominant big losses by using Pareto
diagram is setup and adjustment losses amounted to 62,
84% and reduced speed losses amounted to 29.18%. To
find the root problems using techniques 5 way and
further illustrated by the cause and effect diagram. The
problem faced by the industry is a factor
kemasankaleng machine maintenance. Implementation
of Focused Improvement and Autonomous
Maintenance is expected to resolve the problem and
improve efektivitasmesin.
Keywords:- Total Productive Maintenance, Overall
Equipment Effectiveness, Six Big Losses, Cause and Effect
Diagram, Autonomous Maintenance, Focused
Improvement.
I. INTRODUCTION
Tin packaging company is a company that makes
cans from tinplate raw material to be canned. Tin
packaging business is the type of business to business, in
which the product will be used by other industries. Tin
packaging company in Indonesia, almost all of the
Domestic Capital Company (DCI). With many industry players cans provide competition in this business is getting
tougher. It can be seen from the competition in quality
products, competitive prices among so many tin packaging
company in Indonesia.
In the increasingly fierce competition, the main thing
that should be prioritized by the tin packaging industry in
order to survive, compete and market share is to improve
performance in the production line. Therefore, the
management of the tin packaging industry in this company
leaders must know what things are able to support
performance improvement in the production line. The
smoothness of the company's production lines can not be
separated from the company management's ability to
manage resources dayaperusahaan.
Hardware is the main resource that can not be
separated from the overall system resources of the
company. The ability of the company in the application of a
technology must be supported by the ability to maintain the
equipment associated with this technology. Equipment is
also related to the effectiveness of the machine so that in the long term will relate to the achievement of corporate
goals.
Another factor underlying the increase in engine
maintenance and quality control is a very fast changing
market and the many variations of the products offered.
This will automatically increase the role of maintenance /
care machines and required complex equipment and
adaptation technologies as well as resulting in lower
production cost, and who can win the competition in
quality will ensure success in the implementation of new management systems.
In order to reduce production costs, the company
must operate more effectively and efficiently. Companies
are required to devise strategies in various aspects of its
operations in an effort to improve the efficiency and
effectiveness of operations. In connection with these
efforts, the company must keep a close watch their waste-
waste that arises as the product defect, a large maintenance
costs and so on. In this regard, a company must prioritize
activities that seek quality products to be compliant with
evaluate the actual performance, comparing the performance targets and handle the differences yangterjadi.
Costs arising from the quality control / quality will be
enhanced to maintain a minimum so that the total costs
incurred for the production of balanced outcome. Things
can be done by the company is the implementation of
maintenance of the machine that allowed the company
reduces waste pemborosan- for their defective products,
delays and congestion of machinery and production
equipment interference. And this means lower costs of
production processes in line with the maintenance of the quality, the establishment of a conducive teamwork and
education and training for employees.
Along with changes in the environment makes
maintenance and quality control require a good handling. In

Volume 4, Issue 7, July – 2019 International Journal of Innovative Science and Research Technology
ISSN No:-2456-2165
IJISRT19JUL331 www.ijisrt.com 1315
this condition needs an effective policy in production
strategy, especially concerning the maintenance or quality
control. Turnover condition requires equipment capacity
more intensive supervision, quality control and cost
control.
Total production, quality of production and
maintenance of machinery in a production process is inter-
related problems, as a real traditional three issues
separately. Each has their own needs to grow and develop
even factually there is dependence on each other. It is in the process of modern production prefers to merge so that it
will obtain optimal results.
Fig 1:- Current Achievement 2011sampai productivity in
2012 as well as the target KPI Productions same period.
(Source: Report of the tin packaging industry production in 2011 to 2012)
The percentage of defective products machinery
General Line since 2011 to 2012 has decreased but still
outside the target set. The gap between actual and target in
the second half of 2012 was 0.95%
Fig 2:- Actual reject 2011sampai Achievement 2012 and
targets KPI Productions same period. (Source: Industrial
Production Report canned Period 2011 to 2012)
Therefore, the level of productivity and product
quality based not only on the production process again, but
on the performance of a production machine. For the
performance of a production machine remains in good
condition, there should be an optimal maintenance, such as
preventive and corrective maintenance of a controlled,
combining engine maintenance with the relevant sections in
the production line.
Problems encountered engine parts General Line cans
packaging industry is the high percentage of downtime on the machine GL1, GL2 and GL3 unplanned caused by
damage to the engine suddenly, set up, change over,
preparation and quality checked. During 2011 to 2012 the
downtime caused by nothing material was 0.35%. And
downtime caused no adalahtidak operator recorded in the
report. The following table is a machine down time is the
period 2011 to 2012. The gap between the target and actual
downtime in the second half of 2012 was 13.51%.
Fig 3:- charts the actual down time 2011sampai
Achievement 2012 and targets KPI Engineering same
period.
(Source: Production Report Period 2011 to 2012)
This resulted in the number of products produced
output is less than the target set in the material that
eventually shortage of customers. Another result is a
quality product that is not in accordance with customer
expectations will cause problems for the customer.
The cause of the problems above, among others, lack
of focus and attention on the company's overall engine
maintenance system. Tin packaging industry is trying to
focus on improving service to customers with a focus on product delivery on time, high quality and providing
services / service according to customer wishes.
To overcome the problems of the machine necessary
measures to support improve engine performance by the
application of Total Productive Maintenance (TPM). This
is in line with several previous studies that states that the
TPM method to increase Overall Equipment Effectiveness
(OEE). Several previous studies TPM (Almenazel, 2010, p.
522; Ottosson, 2009, p. 48; Hegde et al, 2009, p. 32; Imani
et al, 2011, p.5) states that the TPM will increase the effectiveness of the machine, improve communication, and
teamwork.

Volume 4, Issue 7, July – 2019 International Journal of Innovative Science and Research Technology
ISSN No:-2456-2165
IJISRT19JUL331 www.ijisrt.com 1316
II. LITERATURE REVIEW
A. system PemeliharaanMesin
Management and Maintenance According Wiremen (2003, p.60) states that twenty
years ago, executive management focused on increasing
profits in a short period of time, at the expense of physical
assets. Companies that best practice to develop planning
strategies, build strength, and completeness of the
organization. One area of concern of the company is a
function of maintenance / asset management. Treatment is
very important that the company be konpetitif in
pasardunia.
If the maintenance function be a contributing factor in
increasing konpetitif companies in order to survive,
management must change the way towards maintenance. If
this malakukan management, the company has a strong
maintenance team, it contributes to the profits. So the
management will focus on maintenance organizations.
Equipment service level Equipment service level is an indicator of the amount
of time in which the equipment available to the service of
production and operation. Total equipment service level is
closely linked to the cost of care, and determine the type of
maintenance that followed. Based Wireman (2003, p. 14),
there are five maintenance philosophy is:
1. ReactiveMaintenance.
2. CorrectiveMaintenance,
3. PreventiveMaintenance.
4. PredictiveMaintenance. 5. MaintenancePrevention.
B. Total Productive Maintenance (TPM)
DefinisiTPM
According to the Japanese Institute of Plant Engineers
(jipe) in Sharma et al. (2006, hal.262) TPM is defined a team-based maintenance strategies to maximize the
effectiveness of the equipment by setting the overall
productive maintenance system includes all equipment into
use, extend the life of equipment associated with the
planning, use and maintenance as well as the involvement
of everyone, starting from the top executive management to
the production operator. This explains a relationship of
synergy of all functions of the organization and make
productive maintenance TPM through motivational
management and small group activities are voluntary. TPM
requires organiasasi horizontal type structure with minimal levels of authority instead of the vertical type with many
tahapanotorisasi.
Opinion Nakajima (1988) in Sharma et al. (2006, p
262) states that there are five elements of the TPM concept
is;
1. TPM aims to maximize the effectiveness of the
equipment
2. TPM establishes a system of maintenance equipment
sunguh- really selamadipakai
3. TPM implemented by many departments in
sebuahperusahaan
4. TPM involves every employee, from top management
to employees at shoopfloor
5. TPM is an aggressive strategy focused on significant
improvement in function and design of production
equipment.
Citing Nakajima (1998) in Sharma et al. (2006, p 262)
the word "total" in the TPM have the following meanings:
1. TotalEffectiveness.
2. TotalMaintenance,
3. TotalParticipation.
According to Wireman (2005, p. 179) states that the
definition of the TPM is not only the activities of maintenance or improvement program but is an operational
philosophy where everyone in the company understands
that the individual performance impact on the capacity of
the equipment.
Opinion Borris (2006, p. 4) the definition of the
practice of engineering TPM is a good and simple. TPM
requires root-cause analysis solution. Good at hospital
environment and environmental equipment service, both
require that ensures failure does not happen again. And the
expected result is the impact to customers and profits. TPM version explains that fits on the development of modern
industry and can adapt to several types of equipment not
only in industrial alatberat.
TujuanTPM MDG Goal to eliminate all equipment losses of
pengoperation this case to ensure that the overall equipment
efficiency (OEE) maximum. Eliminating these losses is the
responsibility of each department. Therefore, the TPM is an
operational philosophy. All departments have an impact on
utilization in the handling of equipment, all parts of the
TPM program.
Fig 4:- Illustration of the philosophy of TPM (Source:
Wireman (2005, p. 180))
Shown in Figure 4 all departments should focus on
how the impact on the equipment. This image as illustrated
process of Total Quality Management (TQM), TQM focus on the product, but TPM focus on equipment. If a
company's success with TQM methods, it is usually
successful with TPM process.
If TPM is operational philosophy, have specific goals

Volume 4, Issue 7, July – 2019 International Journal of Innovative Science and Research Technology
ISSN No:-2456-2165
IJISRT19JUL331 www.ijisrt.com 1317
and objectives. Interest TPM (also called pillars of TPM)
and four supporting initiatives. That goal is the continuous
improvement of the effectiveness of the equipment. An
enterprise wants and make sure that companies in the world
have the same equipment or process for poduk kind, which
produces the maximum. In other words, a competitor that
has a low cost producer, will win and leave the company's
competitors yanglain.
Now Low cost producer in a competitive market is
determined by how to organize work and focus on getting more output with the same assets with competitors. This is
the focus of filosofiTPM.
TPM philosophy is supported by four activities
improvement 1. Improvements effective treatment danefisiensi 2. Focus on the management of the equipment from the
early design and maintenance prevention
3. Training to enhance the ability of personnel
whichengages
4. Involving operators in daily equipment maintenance
eight PilarTPM Based Borris (2006, p. 7) states now TPM is a
summary of eight different sections called eight pillars of
TPM. Each pillar has a different area of responsibility but
each area of overlap. Eighth pillars are:
1. Initial PhaseMaintenance
2. Health danSafety 3. Education andTraining
4. AutonomousMaintenance
5. Planned Maintenance 6. QualityMaintenance
7. focused Improvement
8. Supportsystems
Fig 5:- Eight pillars of TPM (Source: Borris (2006, p 8))
TimTPM Based on Wilson (2002, p. 266) The most
fundamental concept of TPM is the TPM team. There are
several teams that are in the plant consists of a production
operator, maintenance and engineering. As operator who
operates the machine, set up and maintenance of
manufacturing assets in the department or area (Figure 5), everyone supported each other in suatuperusahaan.
The team focused on the conditions and performance
of the plant, tooling, And the work environment.
Fig 6:- Membership TPM Team (Source: Wilson (2002, p. 266))
TPM is essential Tim involve the production and
maintenance personnel. Failures and problems in plant and
machinery will be identified and solved by looking in terms
of production and engineering side, if approved
laludilaksanakan practical solutions.
C. Overall Equipment Effectiveness (OEE) Opinion Wireman (2005, p.182) is OEE is a
benchmark for some of the TPM. If the real goal of TPM is
the continuous improvement of OEE, it makes OEE as the
main indicator in the implementation of TPM. OEE is the
product of equipment availability, performanace efficiency,
and quality rate.
OEE indicator-based flexible because it can be used
daily, weekly, and even monthly. OEE is an indicator of the
strength of this very necessary for a company that started
the initiative TPM. The weakness of the OEE does not
exist, except for one application. OEE is a measure of the
effectiveness of the machine and not to the effectiveness of
all the factories, department, or company. OEE calculation
originally performed by operators and maintenance people
to assess the development of engine repair. It is difficult at
the factory level. To be effective, this indicator should
focus on orientasimesin.
Opinion Borris (2006, p.28) TPM indicator is to
measure overall equipment effectiveness (OEE). OEE is a
breakdown of equipment which is not only derived from
production losses, but also running below capacity, and
produce the results that defects have a negative impact. To
make sure a machine is ready to run and can manufacture
products according to standards on maximum results and
machinery used in good condition. This measure with OEE
TPM.

Volume 4, Issue 7, July – 2019 International Journal of Innovative Science and Research Technology
ISSN No:-2456-2165
IJISRT19JUL331 www.ijisrt.com 1318
OEE is the result of the multiplication of availability,
performance, and quality.
OEE = availability x performance x quality
(2.1)
Equipmen tAvailability Based Borris (2006, p.29) states availabiliy is a
comparison of the amount of time of the equipment can
produce a good running of the total can be running.
According to Nakajima (1988, p 22) availability is the ratio
of operating time downtime shared outside loading time. In the mathematical formula as follows:
Management and decide the definition of the term
downtime and make procedures counting down time. It
must match the industry standard. It would be very useful if
it can be traced individually, it helps to look for the root
cause breakdown. How much time it takes to test, check,
setup, wait for results, waiting for engineers, operators
wait, wait for the product, the production run, change over,
and peralatandowntime.
Material troubleshooting where losses came from a
group that will be addressed / resolved. Supposedly
performance analysis is based on the availability for weekly or total availability issue. TPM interested in maximizing
production and every person in the company responsible
for this.
An argument explains that for routine quality test run
is to show a lack of confidence about the performance of
the engine. The machine is not reliable, do not trust the
reliability of the engine, or other reasons. TPM purpose is
to avoid unnecessary tests, all problems should be resolved.
TPM is taknik cross-function, not maintenance techniques. Is a good cooperation between maintenance and
production operators closest to the product. The aim is to
improve the total productivity of the equipment, not only
care alone. Losses can occur due to bad schedule or losses
due to set up and test.
losses others due to change over the product. Eg
change over the product A to product B, it was confirmed
that the product B can be run on this line. After stopping
the product A, then the machine stops and cause downtime
also change over from product A to product B. To reduce
down time change over need for cooperation between maintenance and production operators to shorten
changeover time.
Performance Equipment If road equipment with output lower than capacity, it
means it has little equipment problem. Equipment road at
half the speed that equates to 50% of downtime. According
Nakjima (1988, p 23) Performance efficiency is the product
of the net operation rate and operating speed rate. In the
mathematical formula is as follows:
Quality Product Opinion Borris (2006, p.31) states that if the quality
of the product is less than 100%, there is a problem. If the
low quality / product fails to get to the customer, this means
not only the risk of production down but losing customers.
If the engine fails to produce the goods according to the
standard, it will often do tests to catch the earlier failure.
Interest 100% always bisadicapai.
The definition of the product quality is the ratio
between the number of products that can be received by the
total number of products have been manufactured (including products that can not be accepted). According to
Nakajima (1988, p 25) quality rate of product in the
mathematical formula as follows:
According to McKone et al. (1996) in Wakjina and
Singh (2012, p.29) mentions the TPM standard is as
follows:
availability > 90%
- PerformanceEfficiency > 95%
- qualityproduct > 99% So the ideal OEE is> 85% as a world class performance.
D. Six BigLosses
TPM key objective is to eliminate or minimize all
losses associated with manufacturing systems to improve
OEE. In the early stages of TPM initiative focused on
eliminating six big losses, which resulted in a low OEE this
case according to Gupta et al., 2001 in Ahuja and Khamba (2008, p. 724). Six Big losses include:
1. Equipmentfailure
2. Set up and adjustmentloss
3. Idling and minorstoppage 4. Reduced speed
5. Defect in process
6. Redued yield
TPM aims to increase OEE by eliminating the root causes of losses. OEE calculation is affected by the six
major losses (each with six big losses) as shown below:

Volume 4, Issue 7, July – 2019 International Journal of Innovative Science and Research Technology
ISSN No:-2456-2165
IJISRT19JUL331 www.ijisrt.com 1319
Fig 7:- Six big losses
(Source: Ahuja and Khamba (2008, p.17))
In Scdanibbio (2008, p. 6) by Nakajima has identified
six types of losses related to equipment, commonly called
the Six Big Losses. In detail will be described below.
EquipmentFailure / Breakdwon Damage to machinery / equipment is an improvement
equipment that has not been previously scheduled
waktuyangdiserapolehkerugianiniterlihatdariseberapa of the
time is wasted due to damage to the equipment / machinery
production. In the category of downtime losses which
absorbs some time the production process (loading time).
The disadvantage of this breakdown will result in time
wasted resulting in losses for the company due to reduced
volumeproduksi.
Set up and AdjustmentLoss Set up and adjustment losses an absorption time for
installation, adjustment and parameter adjustment of the
machine to obtain the desired specifications at the first
began to produce certain components. Also the time
required for the activities to replace a type of product to the
next product type for the next production. In other words
the total needed the non-producing machine in order to
change their equipment (dies) for the following product
types to be produced a product suitable for further
processing.
Idling and Minor Stoppages (Losses Due to Operate
Without Burden Nor Due to Stop a moment)
idling is the equipment operates without producing a
product or in other words the process air. Idling losses due
to operating without a load and equipment / machinery to
operate without generating products. Minor stoppages
losses is equipment pausing appear if external factors
resulting in equipment / machine stops repeatedly.
Idling and minor stoppages the losses due to the
cessation of the equipment because of delays in the supply
of materials or absence of carriers available although WIP. These problems are often overlooked as the elimination of
unwanted products corresponding problems encountered,
so that zero idling and minor stoppages being a primary
goal. Both of these losses are part contributing to the speed
looses.
ReducedSpeed Reduced speed a loss that occurs due to equipment
operated under the standard speed. Is the difference
between design speed with the actual operating speed. The
reason for the difference in speed can be problems of
mechanical, electrical, or any quality problems. The decline in production speed arise if the actual operating speed is
smaller than the speed of the machine that has been
designed to operate in normal speed. The decline in the
pace of production, among others caused by:
a. Designed engine speed can not be achieved because of
the change in the type of product or material that is
incompatible with the equipment / machinery which is
used
b. Production speed equipment / machinery decreased due
to operator not knowing how
many normal speed equipment / machinery actually be
met c. Deliberately reduced production speed to prevent
problems on the equipment / machinery and the quality
of the product if it is produced at production speed
lebihtinggi.
DefectinProcess (KerugiankarenaProdukCacat
maupunkarenaKerjaProdukDiprosesUlang)
Defect in process is time wasted to produce defective
products and defective products generated will result in the
loss of material, reducing the amount of production,
increase production waste and rework costs. Losses due to rework including labor costs and time required to process
and rework or repair the defective product. Only a small
amount but this condition could cause greater problems.

Volume 4, Issue 7, July – 2019 International Journal of Innovative Science and Research Technology
ISSN No:-2456-2165
IJISRT19JUL331 www.ijisrt.com 1320
Reduced Yield (Losses Start Time Production to Achieve
Stable Production Conditions)
Reduced yieled is the material losses incurred during
the time required by the equipment / machinery
untukmenghasilkanprodukbarudengankualitasproduk which
had been expected. Losses incurred depending on factors
such as the state of unstable operation, improper handling,
and installation of equipment / machinery, molds (dies), or
the operator does not understand the activities of the
production process.
According to a book written Davis Wilson (2002, p.
364) explains that to maximize the effectiveness of the
equipment means that the best means to restore the capital
assets of the business. To improve the effectiveness of the
machinery and equipment used must be measured and
reduced losses during machine operation. TPM can
eliminate the six big losses, it is the fokusTPM.
E. Techniques PerbaikanKualitas In the book by Goetsch and Davis (2013, p.245) states
that employees within an organization in any department,
employees can use several techniques favorable quality improvement and the company will be able to survive by using the techniques earlier. In the implementation of
quality engineering technique was between employees and
management melakukancross-function. The basic techniques of quality that can be used
among other things Pareto Chart, Diagram Cause and
Effect (Cause and Effect Diagram), sheets of checks (Check Sheet), Histogram, diagram deployment (Scatter
diagram), flowcharts (Run Chart, and map control (control
chart), and analysis of process capability. but that will be
described in a review of the literature is not all, just dealing
with topics that will be discussed, including the techniques
used are pareto diagrams and causality (cause and effect
diagram). Where such techniques have utility that can stand
alone as well as mutual help between one technique
yanglain.
Pareto Charts Pareto diagram first introduced by an expert on the
Italian economy is Alfredo Pareto (1848-1923). Pareto
diagram is a drawing that sort of classification data from left to right from the biggest to the smallest. This helps to
solving the most important problems to be resolved (the
highest rank) and up to unnecessary problems resolved (the
lowest rank). Pareto diagram can also identify the most
important issues of quality improvement efforts and
provide guidance on priorities allocate resources to resolve
the problem.
Fig 8:- Pareto Charts
(Source: Goetsch and Davis (2013, p. 246))
Pareto diagram also can also be used to compare the
conditions of the process, for example mismatch process before and after the corrective action on the process. The
Pareto Principle is a formula of 20:80, which is 20% of
quality problems caused losses sebesar80%.
Use of the Pareto diagram is a process that never
ends, for example from the image above, the target
refinement is the problem A. If successful improvement
program in the future then the target refinement is the
problem B. Similarly, subsequent to the C, D and so on so
that repairs made secaramenyeluruh ,
Cause and EffectDiagram Cause and effect diagram also called causal diagram
developed by Dr. Kaoru Ishikawa in 1943, so it is often
called the Ishikawa diagram. Ishikawa diagram outlines and symbols showing the relationship between the result and
the cause of a problem. The diagram is used to determine
the effects of problems to further remedial action taken. Of
these consequences then searched several possible causes.
The cause of this problem comes from various sources, for
example, human, material, machine, method, environment
and measurement.

Volume 4, Issue 7, July – 2019 International Journal of Innovative Science and Research Technology
ISSN No:-2456-2165
IJISRT19JUL331 www.ijisrt.com 1321
From some of the above causes can be reduced to
some sources smaller and detailed, for example, can be
derived from human concern, skill, thoroughness and
education. To search for various causes can be reached by
brainstorming involving all parts involved in the process.
To find the root cause of the problem using the technique
of asking for trouble as much as five times the so-called
five way.
Besides being used to find the main cause of the
problem, cause and effect diagrams can also be used to find the cause of a minor who is part of penyebabutama.
III. RESEARCH METHODOLOGY
In detail the purpose of research titled Proposed
Implementation of TPM in order Increasing the
Effectiveness OEE Machine as a Measure Tool in the tin
packaging industry are as follows:
1. To know and analyze the extent of engine maintenance
is done now with the expected level of effectiveness of
the machine tin packaging industry.
2. To find and cultivate several factors that affect the
menggunakaan OEE calculation and analysis of six
biglosses 3. To determine the actual root of the problem that
occurred in GeneralLine.
4. As management guidelines to direct the entire
organization in the tin packaging industry towards
improving OEE by application of TPM in order to
compete, survive danberkembang.
5. 3.1 Research Variables
According Sugiyono (2007, p. 33) the relationship
between one variable with other variables in the study were
divided into: 1. Independent variable (Independent variables) are
variables that affect other variables (dependent
variable). The independent variable in this study is the
rate Availability, Performance Rate and Quality Rate.
2. Dependent variable (The dependent variable) is a
variable that is influenced by other variables
(independent variable). Dependent variable in this
research is the Overall Equipment Effectiveness (OEE).
Problem Formulation and Determining Objectives
The next research step is identifying the problem.
Problems encountered later identified to assess alternative solutions. Issues to be discussed is how to increase the
effectiveness of the machine. This is done by identifying
the factors that caused the engine failure and provide
suggestions as an initial step TPM implementation on the
tin packaging industry. After the Problem Formulation
stages of research is to determine statement of research
goals.
Method of collecting data According to Tika (2006, p. 57) states the research
data collected consist of primary data and secondary data.
The method used in the data collection process research are
as follows:
1. Methods of data collection through Depatemen report
Production, Engineering (Maintenance), and QA and
PPIC.
2. Observation, conducted to obtain data relating to the
time machine breaks down time, set up, vacancy occurs,
and some other things related to the equipment /
machinery used in the production process. The study
was conducted by observing and researching the mechanical condition of the research sites directly
through yangtersedia parameters.
3. Interview, the interview conducted this study to the
Operational Head, Engineering / Maintenance, QA and
PPIC to obtain primary data on the practice of program
implementation and maintenance of more detailed data
yangberkenaan with the implementation of corporate
policies in the field of operations.
Processing and analysis of data
Stage of data processing and analysis conducted this
study are:
1. Overall calculation EquipmentEffectiveness
2. Calculation six biglosses 3. Analyzing the data by using Pareto diagram.
The results of data processing is used to analyze the
extent of the effective use of production machines and also
to obtain settlement of problem issues such as:
1. analysis perhitunganOEE
2. Analysis of six biglosses 3. analysis paretodiagram
4. Analysis of the cause and effectdiagram 5. Proposed troubleshooting is done based on a literature
review and processing as well as analisisdata.
Based on the analysis and description of the results of
the measurement of Overall Equipment Effectiveness
(OEE) a number of conclusions. Having obtained some conclusions then given beberapasaran.
IV. DATA DANANALISIS
A. Production Process
In carrying out the process of the production of tin packaging industry, part
General Line # 3 is divided into several phases:
Volume 4, Issue 7, July – 2019 International Journal of Innovative Science and Research Technology
ISSN No:-2456-2165
IJISRT19JUL331 www.ijisrt.com 1322
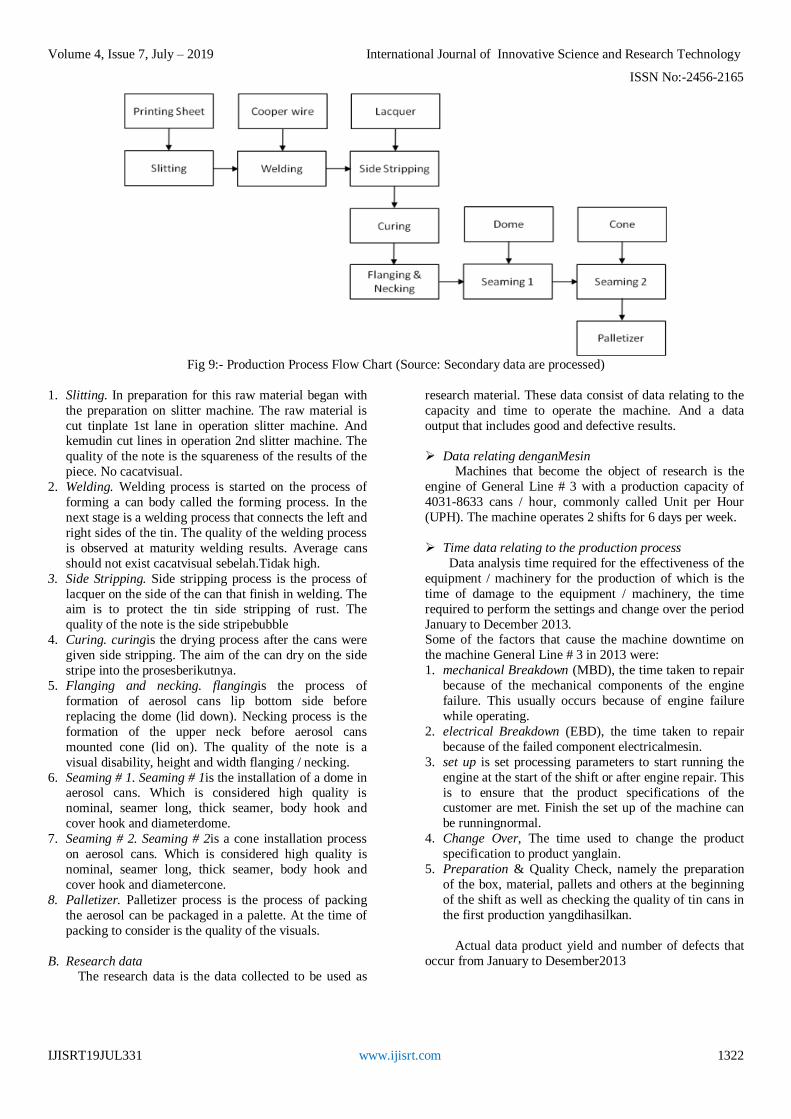
Fig 9:- Production Process Flow Chart (Source: Secondary data are processed)
1. Slitting. In preparation for this raw material began with
the preparation on slitter machine. The raw material is
cut tinplate 1st lane in operation slitter machine. And kemudin cut lines in operation 2nd slitter machine. The
quality of the note is the squareness of the results of the
piece. No cacatvisual.
2. Welding. Welding process is started on the process of
forming a can body called the forming process. In the
next stage is a welding process that connects the left and
right sides of the tin. The quality of the welding process
is observed at maturity welding results. Average cans
should not exist cacatvisual sebelah.Tidak high.
3. Side Stripping. Side stripping process is the process of
lacquer on the side of the can that finish in welding. The aim is to protect the tin side stripping of rust. The
quality of the note is the side stripebubble
4. Curing. curingis the drying process after the cans were
given side stripping. The aim of the can dry on the side
stripe into the prosesberikutnya.
5. Flanging and necking. flangingis the process of
formation of aerosol cans lip bottom side before
replacing the dome (lid down). Necking process is the
formation of the upper neck before aerosol cans
mounted cone (lid on). The quality of the note is a
visual disability, height and width flanging / necking.
6. Seaming # 1. Seaming # 1is the installation of a dome in aerosol cans. Which is considered high quality is
nominal, seamer long, thick seamer, body hook and
cover hook and diameterdome.
7. Seaming # 2. Seaming # 2is a cone installation process
on aerosol cans. Which is considered high quality is
nominal, seamer long, thick seamer, body hook and
cover hook and diametercone.
8. Palletizer. Palletizer process is the process of packing
the aerosol can be packaged in a palette. At the time of
packing to consider is the quality of the visuals.
B. Research data The research data is the data collected to be used as
research material. These data consist of data relating to the
capacity and time to operate the machine. And a data
output that includes good and defective results.
Data relating denganMesin Machines that become the object of research is the
engine of General Line # 3 with a production capacity of
4031-8633 cans / hour, commonly called Unit per Hour
(UPH). The machine operates 2 shifts for 6 days per week.
Time data relating to the production process
Data analysis time required for the effectiveness of the
equipment / machinery for the production of which is the
time of damage to the equipment / machinery, the time
required to perform the settings and change over the period
January to December 2013. Some of the factors that cause the machine downtime on
the machine General Line # 3 in 2013 were:
1. mechanical Breakdown (MBD), the time taken to repair
because of the mechanical components of the engine
failure. This usually occurs because of engine failure
while operating.
2. electrical Breakdown (EBD), the time taken to repair
because of the failed component electricalmesin.
3. set up is set processing parameters to start running the
engine at the start of the shift or after engine repair. This
is to ensure that the product specifications of the customer are met. Finish the set up of the machine can
be runningnormal.
4. Change Over, The time used to change the product
specification to product yanglain.
5. Preparation & Quality Check, namely the preparation
of the box, material, pallets and others at the beginning
of the shift as well as checking the quality of tin cans in
the first production yangdihasilkan.
Actual data product yield and number of defects that
occur from January to Desember2013

Volume 4, Issue 7, July – 2019 International Journal of Innovative Science and Research Technology
ISSN No:-2456-2165
IJISRT19JUL331 www.ijisrt.com 1323
Table 1:- Production Data Period from January to December, 2013.
From the above calculations showed that the
availability rate is the lowest in July 2013 amounted to
67.78%, the highest availability rate in March 2013
amounted to 84.88% and the average availability rate
during January to December 2013 was 76.49%
C. Effectiveness Calculation Equipment / Machinery (OEE)
To analyze the effectiveness of the equipment /
machinery used the data relating to the production process,
equipment maintenance, data on the number of production
and flawed data. In addition to the above data analysis also
analyzes availability rate, the analysis of performance rate
and quality analysis rate.
Fig 10:- Availability Rate Graph
(Source: Secondary data are processed)
Performance calculation rate Equipment
Calculation of Availability RatePeralatanProduksi
availability rate menunjukkantingkatanketersediaan
or readiness machinery / equipment
produksiuntukdigunakan in the production process. a
mesinatauperalatan production with level availability
rate high indicates that the equipment /
mesintersebutselalu in condition ready with if anytime
used.
Based on the data it can be calculated downtime
availability value rate. Below is the data for calculating the
availability rate on a production machine General Line # 3.
Some of the steps are as follows:
1. Determining the amount of time available within one
month, hours of work each month in hours. For
machinery General Line # 3 hours each month is
525jam.
2. Calculating time no schedule of the machine that the
machine is not because the production schedule of

Volume 4, Issue 7, July – 2019 International Journal of Innovative Science and Research Technology
ISSN No:-2456-2165
IJISRT19JUL331 www.ijisrt.com 1324
bagianPPIC.
3. Calculating planned maintenance time is the time
required by Engineering to perform a scheduled engine
maintenance. For machinery General Line # 3 is 14
hours per month.
4. Calculating downtime downtime and consists of
mechanical, electrical downtime, set-up and adjustment,
change over, preparation and cekkualitas.
5. Determining the time of the operation by using the
formula operation time equal to the time burdens
downtimelosses.
6. Calculating the level of availability rate with an
explanation as above.
Table 2:- Analysis of Monthly Averages Availability Rate Year 2013
(Source: Secondary data are processed)
Production
performance rate is the ratio of the quantity of
products produced with the ideal cycle time to time available to carry out the production process. Or the ratio
between the actual output with the number of products that
can be produced.
Rate performance analyzes intended to determine the
extent to which the efficiency of equipment / machines
used for the production process. This analysis includes the
following phases.
1. Calculating the cycle time period (c / t) theoretically to
produce a can that is C / T 0.417 seconds to cans of 104
mm and a C / T 0.893 seconds for the 276 mm cans. Cycle time in General Line # 3 ranges from 0.417
seconds to 0,893detik.
2. Calculating the amount of production for each period
(January to Desember2013)
3. Calculating the average operating time of the engine
General Line # 3 is used in the production process.
4. Analyzing the performance rate for each period using
data in bawahini.
Table 3:- Analysis of Average Monthly Performance Rate Year 2013
(Source: Secondary data are processed)
From the above data are at the lowest rate performance buan May 2013 aitu 84.31%. Performance

Volume 4, Issue 7, July – 2019 International Journal of Innovative Science and Research Technology
ISSN No:-2456-2165
IJISRT19JUL331 www.ijisrt.com 1325
The highest rate in January 2013 was 89.50%. And the
average performance rate in the period January to
December 2013 adalah86,55%.
Table 5:- Calculation Results Monthly Averages OEE Year 2013
Fig 11:- Graph Performance Rate
Calculation of Quality Rate Production Equipment Quality rate is the ratio that indicates the ability of the
equipment to produce products that comply with the
standards already set. Based on data from the reports of
production losses can be calculated quality value rate.
Below is the formula for calculating the value of quality
rate on machinery General Line # 3.
From the results of the calculations in Table 4.5
indicates that the level of product quality tin cans in the
packaging industry average at 98.85% figure (using
machine General Line # 3). Quality lowest rate occurred in
August 2013 in the amount of 98.12% rate and best quality
is the month of February 2013 yaitu99,41%.
month Production output (pcs) Yield losses (pcs) Rework and Reject
(pcs)
Good Product (pcs) Quality rate
(%)
January 923.024 551 6.277 916.196 99.26
February 310.603 131 1.688 308.784 99.41
March 944.534 630 5.957 937.947 99.30
April 1,142,619 758 9.606 1,132,255 99.09
may 1,059,538 785 10.649 1,048,104 98.92
June 1,369,042 965 13.846 1,354,231 98.92
July 1,361,849 969 13.883 1,346,997 98.91
Aug 1,073,033 510 19.642 1,052,881 98.12

Volume 4, Issue 7, July – 2019 International Journal of Innovative Science and Research Technology
ISSN No:-2456-2165
IJISRT19JUL331 www.ijisrt.com 1326
Sept 1,017,505 740 13.763 1,003,002 98.57
Oct 1,045,041 858 17.784 1,026,399 98.22
November 934.317 676 12.888 920.753 98.55
Dec 994.372 779 10.327 983.266 98.88
Average 98.85
Table 4:- Analysis of Average Monthly Quality Rate in 2013
(Source: Secondary data are processed)
The graph illustrates the quality rate the quality during 2013, can be seen in Figure 12.
Fig 12:- Graph Quality Rate
Three stages of analysis is the analysis of availability rate, performance rate and quality rate has passed, the next stage is to quantify the effectiveness of each period of production equipment General machine Line # 3 with the following formula:
OEE = availability rate x performance rate x quality rate
month
Availabilit y rate (%) performance
nce Rate (%)
Quality rate (%)
OEE (%)
January 84.39 89.50 99.26 74.97
February 84.44 86.46 99.41 72.59
March 84.88 86.70 99.30 73.08
April 77.18 87.19 99.09 66.69
may 69.91 84.80 98.92 58.64
June 72.38 84.31 98.92 60.37
July 67.78 85.52 98.91 57.33
Aug 78.30 86.86 98.12 66.73
Sept 79.05 86.69 98.57 67.55
Oct 75.98 86.87 98.22 64.82
November 74.91 86.55 98.55 63.90
dec 68.67 87.09 98.88 59.14
Average 76.49 86.55 98.85 65.43
Table 5:- Calculation Results Monthly Averages OEE Year 2013

Volume 4, Issue 7, July – 2019 International Journal of Innovative Science and Research Technology
ISSN No:-2456-2165
IJISRT19JUL331 www.ijisrt.com 1327
(Source: Secondary data are processed)
From the calculation of OEE in Table 5. obtained as
follows:
1. The results of calculation of OEE highest value in
January 2013 amounted to 74.97% influenced by the
value of 84.39% availability rate, performance and
quality rate of 89.50% rate99,26%
2. Instead calculation of OEE lowest value occurred in
July 2013 amounted to 57.33%, it is influenced by the
availability rate of 67.78%, 85.52% rate performance and quality rate98,91%.
3. On average OEE during the period January to
December 2013 were as follows 65.43%, it is
influenced by the average availability rate of 76.49%,
86.55% rate performance and quality rate98,85%.
4. OEE analysis of the data it can be concluded that the
value of OEE in General Line # 3 can be categorized in
sub-standard conditions of world class manufacturing.
OEE value can be regarded world class company
manufacturing with the following criteria: availabiltiy
rate of greater than 90%, the performance rate greater
than 95%, quality rate of greater than 99% and greater OEE dari85%.
Fig 13:- The graph Overall Equipment Effectiveness
D. Calculation Six BigLosses TPM aims to increase OEE by eliminating the root
causes of losses. Calculation of the percentage of the six
big losses as in the detailed description below.
Equipment Failure / Breakdown The percentage of the effectiveness of the machine is
lost due to equipment failure can be calculated with the
following formula:
equipment failure The highest was in May 2013 by
6.00%. Lowest equipment failure occurred in January,
February and August 2013 amounted to 0%, and average
equipment failure during the period of 2013 amounted to
2.40%.
set up and Adjustmentloss
Set up the percentage of downtime and loss
adjustment is sebagaiberikut:
Tin packaging industry in the monthly report said
change over the time spent on replacing or adjusting
equipment (dies) for the following product types to be
produced a product suitable for further processing.
Set up and adjustement percentage of the highest
lossses occurred in July 2013 amounted to 30.18%. Set up and adjustment lows reached in March amounted to
14.42%. And the average set-up and adjustment during
2013 was sebesar21,11%.
Idling and MinorStoppages Idle and minor stoppages the machine Genral Line #
3 during 2013 was 0%. There is no record of the material
shortage downtime / delay and operator problems.
ReducedSpeed Reduced speed of the percentage of losses can be
calculated with the following formula:
Process DefectLosses To determine the percentage of rework and defects
losses can be used as follows:

Volume 4, Issue 7, July – 2019 International Journal of Innovative Science and Research Technology
ISSN No:-2456-2165
IJISRT19JUL331 www.ijisrt.com 1328
ReducedYield
In order for a maximum equipment effectiveness
means the best means to restore the capital assets of the
business. To improve the effectiveness of the machinery
and equipment used must be measured and reduced losses
during machine operation. TPM can eliminate the six big
losses that are the focus of this case. Below is a resume six
big losses in the General Line # 3
E. Pareto Charts
Data from the six big losses made Pareto diagram
determines the priorities for improvement in Genral Line #
3. That the largest percentage of the six big losses in the
categories set up and adjustment losses amounted to
62.84%, then the category of reduced speed losses
amounted to 29.18%, 7.76% equipment failure losses,
rework and reject losses of 0.21% and reduced yield of
0.01% Last idle and minor STOPPAGE 0%. Having made
the cumulative percentage table is then created Pareto
diagram as below.
Fig 14:- Six Big Losses (Pareto Diagram)
In Figure 14 illustrates that the cumulative percentage
of> 80% at six big losses is a category set up and
adjustment losses amounted to 62.84% and reduced speed
losses amounted to 29.18%.
Based on the Pareto diagram of the six big losses, the
losses above the attention and focus on improvement in the
packaging industry can and will do troubleshooting on the
discussion.
V. DISCUSSION
Main Findings The main finding in this study is included the
discovery of OEE and six big losses which will be
described below.
First, the average OEE machinery General Line # 3
during the period January to December 2013 was
approximately 65%. OEE is the lowest in July around 57%
and the highest in January by 75%. The amount of availability, performance and quality product comparable
to a high rate and low OEE during 2013.
Second, the order of the percentage of the category of
the largest six big losses in the engine General Line # 3 is
as follows: set up and adjustment losses, reduced speed
losses, equipment failure, losses, rework and reject losses,
and reduced yield, as well as idle and minor stoppages.
Analysis of the cause of the six big factors that lead to
low losses in the engine effectiveness OEE calculation is done by using a cause and effect diagram. The analysis
carried out will be more efficient if it is only applied to the
factors of six big losses are dominant as the Pareto diagram
above 80% that had been made that is set up and
adjustment losses and reduced speed losses. Melalui this
diagram can be known causes of high set-up and
adjustment losse and the losses reduced speed in
lebihterperinci.
Analysis of influential factors to find the main cause
of six big losses need to do a qualitative analysis of the
karaketeristik man, machine, material danmethod.
A. Cause and Effect Diagram Set-up and Adjustment for
Losses
Finding the root of the real problem that occurred in
the General Line # 3 with an analysis of cause and effect
diagram to set up and adjustment losses. All set-up and
adjustment time is the time for adjustment and also time
spent on activities replace one product to the next product
type for the next production process. Using techniques Rev
5 questions is as below.
1. Man (Human). Lack of skill and competence of the
operator of machinery and equipment as set up and
adjustment.
a. Why operatorkurang skill and competence?
Because training is conducted ineffective
b. Why training is not effective? because tidakada
schedule
c. Why is not there a schedule? material tidakada d. No matter why? Because material belumdibuat basic training.
2. Machine (machine). checking parametermesin
seamer when set up and adjustment is relatively long.
a. Why a relatively long time? many it emtooling that in
setting b. Why are so many items tooling that settings?
tooling nonstandard c. Why nonstandard tooling? Because the supply of spare
parts tooling tidakada
d. Why tooling no stock? Karenaimport
require a relatively long time.
When the set-up and adjustment of the welding
machine is difficult to get the parameters yangdiharapkan
a. Why is it difficult mendapatkanparameter? Setting the running time

Volume 4, Issue 7, July – 2019 International Journal of Innovative Science and Research Technology
ISSN No:-2456-2165
IJISRT19JUL331 www.ijisrt.com 1329
b. Why when running? Between low and high speed kualitasberbeda
c. Why different quality? machine kurangstandar d. Why less standard? Many replaced with a different
material with yangawal.
3. Material. Material dome between one supplier with
another having a different quality spec that requires
special treatment when setting seamer
a. Why different specifications? Following
spesifikasipemasok b. Why follow the specifications of the supplier? Require a
relatively long time for developing new product
c. Why require a relatively long time? Not to adadrawing
d. Why there is no drawing? Because the new model requires a process that reltiflama.
4. method (Method of work). Frequency setting and
change over height. This resulted in a total time of
settinglama
a. Why high-frequency setting? Schedule
frequently changing b. Why schedule often changes? Following customer c. Why follow the customer? No buffer stock
d. Why no buffer stock? Not to be standardized
After the data each known cause and then proceed to draw
a cause and effcet diagram as in bawahini.
Fig 15:- Cause and Effect Diagram to Set up & Adjustment losses
B. Cause and Effect Diagram for Reduced speed losses
Some of the factors that affect the speed reduced
losses are:
1. Man (Manuasia). Spirit operator for improvement Low engine.
a. Why the low improvement spirit? Target improvement
KPI has not made bagiperusahaan b. Why not be a KPI? Not available measurre as a
reference
c. Why is there no reference? Not to dilakukankajian d. Why not do the study? Not to be a priority by the
operator maupunmanajemen 2. Machine (Engine). The following are factors that affect
the engine speed reduced losses. Cans jammed in the
necking process so that the machine should be turned
off and jalanlagi
a. Why is jammed? necking chuckkotor
b. Why necking chuck dirty? Lacquer is still wet from the
curing process tidaksempurna
c. Why the curing process is not perfect? heat tidakmerata
d. Why heat unevenly? Temperature adjustment and less
precise speed so that the engine speed lowered so
runningnormal machine.
Cans jammed in forming
a. Why jammed in forming? Body blank down tidakrata
b. Why disks down an uneven body? Stand of body it is not in accordance with c. Why the holder body does not fit? The house was
broken bolt
d. Why the house was broken bolt? No bolts are standard
engine, so the engine speed so as not terjadimacet
lowered.
3. Material. Sheet printing material mudahscratch causes the machine running at slow speed
a. Why is the scratch? Quality printingsheet inconsistent
b. Why quality is not consistent? Sistemcontrol incoming The low one
c. Why the low control incoming system? CoA from
suppliers tidakdikirim
d. Why not post? Outgoing supplier does not control
4. Method (Method of work). Maintenance schedules are
not followed olehEngineering
a. Why not followed by Engineering? Operator
concerned engine running b. Why are concerned with running? Operator reach
production targets c. Why chase the target? Because the machine is often a
problem

Volume 4, Issue 7, July – 2019 International Journal of Innovative Science and Research Technology
ISSN No:-2456-2165
IJISRT19JUL331 www.ijisrt.com 1330
d. Why does the machine is often a problem? Due to improvements made temporary, so engine peroduksi
road with a speed that tidakmaksimal.
After the data each known cause and then proceed to
draw a cause and effcet diagram as in bawahini.
Fig 16:- Cause and effect diagram for the reduced speed losses
VI. CONCLUSION
The results of analysis and calculation of OEE in
machinery General Line # 3 tin packaging industry, several
conclusions can be drawn as follows:
1. Measurement of the effectiveness of the machine by
using Overall Equipment Effectiveness (OEE) in the
packaging industry cans in the machine General Line #
3 that the calculation starts from January to December
2013 resulted in an average value of 65.43%, it is
influenced by the average 76.49% availability rate,
performance rate of 86.55%, and the quality
rate98,85%.
2. Factors affecting the analysis OEE with six big losses in
the engine General Line # 3 is equipment failure, losses
of 2.40%, set-up and adjustment losses of 21.11%, idle
and minor stoppages 0%, reduced speed losses 10.25% , rework and reject losses of 0.07%, and reduced yield
losses0%.
3. Based on the analysis of Pareto diagram on the machine
General Line # 3, there are two main things that
contributed losses of more than 80% that is set up and
adjustment speed losses and reduced losses. The roots
of the main problems that occur to set up and
adjustment losses and reduced speed losses are mainly
due to engine maintenance system that tidaksesuai.
4. Tin packaging industry production part of General Line
# 3 can apply the implementation of Total Productive Maintenance (TPM) as a pilot project it is seen from the
terms of the company to implement TPM. The pillars
TPMyang proposed is Autonomous Maintenance
program (AM) and the program Focused Improvement
(FI).
REFERENCESS
[1]. Ahmed, T., Ali, SM, Allama, MM, & Parvez, MS
(2010). A Total Productive Maintenance (TPM)
Approach to Improve Production Efficiency and
Development of Loss Structure in a Pharmaceutical Industry. Global Journal of Management and
Business Research, Vol. 10, Issue 2 (Ver 1.0), 186-
190.
[2]. Ahuja, IPS, & Khamba, JS (2008). Total Productice
Maintenance, literature review and direction.
International Journal of Quality and Reliability
Management, Vol 25, No. 7.709 to 756.
[3]. Almeanazel, OT (2010). Total Productive
Maintenance Review and Overall Equipment
Effectiveness Measurement. Jordan Journal of
Mechanical and Industrial Engineering, Vol. 4, No.
4.517 to 522.
[4]. Borris, S. (2006). Total ProductiveMaintenance. New
York: McGraw-Hill
[5]. Dogra, M., Sharna, VS, Sachdeva, A., & Dureja, JS (2011). Journal of Engineering Science and
Technology, Vol. 6, No. 1, 1-16. [6]. Goetcsh, D., & Davis, S. (2013). Quality
Management for Organizational Excellence, 7.
edition, USA: Pearson Education, Inc.
[7]. Hegde, HG, Mahesh, NS, and Doss, K. (2009).
Overall Equipment Effectiveness Improvement by
TPM and 5S Techniques in a CNC Machine Shop.Sastech, Vol. 8, Issue 2.25 to 32.
[8]. Imani TW, Priyanta DM, Gurning ROS, (2010).
Implementation of Total Productive Maintenance
Method of Overall Equipment Effectiveness (OEE) to
Determine Maintenance Strategy on Machine Tube
Mill 303, Department of Marine Engineering, ITS-
Undergraduate, Surabaya.

Volume 4, Issue 7, July – 2019 International Journal of Innovative Science and Research Technology
ISSN No:-2456-2165
IJISRT19JUL331 www.ijisrt.com 1331
[9]. Heizer, J & Render, B. (2008). Operation Management, edition 9. New Jersey: Pearson
Education, Inc.
[10]. Kennedy, R. (2006). Examinizing the Processes of
RCM and TPM.The Center for TPM (Australia).
Retrieved fromhttp://www.ctpm.org.au.
[11]. Kumar, RS (2010). Application of Total Productive
Maintenance (TPM) in the spinning mill. Practical
Hints, PTJ July 2010.40-41.
[12]. Nakajima, S, (1988). Introduction to TPM.
Cambridge: Productivity Press, Inc.
[13]. Norddin, KH, and Saman, MZM (2012). Implementation of Total Productive Maintenance
Process Concept in a Fertilizer Plant. Makanikal
Journal, No. 32.66 to 82.
[14]. Ottosan, D (2009), The Initiation of Total Productive
Maintenance to a pilot production line in the German
automobile industry. Master's Thesis, Department of
Applied Physics and Mechanical Engineering, Luleå
University of Technology. German.
[15]. Scodanibbio, C. (2009). World-Class TPM - How to
calculate Overall Euqipment Effectiveness (OEE).
Retrieved from http://www.scodanibbio.com,
[16]. Shahanaghi, K., & Yazdian, SA (2009). Analyzing the effect of implementation of Total Productive
Maintenance (TPM) in the manufacturingcompanies
: Asystem dynamics approach. World Journal of
Modeling and Simulation, Vol. 5, No. 2, 120-129.
[17]. Sharma, RK, & Kumar, P. (2006). Manufacturing
Excellence through TPM implementation: a practical
analysis. Industrial Management & Data Systems.
Vol. 106, 2, 256-280.
[18]. Sivakumar, D., Swoop, BC, Ismail, N., & Ismail,
MY (2012). Application of Total Productive
Maintenance to Reduce Non-Stick Pad on Problemin IC Packaging, International Journal of Engineering
and Science, Vol. 3, No.1,1-19
[19]. Sugiyono. (2007). Business peneltitian method.
Bandug: Alfabeta, CV.
[20]. Teeravaraprug, J., Kitiwanrong, K., & Tong, NS
(2011). Relationship models and supportingactivities
of JIT, TQM and TPM. Songklanakarin Journal of
Science and Technology, 33 (1), 101-106.
[21]. Tika, MP (2006). RisetBisnis methodology. Jakarta
: Earth Akasa, PT. [22]. Wakjira, MW, & Singh, AP (2012). Total Productive
Maintenance: A case study in the Manufacturing
Industry. Global Journal of Researches in
Engineering, IndustrialEngineering,
Vol. 12, Issue 1 Version 1.0, 25-32 [23]. Wilson, A. (2002). Asset Maintenance Management.
New York: Industrial Press, Inc.
[24]. Wireman, T. (2003). Benchmarking best practices in maintenance management. New York: Industrial
Press, Inc.
[25]. Wireman, T. (2005). Developing Performance
Indicators for Managing Maintenance. New York:
Industrial Press, Inc.


![Total Productive Maintenance Policy to Increase ... · 2.2. Total Productive Maintenance (TPM) TPM involves all workers through small group activities [23]. TPM is a comprehensive](https://img.pdfslide.net/doc/110x75/5f01d30f7e708231d401383f/total-productive-maintenance-policy-to-increase-22-total-productive-maintenance.jpg)