Embed Size (px)
Citation preview
Antibiotic Analysis using HPLC/ECD
Applications Notebook
NEURO Notebook 213_070_04AG Notebook 217_050_04
© Antec Scientific, Zoeterwoude, The Netherlands
Design: MGO-studio, Maarssen, NLIllustrations: Antec Scientific
All rights reserved. No part of this publication may be reproduced, stored in a com-puterised database or transmitted in any other form or by any means, electronic, mechanical, photocopying, recording or otherwise, without the prior written per-mission of the publisher.
For research purpose only. The information shown in this communication is solely to demonstrate the applicability of the ALEXYS Aminoglycosides Analyzer. The actual performance may be affected by factors beyond Antec’s control. Specifications men-tioned in this notebook are subject to change without further notice.
The author and publisher acknowledge their duty to provide as accurate a publica-tion as possible. Nevertheless, they cannot be held liable for any possible inaccura-cies in this publication.
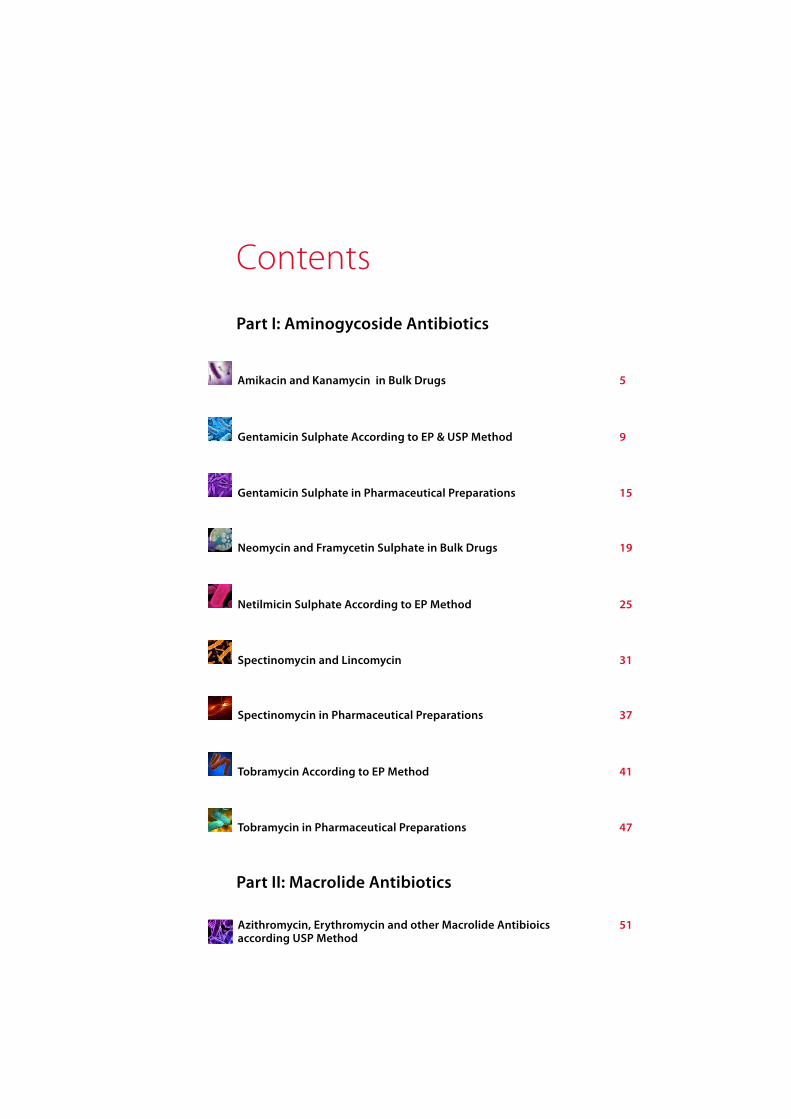
Contents
Amikacin and Kanamycin in Bulk Drugs 5
Gentamicin Sulphate According to EP & USP Method 9
Gentamicin Sulphate in Pharmaceutical Preparations 15
Neomycin and Framycetin Sulphate in Bulk Drugs 19
Netilmicin Sulphate According to EP Method 25
Spectinomycin and Lincomycin 31
Spectinomycin in Pharmaceutical Preparations 37
Tobramycin According to EP Method 41
Tobramycin in Pharmaceutical Preparations 47
Azithromycin, Erythromycin and other Macrolide Antibioics 51according USP Method
Part I: Aminogycoside Antibiotics
Part II: Macrolide Antibiotics

Electrochemistry Discover the difference Electrochemistry Discover the difference4
Your theory is crazy, but it’s not crazy enough
to be true.Niels Bohr
Amikacin and Kanamycin in Bulk Drugs
SummaryThe United States Pharmacopeia (USP) has two monographs describing the analysis of both Ka-
namycin [5] and Amikacin [6] using LC-PAD. The ALEXYS Kanamycin and Amikacin Analyzer is a
dedicated LC solution for the analysis of both antibiotics which matches the USP requirements for
peak resolution, tailing and reproducibility. In this note typical results obtained with the Analyzer
are shown to demonstrate its performance.
n United States Pharmacopeia USP30–NF25 used as basis
for this application
n FlexCell with exchangeable gold electrode
n Analysis of main substituent and impurities
Application NoteAminoglycoside Antibiotics
The most reliable LC-ECapplications forAntibiotics analysis
AminoglycosidesAmikacinFramycetin SulphateGentamicin SulphateKanamycin SulphateLincomycinNeomycinSpectinomycinTobramycin
Macrolide antibioticsAzithromycinAzaerythromycinClarithromycinErythromycinRoxithromycin
ALEXYS Application Note # 217_015_12
Electrochemistry Discover the difference 5 Electrochemistry Discover the difference
6
Amikacin and Kanamycin in bulk drugs
Introduction Kanamycin and amikacin are closely related, water soluble,
broad spectrum aminoglycoside antibiotics. Kanamycin is
obtained from Streptomyces kanamyceticus. Amikacin is syn-
thesised by acylation of an amino group of kanamycin A with
L-(-)-g- amino-α- hydroxybutyric acid (LHABA). Both antibiot-
ics can be analysed using ionexchange chromatography in
combination with pulsed amperometric detection [1-4].
ResultsUSP requirements
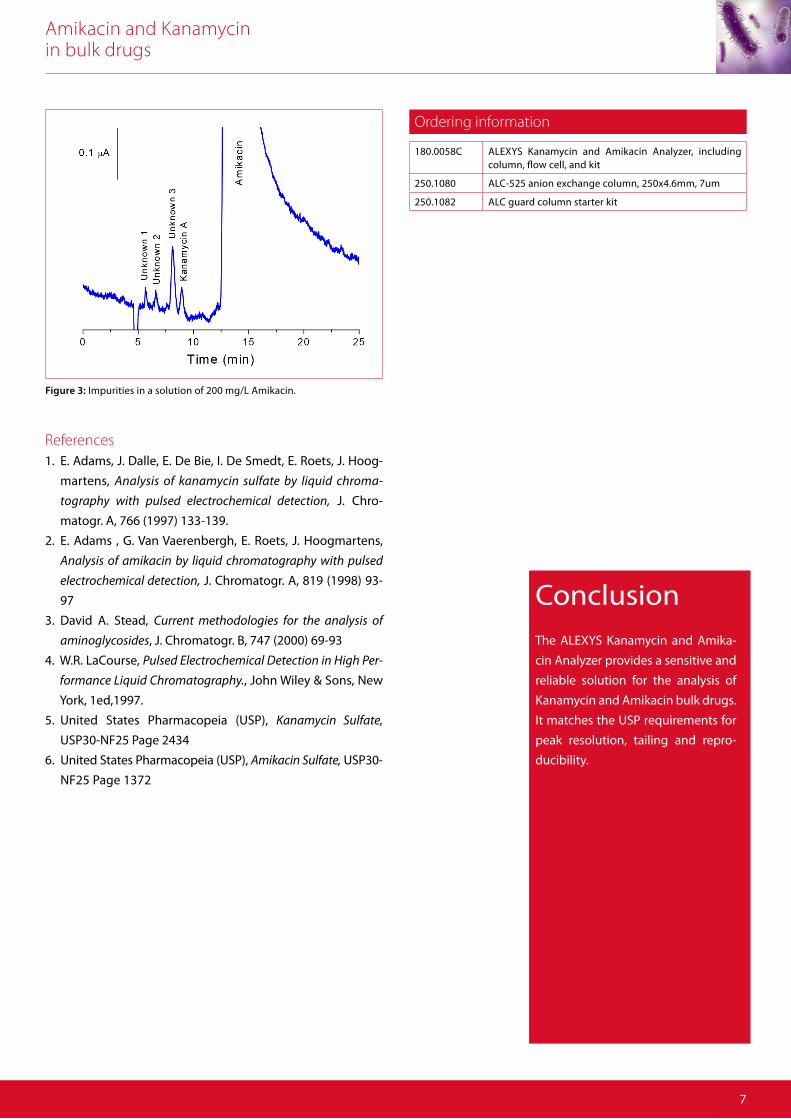
The results listed in the table below are based on an average
of ten 20 μL injections of a mixture of 8 mg/L Kanamycin and
20 mg/L Amikacin in water.
For both Kanamycin and Amikacin an RSD smaller then 1.5%
in area was achieved for 10 replicate injections (USP requires
<3%). Peak resolution between amikacin and kanamycin was
>5 (better than 3 is required for USP). The peak tailing factor
for both components was better then 1.6 (USP requires small-
er than 2).
Linearity of kanamycin was investigated in the range of 1.6
- 8 mg/L. Linearity of amikacin was investigated in the range
of 4 - 20 mg/L. In all cases correlation coefficients were better
than 0.998 for peak areas and peak heights.
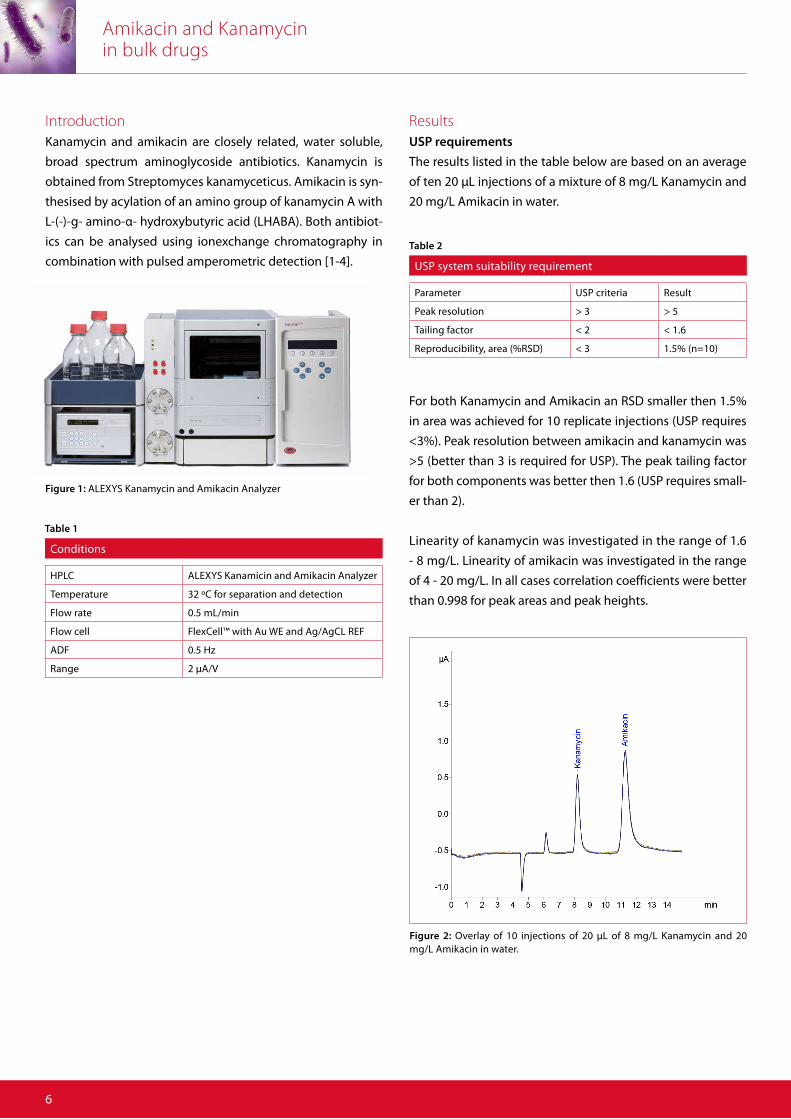
Figure 1: ALEXYS Kanamycin and Amikacin Analyzer
Conditions
HPLC ALEXYS Kanamicin and Amikacin Analyzer
Temperature 32 ºC for separation and detection
Flow rate 0.5 mL/min
Flow cell FlexCell™ with Au WE and Ag/AgCL REF
ADF 0.5 Hz
Range 2 µA/V
USP system suitability requirement
Parameter USP criteria Result
Peak resolution > 3 > 5
Tailing factor < 2 < 1.6
Reproducibility, area (%RSD) < 3 1.5% (n=10)
Table 1
Table 2
Figure 2: Overlay of 10 injections of 20 μL of 8 mg/L Kanamycin and 20 mg/L Amikacin in water.
Amikacin and Kanamycin in bulk drugs
7
ConclusionThe ALEXYS Kanamycin and Amika-
cin Analyzer provides a sensitive and
reliable solution for the analysis of
Kanamycin and Amikacin bulk drugs.
It matches the USP requirements for
peak resolution, tailing and repro-
ducibility.
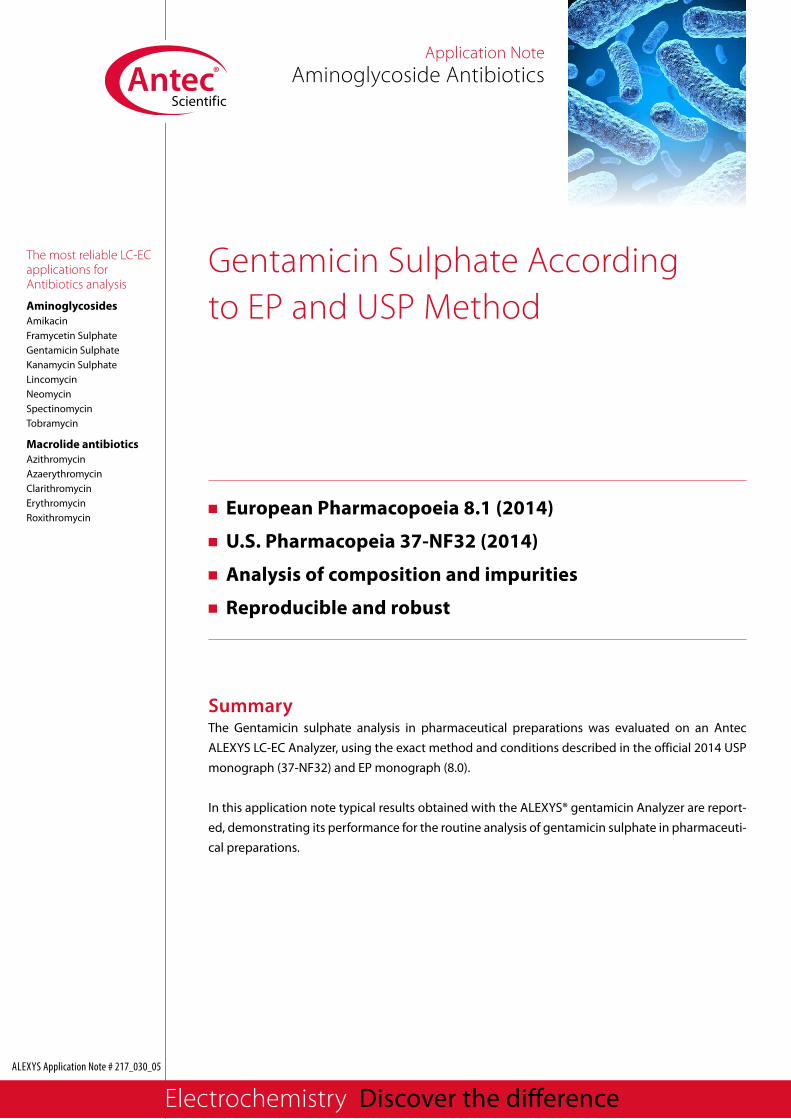
Figure 3: Impurities in a solution of 200 mg/L Amikacin.
Ordering information
180.0058C ALEXYS Kanamycin and Amikacin Analyzer, including column, flow cell, and kit
250.1080 ALC-525 anion exchange column, 250x4.6mm, 7um
250.1082 ALC guard column starter kit
References1. E. Adams, J. Dalle, E. De Bie, I. De Smedt, E. Roets, J. Hoog-
martens, Analysis of kanamycin sulfate by liquid chroma-
tography with pulsed electrochemical detection, J. Chro-
matogr. A, 766 (1997) 133-139.
2. E. Adams , G. Van Vaerenbergh, E. Roets, J. Hoogmartens,
Analysis of amikacin by liquid chromatography with pulsed
electrochemical detection, J. Chromatogr. A, 819 (1998) 93-
97
3. David A. Stead, Current methodologies for the analysis of
aminoglycosides, J. Chromatogr. B, 747 (2000) 69-93
4. W.R. LaCourse, Pulsed Electrochemical Detection in High Per-
formance Liquid Chromatography., John Wiley & Sons, New
York, 1ed,1997.
5. United States Pharmacopeia (USP), Kanamycin Sulfate,
USP30-NF25 Page 2434
6. United States Pharmacopeia (USP), Amikacin Sulfate, USP30-
NF25 Page 1372

Facts are the air of scientists. Without them
you can never fly.
Linus Pauling
8 Electrochemistry Discover the difference
Gentamicin Sulphate According to EP and USP Method
Summary The Gentamicin sulphate analysis in pharmaceutical preparations was evaluated on an Antec
ALEXYS LC-EC Analyzer, using the exact method and conditions described in the official 2014 USP
monograph (37-NF32) and EP monograph (8.0).
In this application note typical results obtained with the ALEXYS® gentamicin Analyzer are report-
ed, demonstrating its performance for the routine analysis of gentamicin sulphate in pharmaceuti-
cal preparations.
n European Pharmacopoeia 8.1 (2014)
n U.S. Pharmacopeia 37-NF32 (2014)
n Analysis of composition and impurities
n Reproducible and robust
The most reliable LC-ECapplications forAntibiotics analysis
AminoglycosidesAmikacinFramycetin SulphateGentamicin SulphateKanamycin SulphateLincomycinNeomycinSpectinomycinTobramycin
Macrolide antibioticsAzithromycinAzaerythromycinClarithromycinErythromycinRoxithromycin
ALEXYS Application Note # 217_030_05
Electrochemistry Discover the difference
Application NoteAminoglycoside Antibiotics
Gentamicin Sulphate According to EP & USP Method
10
IntroductionGentamicin is a broad spectrum water-soluble antibiotic be-
longing to the group of aminoglycosides. It is manufactured
by a fermentation process and consists of a mixture of related
gentamicin components. The main constituents are gentami-
cin C1, C1a, C2 and C2a. Usually also other minor aminoglyco-
sides are found in a pharmaceutical gentamicin preparation.
The number of impurities and components possible makes
the chromatographic analysis not quite straightforward.
Because of the presence of a sugar moiety in these analytes
the selectivity and inherent sensitivity of pulsed ampero-
metric detection (PAD) is a very attractive approach [1]. The
analysis of Gentamicin sulphate in pharmaceutical formula-
tions based on HPLC-PAD is described in the European and
U.S Pharmacopoeia [2,3].Figure 2: 20 μL injection of a 200 μg/mLGentamicin sample in mobile phase (Test solution (b) as described in EP and USP monograph).
MethodThe method & conditions for separation and detection de-
scribed in the 2014 EP and USP monograph are almost iden-
tical. The monographs differ slightly with respect to system
suitability requirements and acceptance criteria for pharma-
ceutical formulation. In addition, the EP also describes the
analysis of related substances (impurities).
In the monographs the use of the following column type is
described for the separation of Gentamicin: size 250 mm, ID
4.6 mm, octadecylsilyl silca gel stationary phase (packing L1)
and particle size 5 μm. The Phenomenex Luna 5 μ C18(2), 250
x 4.6 mm column which matches this criteria was chosen for
the method evaluation. For the detection of Gentamicin PAD
is mandatory using an Au working electrode (WE), Ag/AgCl
reference electrode (RE) and stainless steel auxiliary electrode
(AE). The Antec VT-03 electrochemical flow cell matches these
requirements and was used in this evaluation. Note that both
column and flow cell are not per se the optimal choice for
separation & detection but were chosen to fore fill the USP
and EP assay. An alternative approach for the analysis of Gen-
tamicin with significantly shorter analysis time is described in
reference [5].
Figure 1: ALEXYS Aminoglycosides Analyzer.
Gentamicin Sulphate According to EP & USP Method
11
LC-EC conditions
HPLC ALEXYS Gentamicin Analyzer with post-column addition kit (375 μL mixing coil)
Column 4.6 mm ID x 25 cm, 5μm packing L1
Mobile phase 7 mL/L Trifluoroacetic acid, 250 μL/L Pen-tafluoropropanoicacid, 4 mL/L 12.5M NaOH(carbonate-free) adjusted to pH 2.6, 15.5mL/L Acetonitrile
Flow rate 1.0 mL/min, post-column: 0.3 mL/min
Vinjection 20 μL
Temperature 35°C for separation, mixing and detection
Flow cell VT-03™ with Au WE, stainless steel AE andAg/AgCl Salt bridge RE, spacer 50 μm
Potential waveform E1, E2, E3: +0.05,+0.75, -0.15 Vts, t1, t2, t3: 0.3, 0.4, 0.15, 0.45 s
I-cell ca. 0.5 μA
ADF 0.5 Hz
Table 1
The ALEXYS LC-EC Analyzer was equipped with a second
pump for the post-column addition of 20 g/L NaOH (carbon-
ate-free). Mixing of the post-column reagent was achieved
using a 375 μL PEEK mixing coil.
The mobile phase was prepared as described in the EP & USP
monographs (Table 1). The concentration Acetonitrile was
slightly adjusted to 15.5 mL/L to optimize the separation. A
3 step waveform was applied with the following settings E1
= +0.05 V, E2 = +0.75 V, E3 = -0.15 V, t1 = 0.4 s, t2 = 0.15 s, t3 =
0.45 and ts = 300ms. The cell current was typical about 0.5 μA
with these PAD settings.
The peaks of the Gentamicin main constituents and impuri-
ties (A: Sisomicin; B: Garamine) in the recorded chromatogram
were identified using the chromatogram supplied with the
standard Gentamicin for peak identification CRS.
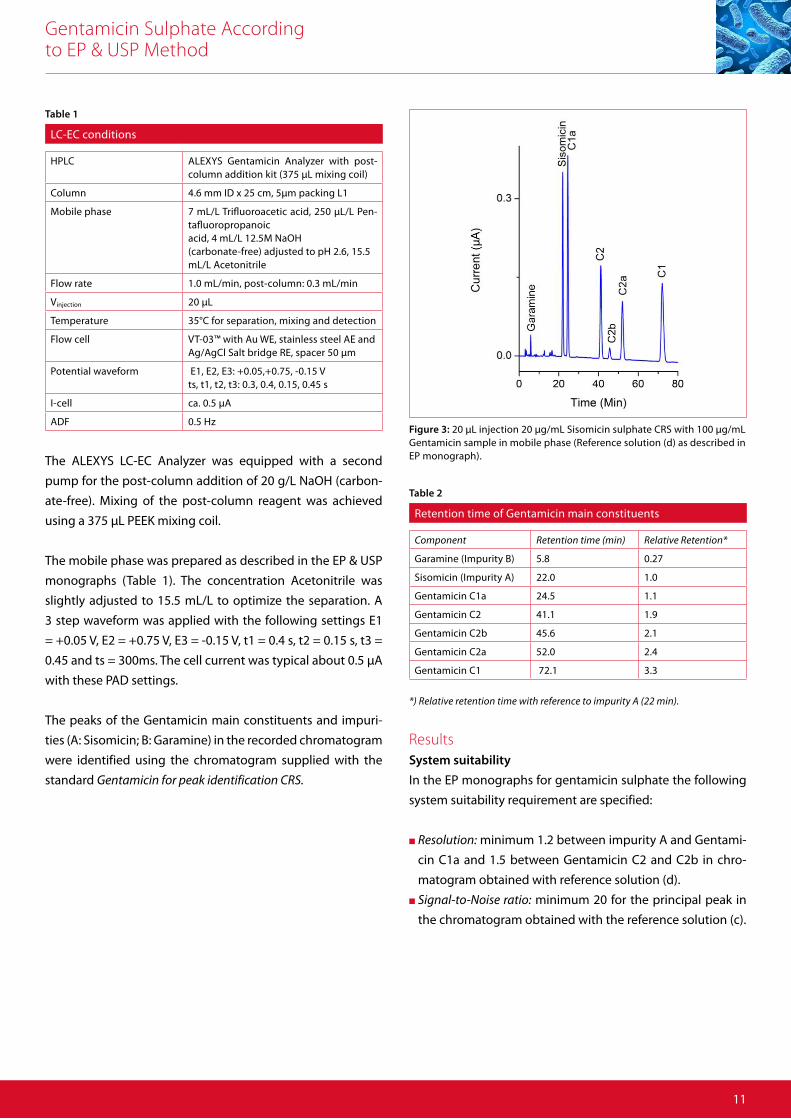
Figure 3: 20 μL injection 20 μg/mL Sisomicin sulphate CRS with 100 μg/mLGentamicin sample in mobile phase (Reference solution (d) as described inEP monograph).
Retention time of Gentamicin main constituents
Component Retention time (min) Relative Retention*
Garamine (Impurity B) 5.8 0.27
Sisomicin (Impurity A) 22.0 1.0
Gentamicin C1a 24.5 1.1
Gentamicin C2 41.1 1.9
Gentamicin C2b 45.6 2.1
Gentamicin C2a 52.0 2.4
Gentamicin C1 72.1 3.3
*) Relative retention time with reference to impurity A (22 min).
Table 2
ResultsSystem suitability
In the EP monographs for gentamicin sulphate the following
system suitability requirement are specified:
n Resolution: minimum 1.2 between impurity A and Gentami-
cin C1a and 1.5 between Gentamicin C2 and C2b in chro-
matogram obtained with reference solution (d).
n Signal-to-Noise ratio: minimum 20 for the principal peak in
the chromatogram obtained with the reference solution (c).
Gentamicin Sulphate According to EP & USP Method
12
Sample analysis
For a commercial sample the composition and related sub-
stances were analyzed and evaluated using the EP and USP
acceptance criteria. The relative percentage of each gentami-
cin derivative in the commercial formulation was calculated
using the peak area obtained from the chromatogram of test
solution (b) shown in figure 1. The sum of all peak areas (C1a,
C2 C2a, C2b and C1) corresponds to 100%.
Note that the calculation of the composition for the EP and
USP slightly differ. In the EP the sum of C2, C2a and C2b is
used; in the USP monograph the sum of C2 + C2a and the sum
of C2b + C1. The results are shown in table 4; it is evident that
the evaluated commercial sample met the acceptance criteria
of both the EP and USP.
In addition, the EP monograph also describes acceptance
criteria for impurity levels in commercial samples. For that
purpose all impurities are quantified and compared to the re-
sponse of the principal peak (Impurity A) obtained from the
chromatogram of reference solution (c).
EP system suitability requirement
Peak EP* USP*
Limits (%) Calculated (%) Limits (%) Calculated (%)
C1a 10-30 28 10-35 28
C2
35-55 4125-55 38
C2a
C2b25-50 34
C1 25-45 31
*) The calculation of the composition for EP and USP slightly differ. In the EP the sum of C2, C2a and C2b is used; in the USP monograph the sum ofC2 + C2a and the sum of C2b + C1.
Table 4
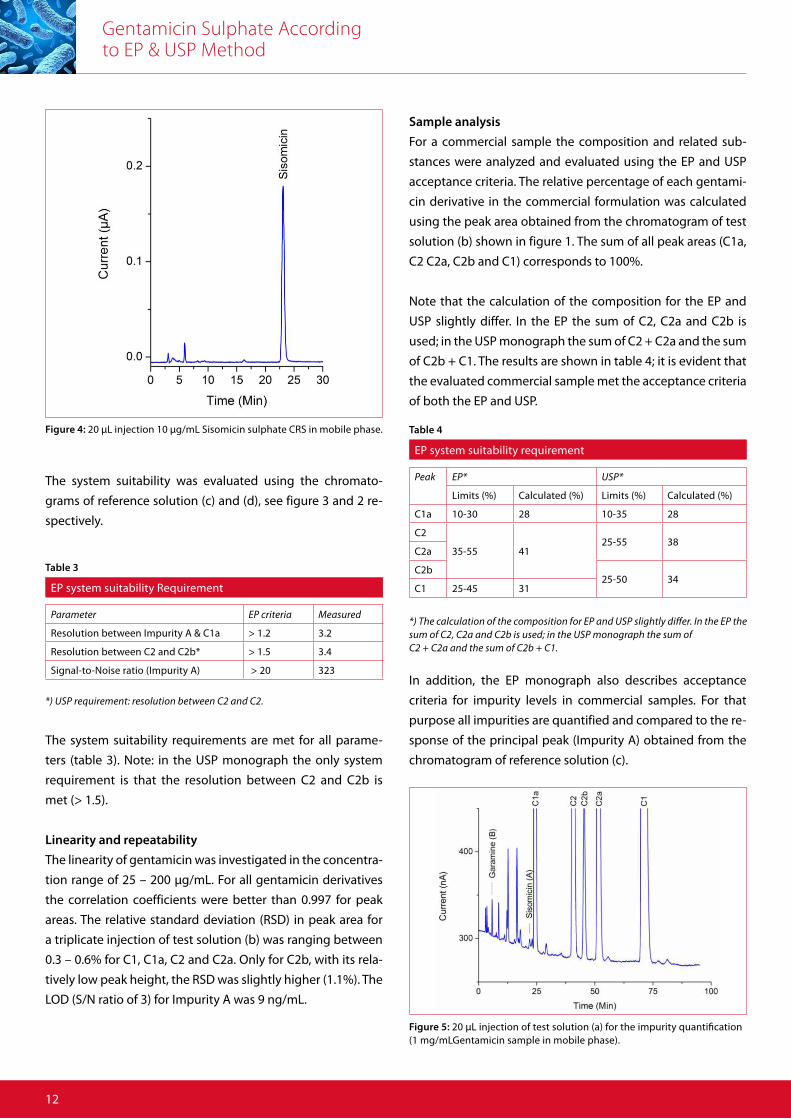
Figure 5: 20 μL injection of test solution (a) for the impurity quantification(1 mg/mLGentamicin sample in mobile phase).
Figure 4: 20 μL injection 10 μg/mL Sisomicin sulphate CRS in mobile phase.
EP system suitability Requirement
Parameter EP criteria Measured
Resolution between Impurity A & C1a > 1.2 3.2
Resolution between C2 and C2b* > 1.5 3.4
Signal-to-Noise ratio (Impurity A) > 20 323
*) USP requirement: resolution between C2 and C2.
Table 3
The system suitability was evaluated using the chromato-
grams of reference solution (c) and (d), see figure 3 and 2 re-
spectively.
The system suitability requirements are met for all parame-
ters (table 3). Note: in the USP monograph the only system
requirement is that the resolution between C2 and C2b is
met (> 1.5).
Linearity and repeatability
The linearity of gentamicin was investigated in the concentra-
tion range of 25 – 200 µg/mL. For all gentamicin derivatives
the correlation coefficients were better than 0.997 for peak
areas. The relative standard deviation (RSD) in peak area for
a triplicate injection of test solution (b) was ranging between
0.3 – 0.6% for C1, C1a, C2 and C2a. Only for C2b, with its rela-
tively low peak height, the RSD was slightly higher (1.1%). The
LOD (S/N ratio of 3) for Impurity A was 9 ng/mL.
Gentamicin Sulphate According to EP & USP Method
13
ConclusionThe ALEXYS Aminoglycosides
Analyzer provides a reliable solution
for the analysis of the composition
& impurities in commercial
Gentamicin Preparations following
the official methods of the EP and
USP.
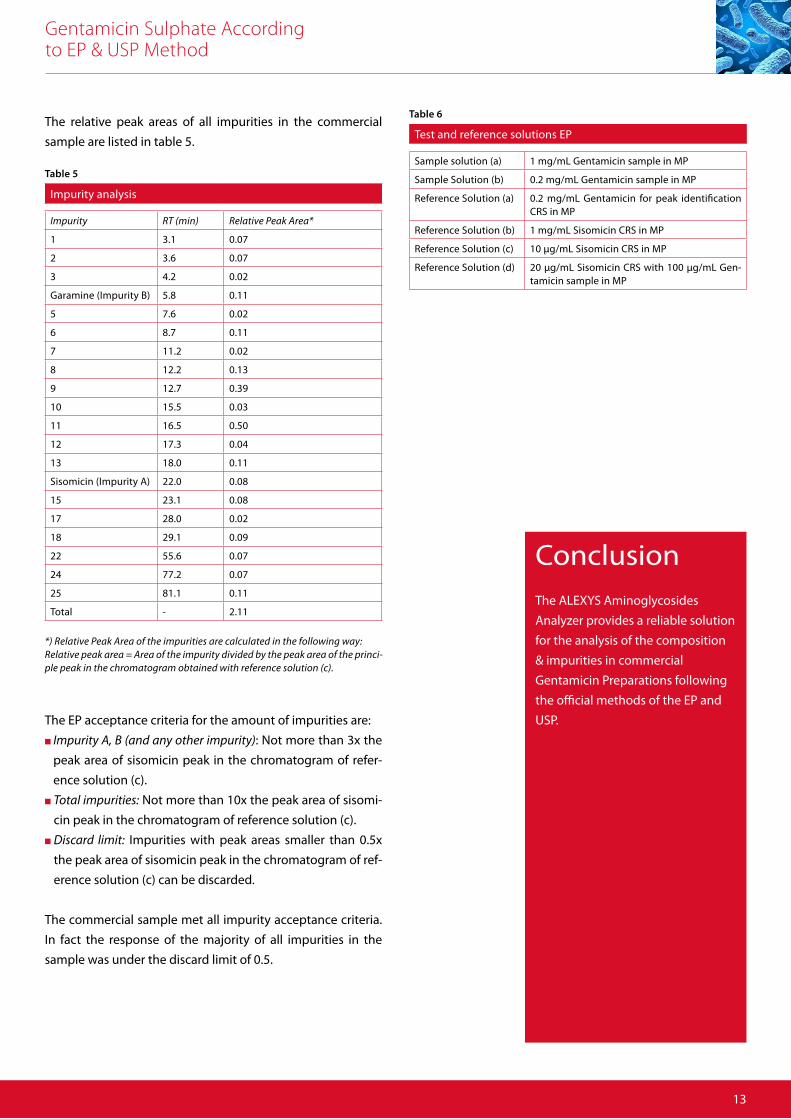
Impurity analysis
Impurity RT (min) Relative Peak Area*
1 3.1 0.07
2 3.6 0.07
3 4.2 0.02
Garamine (Impurity B) 5.8 0.11
5 7.6 0.02
6 8.7 0.11
7 11.2 0.02
8 12.2 0.13
9 12.7 0.39
10 15.5 0.03
11 16.5 0.50
12 17.3 0.04
13 18.0 0.11
Sisomicin (Impurity A) 22.0 0.08
15 23.1 0.08
17 28.0 0.02
18 29.1 0.09
22 55.6 0.07
24 77.2 0.07
25 81.1 0.11
Total - 2.11
*) Relative Peak Area of the impurities are calculated in the following way: Relative peak area = Area of the impurity divided by the peak area of the princi-ple peak in the chromatogram obtained with reference solution (c).
Table 5
The relative peak areas of all impurities in the commercial
sample are listed in table 5.
The EP acceptance criteria for the amount of impurities are:
n Impurity A, B (and any other impurity): Not more than 3x the
peak area of sisomicin peak in the chromatogram of refer-
ence solution (c).
n Total impurities: Not more than 10x the peak area of sisomi-
cin peak in the chromatogram of reference solution (c).
n Discard limit: Impurities with peak areas smaller than 0.5x
the peak area of sisomicin peak in the chromatogram of ref-
erence solution (c) can be discarded.
The commercial sample met all impurity acceptance criteria.
In fact the response of the majority of all impurities in the
sample was under the discard limit of 0.5.
Test and reference solutions EP
Sample solution (a) 1 mg/mL Gentamicin sample in MP
Sample Solution (b) 0.2 mg/mL Gentamicin sample in MP
Reference Solution (a) 0.2 mg/mL Gentamicin for peak identification CRS in MP
Reference Solution (b) 1 mg/mL Sisomicin CRS in MP
Reference Solution (c) 10 µg/mL Sisomicin CRS in MP
Reference Solution (d) 20 µg/mL Sisomicin CRS with 100 µg/mL Gen-tamicin sample in MP
Table 6
Electrochemistry Discover the difference
Gentamicin Sulphate According to EP & USP Method
14
Antec Scientific (USA) [email protected] www.AntecScientific.com T 888 572 0012
Antec Scientific (worldwide) [email protected] T +31 71 5813333
For research purpose only. The information shown in this communica-tion is solely to demonstrate the applicability of the ALEXYS system. The actual performance may be affected by factors beyond Antec’s control. Specifications mentioned in this application note are subject to change without further notice.
Ordering information
180.0056C ALEXYS Aminoglycosides Analyzer, including column,flow cell, and post-column addition kit
250.1070B ALA-525 column, 250x4.6mm, 5um C8
References1. W.R. LaCourse, “Pulsed Electrochemical Detection in High
Performance Liquid Chromatography”, John Wiley & Sons,
New York, 1ed,1997.
2. Gentamicin sulphate, European Pharmacopoeia (EP), 8.1,
(2014) 2326 -2382
3. Gentamicin sulphate, United States Pharmacopoeia (USP),
USP37-NF32, 3138-3139
4. V. Manyanga, K. Kreft, B. Divjak, J. Hoogmartens, E. Adams,
J. Chromatogr. A, 1189, 347-354 (2008).
5. Gentamicin Sulphate in pharmaceutical formulations, Antec
application note, 217_013
Reagents and standards
NaOH 50%, carbonate-free Boom Chemicals, pn 80011912
Trifluoroacetic acid, HPLC grade Fischer Scientific, pn T/3258/PB05
Pentafluorpropionic acid, 97% Acros Chemicals, pn 416920500
Acetonitrile, HPLC grade Acros Chemicals, pn 268270025
Deionized Water. >18 MΩ-cm Barnstead, Easy pure II
Gentamicin sulfate CRS, 16500 IU/vial
EP, pn G0200000, batch 8.1
Gentamicin for peak identifica- tion CRS*
EP, pn Y0001363, batch 1.0
Sisomicin sulphate CRS, 77.7% EP, pn S0660000, batch 2.1
*)Gentamicin for peak identification CRS; not injected, reference chromato- gram for peak identification downloaded from the following location: http://crs.pheur.org/db/4DCGI/View=Y0001363
Table 7
Gentamicin Sulphate in Pharmaceutical Preparations
Summary
In the European Pharmacopoeia 6.0 (2008) the use of a reversed-phase polymeric column is pre-
scribed for this application [1]. In literature it is shown that such a column may result in very wide
and tailing peaks [3]. We have confirmed this and found much better separation using a C18 silica-
based column.
In this application note typical results obtained with the ALEXYS® gentamicin Analyzer based on a
C18 column are reported, demonstrating its performance for the analysis of gentamicin.
n European Pharmacopoeia 6.0 (2008) used as basis for this
application
n Analysis of main substituent and impurities
n Reproducible & robust
The most reliable LC-ECapplications forAntibiotics analysis
AminoglycosidesAmikacinFramycetin SulphateGentamicin SulphateKanamycin SulphateLincomycinNeomycinSpectinomycinTobramycin
Macrolide antibioticsAzithromycinAzaerythromycinClarithromycinErythromycinRoxithromycin
Application NoteAminoglycoside Antibiotics
ALEXYS Application Note # 217_013_12
Electrochemistry Discover the difference
Gentamicin Sulphate in Pharmaceutical Preparations
16
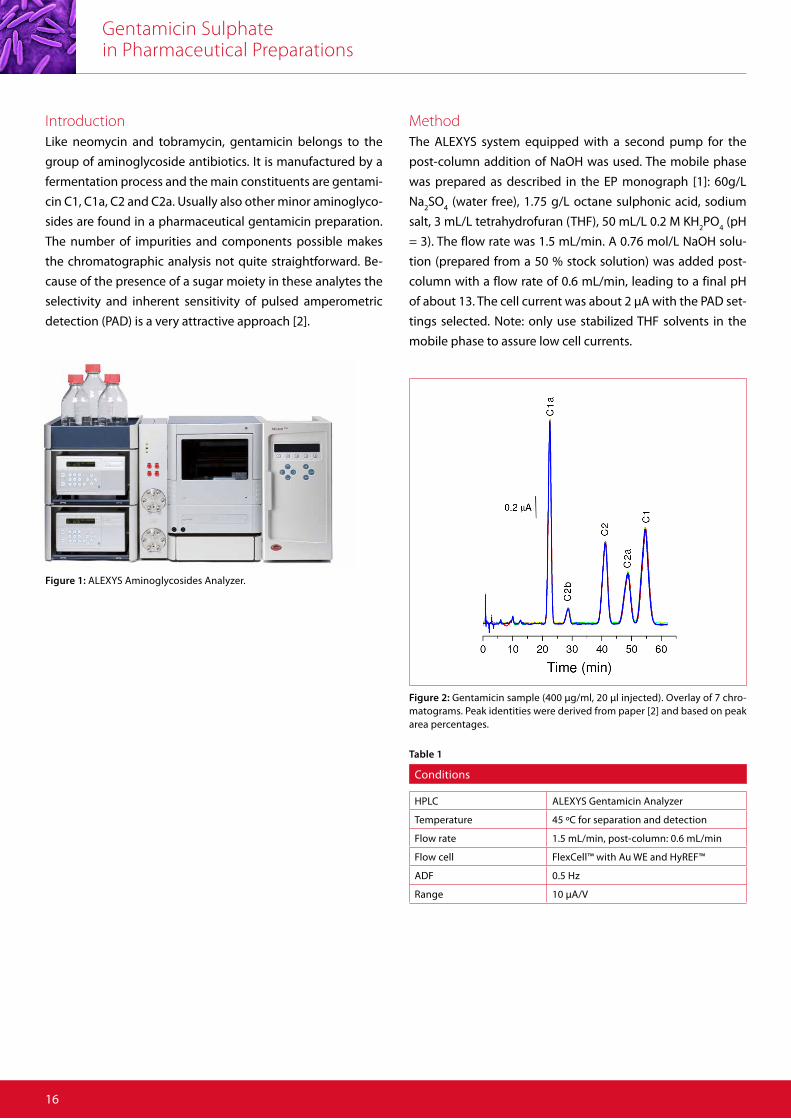
IntroductionLike neomycin and tobramycin, gentamicin belongs to the
group of aminoglycoside antibiotics. It is manufactured by a
fermentation process and the main constituents are gentami-
cin C1, C1a, C2 and C2a. Usually also other minor aminoglyco-
sides are found in a pharmaceutical gentamicin preparation.
The number of impurities and components possible makes
the chromatographic analysis not quite straightforward. Be-
cause of the presence of a sugar moiety in these analytes the
selectivity and inherent sensitivity of pulsed amperometric
detection (PAD) is a very attractive approach [2].
MethodThe ALEXYS system equipped with a second pump for the
post-column addition of NaOH was used. The mobile phase
was prepared as described in the EP monograph [1]: 60g/L
Na2SO
4 (water free), 1.75 g/L octane sulphonic acid, sodium
salt, 3 mL/L tetrahydrofuran (THF), 50 mL/L 0.2 M KH2PO
4 (pH
= 3). The flow rate was 1.5 mL/min. A 0.76 mol/L NaOH solu-
tion (prepared from a 50 % stock solution) was added post-
column with a flow rate of 0.6 mL/min, leading to a final pH
of about 13. The cell current was about 2 μA with the PAD set-
tings selected. Note: only use stabilized THF solvents in the
mobile phase to assure low cell currents.
Figure 1: ALEXYS Aminoglycosides Analyzer.
Figure 2: Gentamicin sample (400 μg/ml, 20 μl injected). Overlay of 7 chro-matograms. Peak identities were derived from paper [2] and based on peakarea percentages.
Conditions
HPLC ALEXYS Gentamicin Analyzer
Temperature 45 ºC for separation and detection
Flow rate 1.5 mL/min, post-column: 0.6 mL/min
Flow cell FlexCell™ with Au WE and HyREF™
ADF 0.5 Hz
Range 10 μA/V
Table 1
Gentamicin Sulphate in Pharmaceutical Preparations
17
ConclusionThe ALEXYS Gentamicin Analyzer
provides a reliable solution for the
routine analysis of gentamicin in
pharmaceutical preparations. It
meets the EP requirement for peak-
to-valley ratio between gentamicin
C2 and C2a.
ResultsLinearity & Repeatability
Linearity of gentamicin was investigated in the concentration
range of 50 – 500 μg/mL. For all gentamicin derivatives the
correlation coefficients were better than 0.998 for peak areas
and peak heights. The relative standard deviation (RSD) in
peak area for 10 replicate injections for gentamicin was rang-
ing between 0.9 and 2.5% for gentamicin C1 and C2b, respec-
tively. The RSD for the retention times was better then 0.2%.
Peak resolution between gentamicin C2a and C1 was 1.6.
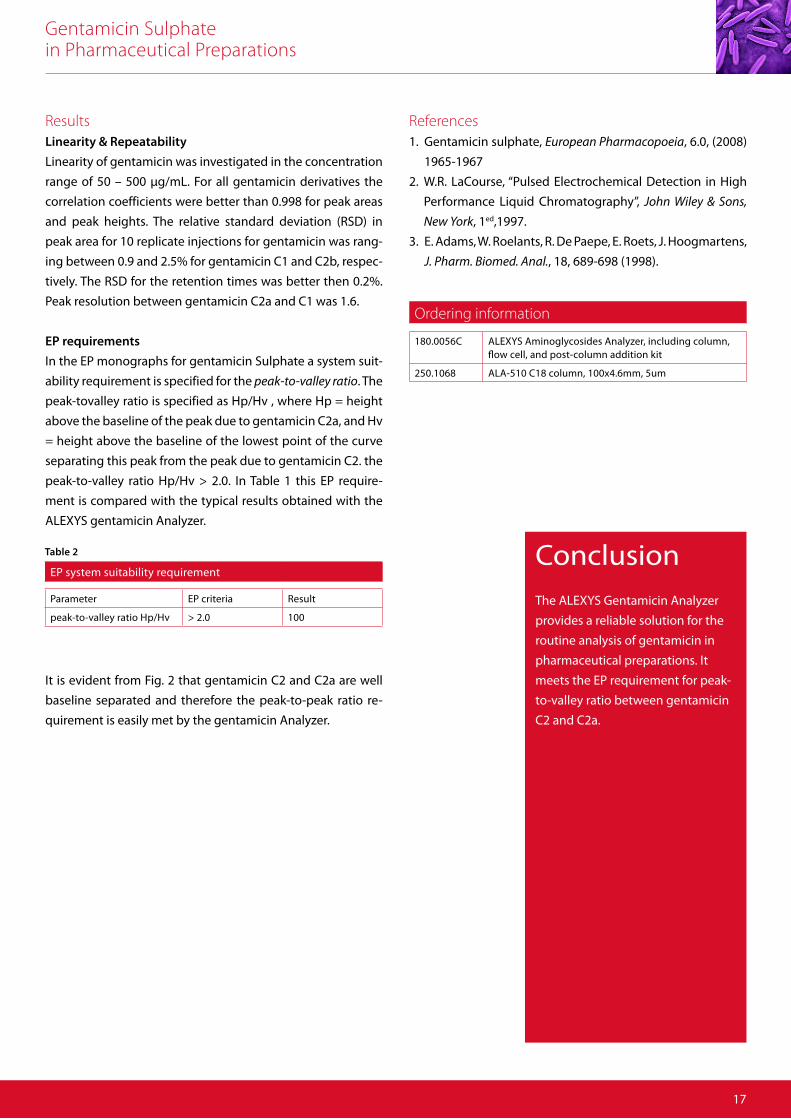
EP requirements
In the EP monographs for gentamicin Sulphate a system suit-
ability requirement is specified for the peak-to-valley ratio. The
peak-tovalley ratio is specified as Hp/Hv , where Hp = height
above the baseline of the peak due to gentamicin C2a, and Hv
= height above the baseline of the lowest point of the curve
separating this peak from the peak due to gentamicin C2. the
peak-to-valley ratio Hp/Hv > 2.0. In Table 1 this EP require-
ment is compared with the typical results obtained with the
ALEXYS gentamicin Analyzer.
EP system suitability requirement
Parameter EP criteria Result
peak-to-valley ratio Hp/Hv > 2.0 100
Table 2
It is evident from Fig. 2 that gentamicin C2 and C2a are well
baseline separated and therefore the peak-to-peak ratio re-
quirement is easily met by the gentamicin Analyzer.
Ordering information
180.0056C ALEXYS Aminoglycosides Analyzer, including column,flow cell, and post-column addition kit
250.1068 ALA-510 C18 column, 100x4.6mm, 5um
References1. Gentamicin sulphate, European Pharmacopoeia, 6.0, (2008)
1965-1967
2. W.R. LaCourse, “Pulsed Electrochemical Detection in High
Performance Liquid Chromatography”, John Wiley & Sons,
New York, 1ed,1997.
3. E. Adams, W. Roelants, R. De Paepe, E. Roets, J. Hoogmartens,
J. Pharm. Biomed. Anal., 18, 689-698 (1998).

Electrochemistry Discover the difference
The whole of science is nothing more than
a refinement of everyday thinking.
Albert Einstein
18
Neomycin and Framycetin Sulphate in Bulk Drugs
Summary The European Pharmacopoeia (EP) has two monographs describing the analysis of Neomycin and
Framycetin [4,5] using LC-PAD. The ALEXYS Aminoglycosides Analyzer is a dedicated LC solution for
the analysis of Neomycin and Framycetin, which matches the EP requirements for peak resolution
and signal-to-noise ratio of the principal peak (Neomycin B). In this application note typical results
obtained with the Aminoglycosides Analyzer are reported demonstrating its performance for the
analysis of impurities in bulk drugs.
n European Pharmacopoeia 6.0 (2008) used as a basis for
this application
n FlexCell with exchangeable gold electrode
n Analysis of main substituent and impurities
n Reproducible & robust
The most reliable LC-ECapplications forAntibiotics analysis
AminoglycosidesAmikacinFramycetin SulphateGentamicin SulphateKanamycin SulphateLincomycinNeomycinSpectinomycinTobramycin
Macrolide antibioticsAzithromycinAzaerythromycinClarithromycinErythromycinRoxithromycin
Application NoteAminoglycoside Antibiotics
ALEXYS Application Note # 217_010_13
Electrochemistry Discover the difference
Neomycin and Framycetin Sulphate in Bulk Drugs
20
IntroductionNeomycin is an antibiotic complex consisting of a mixture
of the aminoglycosides Neomycin A, B and C, obtained from
Streptomyces fradiae, were Neomycin B is the main constitu-
ent. It is a widely-used broad spectrum water-soluble antibi-
otic useful primarily in infections involving aerobic bacteria.
It is available as skin ointment (e.g., creams, gels, lotions, etc.)
and eye drops. Framycetin (also known as Neomycin B sul-
phate) is an aminoglycoside antibiotic similar to Neomycin
and commonly sold under the brand name Soframycin. Impu-
rities in neomycin and framycetin preparations are analyzed
using reversed phase HPLC, with post-column NaOH addition
and pulsed amperometric detection (LC-PAD) [1-3].
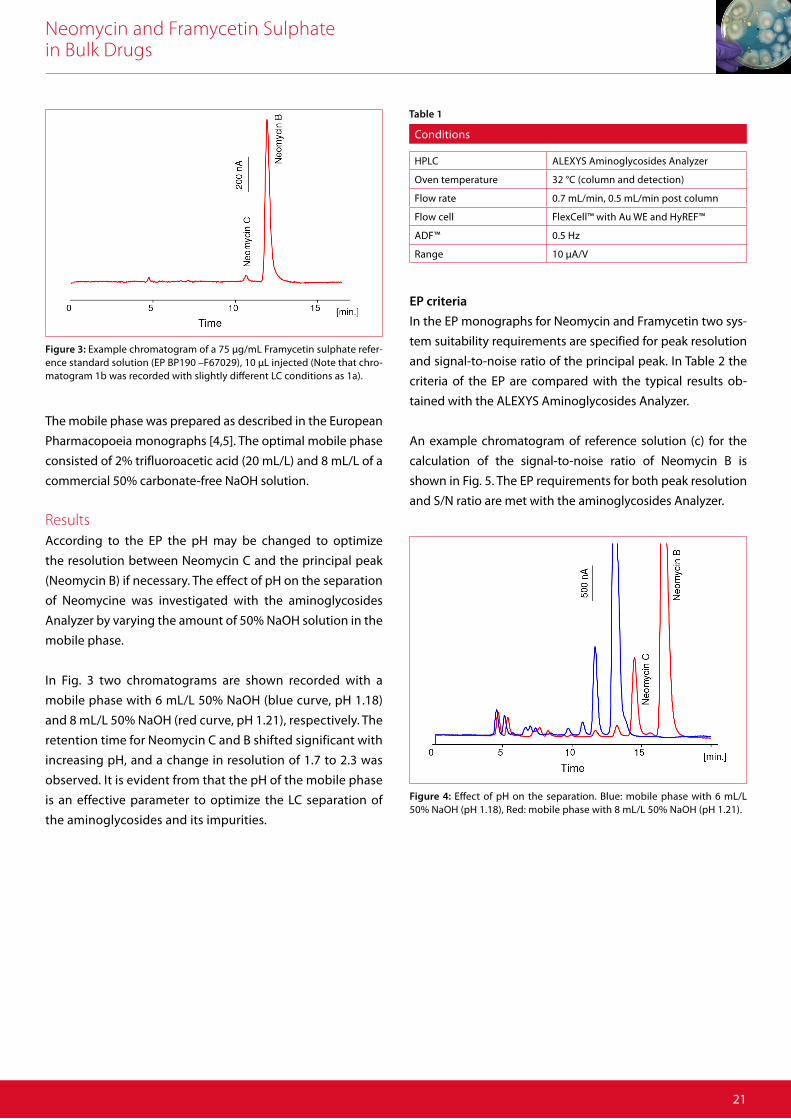
MethodThe Aminoglycosides Analyzer is applied for the analysis of
several aminoglycosides including Neomycin, Tobramycin
and Spectinomycin. The Analyzer is equipped with a second
pump for the post-column addition of 0.5M NaOH to facilitate
PAD detection of the aminoglycosides [2,3]. For post-column
mixing a low dead volume Tee connector was used and a
PEEK mixing coil with a volume of 375 μL between the Tee
and the flow cell.
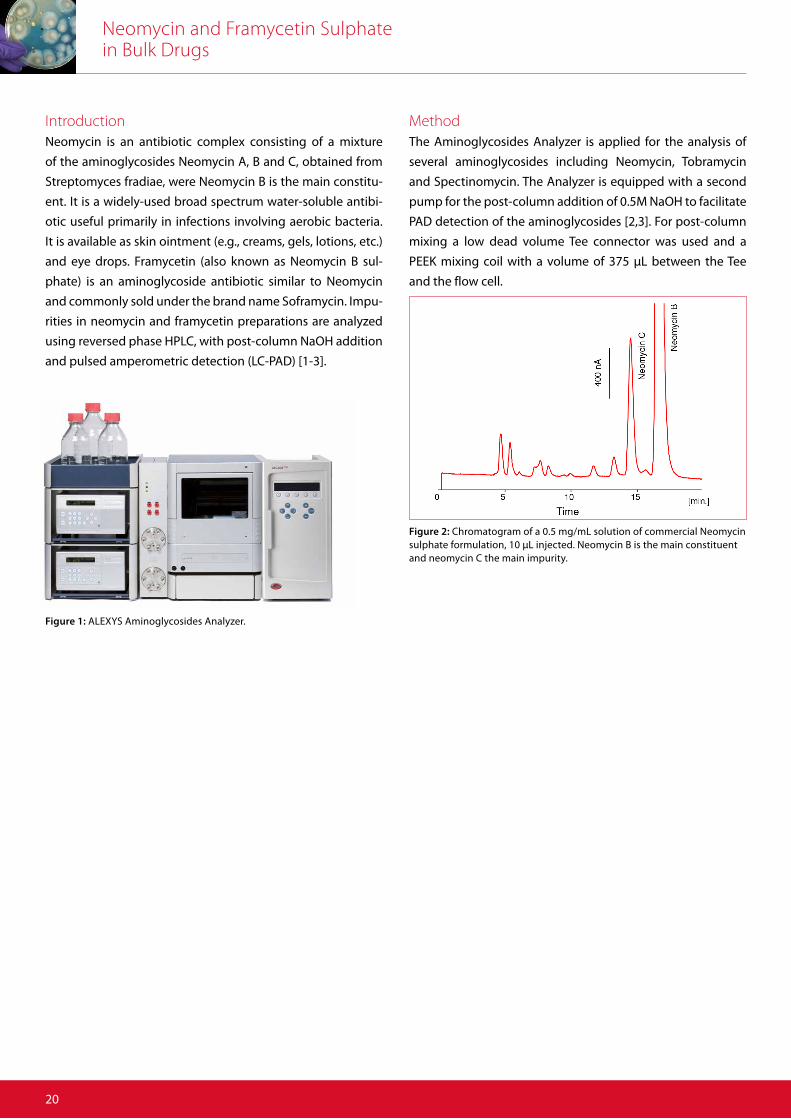
Figure 1: ALEXYS Aminoglycosides Analyzer.
Figure 2: Chromatogram of a 0.5 mg/mL solution of commercial Neomycinsulphate formulation, 10 μL injected. Neomycin B is the main constituentand neomycin C the main impurity.
Neomycin and Framycetin Sulphate in Bulk Drugs
21
EP criteria
In the EP monographs for Neomycin and Framycetin two sys-
tem suitability requirements are specified for peak resolution
and signal-to-noise ratio of the principal peak. In Table 2 the
criteria of the EP are compared with the typical results ob-
tained with the ALEXYS Aminoglycosides Analyzer.
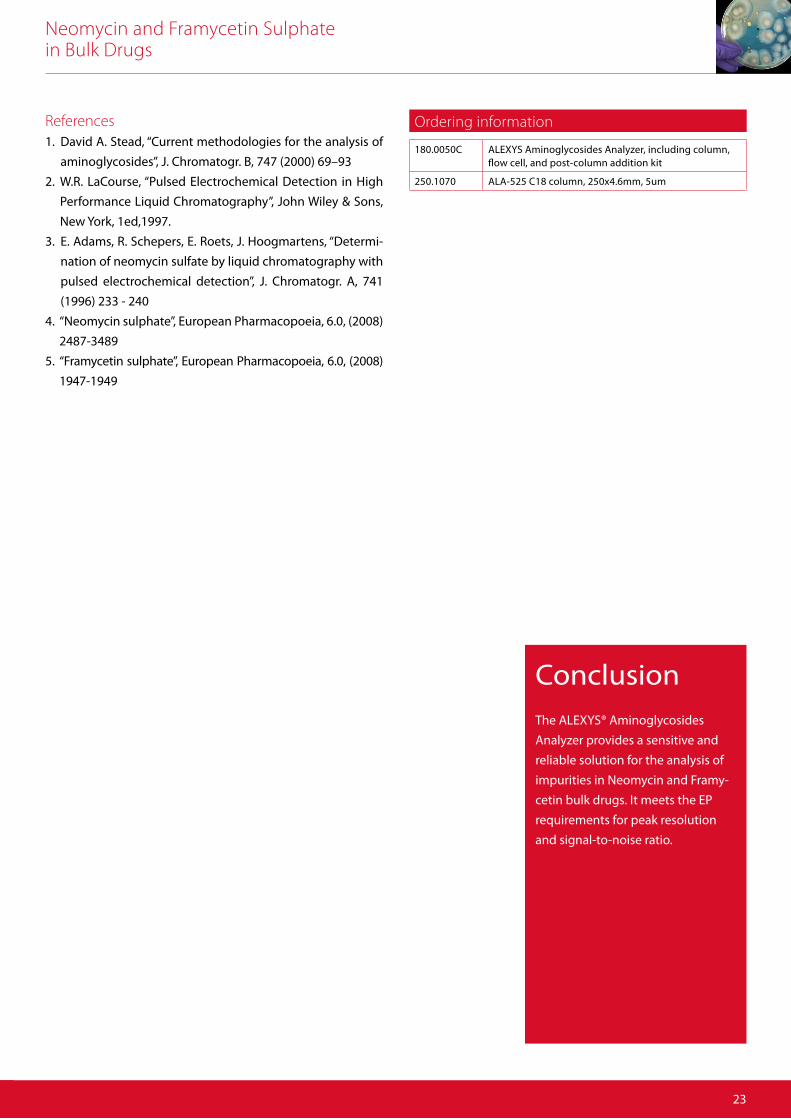
An example chromatogram of reference solution (c) for the
calculation of the signal-to-noise ratio of Neomycin B is
shown in Fig. 5. The EP requirements for both peak resolution
and S/N ratio are met with the aminoglycosides Analyzer.
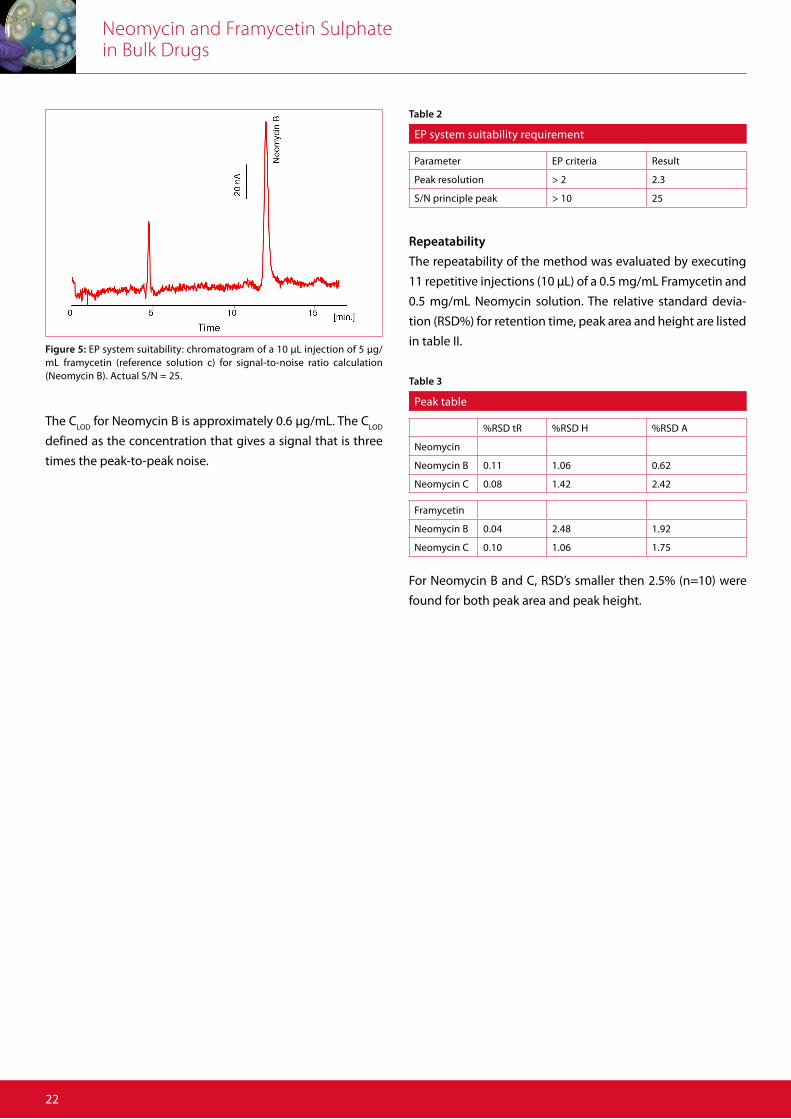
Figure 3: Example chromatogram of a 75 μg/mL Framycetin sulphate refer-ence standard solution (EP BP190 –F67029), 10 μL injected (Note that chro-matogram 1b was recorded with slightly different LC conditions as 1a).
The mobile phase was prepared as described in the European
Pharmacopoeia monographs [4,5]. The optimal mobile phase
consisted of 2% trifluoroacetic acid (20 mL/L) and 8 mL/L of a
commercial 50% carbonate-free NaOH solution.
ResultsAccording to the EP the pH may be changed to optimize
the resolution between Neomycin C and the principal peak
(Neomycin B) if necessary. The effect of pH on the separation
of Neomycine was investigated with the aminoglycosides
Analyzer by varying the amount of 50% NaOH solution in the
mobile phase.
In Fig. 3 two chromatograms are shown recorded with a
mobile phase with 6 mL/L 50% NaOH (blue curve, pH 1.18)
and 8 mL/L 50% NaOH (red curve, pH 1.21), respectively. The
retention time for Neomycin C and B shifted significant with
increasing pH, and a change in resolution of 1.7 to 2.3 was
observed. It is evident from that the pH of the mobile phase
is an effective parameter to optimize the LC separation of
the aminoglycosides and its impurities.
Conditions
HPLC ALEXYS Aminoglycosides Analyzer
Oven temperature 32 °C (column and detection)
Flow rate 0.7 mL/min, 0.5 mL/min post column
Flow cell FlexCell™ with Au WE and HyREF™
ADF™ 0.5 Hz
Range 10 μA/V
Table 1
Figure 4: Effect of pH on the separation. Blue: mobile phase with 6 mL/L 50% NaOH (pH 1.18), Red: mobile phase with 8 mL/L 50% NaOH (pH 1.21).
Neomycin and Framycetin Sulphate in Bulk Drugs
22
EP system suitability requirement
Parameter EP criteria Result
Peak resolution > 2 2.3
S/N principle peak > 10 25
Table 2
Repeatability
The repeatability of the method was evaluated by executing
11 repetitive injections (10 μL) of a 0.5 mg/mL Framycetin and
0.5 mg/mL Neomycin solution. The relative standard devia-
tion (RSD%) for retention time, peak area and height are listed
in table II.
Peak table
%RSD tR %RSD H %RSD A
Neomycin
Neomycin B 0.11 1.06 0.62
Neomycin C 0.08 1.42 2.42
Framycetin
Neomycin B 0.04 2.48 1.92
Neomycin C 0.10 1.06 1.75
Table 3
For Neomycin B and C, RSD’s smaller then 2.5% (n=10) were
found for both peak area and peak height.
Figure 5: EP system suitability: chromatogram of a 10 μL injection of 5 μg/mL framycetin (reference solution c) for signal-to-noise ratio calculation (Neomycin B). Actual S/N = 25.
The CLOD
for Neomycin B is approximately 0.6 μg/mL. The CLOD
defined as the concentration that gives a signal that is three
times the peak-to-peak noise.
Ordering information
180.0050C ALEXYS Aminoglycosides Analyzer, including column,flow cell, and post-column addition kit
250.1070 ALA-525 C18 column, 250x4.6mm, 5um
References1. David A. Stead, “Current methodologies for the analysis of
aminoglycosides”, J. Chromatogr. B, 747 (2000) 69–93
2. W.R. LaCourse, “Pulsed Electrochemical Detection in High
Performance Liquid Chromatography”, John Wiley & Sons,
New York, 1ed,1997.
3. E. Adams, R. Schepers, E. Roets, J. Hoogmartens, “Determi-
nation of neomycin sulfate by liquid chromatography with
pulsed electrochemical detection”, J. Chromatogr. A, 741
(1996) 233 - 240
4. “Neomycin sulphate”, European Pharmacopoeia, 6.0, (2008)
2487-3489
5. “Framycetin sulphate”, European Pharmacopoeia, 6.0, (2008)
1947-1949
23
Neomycin and Framycetin Sulphate in Bulk Drugs
ConclusionThe ALEXYS® Aminoglycosides
Analyzer provides a sensitive and
reliable solution for the analysis of
impurities in Neomycin and Framy-
cetin bulk drugs. It meets the EP
requirements for peak resolution
and signal-to-noise ratio.

Electrochemistry Discover the difference
Science is a way ofthinking much more
than it is a bodyof knowledge.
Carl Sagan
24
The most reliable LC-ECapplications forAntibiotics analysis
AminoglycosidesAmikacinFramycetin SulphateGentamicin SulphateKanamycin SulphateLincomycinNeomycinSpectinomycinTobramycin
Macrolide antibioticsAzithromycinAzaerythromycinClarithromycinErythromycinRoxithromycin
ALEXYS Application Note # 217_031_04
Netilmicin Sulphate According to EP Method
Summary The Netilmicin sulphate analysis was evaluated on an Antec ALEXYS LC-EC Analyzer, using the ex-
act method and conditions described in the official 2014 EP monograph (8.1).
In this application note typical results obtained with the ALEXYS® aminoglycosides Analyzer are
reported, demonstrating its performance for the routine analysis of Netilmicin sulphate in phar-
maceutical preparations.
n European Pharmacopoeia 8.1 (2014)
n Analysis of composition and impurities
n Reproducible & robust
Electrochemistry Discover the difference
Application NoteAminoglycoside Antibiotics
26
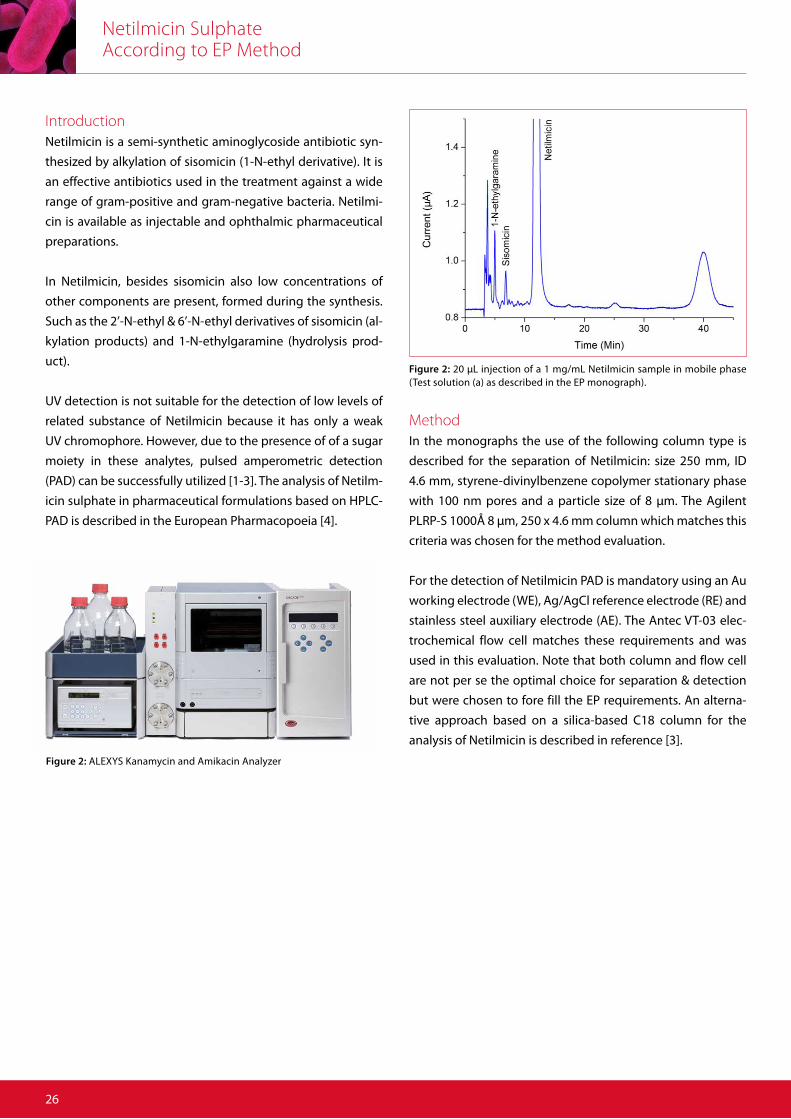
Introduction Netilmicin is a semi-synthetic aminoglycoside antibiotic syn-
thesized by alkylation of sisomicin (1-N-ethyl derivative). It is
an effective antibiotics used in the treatment against a wide
range of gram-positive and gram-negative bacteria. Netilmi-
cin is available as injectable and ophthalmic pharmaceutical
preparations.
In Netilmicin, besides sisomicin also low concentrations of
other components are present, formed during the synthesis.
Such as the 2’-N-ethyl & 6’-N-ethyl derivatives of sisomicin (al-
kylation products) and 1-N-ethylgaramine (hydrolysis prod-
uct).
UV detection is not suitable for the detection of low levels of
related substance of Netilmicin because it has only a weak
UV chromophore. However, due to the presence of of a sugar
moiety in these analytes, pulsed amperometric detection
(PAD) can be successfully utilized [1-3]. The analysis of Netilm-
icin sulphate in pharmaceutical formulations based on HPLC-
PAD is described in the European Pharmacopoeia [4].
MethodIn the monographs the use of the following column type is
described for the separation of Netilmicin: size 250 mm, ID
4.6 mm, styrene-divinylbenzene copolymer stationary phase
with 100 nm pores and a particle size of 8 μm. The Agilent
PLRP-S 1000Å 8 μm, 250 x 4.6 mm column which matches this
criteria was chosen for the method evaluation.
For the detection of Netilmicin PAD is mandatory using an Au
working electrode (WE), Ag/AgCl reference electrode (RE) and
stainless steel auxiliary electrode (AE). The Antec VT-03 elec-
trochemical flow cell matches these requirements and was
used in this evaluation. Note that both column and flow cell
are not per se the optimal choice for separation & detection
but were chosen to fore fill the EP requirements. An alterna-
tive approach based on a silica-based C18 column for the
analysis of Netilmicin is described in reference [3].
Figure 2: 20 μL injection of a 1 mg/mL Netilmicin sample in mobile phase (Test solution (a) as described in the EP monograph).
Figure 2: ALEXYS Kanamycin and Amikacin Analyzer
Netilmicin Sulphate According to EP Method
27
LC-EC conditions
HPLC ALEXYS Aminoglycosides Analyzer with post-column addition kit (375 µL mixing coil)
Column 4.6 mm ID x 25 cm, packing styrene-divi-nylbenzene copolymer with a pore size of 100 nm, particle size 8µm
Mobile phase 35 g/L of anhydrous sodium sulfate, 2.0 g/L of sodium octane sulphate, 10ml/L tetrahydrofuran, 50ml/L 0.2M potassium dihydrogen phosphate previously ad-justed to pH3.0 with a 22.5g/L solution of phosphoric acid.
Reagent 20 g/L sodium hydroxide (carbonate-free)
Flow rate 1.0 mL/min, post-column: 0.3 mL/min
Vinjection 20 µL
Temperature 50°C for separation, mixing and detection
Flow cell VT-03™ with Au WE, stainless steel AE and Ag/AgCl RE, spacer 120 µm
Potential waveform E1, E2, E3: +0.05, +0.75, -0.15 Vts, t1, t2, t3: 0.2, 0.4, 0.2, 0.4 s
Range 20 µA
I-cell ca. 2.5 µA
ADF 0.5 Hz
Table 1
The ALEXYS LC-EC Analyzer was equipped with a second
pump for the post-column addition of 20 g/L NaOH (carbon-
ate-free). Mixing of the post-column reagent was achieved
using a 375 µL PEEK mixing coil.
The mobile phase was prepared as described in the EP (Table
1). The concentration sodium octane sulphate was adjusted
to 2 g/L to optimize the separation. Note: only use stabi-
lized THF (stabilized with butylhydroxytoluene) in the mobile
phase to assure low cell currents.
A 3 step waveform was applied with the following settings E1
= +0.05 V, E2 = +0.75 V, E3 = -0.15 V, t1 = 0.4 s, t2 = 0.15 s, t3 =
0.45 and ts = 300ms [1,4]. The cell current was typical about
2.5 µA with these PAD settings.
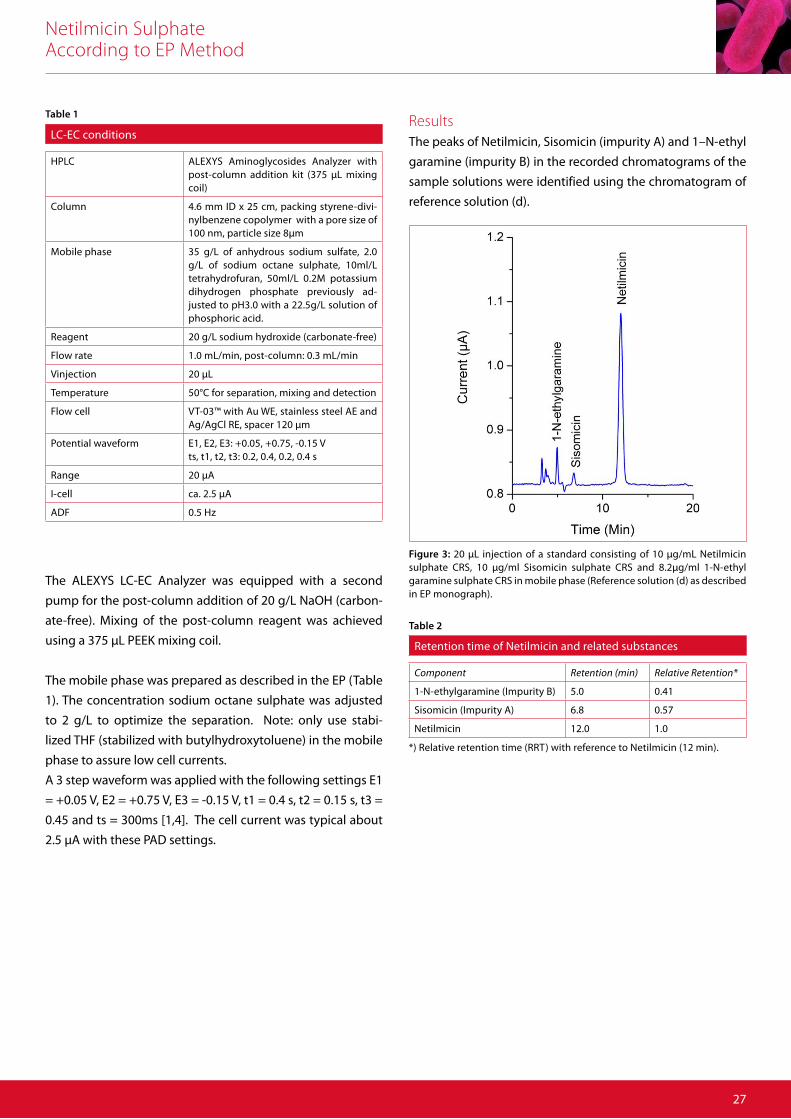
Retention time of Netilmicin and related substances
Component Retention (min) Relative Retention*
1-N-ethylgaramine (Impurity B) 5.0 0.41
Sisomicin (Impurity A) 6.8 0.57
Netilmicin 12.0 1.0
*) Relative retention time (RRT) with reference to Netilmicin (12 min).
Table 2
Figure 3: 20 μL injection of a standard consisting of 10 μg/mL Netilmicin sulphate CRS, 10 μg/ml Sisomicin sulphate CRS and 8.2μg/ml 1-N-ethyl garamine sulphate CRS in mobile phase (Reference solution (d) as described in EP monograph).
ResultsThe peaks of Netilmicin, Sisomicin (impurity A) and 1–N-ethyl
garamine (impurity B) in the recorded chromatograms of the
sample solutions were identified using the chromatogram of
reference solution (d).
Netilmicin Sulphate According to EP Method
28
Repeatability (n=6)
Component RSD Area* (%)
Measured
1-N-Ethylgaramine (Impurity B) 1.2 4.5
Sisomicin (Impurity A) 1.9 8.0
Netilmicin 0.6 15.3
*) RSD’s based on 6 repetitive injections of reference solution (d).
Table 4
Sample analysis
An unknown Netilmicin sample (K62) was analyzed to deter-
mine the composition and related substances (impurities) us-
ing the acceptance criteria described in the EP monograph.
For that purpose all relevant impurities were quantified in test
solution (a) and compared to the response of the correspond-
ing peaks obtained from the chromatogram of reference solu-
tion (d). The chromatograms of test solution (a) and reference
solution (d) are shown in figure 1 and 2, respectively.
Linearity and repeatability
The linearity of Netilmicin and the impurities A and B were
investigated in the concentration range of 10 – 30 μg/mL. For
all components the correlation coefficients were better than
0.997 for peak areas. The relative standard deviation (RSD) in
peak area was determined for 6 replicate injections of refer-
ence solution (d), see figure 2 and table 4. The RSD was < 2%
for the impurities and 0.6% for the Netilmicin peak.
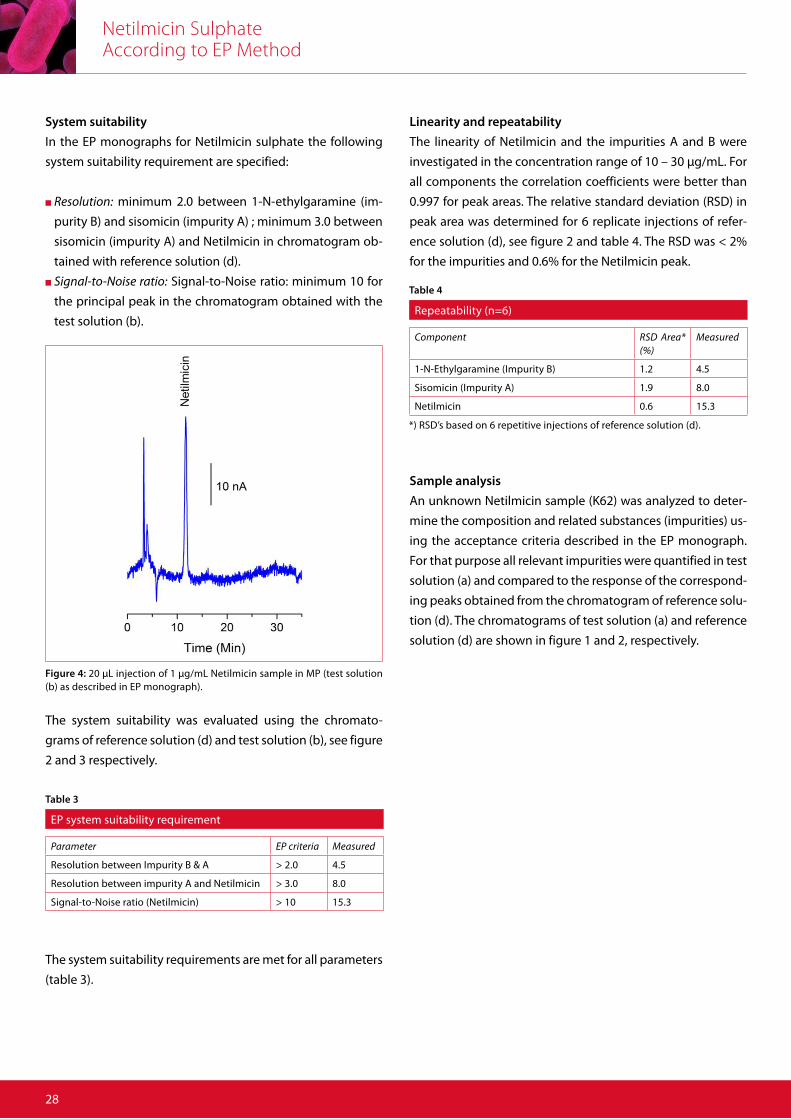
System suitability
In the EP monographs for Netilmicin sulphate the following
system suitability requirement are specified:
n Resolution: minimum 2.0 between 1-N-ethylgaramine (im-
purity B) and sisomicin (impurity A) ; minimum 3.0 between
sisomicin (impurity A) and Netilmicin in chromatogram ob-
tained with reference solution (d).
n Signal-to-Noise ratio: Signal-to-Noise ratio: minimum 10 for
the principal peak in the chromatogram obtained with the
test solution (b).
EP system suitability requirement
Parameter EP criteria Measured
Resolution between Impurity B & A > 2.0 4.5
Resolution between impurity A and Netilmicin > 3.0 8.0
Signal-to-Noise ratio (Netilmicin) > 10 15.3
Table 3
Figure 4: 20 μL injection of 1 μg/mL Netilmicin sample in MP (test solution (b) as described in EP monograph).
The system suitability was evaluated using the chromato-
grams of reference solution (d) and test solution (b), see figure
2 and 3 respectively.
The system suitability requirements are met for all parameters
(table 3).
Netilmicin Sulphate According to EP Method
29
ConclusionThe ALEXYS Aminoglycosides Ana-
lyzer provides a suitable solution for
the analysis of the composition &
impurities in commercial Netilmicin
formulations following the official
method of the EP.
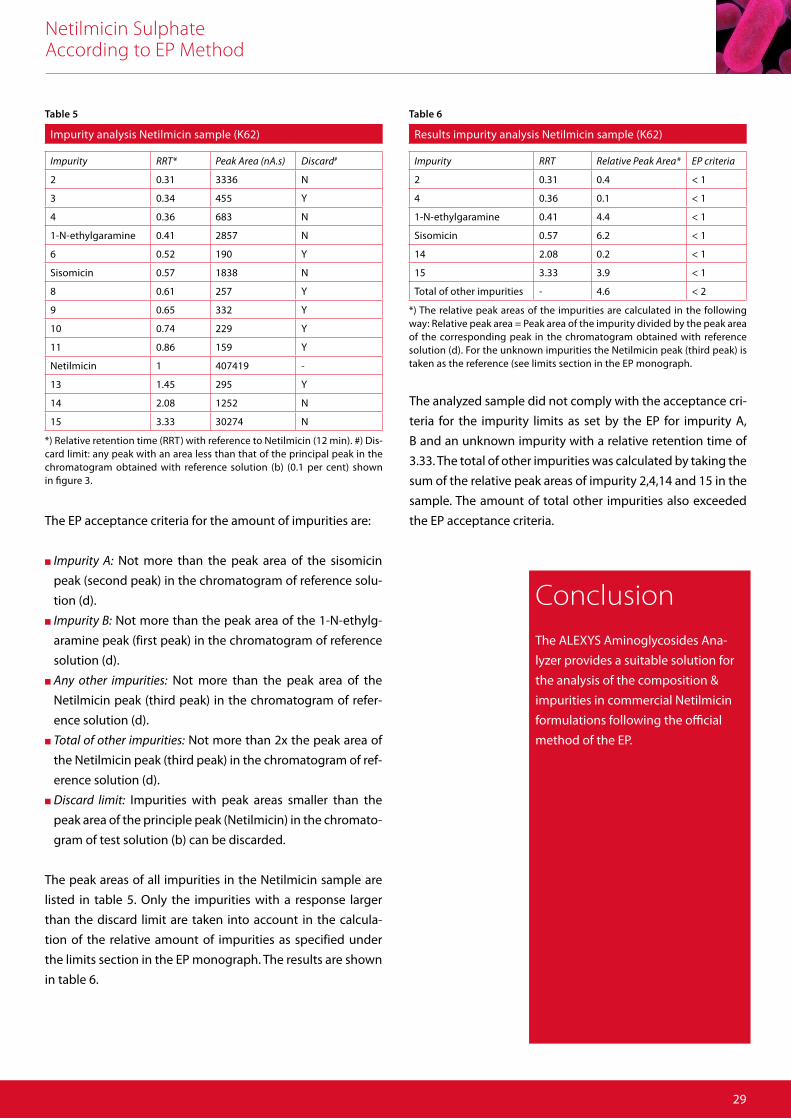
Impurity analysis Netilmicin sample (K62)
Impurity RRT* Peak Area (nA.s) Discard#
2 0.31 3336 N
3 0.34 455 Y
4 0.36 683 N
1-N-ethylgaramine 0.41 2857 N
6 0.52 190 Y
Sisomicin 0.57 1838 N
8 0.61 257 Y
9 0.65 332 Y
10 0.74 229 Y
11 0.86 159 Y
Netilmicin 1 407419 -
13 1.45 295 Y
14 2.08 1252 N
15 3.33 30274 N
*) Relative retention time (RRT) with reference to Netilmicin (12 min). #) Dis-card limit: any peak with an area less than that of the principal peak in the chromatogram obtained with reference solution (b) (0.1 per cent) shown in figure 3.
Table 5
The EP acceptance criteria for the amount of impurities are:
n Impurity A: Not more than the peak area of the sisomicin
peak (second peak) in the chromatogram of reference solu-
tion (d).
n Impurity B: Not more than the peak area of the 1-N-ethylg-
aramine peak (first peak) in the chromatogram of reference
solution (d).
n Any other impurities: Not more than the peak area of the
Netilmicin peak (third peak) in the chromatogram of refer-
ence solution (d).
n Total of other impurities: Not more than 2x the peak area of
the Netilmicin peak (third peak) in the chromatogram of ref-
erence solution (d).
n Discard limit: Impurities with peak areas smaller than the
peak area of the principle peak (Netilmicin) in the chromato-
gram of test solution (b) can be discarded.
The peak areas of all impurities in the Netilmicin sample are
listed in table 5. Only the impurities with a response larger
than the discard limit are taken into account in the calcula-
tion of the relative amount of impurities as specified under
the limits section in the EP monograph. The results are shown
in table 6.
Results impurity analysis Netilmicin sample (K62)
Impurity RRT Relative Peak Area* EP criteria
2 0.31 0.4 < 1
4 0.36 0.1 < 1
1-N-ethylgaramine 0.41 4.4 < 1
Sisomicin 0.57 6.2 < 1
14 2.08 0.2 < 1
15 3.33 3.9 < 1
Total of other impurities - 4.6 < 2
*) The relative peak areas of the impurities are calculated in the following way: Relative peak area = Peak area of the impurity divided by the peak area of the corresponding peak in the chromatogram obtained with reference solution (d). For the unknown impurities the Netilmicin peak (third peak) is taken as the reference (see limits section in the EP monograph.
Table 6
The analyzed sample did not comply with the acceptance cri-
teria for the impurity limits as set by the EP for impurity A,
B and an unknown impurity with a relative retention time of
3.33. The total of other impurities was calculated by taking the
sum of the relative peak areas of impurity 2,4,14 and 15 in the
sample. The amount of total other impurities also exceeded
the EP acceptance criteria.
Netilmicin Sulphate According to EP Method
3030
Ordering information
180.0056C ALEXYS Aminoglycosides Analyzer, including column, flow cell, and post-column addition kit
250.1075 PLRP-S 1000 Å, 250x4.6mm, 8um
References1. W.R. LaCourse, “Pulsed Electrochemical Detection in High Per-
formance Liquid Chromatography”, John Wiley & Sons, New
York, 1ed,1997.
2. E. Adams, D. Peulings, M. Rafiee, E. Roets, J. Hoogmartens, J.
Chromatogr. A, 812, 151-157 (1998).
3. V. Manyanga, J. Hoogmartens, E. Adams, J. Sep. Sci., 33,
1897-1903 (2010).
4. Netilmicin sulfate, European Pharmacopoeia (EP), 8.1, (2014)
2837 -2839
Netilmicin Sulphate According to EP Method
Electrochemistry Discover the difference
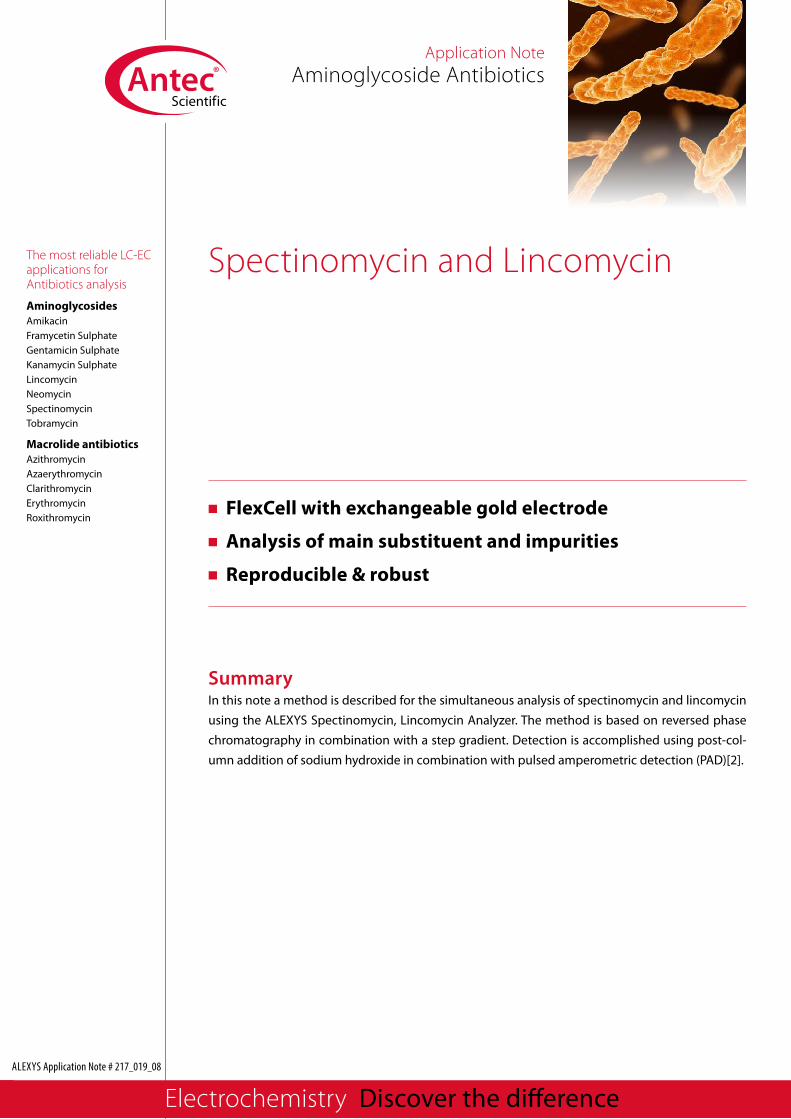
Spectinomycin and Lincomycin
SummaryIn this note a method is described for the simultaneous analysis of spectinomycin and lincomycin
using the ALEXYS Spectinomycin, Lincomycin Analyzer. The method is based on reversed phase
chromatography in combination with a step gradient. Detection is accomplished using post-col-
umn addition of sodium hydroxide in combination with pulsed amperometric detection (PAD)[2].
n FlexCell with exchangeable gold electrode
n Analysis of main substituent and impurities
n Reproducible & robust
The most reliable LC-ECapplications forAntibiotics analysis
AminoglycosidesAmikacinFramycetin SulphateGentamicin SulphateKanamycin SulphateLincomycinNeomycinSpectinomycinTobramycin
Macrolide antibioticsAzithromycinAzaerythromycinClarithromycinErythromycinRoxithromycin
Application NoteAminoglycoside Antibiotics
ALEXYS Application Note # 217_019_08
Electrochemistry Discover the difference
Spectinomycin and Lincomycin
32
Introduction Lincomycin and spectinomycin are aminoglycoside antibi-
otics that are mainly used for veterinary purposes. They are
often added as a mixture to the drinking water of poultry to
prevent respiratory infections. The simultaneous analysis of
both components in formulations is complicated by the large
difference in chromatographic retention behaviour [1].
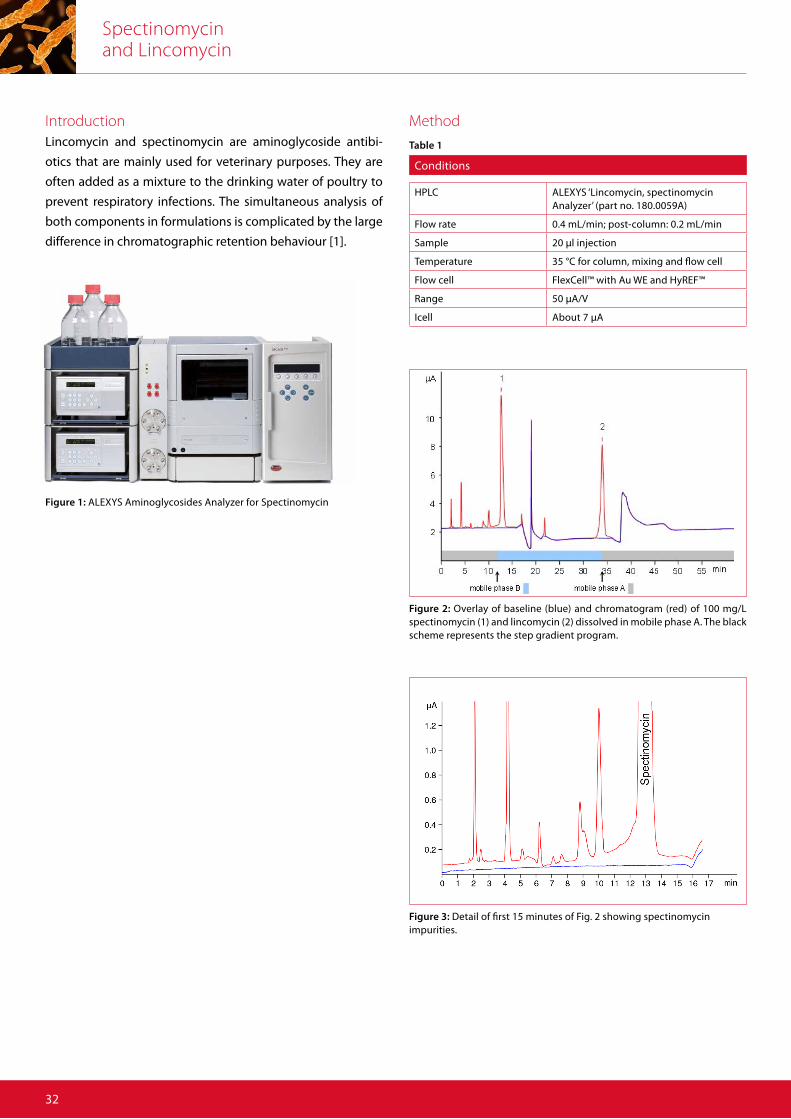
Method
Figure 2: Overlay of baseline (blue) and chromatogram (red) of 100 mg/L spectinomycin (1) and lincomycin (2) dissolved in mobile phase A. The black scheme represents the step gradient program.
Figure 3: Detail of first 15 minutes of Fig. 2 showing spectinomycinimpurities.
Conditions
HPLC ALEXYS ‘Lincomycin, spectinomycin Analyzer’ (part no. 180.0059A)
Flow rate 0.4 mL/min; post-column: 0.2 mL/min
Sample 20 µl injection
Temperature 35 °C for column, mixing and flow cell
Flow cell FlexCell™ with Au WE and HyREF™
Range 50 µA/V
Icell About 7 µA
Table 1
Figure 1: ALEXYS Aminoglycosides Analyzer for Spectinomycin
Spectinomycin and Lincomycin
33
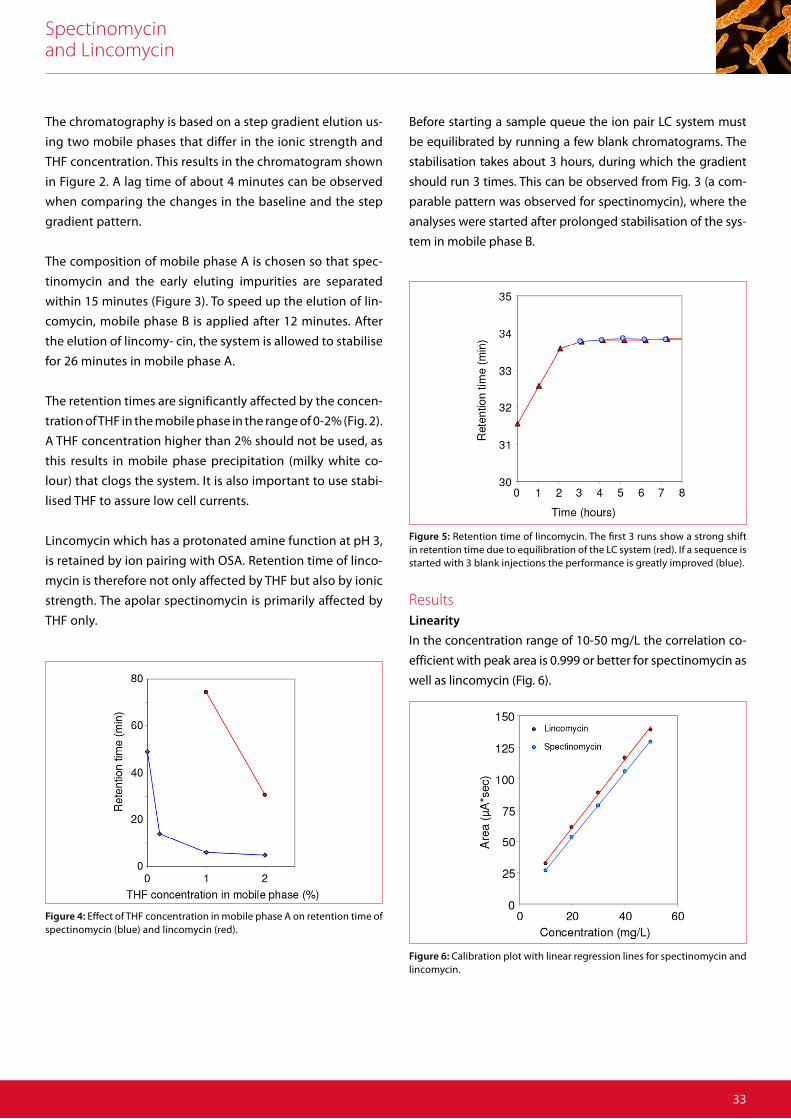
The chromatography is based on a step gradient elution us-
ing two mobile phases that differ in the ionic strength and
THF concentration. This results in the chromatogram shown
in Figure 2. A lag time of about 4 minutes can be observed
when comparing the changes in the baseline and the step
gradient pattern.
The composition of mobile phase A is chosen so that spec-
tinomycin and the early eluting impurities are separated
within 15 minutes (Figure 3). To speed up the elution of lin-
comycin, mobile phase B is applied after 12 minutes. After
the elution of lincomy- cin, the system is allowed to stabilise
for 26 minutes in mobile phase A.
The retention times are significantly affected by the concen-
tration of THF in the mobile phase in the range of 0-2% (Fig. 2).
A THF concentration higher than 2% should not be used, as
this results in mobile phase precipitation (milky white co-
lour) that clogs the system. It is also important to use stabi-
lised THF to assure low cell currents.
Lincomycin which has a protonated amine function at pH 3,
is retained by ion pairing with OSA. Retention time of linco-
mycin is therefore not only affected by THF but also by ionic
strength. The apolar spectinomycin is primarily affected by
THF only.
Figure 4: Effect of THF concentration in mobile phase A on retention time of spectinomycin (blue) and lincomycin (red).
Figure 6: Calibration plot with linear regression lines for spectinomycin and lincomycin.
Figure 5: Retention time of lincomycin. The first 3 runs show a strong shift in retention time due to equilibration of the LC system (red). If a sequence is started with 3 blank injections the performance is greatly improved (blue).
Before starting a sample queue the ion pair LC system must
be equilibrated by running a few blank chromatograms. The
stabilisation takes about 3 hours, during which the gradient
should run 3 times. This can be observed from Fig. 3 (a com-
parable pattern was observed for spectinomycin), where the
analyses were started after prolonged stabilisation of the sys-
tem in mobile phase B.
ResultsLinearity
In the concentration range of 10-50 mg/L the correlation co-
efficient with peak area is 0.999 or better for spectinomycin as
well as lincomycin (Fig. 6).
Spectinomycin and Lincomycin
34
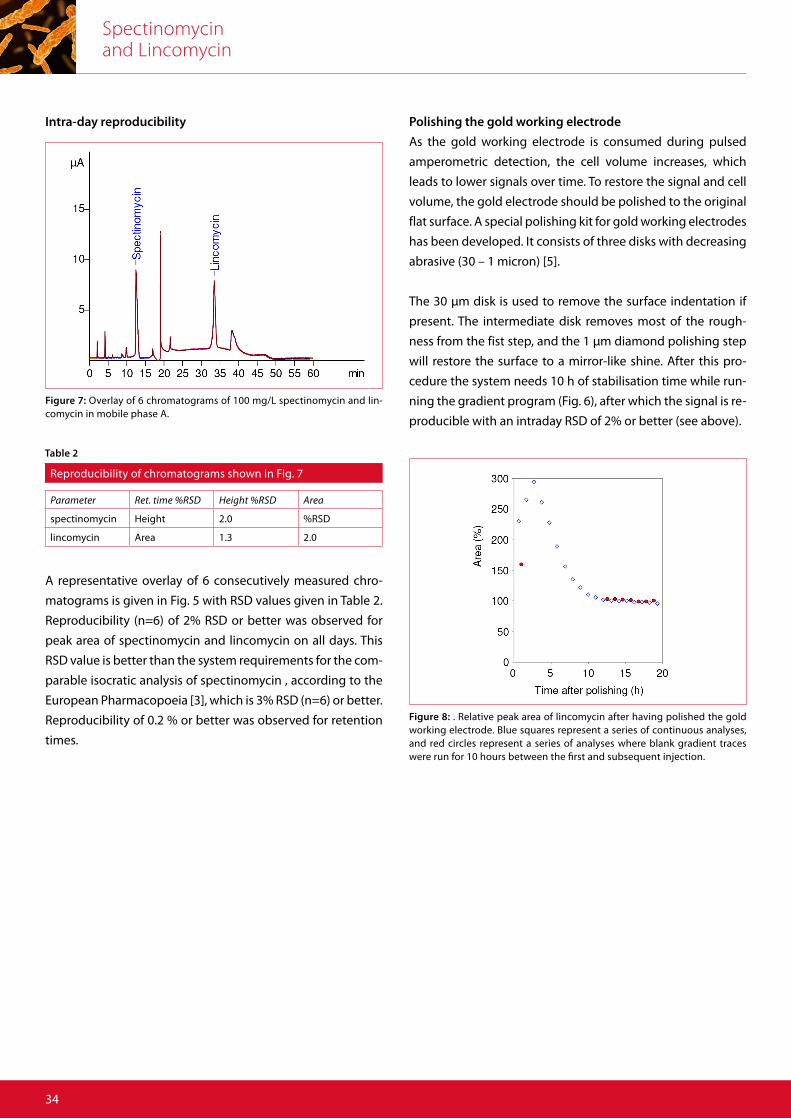
Polishing the gold working electrode
As the gold working electrode is consumed during pulsed
amperometric detection, the cell volume increases, which
leads to lower signals over time. To restore the signal and cell
volume, the gold electrode should be polished to the original
flat surface. A special polishing kit for gold working electrodes
has been developed. It consists of three disks with decreasing
abrasive (30 – 1 micron) [5].
The 30 μm disk is used to remove the surface indentation if
present. The intermediate disk removes most of the rough-
ness from the fist step, and the 1 μm diamond polishing step
will restore the surface to a mirror-like shine. After this pro-
cedure the system needs 10 h of stabilisation time while run-
ning the gradient program (Fig. 6), after which the signal is re-
producible with an intraday RSD of 2% or better (see above).
Figure 8: . Relative peak area of lincomycin after having polished the gold working electrode. Blue squares represent a series of continuous analyses, and red circles represent a series of analyses where blank gradient traces were run for 10 hours between the first and subsequent injection.
Figure 7: Overlay of 6 chromatograms of 100 mg/L spectinomycin and lin-comycin in mobile phase A.
Intra-day reproducibility
Reproducibility of chromatograms shown in Fig. 7
Parameter Ret. time %RSD Height %RSD Area
spectinomycin Height 2.0 %RSD
lincomycin Area 1.3 2.0
Table 2
A representative overlay of 6 consecutively measured chro-
matograms is given in Fig. 5 with RSD values given in Table 2.
Reproducibility (n=6) of 2% RSD or better was observed for
peak area of spectinomycin and lincomycin on all days. This
RSD value is better than the system requirements for the com-
parable isocratic analysis of spectinomycin , according to the
European Pharmacopoeia [3], which is 3% RSD (n=6) or better.
Reproducibility of 0.2 % or better was observed for retention
times.
34
Spectinomycin and Lincomycin
35
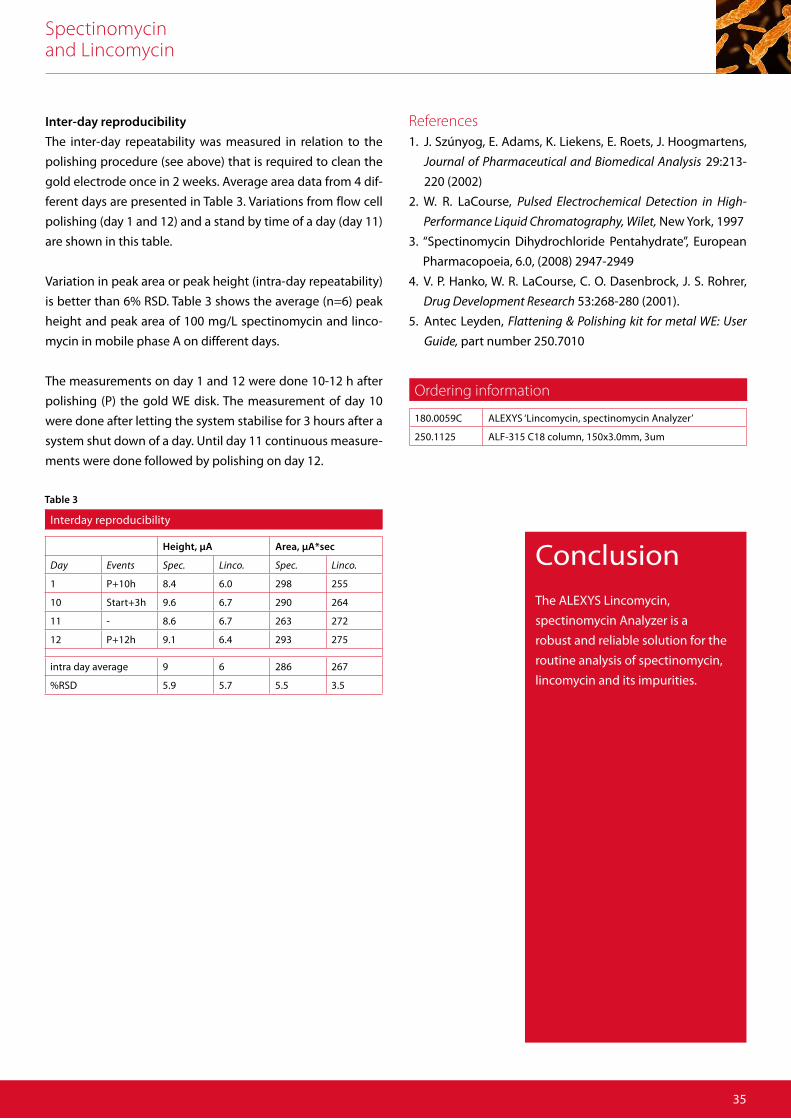
ConclusionThe ALEXYS Lincomycin,
spectinomycin Analyzer is a
robust and reliable solution for the
routine analysis of spectinomycin,
lincomycin and its impurities.
Inter-day reproducibility
The inter-day repeatability was measured in relation to the
polishing procedure (see above) that is required to clean the
gold electrode once in 2 weeks. Average area data from 4 dif-
ferent days are presented in Table 3. Variations from flow cell
polishing (day 1 and 12) and a stand by time of a day (day 11)
are shown in this table.
Variation in peak area or peak height (intra-day repeatability)
is better than 6% RSD. Table 3 shows the average (n=6) peak
height and peak area of 100 mg/L spectinomycin and linco-
mycin in mobile phase A on different days.
The measurements on day 1 and 12 were done 10-12 h after
polishing (P) the gold WE disk. The measurement of day 10
were done after letting the system stabilise for 3 hours after a
system shut down of a day. Until day 11 continuous measure-
ments were done followed by polishing on day 12.
Interday reproducibility
Height, µA Area, µA*sec
Day Events Spec. Linco. Spec. Linco.
1 P+10h 8.4 6.0 298 255
10 Start+3h 9.6 6.7 290 264
11 - 8.6 6.7 263 272
12 P+12h 9.1 6.4 293 275
intra day average 9 6 286 267
%RSD 5.9 5.7 5.5 3.5
Table 3
Ordering information
180.0059C ALEXYS ‘Lincomycin, spectinomycin Analyzer’
250.1125 ALF-315 C18 column, 150x3.0mm, 3um
References1. J. Szúnyog, E. Adams, K. Liekens, E. Roets, J. Hoogmartens,
Journal of Pharmaceutical and Biomedical Analysis 29:213-
220 (2002)
2. W. R. LaCourse, Pulsed Electrochemical Detection in High-
Performance Liquid Chromatography, Wilet, New York, 1997
3. “Spectinomycin Dihydrochloride Pentahydrate”, European
Pharmacopoeia, 6.0, (2008) 2947-2949
4. V. P. Hanko, W. R. LaCourse, C. O. Dasenbrock, J. S. Rohrer,
Drug Development Research 53:268-280 (2001).
5. Antec Leyden, Flattening & Polishing kit for metal WE: User
Guide, part number 250.7010

The science of today is the technology
of tomorrow.Edward Teller
3636 Electrochemistry Discover the difference

Spectinomycin in Pharmaceutical Preparations
Summary The ALEXYS® Aminoglycosides Analyzer is a dedicated LC solution for the analysis of Spectinomy-
cin, which matches the EP requirements for peak resolution and repeatability of the principal peak.
The European Pharmacopoeia, 6.0, (2008), 2947-2949 was used as a basis to set-up this method.
In this application note typical results obtained with the Aminoglycosides Analyzer are reported
demonstrating its performance for the analysis of impurities in Spectinomycin bulk drugs.
n European Pharmacopoeia 6.0 (2008) used as basis for this
application.
n FlexCell with exchangeable gold electrode
n Analysis of main substituent and impurities
n Reproducible & robust
The most reliable LC-ECapplications forAntibiotics analysis
AminoglycosidesAmikacinFramycetin SulphateGentamicin SulphateKanamycin SulphateLincomycinNeomycinSpectinomycinTobramycin
Macrolide antibioticsAzithromycinAzaerythromycinClarithromycinErythromycinRoxithromycin
Application NoteAminoglycoside Antibiotics
ALEXYS Application Note # 217_018_10
Electrochemistry Discover the difference
Spectinomycin in Pharmaceutical Preparations
38
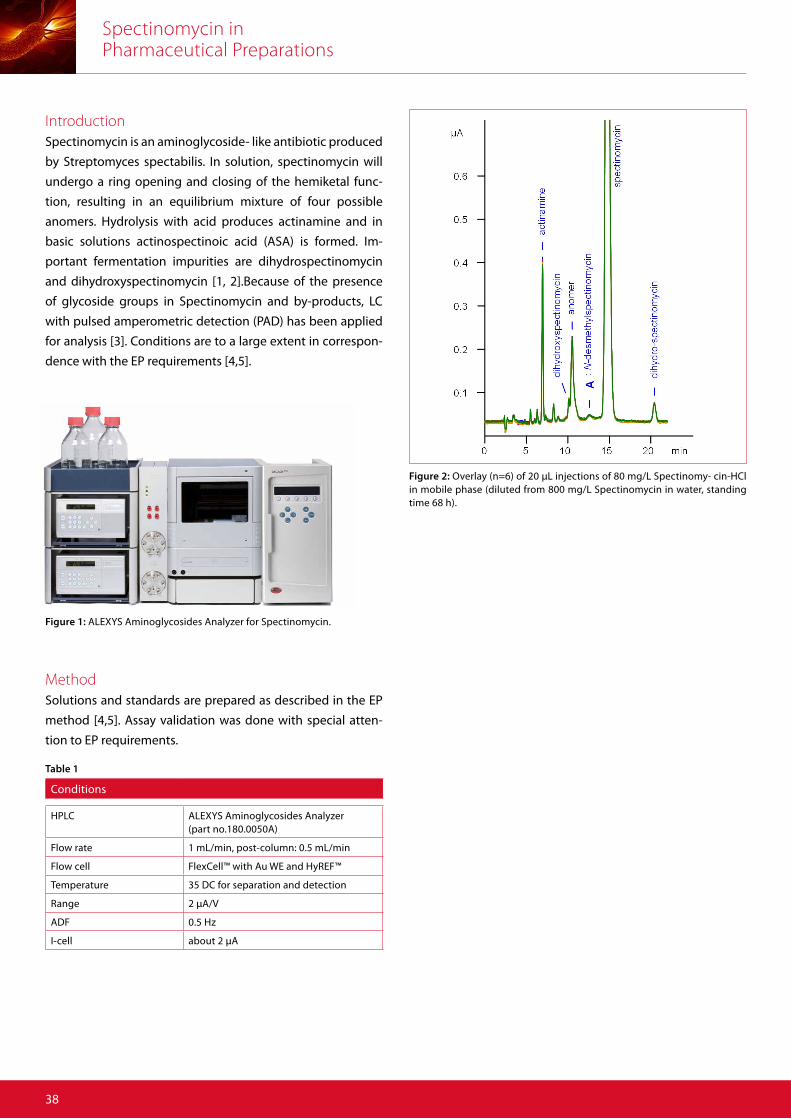
IntroductionSpectinomycin is an aminoglycoside- like antibiotic produced
by Streptomyces spectabilis. In solution, spectinomycin will
undergo a ring opening and closing of the hemiketal func-
tion, resulting in an equilibrium mixture of four possible
anomers. Hydrolysis with acid produces actinamine and in
basic solutions actinospectinoic acid (ASA) is formed. Im-
portant fermentation impurities are dihydrospectinomycin
and dihydroxyspectinomycin [1, 2].Because of the presence
of glycoside groups in Spectinomycin and by-products, LC
with pulsed amperometric detection (PAD) has been applied
for analysis [3]. Conditions are to a large extent in correspon-
dence with the EP requirements [4,5].
MethodSolutions and standards are prepared as described in the EP
method [4,5]. Assay validation was done with special atten-
tion to EP requirements.
Figure 1: ALEXYS Aminoglycosides Analyzer for Spectinomycin.
Figure 2: Overlay (n=6) of 20 µL injections of 80 mg/L Spectinomy- cin-HCl in mobile phase (diluted from 800 mg/L Spectinomycin in water, standing time 68 h).
Conditions
HPLC ALEXYS Aminoglycosides Analyzer (part no.180.0050A)
Flow rate 1 mL/min, post-column: 0.5 mL/min
Flow cell FlexCell™ with Au WE and HyREF™
Temperature 35 DC for separation and detection
Range 2 µA/V
ADF 0.5 Hz
I-cell about 2 µA
Table 1
Spectinomycin in Pharmaceutical Preparations
39
ConclusionThe ALEXYS Aminoglycosides Ana-
lyzer provides a reliable solution for
the routine analysis of Spectinomy-
cin in Pharmaceutical Preparations.
It meets the EP system suitability
requirement for resolution and
repeatability.
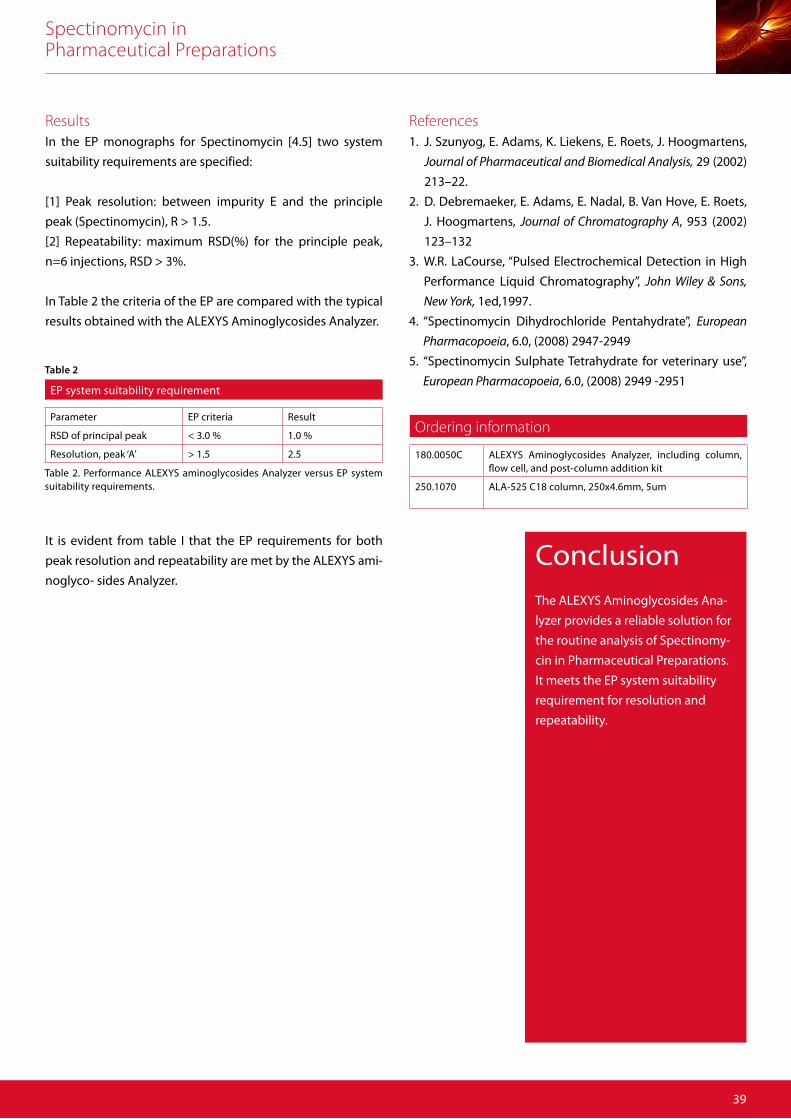
ResultsIn the EP monographs for Spectinomycin [4.5] two system
suitability requirements are specified:
[1] Peak resolution: between impurity E and the principle
peak (Spectinomycin), R > 1.5.
[2] Repeatability: maximum RSD(%) for the principle peak,
n=6 injections, RSD > 3%.
In Table 2 the criteria of the EP are compared with the typical
results obtained with the ALEXYS Aminoglycosides Analyzer.
It is evident from table I that the EP requirements for both
peak resolution and repeatability are met by the ALEXYS ami-
noglyco- sides Analyzer.
EP system suitability requirement
Parameter EP criteria Result
RSD of principal peak < 3.0 % 1.0 %
Resolution, peak ‘A’ > 1.5 2.5
Table 2. Performance ALEXYS aminoglycosides Analyzer versus EP system suitability requirements.
Table 2
Ordering information
180.0050C ALEXYS Aminoglycosides Analyzer, including column, flow cell, and post-column addition kit
250.1070 ALA-525 C18 column, 250x4.6mm, 5um
References1. J. Szunyog, E. Adams, K. Liekens, E. Roets, J. Hoogmartens,
Journal of Pharmaceutical and Biomedical Analysis, 29 (2002)
213–22.
2. D. Debremaeker, E. Adams, E. Nadal, B. Van Hove, E. Roets,
J. Hoogmartens, Journal of Chromatography A, 953 (2002)
123–132
3. W.R. LaCourse, “Pulsed Electrochemical Detection in High
Performance Liquid Chromatography”, John Wiley & Sons,
New York, 1ed,1997.
4. “Spectinomycin Dihydrochloride Pentahydrate”, European
Pharmacopoeia, 6.0, (2008) 2947-2949
5. “Spectinomycin Sulphate Tetrahydrate for veterinary use”,
European Pharmacopoeia, 6.0, (2008) 2949 -2951

Research is what I’m doing when I don’t know
what I’m doing.Wernher von Braun
40 Electrochemistry Discover the difference
Tobramycin According to EP Method
SummaryThe Tobramycin analysis in pharmaceutical preparations was evaluated on an Antec ALEXYS LC-EC
Analyzer, using the exact method and conditions described in the official 2014 EP monograph (8.1).
In this application note typical results obtained with the ALEXYS® aminoglycosides Analyzer are
reported, demonstrating its performance for the routine analysis of Tobramycin in pharmaceutical
preparations.
n European Pharmacopoeia 8.1 (2014)
n Analysis of composition and impurities
n Reproducible & robust
The most reliable LC-ECapplications forAntibiotics analysis
AminoglycosidesAmikacinFramycetin SulphateGentamicin SulphateKanamycin SulphateLincomycinNeomycinSpectinomycinTobramycin
Macrolide antibioticsAzithromycinAzaerythromycinClarithromycinErythromycinRoxithromycin
Application NoteAminoglycoside Antibiotics
ALEXYS Application Note # 217_032_04
Electrochemistry Discover the difference
Tobramycin According to EP Method
42
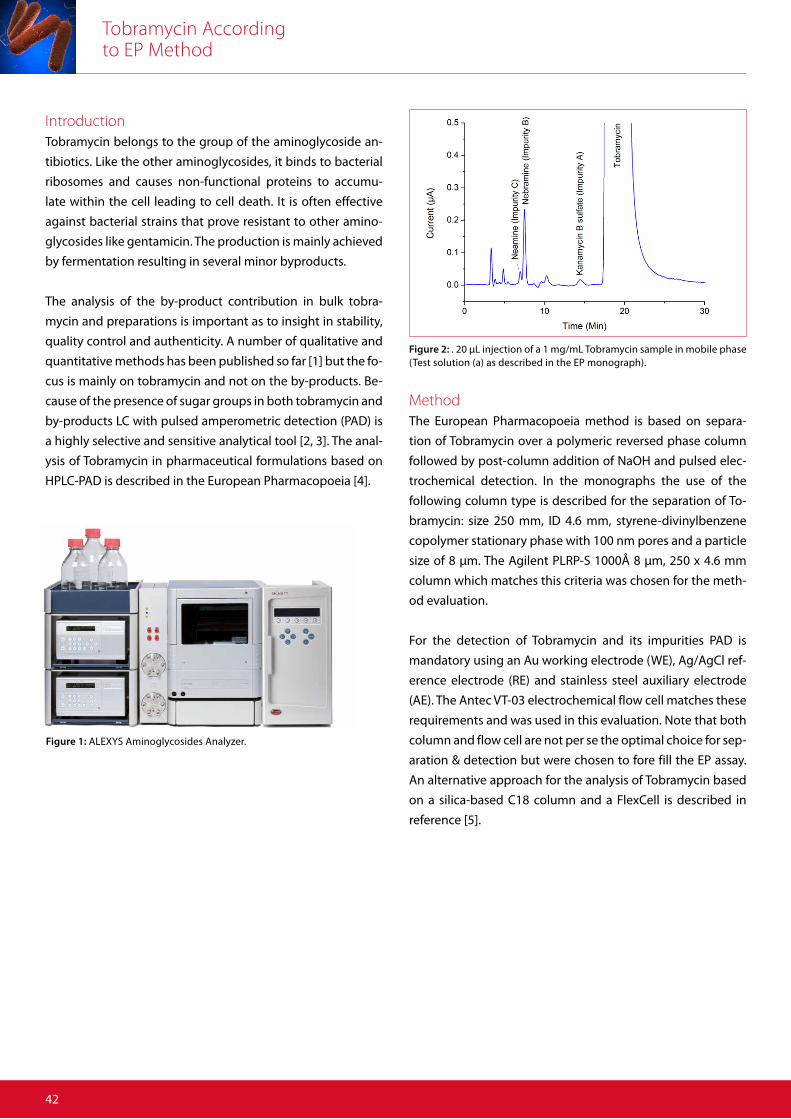
Introduction Tobramycin belongs to the group of the aminoglycoside an-
tibiotics. Like the other aminoglycosides, it binds to bacterial
ribosomes and causes non-functional proteins to accumu-
late within the cell leading to cell death. It is often effective
against bacterial strains that prove resistant to other amino-
glycosides like gentamicin. The production is mainly achieved
by fermentation resulting in several minor byproducts.
The analysis of the by-product contribution in bulk tobra-
mycin and preparations is important as to insight in stability,
quality control and authenticity. A number of qualitative and
quantitative methods has been published so far [1] but the fo-
cus is mainly on tobramycin and not on the by-products. Be-
cause of the presence of sugar groups in both tobramycin and
by-products LC with pulsed amperometric detection (PAD) is
a highly selective and sensitive analytical tool [2, 3]. The anal-
ysis of Tobramycin in pharmaceutical formulations based on
HPLC-PAD is described in the European Pharmacopoeia [4].
MethodThe European Pharmacopoeia method is based on separa-
tion of Tobramycin over a polymeric reversed phase column
followed by post-column addition of NaOH and pulsed elec-
trochemical detection. In the monographs the use of the
following column type is described for the separation of To-
bramycin: size 250 mm, ID 4.6 mm, styrene-divinylbenzene
copolymer stationary phase with 100 nm pores and a particle
size of 8 µm. The Agilent PLRP-S 1000Å 8 µm, 250 x 4.6 mm
column which matches this criteria was chosen for the meth-
od evaluation.
For the detection of Tobramycin and its impurities PAD is
mandatory using an Au working electrode (WE), Ag/AgCl ref-
erence electrode (RE) and stainless steel auxiliary electrode
(AE). The Antec VT-03 electrochemical flow cell matches these
requirements and was used in this evaluation. Note that both
column and flow cell are not per se the optimal choice for sep-
aration & detection but were chosen to fore fill the EP assay.
An alternative approach for the analysis of Tobramycin based
on a silica-based C18 column and a FlexCell is described in
reference [5].
Figure 2: . 20 µL injection of a 1 mg/mL Tobramycin sample in mobile phase (Test solution (a) as described in the EP monograph).
Figure 1: ALEXYS Aminoglycosides Analyzer.
Tobramycin According to EP Method
43
LC-EC conditions
HPLC ALEXYS aminoglycoside Analyzer with post-column addition kit (375 µL mixing coil)
Column 4.6 mm ID x 25 cm, 8µm, packing styrene-divinylbenzene copolymer with a pore size of 100 nm
Mobile phase 52 g/L of anhydrous sodium sulfate, 1.9 g/L of sodium octane sulfonate, 3mL/L tetrahydrofuran, 50mL/L 0.2M potassium dihydrogen phosphate previously adjust-ed to pH3.0 with a 10% solution of phos-phoric acid.
Post-column reagent 20 g/L NaOH (carbonate-free)
Flow rate 1.0 mL/min, post-column: 0.3 mL/min
Vinjection 20 µL
Temperature 55°C for separation, mixing and detection
Flow cell VT-03™ with Au WE, stainless steel AE and Ag/AgCl RE, spacer 100 µm
Potential waveform E1, E2, E3: +0.05, +0.75, -0.15 Vts, t1, t2, t3: 0.2, 0.4, 0.2, 0.4 s
I-cell ca. 1.8 µA
ADF 0.5 Hz
Range 10 µA
Table 1
The ALEXYS LC-EC Analyzer was equipped with a second
pump for the post-column addition of 20 g/L NaOH (carbon-
ate-free). Mixing of the post-column reagent was achieved us-
ing a 375 µL PEEK mixing coil. The mobile phase was prepared
as described in the EP monographs (Table 1). The concentra-
tion sodium oc-tane sulfonate was adjusted to 1.9 g/L to opti-
mize the separation. Note: only use stabilized THF (stabilized
with butylhydroxytoluene) in the mobile phase to assure low
background cell currents. A 3 step waveform was applied with
the following settings E1 = +0.05 V, E2 = +0.75 V, E3 = -0.15 V,
t1 = 0.4 s, t2 = 0.15 s, t3 = 0.45 and ts = 300ms. The cell current
was typical about 1.8 µA with these PAD settings.
The temperature for separation and detection was set to 55°C.
The tray-cooling of the autosampler was set to 4°C to keep
the sample vials cooled during execution of the analysis se-
quence.
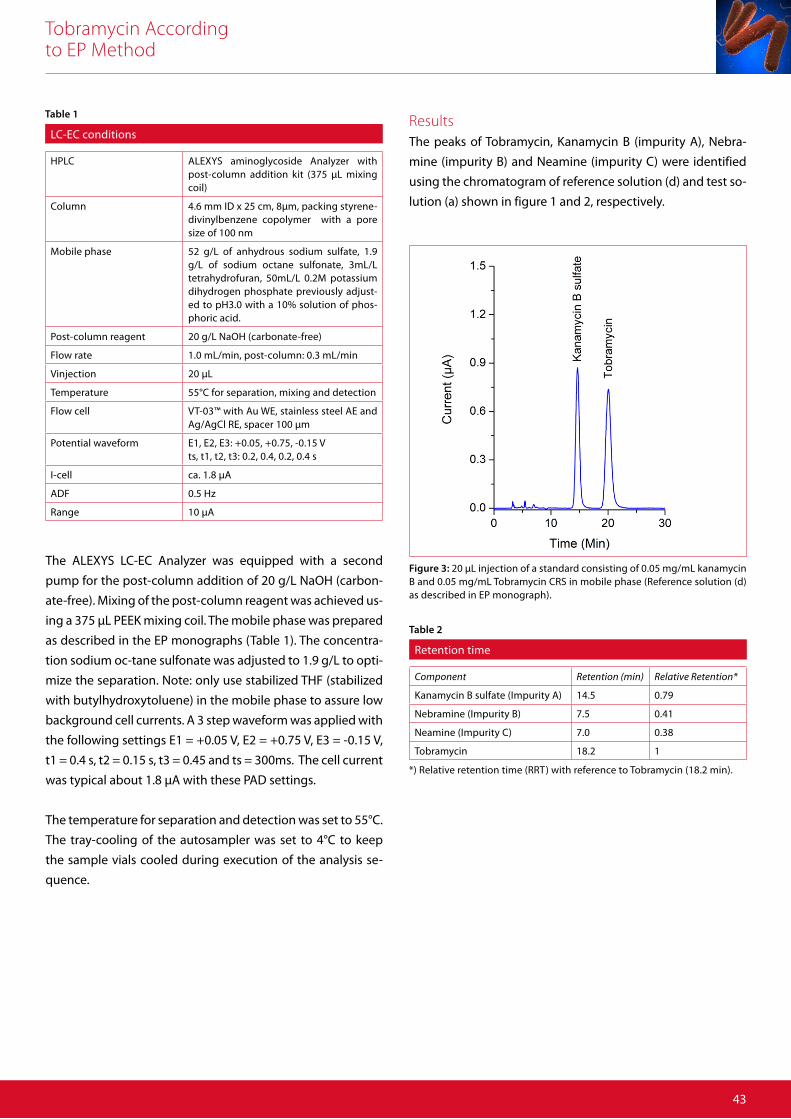
ResultsThe peaks of Tobramycin, Kanamycin B (impurity A), Nebra-
mine (impurity B) and Neamine (impurity C) were identified
using the chromatogram of reference solution (d) and test so-
lution (a) shown in figure 1 and 2, respectively.
Figure 3: 20 µL injection of a standard consisting of 0.05 mg/mL kanamycin B and 0.05 mg/mL Tobramycin CRS in mobile phase (Reference solution (d) as described in EP monograph).
Retention time
Component Retention (min) Relative Retention*
Kanamycin B sulfate (Impurity A) 14.5 0.79
Nebramine (Impurity B) 7.5 0.41
Neamine (Impurity C) 7.0 0.38
Tobramycin 18.2 1
*) Relative retention time (RRT) with reference to Tobramycin (18.2 min).
Table 2
Tobramycin According to EP Method
44
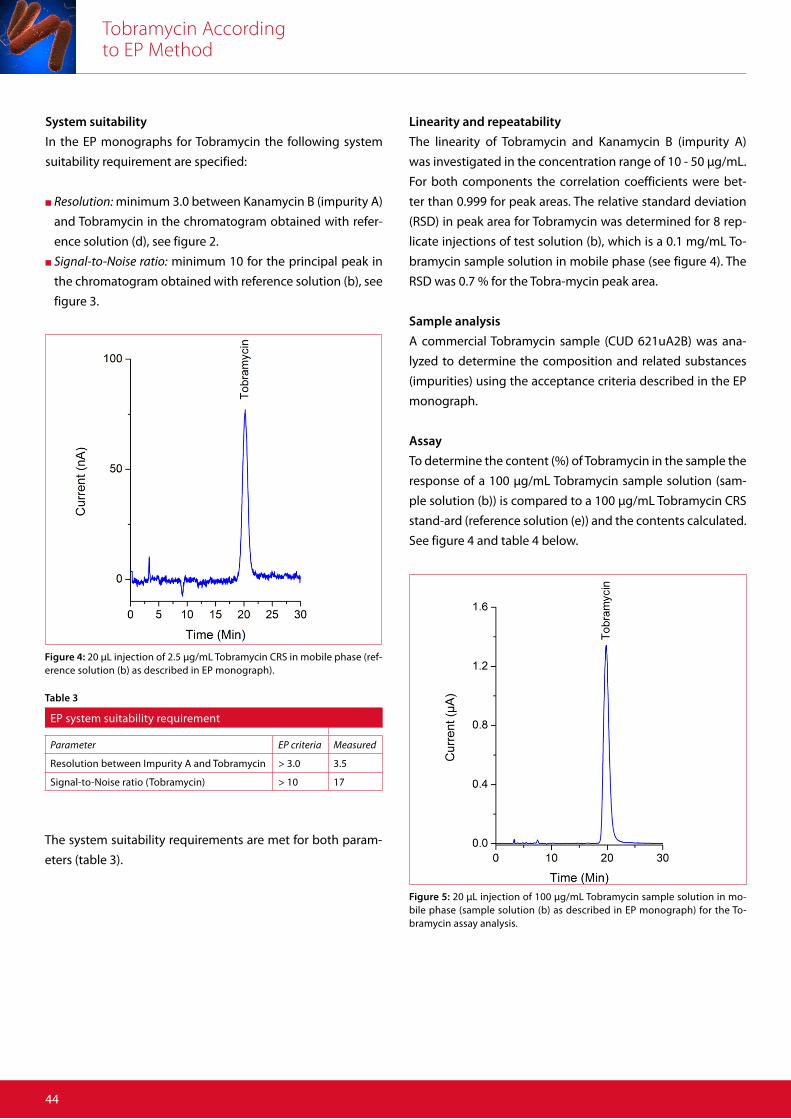
Linearity and repeatability
The linearity of Tobramycin and Kanamycin B (impurity A)
was investigated in the concentration range of 10 - 50 μg/mL.
For both components the correlation coefficients were bet-
ter than 0.999 for peak areas. The relative standard deviation
(RSD) in peak area for Tobramycin was determined for 8 rep-
licate injections of test solution (b), which is a 0.1 mg/mL To-
bramycin sample solution in mobile phase (see figure 4). The
RSD was 0.7 % for the Tobra-mycin peak area.
Sample analysis
A commercial Tobramycin sample (CUD 621uA2B) was ana-
lyzed to determine the composition and related substances
(impurities) using the acceptance criteria described in the EP
monograph.
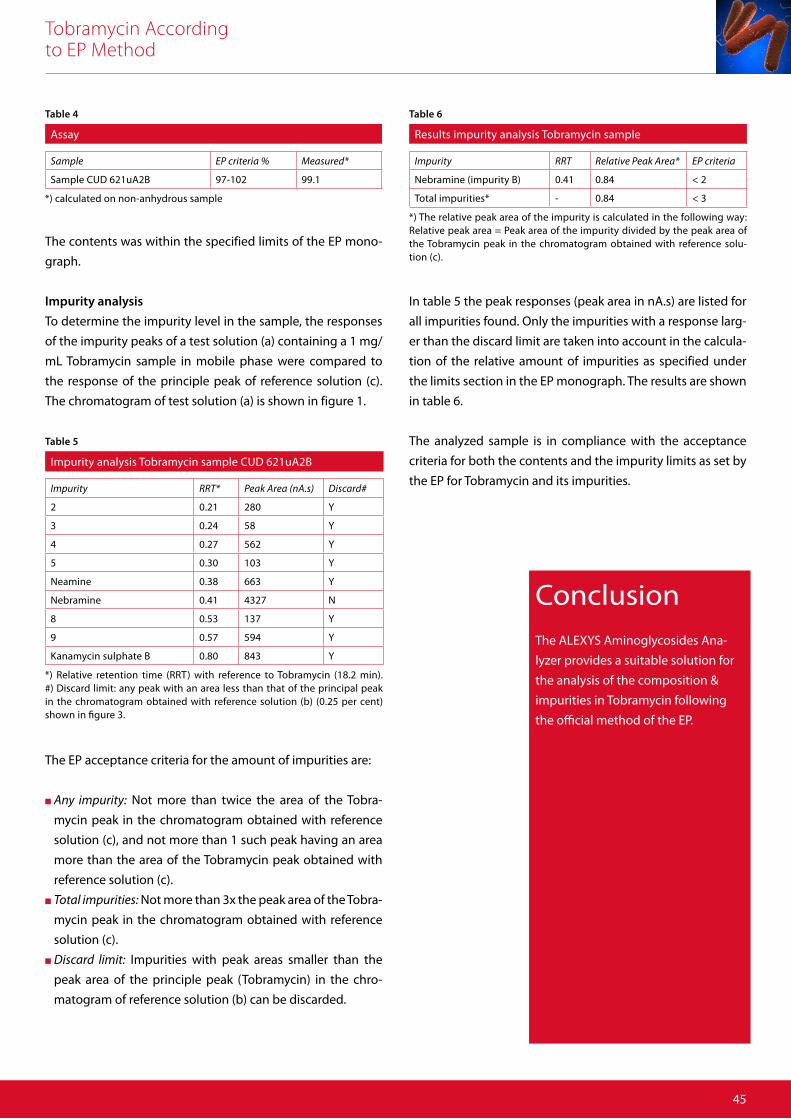
Assay
To determine the content (%) of Tobramycin in the sample the
response of a 100 µg/mL Tobramycin sample solution (sam-
ple solution (b)) is compared to a 100 µg/mL Tobramycin CRS
stand-ard (reference solution (e)) and the contents calculated.
See figure 4 and table 4 below.
Figure 5: 20 µL injection of 100 µg/mL Tobramycin sample solution in mo-bile phase (sample solution (b) as described in EP monograph) for the To-bramycin assay analysis.
Figure 4: 20 µL injection of 2.5 µg/mL Tobramycin CRS in mobile phase (ref-erence solution (b) as described in EP monograph).
System suitability
In the EP monographs for Tobramycin the following system
suitability requirement are specified:
n Resolution: minimum 3.0 between Kanamycin B (impurity A)
and Tobramycin in the chromatogram obtained with refer-
ence solution (d), see figure 2.
n Signal-to-Noise ratio: minimum 10 for the principal peak in
the chromatogram obtained with reference solution (b), see
figure 3.
EP system suitability requirement
Parameter EP criteria Measured
Resolution between Impurity A and Tobramycin > 3.0 3.5
Signal-to-Noise ratio (Tobramycin) > 10 17
Table 3
The system suitability requirements are met for both param-
eters (table 3).
Tobramycin According to EP Method
45
ConclusionThe ALEXYS Aminoglycosides Ana-
lyzer provides a suitable solution for
the analysis of the composition &
impurities in Tobramycin following
the official method of the EP.
Assay
Sample EP criteria % Measured*
Sample CUD 621uA2B 97-102 99.1
*) calculated on non-anhydrous sample
Results impurity analysis Tobramycin sample
Impurity RRT Relative Peak Area* EP criteria
Nebramine (impurity B) 0.41 0.84 < 2
Total impurities* - 0.84 < 3
*) The relative peak area of the impurity is calculated in the following way: Relative peak area = Peak area of the impurity divided by the peak area of the Tobramycin peak in the chromatogram obtained with reference solu-tion (c).
Table 4 Table 6
The contents was within the specified limits of the EP mono-
graph.
Impurity analysis
To determine the impurity level in the sample, the responses
of the impurity peaks of a test solution (a) containing a 1 mg/
mL Tobramycin sample in mobile phase were compared to
the response of the principle peak of reference solution (c).
The chromatogram of test solution (a) is shown in figure 1.
Impurity analysis Tobramycin sample CUD 621uA2B
Impurity RRT* Peak Area (nA.s) Discard#
2 0.21 280 Y
3 0.24 58 Y
4 0.27 562 Y
5 0.30 103 Y
Neamine 0.38 663 Y
Nebramine 0.41 4327 N
8 0.53 137 Y
9 0.57 594 Y
Kanamycin sulphate B 0.80 843 Y
*) Relative retention time (RRT) with reference to Tobramycin (18.2 min). #) Discard limit: any peak with an area less than that of the principal peak in the chromatogram obtained with reference solution (b) (0.25 per cent) shown in figure 3.
Table 5
The EP acceptance criteria for the amount of impurities are:
n Any impurity: Not more than twice the area of the Tobra-
mycin peak in the chromatogram obtained with reference
solution (c), and not more than 1 such peak having an area
more than the area of the Tobramycin peak obtained with
reference solution (c).
n Total impurities: Not more than 3x the peak area of the Tobra-
mycin peak in the chromatogram obtained with reference
solution (c).
n Discard limit: Impurities with peak areas smaller than the
peak area of the principle peak (Tobramycin) in the chro-
matogram of reference solution (b) can be discarded.
In table 5 the peak responses (peak area in nA.s) are listed for
all impurities found. Only the impurities with a response larg-
er than the discard limit are taken into account in the calcula-
tion of the relative amount of impurities as specified under
the limits section in the EP monograph. The results are shown
in table 6.
The analyzed sample is in compliance with the acceptance
criteria for both the contents and the impurity limits as set by
the EP for Tobramycin and its impurities.
Tobramycin According to EP Method
464646
Ordering information
180.0056C ALEXYS Aminoglycosides Analyzer, including column, flow cell, and post-column addition kit
250.1075 PLRP-S 1000 Å, 250x4.6mm, 8um
References1. David A. Stead, “Current methodologies for the analysis of
aminoglycosides”, J. Chromatogr. B, 747 (2000) 69–93
2. W.R. LaCourse, “Pulsed Electrochemical Detection in High Per-
formance Liquid Chromatography”, John Wiley & Sons, New
York, 1ed, 1997.
3. J. Szunyog, E. Adams, E. Roets, J.Hoogmartens, 23, J. Pharm.
Biomed. Anal., (2000) 891-896
4. Tobramycin, European Pharmacopoeia (EP), 8.1, (2014) 3434
-3436
5. Tobramycin in pharmaceutical preparations, Antec applica-
tion note, 217_014
Electrochemistry Discover the difference
Tobramycin in PharmaceuticalPreparations
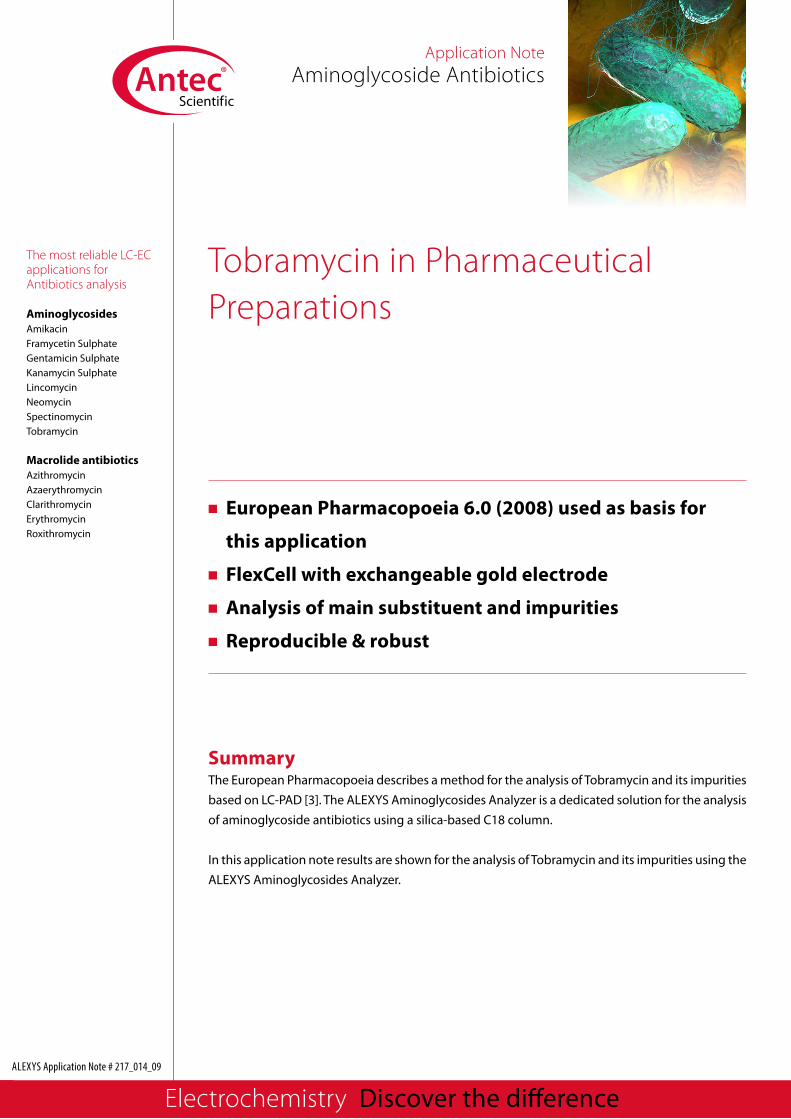
Summary The European Pharmacopoeia describes a method for the analysis of Tobramycin and its impurities
based on LC-PAD [3]. The ALEXYS Aminoglycosides Analyzer is a dedicated solution for the analysis
of aminoglycoside antibiotics using a silica-based C18 column.
In this application note results are shown for the analysis of Tobramycin and its impurities using the
ALEXYS Aminoglycosides Analyzer.
n European Pharmacopoeia 6.0 (2008) used as basis for
this application
n FlexCell with exchangeable gold electrode
n Analysis of main substituent and impurities
n Reproducible & robust
The most reliable LC-ECapplications forAntibiotics analysis
AminoglycosidesAmikacinFramycetin SulphateGentamicin SulphateKanamycin SulphateLincomycinNeomycinSpectinomycinTobramycin
Macrolide antibioticsAzithromycinAzaerythromycinClarithromycinErythromycinRoxithromycin
ALEXYS Application Note # 217_014_09
Application NoteAminoglycoside Antibiotics
Electrochemistry Discover the difference
Tobramycin in Pharmaceutical Preparations
48
IntroductionTobramycin belongs to the group of the aminoglycoside an-
tibiotics. Like the other aminoglycosides, it binds to bacterial
ribosomes and causes non-functional proteins to accumu-
late within the cell leading to cell death. It is often effective
against bacterial strains that prove resistant to other amino-
glycosides like gentamicin. The production is mainly achieved
by fermentation resulting in several minor by-products.
The analysis of the byproduct contribution in bulk tobramycin
and preparations is important as to insight in stability, quality
control and authenticity. A number of qualitative and quanti-
tative methods has been published so far [1] but the focus is
mainly on tobramycin and not on the by-products. Because
of the presence of sugar groups in both tobramycin and by-
products LC with pulsed amperometric detection (PAD) is a
highly selective and sensitive analytical tool [2].
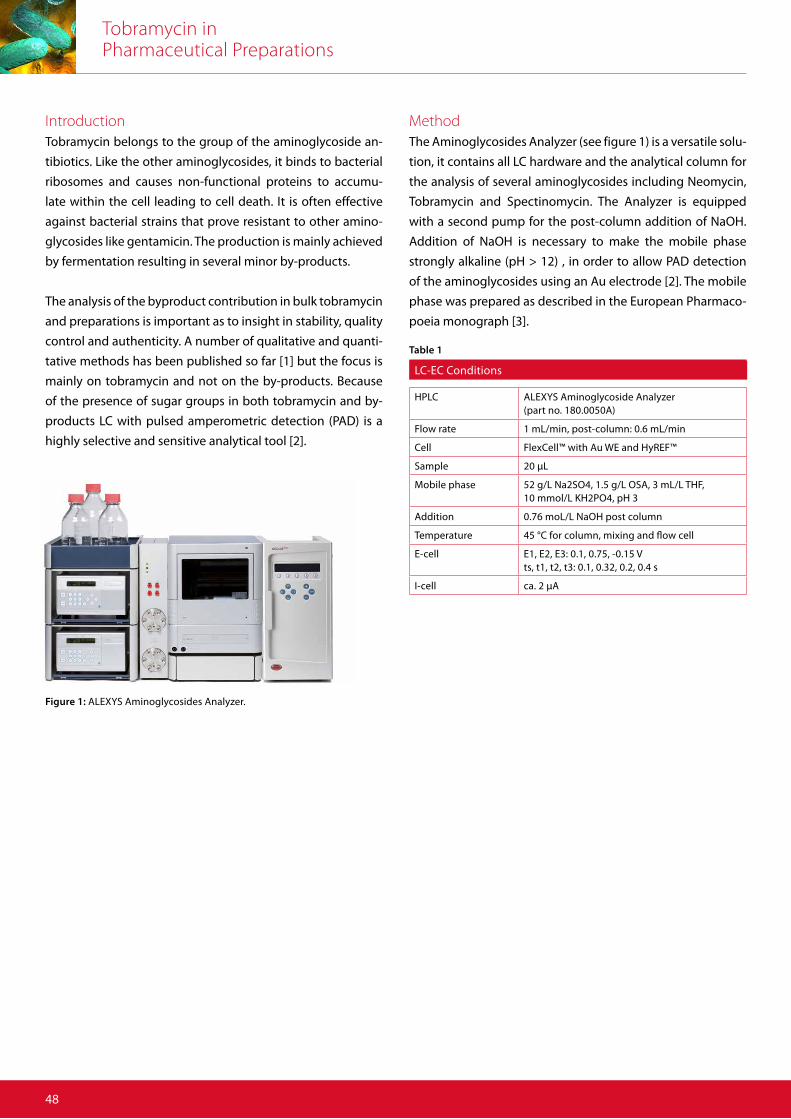
MethodThe Aminoglycosides Analyzer (see figure 1) is a versatile solu-
tion, it contains all LC hardware and the analytical column for
the analysis of several aminoglycosides including Neomycin,
Tobramycin and Spectinomycin. The Analyzer is equipped
with a second pump for the post-column addition of NaOH.
Addition of NaOH is necessary to make the mobile phase
strongly alkaline (pH > 12) , in order to allow PAD detection
of the aminoglycosides using an Au electrode [2]. The mobile
phase was prepared as described in the European Pharmaco-
poeia monograph [3].
Figure 1: ALEXYS Aminoglycosides Analyzer.
LC-EC Conditions
HPLC ALEXYS Aminoglycoside Analyzer (part no. 180.0050A)
Flow rate 1 mL/min, post-column: 0.6 mL/min
Cell FlexCell™ with Au WE and HyREF™
Sample 20 µL
Mobile phase 52 g/L Na2SO4, 1.5 g/L OSA, 3 mL/L THF, 10 mmol/L KH2PO4, pH 3
Addition 0.76 moL/L NaOH post column
Temperature 45 °C for column, mixing and flow cell
E-cell E1, E2, E3: 0.1, 0.75, -0.15 Vts, t1, t2, t3: 0.1, 0.32, 0.2, 0.4 s
I-cell ca. 2 µA
Table 1
Tobramycin in Pharmaceutical Preparations
49
ConclusionThe ALEXYS® Aminoglycosides
Analyzer is a suitable solution for
the analysis of Tobramycin and its
impurities in bulk drugs.
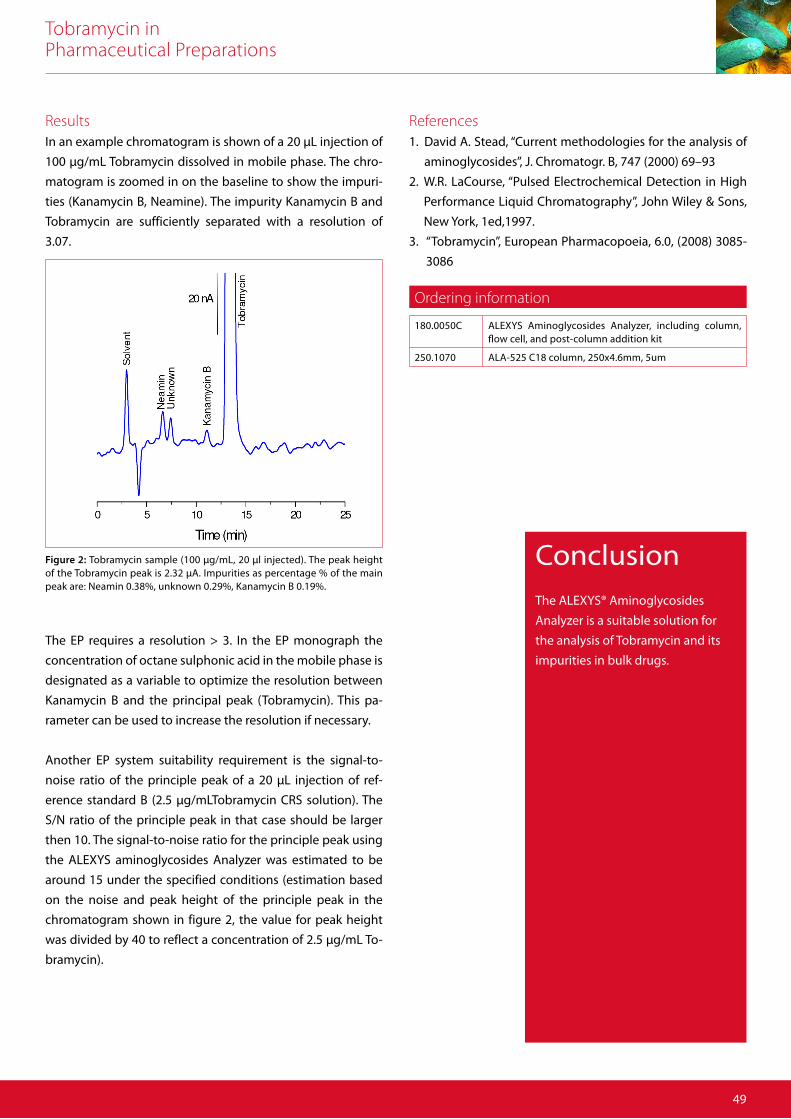
ResultsIn an example chromatogram is shown of a 20 μL injection of
100 μg/mL Tobramycin dissolved in mobile phase. The chro-
matogram is zoomed in on the baseline to show the impuri-
ties (Kanamycin B, Neamine). The impurity Kanamycin B and
Tobramycin are sufficiently separated with a resolution of
3.07.
Figure 2: Tobramycin sample (100 μg/mL, 20 μl injected). The peak height of the Tobramycin peak is 2.32 μA. Impurities as percentage % of the main peak are: Neamin 0.38%, unknown 0.29%, Kanamycin B 0.19%.
The EP requires a resolution > 3. In the EP monograph the
concentration of octane sulphonic acid in the mobile phase is
designated as a variable to optimize the resolution between
Kanamycin B and the principal peak (Tobramycin). This pa-
rameter can be used to increase the resolution if necessary.
Another EP system suitability requirement is the signal-to-
noise ratio of the principle peak of a 20 μL injection of ref-
erence standard B (2.5 μg/mLTobramycin CRS solution). The
S/N ratio of the principle peak in that case should be larger
then 10. The signal-to-noise ratio for the principle peak using
the ALEXYS aminoglycosides Analyzer was estimated to be
around 15 under the specified conditions (estimation based
on the noise and peak height of the principle peak in the
chromatogram shown in figure 2, the value for peak height
was divided by 40 to reflect a concentration of 2.5 μg/mL To-
bramycin).
Ordering information
180.0050C ALEXYS Aminoglycosides Analyzer, including column, flow cell, and post-column addition kit
250.1070 ALA-525 C18 column, 250x4.6mm, 5um
References1. David A. Stead, “Current methodologies for the analysis of
aminoglycosides”, J. Chromatogr. B, 747 (2000) 69–93
2. W.R. LaCourse, “Pulsed Electrochemical Detection in High
Performance Liquid Chromatography”, John Wiley & Sons,
New York, 1ed,1997.
3. “Tobramycin”, European Pharmacopoeia, 6.0, (2008) 3085-
3086

Electrochemistry Discover the difference
If the facts don’t fit the theory, change the facts.
Albert Einstein
50
Electrochemistry Discover the difference
Application NoteAntibiotics
ALEXYS Application Note # 217_017_12
SummaryIn this note the USP monograph USP 30-NF25 issued in May 2007 has been used as a basis for the
development of a method for the analysis of macrolide antibiotics, using the ALEXYS Macrolide An-
tibiotics analyzer with a dual flow cell configuration and a column with USP L49 stationary phase.
With this LC system macrolide antibiotics such as Clarithromycin, Erythromycin, Roxithromycin,
and Azithromycin were analyzed.
The most reliable LC-ECapplications forAntibiotics analysis
AminoglycosidesAmikacinFramycetin SulphateGentamicin SulphateKanamycin SulphateLincomycinNeomycinSpectinomycinTobramycin
Macrolide antibioticsAzithromycinAzaerythromycinClarithromycinErythromycinRoxithromycin
Azithromycin, Erythromycin and other Macrolide Antibiotics
n Method based on USP 30-NF25, May 2007
n Analysis of main substituent and impurities
n Column USP L49 stationary phase
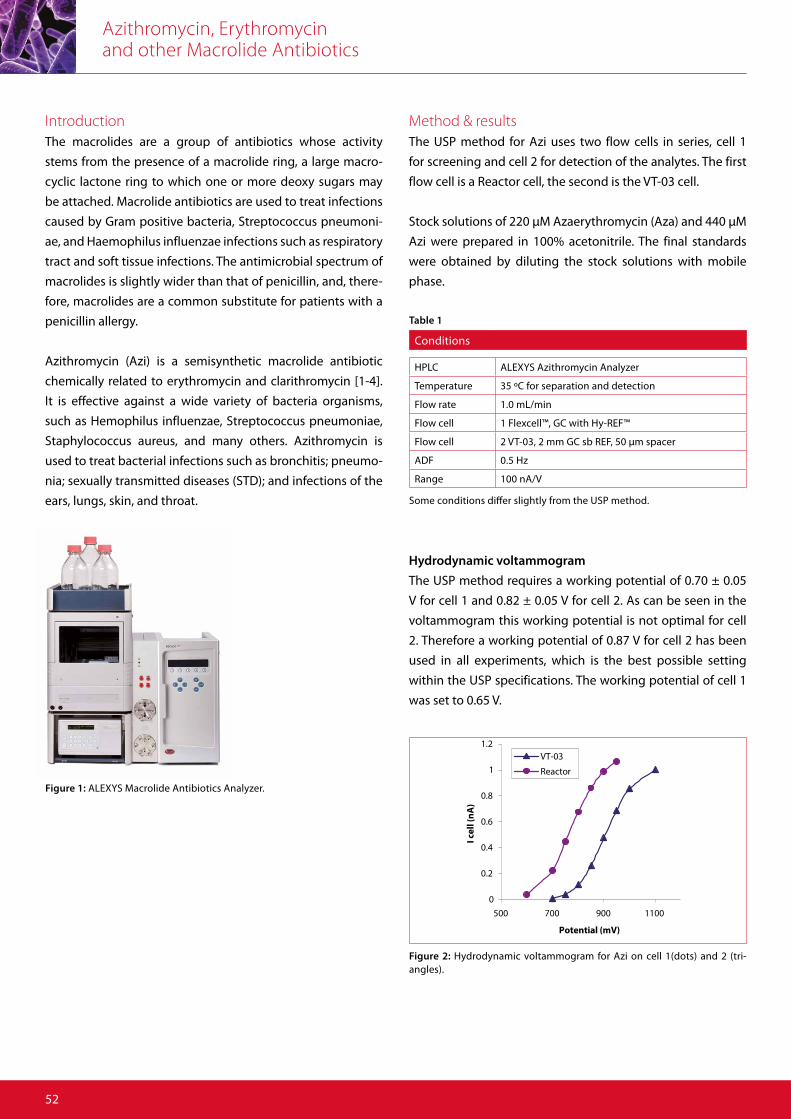
Azithromycin, Erythromycin and other Macrolide Antibiotics
52
Figure 1: ALEXYS Macrolide Antibiotics Analyzer.
Introduction The macrolides are a group of antibiotics whose activity
stems from the presence of a macrolide ring, a large macro-
cyclic lactone ring to which one or more deoxy sugars may
be attached. Macrolide antibiotics are used to treat infections
caused by Gram positive bacteria, Streptococcus pneumoni-
ae, and Haemophilus influenzae infections such as respiratory
tract and soft tissue infections. The antimicrobial spectrum of
macrolides is slightly wider than that of penicillin, and, there-
fore, macrolides are a common substitute for patients with a
penicillin allergy.
Azithromycin (Azi) is a semisynthetic macrolide antibiotic
chemically related to erythromycin and clarithromycin [1-4].
It is effective against a wide variety of bacteria organisms,
such as Hemophilus influenzae, Streptococcus pneumoniae,
Staphylococcus aureus, and many others. Azithromycin is
used to treat bacterial infections such as bronchitis; pneumo-
nia; sexually transmitted diseases (STD); and infections of the
ears, lungs, skin, and throat.
Method & results The USP method for Azi uses two flow cells in series, cell 1
for screening and cell 2 for detection of the analytes. The first
flow cell is a Reactor cell, the second is the VT-03 cell.
Stock solutions of 220 μM Azaerythromycin (Aza) and 440 μM
Azi were prepared in 100% acetonitrile. The final standards
were obtained by diluting the stock solutions with mobile
phase.
0
0.2
0.4
0.6
0.8
1
1.2
500 700 900 1100
Potential (mV)
I cel
l (nA
)
VT-03
Reactor
Figure 2: Hydrodynamic voltammogram for Azi on cell 1(dots) and 2 (tri-angles).
Conditions
HPLC ALEXYS Azithromycin Analyzer
Temperature 35 ºC for separation and detection
Flow rate 1.0 mL/min
Flow cell 1 Flexcell™, GC with Hy-REF™
Flow cell 2 VT-03, 2 mm GC sb REF, 50 μm spacer
ADF 0.5 Hz
Range 100 nA/V
Some conditions differ slightly from the USP method.
Table 1
Hydrodynamic voltammogram
The USP method requires a working potential of 0.70 ± 0.05
V for cell 1 and 0.82 ± 0.05 V for cell 2. As can be seen in the
voltammogram this working potential is not optimal for cell
2. Therefore a working potential of 0.87 V for cell 2 has been
used in all experiments, which is the best possible setting
within the USP specifications. The working potential of cell 1
was set to 0.65 V.
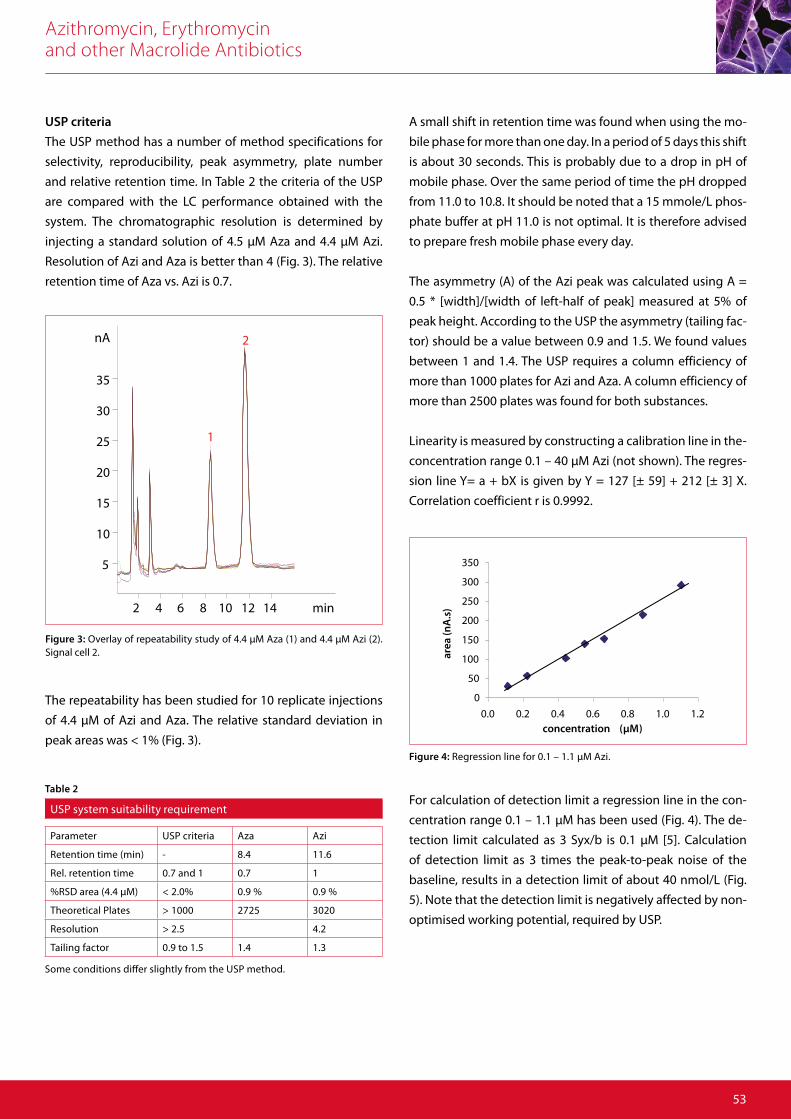
Azithromycin, Erythromycin and other Macrolide Antibiotics
53
0
50
100
150
200
250
300
350
0.0 0.2 0.4 0.6 0.8 1.0 1.2concentration (µM)
area
(nA
.s)
Figure 4: Regression line for 0.1 – 1.1 μM Azi.
2 4 6 8 10 12 14 min
5
10
15
20
25
30
35
nA
1
2
Figure 3: Overlay of repeatability study of 4.4 μM Aza (1) and 4.4 μM Azi (2). Signal cell 2.
A small shift in retention time was found when using the mo-
bile phase for more than one day. In a period of 5 days this shift
is about 30 seconds. This is probably due to a drop in pH of
mobile phase. Over the same period of time the pH dropped
from 11.0 to 10.8. It should be noted that a 15 mmole/L phos-
phate buffer at pH 11.0 is not optimal. It is therefore advised
to prepare fresh mobile phase every day.
The asymmetry (A) of the Azi peak was calculated using A =
0.5 * [width]/[width of left-half of peak] measured at 5% of
peak height. According to the USP the asymmetry (tailing fac-
tor) should be a value between 0.9 and 1.5. We found values
between 1 and 1.4. The USP requires a column efficiency of
more than 1000 plates for Azi and Aza. A column efficiency of
more than 2500 plates was found for both substances.
Linearity is measured by constructing a calibration line in the-
concentration range 0.1 – 40 μM Azi (not shown). The regres-
sion line Y= a + bX is given by Y = 127 [± 59] + 212 [± 3] X.
Correlation coefficient r is 0.9992.
USP system suitability requirement
Parameter USP criteria Aza Azi
Retention time (min) - 8.4 11.6
Rel. retention time 0.7 and 1 0.7 1
%RSD area (4.4 μM) < 2.0% 0.9 % 0.9 %
Theoretical Plates > 1000 2725 3020
Resolution > 2.5 4.2
Tailing factor 0.9 to 1.5 1.4 1.3
Some conditions differ slightly from the USP method.
Table 2
USP criteria
The USP method has a number of method specifications for
selectivity, reproducibility, peak asymmetry, plate number
and relative retention time. In Table 2 the criteria of the USP
are compared with the LC performance obtained with the
system. The chromatographic resolution is determined by
injecting a standard solution of 4.5 μM Aza and 4.4 μM Azi.
Resolution of Azi and Aza is better than 4 (Fig. 3). The relative
retention time of Aza vs. Azi is 0.7.
The repeatability has been studied for 10 replicate injections
of 4.4 μM of Azi and Aza. The relative standard deviation in
peak areas was < 1% (Fig. 3).
For calculation of detection limit a regression line in the con-
centration range 0.1 – 1.1 μM has been used (Fig. 4). The de-
tection limit calculated as 3 Syx/b is 0.1 μM [5]. Calculation
of detection limit as 3 times the peak-to-peak noise of the
baseline, results in a detection limit of about 40 nmol/L (Fig.
5). Note that the detection limit is negatively affected by non-
optimised working potential, required by USP.
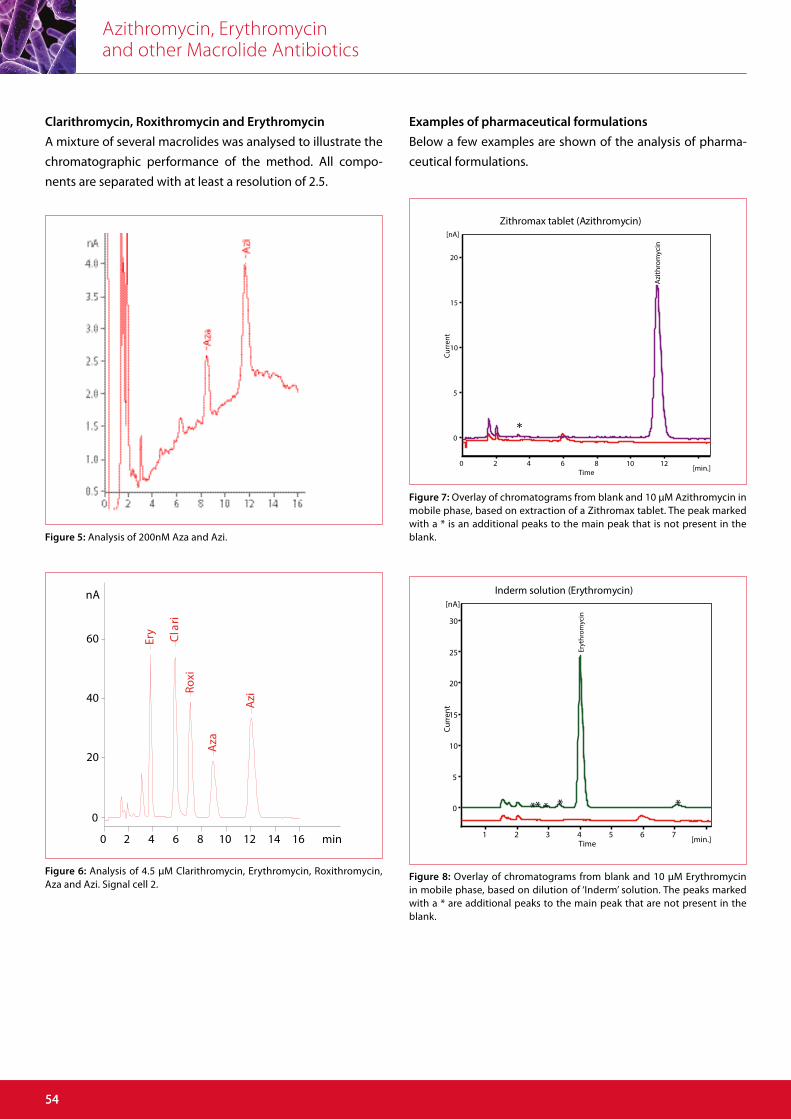
Azithromycin, Erythromycin and other Macrolide Antibiotics
5454
Clarithromycin, Roxithromycin and Erythromycin
A mixture of several macrolides was analysed to illustrate the
chromatographic performance of the method. All compo-
nents are separated with at least a resolution of 2.5.
Examples of pharmaceutical formulations
Below a few examples are shown of the analysis of pharma-
ceutical formulations.
54
Zithromax tablet (Azithromycin)
[min.] Time 0 2 4 6 8 10 12
[nA]
Curr
ent
0
5
10
15
20
Azi
thro
myc
in
*
Inderm solution (Erythromycin)
[min.] Time 1 2 3 4 5 6 7
[nA]
Curr
ent
0
5
10
15
20
25
30
Eryt
hrom
ycin
* * * * *
0 2 4 6 8 10 12 14 16 min
0
20
40
60
nA
Ery Clar
i Ro
xi
Aza
Azi
Figure 5: Analysis of 200nM Aza and Azi.
Figure 7: Overlay of chromatograms from blank and 10 μM Azithromycin in mobile phase, based on extraction of a Zithromax tablet. The peak marked with a * is an additional peaks to the main peak that is not present in the blank.
Figure 8: Overlay of chromatograms from blank and 10 μM Erythromycin in mobile phase, based on dilution of ‘Inderm’ solution. The peaks marked with a * are additional peaks to the main peak that are not present in the blank.
Figure 6: Analysis of 4.5 μM Clarithromycin, Erythromycin, Roxithromycin, Aza and Azi. Signal cell 2.
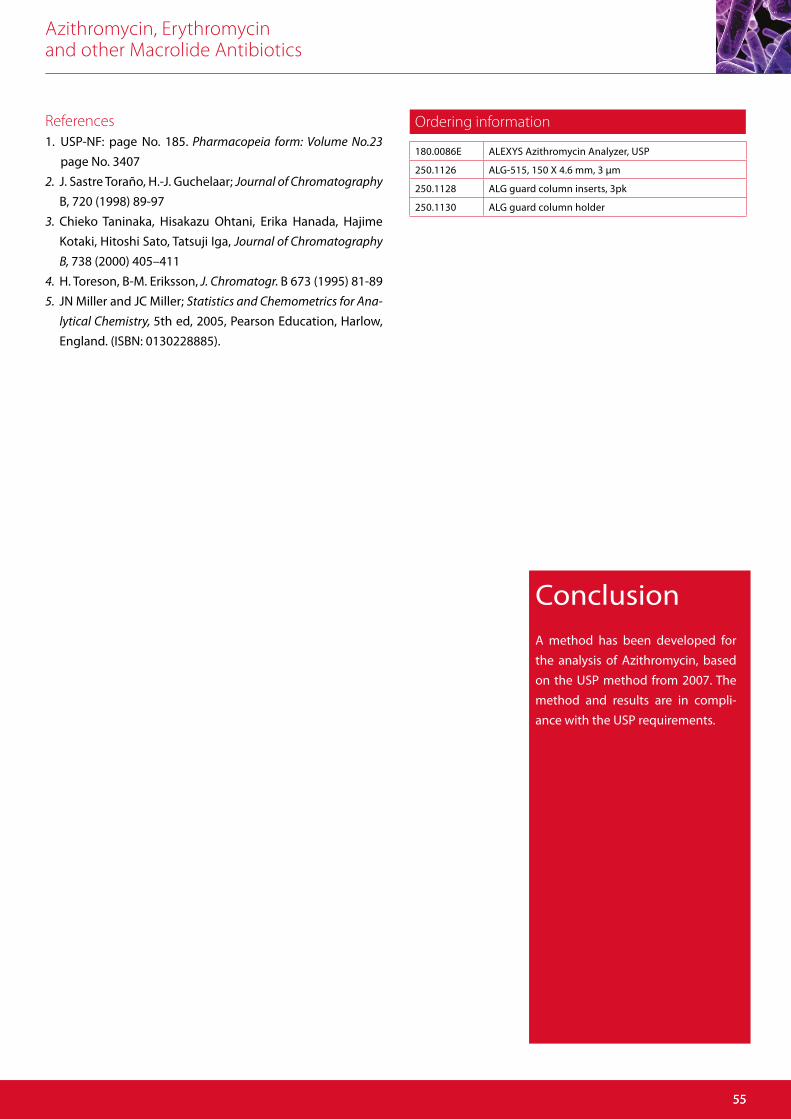
Azithromycin, Erythromycin and other Macrolide Antibiotics
5555
ConclusionA method has been developed for
the analysis of Azithromycin, based
on the USP method from 2007. The
method and results are in compli-
ance with the USP requirements.
References1. USP-NF: page No. 185. Pharmacopeia form: Volume No.23
page No. 3407
2. J. Sastre Toraño, H.-J. Guchelaar; Journal of Chromatography
B, 720 (1998) 89-97
3. Chieko Taninaka, Hisakazu Ohtani, Erika Hanada, Hajime
Kotaki, Hitoshi Sato, Tatsuji Iga, Journal of Chromatography
B, 738 (2000) 405–411
4. H. Toreson, B-M. Eriksson, J. Chromatogr. B 673 (1995) 81-89
5. JN Miller and JC Miller; Statistics and Chemometrics for Ana-
lytical Chemistry, 5th ed, 2005, Pearson Education, Harlow,
England. (ISBN: 0130228885).
55
Ordering information
180.0086E ALEXYS Azithromycin Analyzer, USP
250.1126 ALG-515, 150 X 4.6 mm, 3 μm
250.1128 ALG guard column inserts, 3pk
250.1130 ALG guard column holder
Antec Scientific (USA) [email protected] www.AntecScientific.com T 888 572 0012
Antec Scientific (worldwide) [email protected] T +31 71 5813333