Embed Size (px)
Citation preview

Applications of 2D-LC in Pharmaceutical Analysis
C. J. Venkatramani, Genentech, USA
June 22nd, 2016 - HPLC 2016 - Agilent Lunch Seminar
©2016Genentech,Inc. 1

Agenda Slide 2
• Business driver – why 2D-LC? • Flavors of Two-Dimensional Chromatography • Two-Dimensional Liquid Chromatography • Application of 2D-LC in pharmaceutical analysis • Acknowledgements
©2016Genentech,Inc.
Pharmaceutical Industry
Highly regulated industry Deliver safe and efficacious medications patients DS Specifications: Appearance, Identity, Assay and
Related Substances, Residual Solvents, Water Content, Heavy Metals and Specified Metals ….
©2016Genentech,Inc.
Slide 3

©2016Genentech,Inc.
Slide 4
ICH Q3A:
Reporting threshold > 0.05%
Identification threshold ≥ 0.10% or max 1.0 mg/day
Qualification threshold ≥ 0.15% or max 1.0 mg/day)
Exceptions: Impurities with tox coverage, metabolites Genotoxic impurities (M7):
Limited by max daily dose & duration of exposure Usually low parts per million
Impurities in New Drug Substances
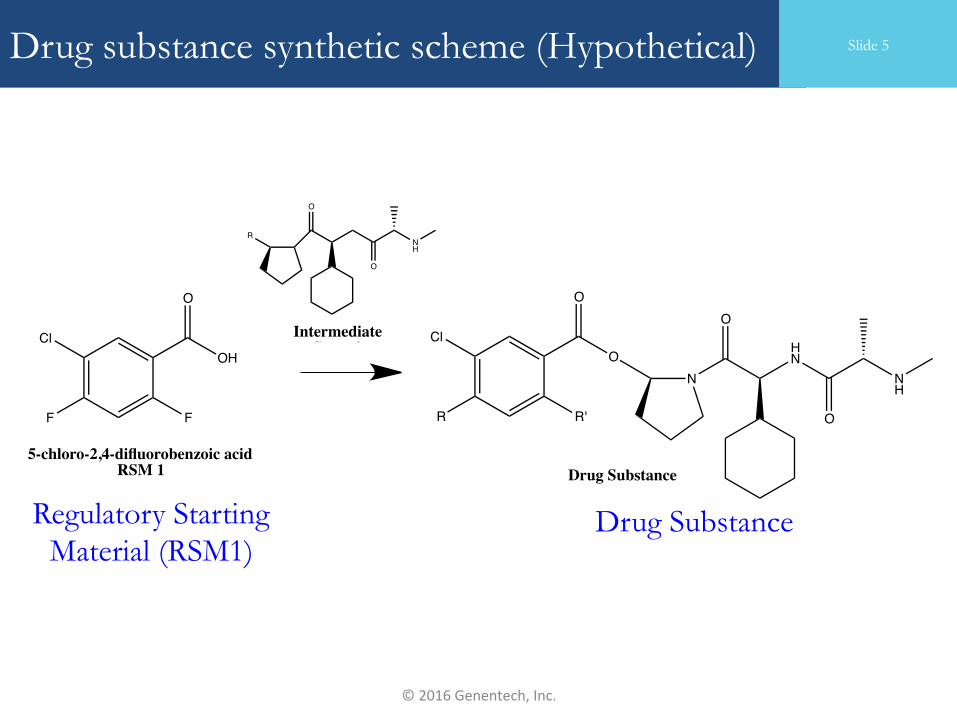
Drug substance synthetic scheme (Hypothetical)
©2016Genentech,Inc.
Slide 5
Regulatory Starting Material (RSM1)
Drug Substance
O
OH
F F
ClO
N
HN
NH
O
NH
R
O
O
O
O
R R'
Cl
5-chloro-2,4-difluorobenzoic acidRSM 1
IntermediateStage 2
Drug Substance

O
OH
F F
Cl
O
OHF
F
Cl
O
OH
F
F
Cl O
OHF
F Cl
O
OH
FF
ClO
OH
F
F
Cl
O
OH
F
F
Cl
O
OHF
F
Cl
O
OH
F
F
Cl
O
OHF
F
Cl
O
OH
FF
Cl
O
OHF
F
Cl
O
OHF
FCl
O
OH
F
F
Cl
O
OHF
F
Cl
O
OH
F
F
Cl
O
OH
F
F
Cl
O
OH
F F
Cl
O
OH
F
F
Cl
O
OH
F
F
Cl
O
OH
F
F
Cl
O
OH
FF
Cl O
OHF
F
Cl
O
OH
F
F
ClO
O
OHF
F
Cl
O
OH
F
F
Cl
O
OH
F
F
Cl
O
OH
F
F Cl
Areaofinterest
API
Organic impurities from reg. starting material
©2016Genentech,Inc.
Slide 6
Isomers are likely to react and produce associated API impurities which will be difficult to purge, analyze

Slide7 ©2016Genentech,Inc.
Organic impurities in SM pharmaceuticals Strategy for impurity characterization Screen columns of different selectivity, pH’s, peak tracking Demonstrate specificity - SM’s, intermediates, potential imps
Demonstrate method is stability indicating with stressed samples - acid, base, peroxide, heat, humidity, light
Relies on DAD and MS for detection - limiting factor Peaks eluting around main component have similar
UV spectra - Limits DAD Isomers - Limits MS
Potential Solution: Two-dimensional Chromatography
Slide 7
Flavors of 2D-LC
©2016Genentech,Inc. 8

Slide9
Flavors of 2D Chromatography
Heart-Cutting 2D-LC Part of primary column eluent sampled into secondary column Easy to operate, adequate for most applications – camera
Comprehensive 2D-LC
Entire primary column eluent sampled into secondary column Challenging, detailed analysis- camcorder
Pseudo-comprehensive 2D-LC
Comprehensive separation of select region of primary column eluent (Targeted analysis) Moderate level of difficulty, adequate for most applications – smart phone
©2016Genentech,Inc.
Slide 9

\D\DHeart-cutting 2D-LC
Sec.col.Separa3on(Chirobio3cT)
NH2
O OH
d-phenylalanine
NH2
O OH
l-phenylalanine
1
2 3 4 5 6
0
20
40
60
80
100
120
Retention Time (min)
Det
. Res
pons
e (m
AU
)
Primarycol.Separa3on(ODS-AQ)
©2016Genentech,Inc.
C. J. Venkatramani, Larry Wigman, Kavita Mistry and Nichols Chetwyn, Simultaneous, sequential quantitative aciral-chiral analysis by two-dimensional liquid chromatography, Journal of Separation Science, Vol. 35, p1748, 2012
Slide 10

Slide 11
Primary
Chromatogram
Comprehensive 2D-LC
PrimaryColum
nReten3on(minutes)
5.00 5.50
6.00 6.50
7.00 7.50
8.00
DetectorResponse(mAU)
-200 0 200 400 600 800
1000 Secondary
Chromatograms 2D Contour Plots
Sec. Ret. (sec)
Prim
ary Ret. (m
in)
©2016Genentech,Inc.
Slide 11

Primary
Chromatogram
PrimaryColum
nReten3on(minutes)
5.00 5.50
6.00 6.50
7.00 7.50
8.00
DetectorResponse(mAU)
-200 0 200 400 600 800
1000 Secondary
Chromatograms 2D Contour Plots
Sec. Ret. (sec)
Prim
ary Ret. (m
in)
©2016Genentech,Inc.
Slide 12 Pseudo-comprehensive 2D-LC (Targeted analysis)
Agilent – Multiple heart-cutting

Case study: 2D-LC-MS method development strategy for complex, high molecular weight compound
©2016Genentech,Inc. 13

Analytical challenges Slide 14
©2016Genentech,Inc.
Extremely complex synthesis involving multiple steps
Lot to lot variability requiring iterative method development
Some of the intermediates are extremely reactive and toxic Molecular weights is usually very high Qualitative and quantitative analysis of potential impurities is critical as it could have significant bearing on the downstream process and long term stability

Chromatographic conditions Slide 15
©2016Genentech,Inc. IlaPatel,Genentech
Parameter Value
Column Ace, Excel 2 PFP C18, 150 mm x 3.0 mm, 2.0um
Wavelength 205 nm
Oven Temperature 40 °C
Flow Rate 0.5 mL/min.
Injection Volume 5 µL
Mobile Phase A 0.05% phosphoric acid in water
Mobile Phase B 0.05% phosphoric acid in ACN
Gradient program
Time (min) A% B% 0.0 95 5 8.0 60 40 23.0 47 53 28.0 5 95 30.0 5 95 30.1 95 5 37.0 95 5
Run Time 37 min
Diluent 50/50 (v/v) Acetonitrile / Water

Chromatographic profile of sample Slide 16
©2016Genentech,Inc. IlaPatel,Genentech

Strategy for 2D-LC analysis Slide 17
©2016Genentech,Inc.
Modify primary column gradient to elute component of interest within 5 to 15 minutes Evaluate complementary phases in the secondary dimension
SB-CN, Primesep-B, diamond hydride phase, SB-Phenyl, SB-Aq…
Re-assess original method using most complementary phase in the secondary dimension

Modified expt. conditions – primary column Slide 18
©2016Genentech,Inc.

Pictorial representation of expt. set-up Slide 19
©2016Genentech,Inc.
Traceinred:PrimarycolumngradientTraceinblue:Secondarycolumngradient
Frac3onstransferredtosec.column
1stgradient Lastgradient

Experimental conditions – secondary column Slide 20
©2016Genentech,Inc.

*Frac3ons1to5areparkedinDeckA,analyzedinreverseorder(5,4,3….)*Frac3ons6to10parkedinDeckB*Frac3ons6through10inDeckBisanalyzedinrevereseorder(10,9,8...)followingDeckAanalysis*Trappingandanalysiscanrepeatedthroughoutthechromatogram
High resolution sampling 2D-LC (Heart-cutting) Slide 21
©2016Genentech,Inc.
Park
Analysis
Park
Analysis

Frac3o
n#6
Frac3o
n#7
Frac3o
n#8
Frac3o
n#9
Frac3o
n#10
High-resolution sampling 2D-LC Slide 22
©2016Genentech,Inc.
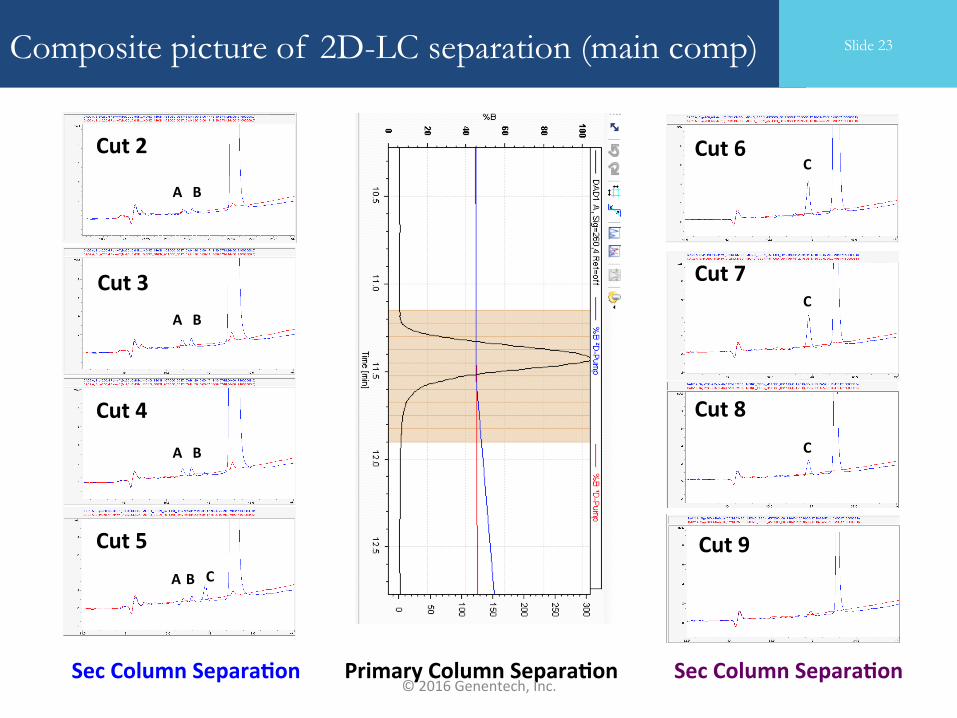
PrimaryColumnSepara3on SecColumnSepara3onSecColumnSepara3on
Cut2
Cut3
Cut4
Cut5
Cut6
Cut7
Cut8
Cut9
A B
A B
A B
AB C
C
C
C
Composite picture of 2D-LC separation (main comp) Slide 23
©2016Genentech,Inc.

Stackplotofseccolumnsepara3onshowingpoten3alco-elu3onintheprimarydimension
ImpA
ImpB
ImpC
Finalintermediate
??
Lot#1
Stack plot of 2nd dimension separation Slide 24
©2016Genentech,Inc.
Maincomponent

MStraceofsamplelot
UVtraceofsamplelotat260nm
*Co-elu3ngimpuri3esfromtheprimarycolumnareresolvedinthesecondary,complementarySB-CNcolumn*Impuri3eswerenotdetectedbyMS
2D-LC detection: UV v/s MS Slide 25
©2016Genentech,Inc.

Cut#5MS
UV
Cut#6MS
UV
*Co-elu3ngimpuri3esfromtheprimarycolumnareresolvedinthesecondary,complementarySB-CNcolumn*Impuri3eswerenotdetectedbyMS
2D-LC detection: UV v/s MS Slide 26
©2016Genentech,Inc.

A B
Impuri3esAandBobservedinfrac3ons2to5acrossthemainpeak
Zones of co-elution in the 1st dimension Slide 27
©2016Genentech,Inc.

C
ImpurityCobservedinfrac3ons5to9acrossthemainpeak
Zones of co-elution in the 1st dimension Slide 28
©2016Genentech,Inc.

Primarycolumnsepara3on
8.31min8.85min
Seccolumnsepara3on(UV)
Assessment of 1st dimension for potential co-elusion Slide 29
©2016Genentech,Inc.

10.95min11.03min11.11min
Seccolumnsepara3on(UV)
Primarycolumnsepara3on
Selective assessment of 1st dimension (co-elusion) Slide 30
©2016Genentech,Inc.

11.45minMainComp
Seccolumnsepara3on(UV)
Primarycolumnsepara3on
Selective assessment of 1st dimension (co-elusion) Slide 31
©2016Genentech,Inc.

Seccolumnsepara3on13.49min13.69min13.89min
Selective assessment of 1st dimension (co-elusion) Slide 32
©2016Genentech,Inc.
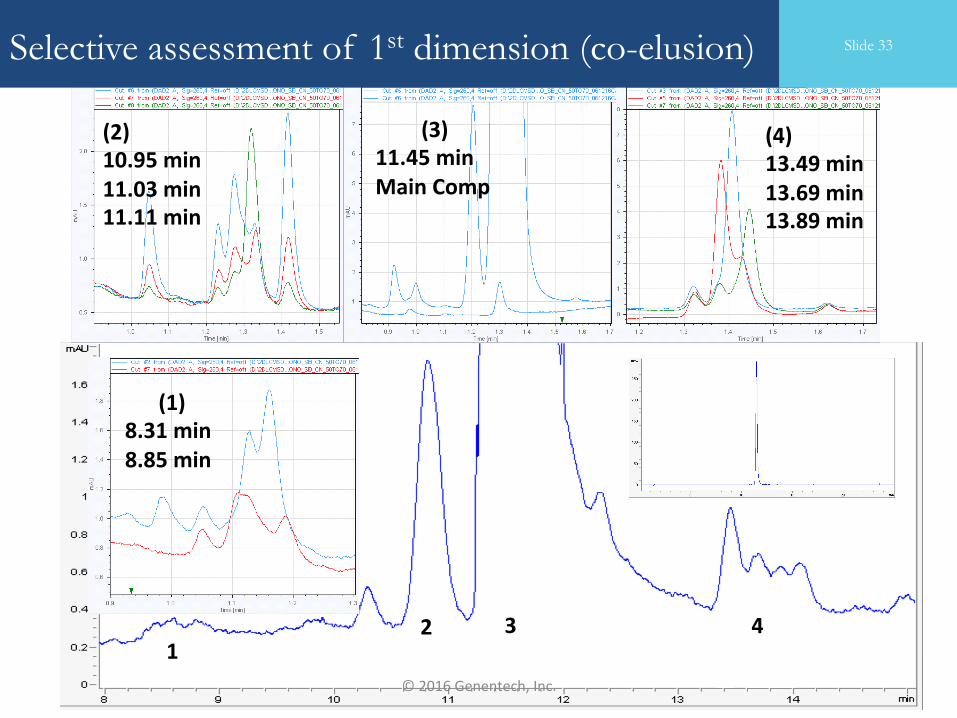
(4)13.49min13.69min13.89min
(1)8.31min8.85min
(2)10.95min11.03min11.11min
(3)11.45minMainComp
12 3 4
Selective assessment of 1st dimension (co-elusion) Slide 33
©2016Genentech,Inc.

Basedon2D-LC-MSanalysisofsample,mul3plecomponentsco-eluteintheprimarydimension,severalofthese
componentsarepar3allyresolvedinthesecondarySB-CNcolumn
Selective assessment of 1st dimension (co-elusion) Slide 34
©2016Genentech,Inc.

Lot#2
ImpA ImpA
Finalintermediate
Stackplotofsecondarycolumnsepara3onshowingpoten3alco-elu3oninprimarydimension
Sec. column separation of lot 2 (main component) Slide 35
©2016Genentech,Inc.
Isocratic separation in secondary SB-CN column
©2016Genentech,Inc. 36
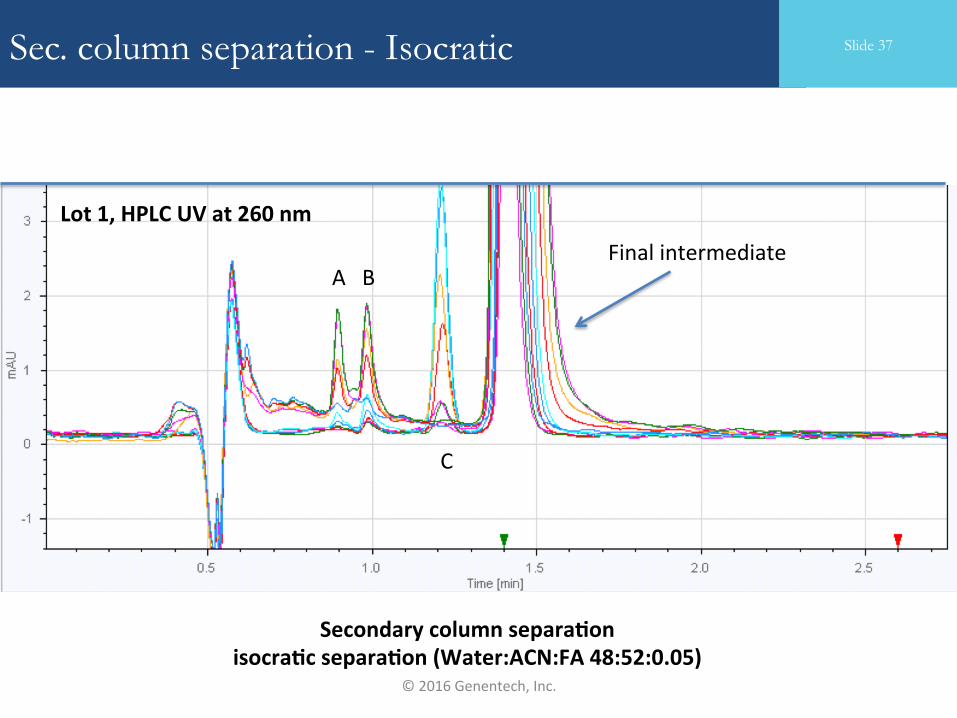
AB
C
Lot1,HPLCUVat260nm
Secondarycolumnsepara3onisocra3csepara3on(Water:ACN:FA48:52:0.05)
Sec. column separation - Isocratic Slide 37
Finalintermediate
©2016Genentech,Inc.

Secondarycolumnsepara3onisocra3csepara3on(Water:ACN:FA48:52:0.05)
AB
Lot2,HPLCUVat260nm
Sec. column separation - Isocratic Slide 38
©2016Genentech,Inc.
Quantitation by 2D-LC
©2016Genentech,Inc. 39

Secondarycolumnsepara3on(min)
Secondarycolumnpeakintegra3on
Peak ID & quantification in 2nd dimension Slide 40
©2016Genentech,Inc.

Realcomponentwillshowsupinmul3ple,sequen3alchromatogramsconfirmingitspresenceinsample
Quantitation: multiple heart cutting 2D-LC Slide 41
©2016Genentech,Inc.

*Rela3vePA’softheimpuri3esarecomparablebetweenrunslow%RSD(<10%)forpeaksintheLOQrange
*Lot#1hasanaddi3onalimpuritycomparedtolot1*%PAisthelevelofimpuri3esco-elu3nginthemaincomponent
Lot1
Lot2
RetentionTime Run#1 Run#2 Run#3 Average StdDev %RSD %PeakArea(min)0.9 7.3 7.9 7.5 7.6 0.30 3.98 0.060.99 12.4 14.0 13.9 13.4 0.92 6.83 0.111.21 32.045 30.935 30.998 31.3 0.62 1.99 0.261.42 11922.2 11875.9 11907.3 11901.8 23.65 0.20 99.56
Quantitative analysis of co-eluting imps (main comp) Slide 42
©2016Genentech,Inc.

Blank@300nm
Sample@300nm
Blank@260n
m
Sample@260nm
Comparison of blank and sample at 260 and 300 nm Slide 43
©2016Genentech,Inc.
C

Secondarycolumnsepara3onisocra3csepara3on(Water:ACN:FA48:52:0.05)
AB
Lot2,HPLCUVat260nm
Effec3vereten3onspace
Sec. column separation - Isocratic Slide 44
©2016Genentech,Inc.

Hi-speed separation in secondary column
©2016Genentech,Inc. 45

SecondaryColumnSepara3on(2.1mmx3cmx1.8uMRRHDCN)
Cut2
Cut3
Cut4
Cut5
Cut6
Cut7
Cut8
Cut9
Cut10
A/B
A/B
A/B
C
C
C
C
C
Sec. column separation on RRHD SB-CN column Slide 46
©2016Genentech,Inc.

Assessment of potential co-elution in original method
©2016Genentech,Inc. 47

Lot1,260nmOriginalmethodPhosphoricacidsystem
Lot1,260nmCut3
A B
FinalInt Lot1,260nmCut6
C?
FinalInt
Sec. column separation – SB-CN Slide 48
©2016Genentech,Inc.

Lot1,260nmOriginalmethodPhosphoricacidsystem
Lot1,260nm
Lot1,300nm
Deg1
Sec. column separation – SB-CN Slide 49
©2016Genentech,Inc.Residuallevelofnewdegrada3onproductobservedinagedsample
ImpCresolvedfrommaincomponentinthereleasemethod

Analysis of sample using Primesep-B column in secondary dimension
©2016Genentech,Inc. 50

Secondarycolumnsepara3onona2cmPrimesep-Bguardcolumn
Secondarycolumnsepara3on
Primarycolumnsepara3on LC-UV@260nm
C
HPLC-UV
Sec. column separation – PS-B Slide 51
©2016Genentech,Inc.

Analysis of sample using diamond hydride column in secondary dimension
©2016Genentech,Inc. 52
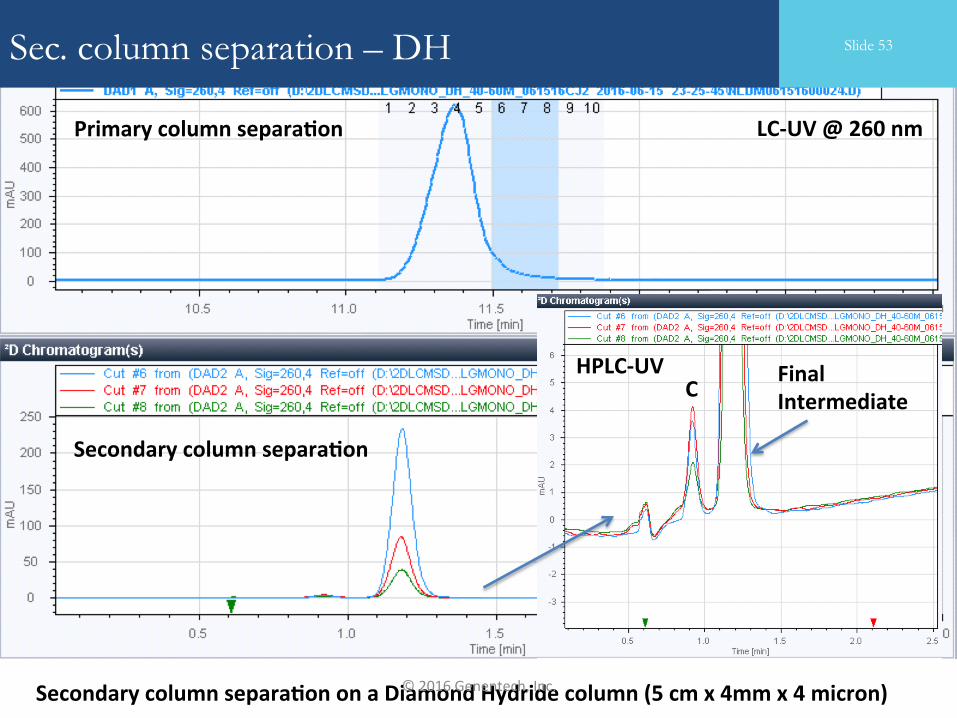
Secondarycolumnsepara3on
Primarycolumnsepara3on LC-UV@260nm
Secondarycolumnsepara3ononaDiamondHydridecolumn(5cmx4mmx4micron)
FinalIntermediate
HPLC-UVC
Sec. column separation – DH Slide 53
©2016Genentech,Inc.

Analysis of sample using SB-Aq column in secondary dimension
©2016Genentech,Inc. 54

Seccolumnsepara3ononaSB-AQcolumn,2.1mmx30mm,1.8uM
CLot1
Sec. column separation – SB-Aq Slide 55
©2016Genentech,Inc.

Slide56
Conclusions
Successfully demonstrated the applications of 2D-LC in resolving residual, co-eluting impurities in the midst of main component. Successfully demonstrated the capability of hi-resolution 2D-LC in quantitative analysis of co-eluting impurities
SB-CN offered most complementary separation in the secondary dimension. Commercial systems have extended the capabilities of 2D-LC from being a research tool in select laboratories to real world applications
Multiple heart cutting, flexibility …...
©2016Genentech,Inc.
Slide 56

Acknowledgments
AgilentTechnologies• LisaZang• MichaelYap• JenniferThompson• RussellBencomo• MichaelFrank• BrinkerGildersleeve
Genentech• JacobKay• IlaPatel• MohammadAl-Sayah• LarryWigman• PeterYehl
©2016Genentech,Inc.
Slide 57