Embed Size (px)
Citation preview

Applications of Culture in Mathematics
North Carolina Council of Teachers of Mathematics Greensboro, NC
October 30, 2008
Complete lesson plans and materials:
World Traveling: 2012 Olympics in London Elizabeth Allen
Bullfighting, Conversions, and Distance-Rate-Time Equations Christina Cook
Graffiti and Mathematics Lindsey Bakewell
History of the Negro Leagues and Baseball Katie Bradley
Egyptian Math Jen Cipriano
Malawian Houses Sarah Lovejoy
Soccer, Currency, and a Global Market Matthew Smith
Questions or comments:
Dr. Leah McCoyDepartment of EducationWake Forest University
Applications of Culture in Mathematics NCCTM 2008
Elizabeth Allen Wake Forest University
World Traveling: 2012 Olympics in London NCTM Standards: Algebra, Data Analysis, Connections, and Representation
Goals:
•• Students will use Algebra to study how time changes across world time zones and using mathematical equations to converting distances and currency.
•• Students will use the Internet to explore different countries that will participate in the 2012 Olympics games held in London including: how far the countries are from London, how long it would take to travel, the time differences, how the travel distance, and the amount of money it would cost to travel.
•• Students will present their finding on a specific country in the form of an artistic brochure.
Introduction:
Athletes from over 205 countries will participate in the 2012 Olympics in London. Some of these countries include: China, Russia, Germany, Australia, Korea, France, Ukraine, Netherlands, Jamaica, Spain, Kenya, Belarus, Cuba, Kazakhstan, Japan, and Italy Where are these countries located, how will there teams get to the Olympics, and what makes these countries stand out? The follow activities will help us explore these questions.
Activities:
Activity 1. True/ False Game: The teacher will read out loud questions for groups of students to answer on the History of the Olympics.
Activity 2. Time Zone Map: During this class activity the teacher would have students come up to the world map and tag countries that participate in the Olympic Games. Then explain definitions of time zones involving these counties and Coordinated Universal Time. Students would answer questions on time zones in order for the teacher to check for understanding.
Assessment/ Project:
Through this discovery learning activity, I hope students will be inspired to learn about the countries that participate in the Olympic Games and become more aware of these different cultures. The students, in groups, would research an assigned country. They would complete given questions on time, distance, and currency conversions. Then after these questions are completed, they would create a brochure on their country including conversions and the cultural aspects of their Country in respect to the Olympics. All brochures would be presented to the class.

Applications of Culture in Mathematics NCCTM 2008
Grading:
1. “Ticket out the door,” will act as an individual form of assessment. Ask students to use the information on times zones to write down what time it is in Paris, if it is 12:00 pm in London
2. The brochure must include information regarding the time the flight leaves for London, both local and London times, how much the flight costs, and the exchange rate between the country and London. The grade will be based on the accuracy of the information, the calculations (they must show any pertinent work), the appearance of the brochure, amount of details the students included, and the presentation of the country to the rest of the class.
Resources:
“Fact Files.” 2012 London Olympic and Paralympic Games. 27 Oct. 2008. 00000<http://getset.london2012.com/home>
"World Time Zones and Time Zone Map." Infoplease. © 2000–2007 Pearson Education, 00000publishing as Infoplease. 27 Oct. 2008 00000<http://www.infoplease.com/ipa/A0855474.html>.

Applications of Culture in Mathematics NCCTM 2008
Teacher References
Activity OneHere are some example questions that could be used for the true/ false Olympic game to introduce the lesson. The information below each question could be read when going over the right answer.
True or False: The first recorded Olympic Game took place in Greece.
This is True. 766 BC and it was one race in the nude!!
True or False: An organized committee was needed in order for the Olympics to occur.
This is True. 1894 the International Olympic Committee is founded.
True or False: The first modern Olympic Games took place in 1788.
This is False. 1896 and it included tourists who just happened to be in Athens.
True or False: For the first time in 1928, women were allowed to compete in Track and Field events at the Olympics in Amsterdam.
This is True. But so many women collapsed at the end of the 800- meter race that the event was banned until 1960.
True or False: In the early decades of the 1900s, the Olympics were not popular to watch.
This is True. Ticket sales struggled at the Los Angeles games in 1932 and TV stars tried to help bring in crowds.
True or False: In 1956, the Amsterdam Summer Olympics were held in May.
This is False. The summer games were actually held in November, for this is when it is summer in the Southern Hemisphere.
True or False: The Olympics were never aired on television until 1990.
This is False. 1960 was the first time the Games were seen on TV.
True or False: The first Gymnast to receive seven perfect 10s was a young woman from China.
This is False. She was a 14-yrs. old Romanian girl. No one ever score a 10 before her. (1976).
True or False: Sailing is not a sport in the Olympics.
This is False. Sailing was first introduced to the Atlanta Paralympics in 1996 and now is a full metal sport.
True or False: The Sydney Olympic Stadium is the largest ever built for an Olympic Games.
This is True. Four jumbo jets could fit side by side under the main roof arch.

Applications of Culture in Mathematics NCCTM 2008
Activity Two
Notes for Explaining Time Zones. These would be good to display on a transparency for the students to copy down into their notebooks.
•• A time zone is a region of the earth that has uniform standard time, usually referred to as the local time.
•• Time zones around the world can be expressed as positive or negative offsets of Coordinated Universal Time (UTC).
•• Coordinated Universal Time is a time standard based on International Atomic Time, which tracks time on Earth by calculated the surface of the Earth as a mathematical figure.
•• The Royal Conservatory in Greenwich, UK is where the time is calculated. Therefore Greenwich, UK is referred to as UTC time. The definition for time zones can be written in short form as UTC±n, where n is the offset in hours.
Give examples of time zones for the students. Have these on a transparency for the students to reference when completing questions to check for understanding.
Paris, France: UTC + 1 Athens, Greece: UTC + 2 New Delhi, India: UTC + 5:30 China: UTC + 8 Tokyo, Japan: UTC + 9 Sydney, Australia: UTC +10 New York City, United States: UTC – 5 London, UK: UTC
Some questions to ask the students (I would have them just raise their hands). Have these written down for the students to read, while you read them aloud:
If it is 1:00 pm in Greenwich, what time is it in Paris, France? 2:00 pmAthens, Greece? 3:00 pmChina? 9:00 pm
If it is 2:00 pm in Tokyo, Japan, what time is it in Greenwich? 5:00 am London, UK? 5:00 amNew York City, United States? 12:00 am.
How many hours ahead is Tokyo, Japan from New York City, United States? Another way to phrase the questions is: If Greenwich is five hours ahead of NYC, and Tokyo is nine hours ahead of Greenwich, how many hours ahead is Tokyo from NYC.
9 + 5 = 14 hours
Applications of Culture in Mathematics NCCTM 2008
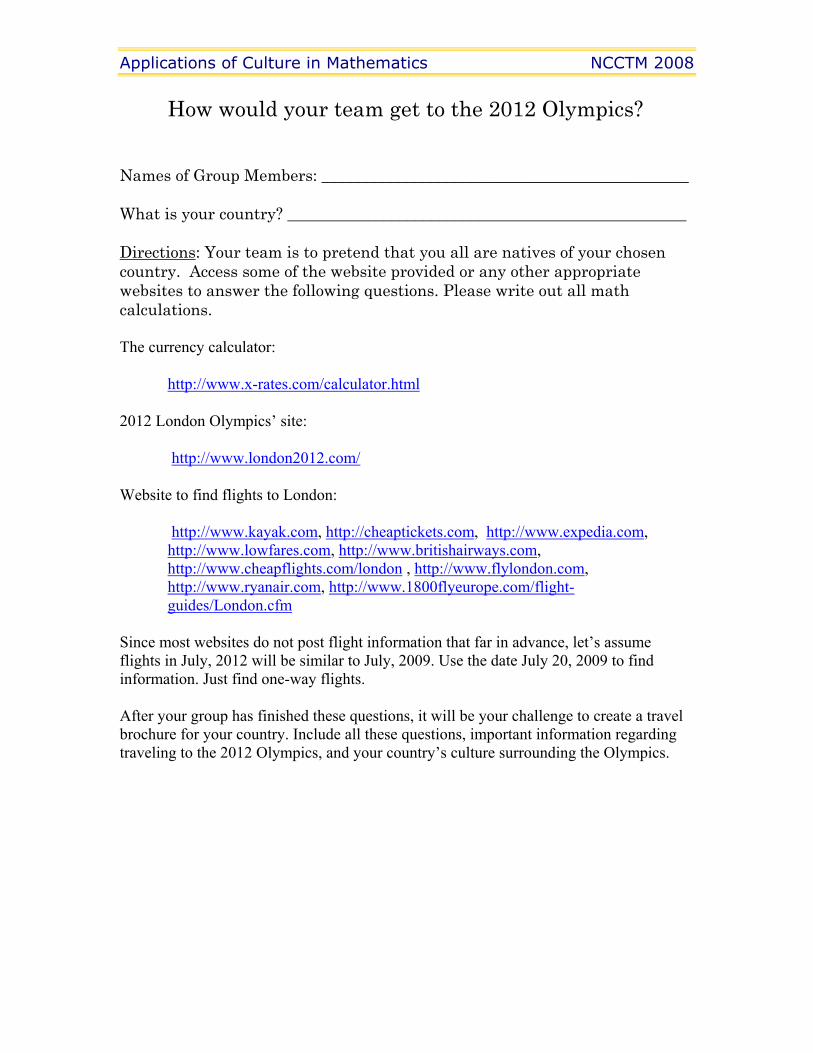
How would your team get to the 2012 Olympics?
Names of Group Members: ______________________________________________
What is your country? __________________________________________________
Directions: Your team is to pretend that you all are natives of your chosen country. Access some of the website provided or any other appropriate websites to answer the following questions. Please write out all math calculations.
The currency calculator:
http://www.x-rates.com/calculator.html
2012 London Olympics’ site:
http://www.london2012.com/
Website to find flights to London:
http://www.kayak.com, http://cheaptickets.com, http://www.expedia.com, http://www.lowfares.com, http://www.britishairways.com, http://www.cheapflights.com/london , http://www.flylondon.com, http://www.ryanair.com, http://www.1800flyeurope.com/flight-guides/London.cfm
Since most websites do not post flight information that far in advance, let’s assume flights in July, 2012 will be similar to July, 2009. Use the date July 20, 2009 to find information. Just find one-way flights.
After your group has finished these questions, it will be your challenge to create a travel brochure for your country. Include all these questions, important information regarding traveling to the 2012 Olympics, and your country’s culture surrounding the Olympics.
Applications of Culture in Mathematics NCCTM 2008
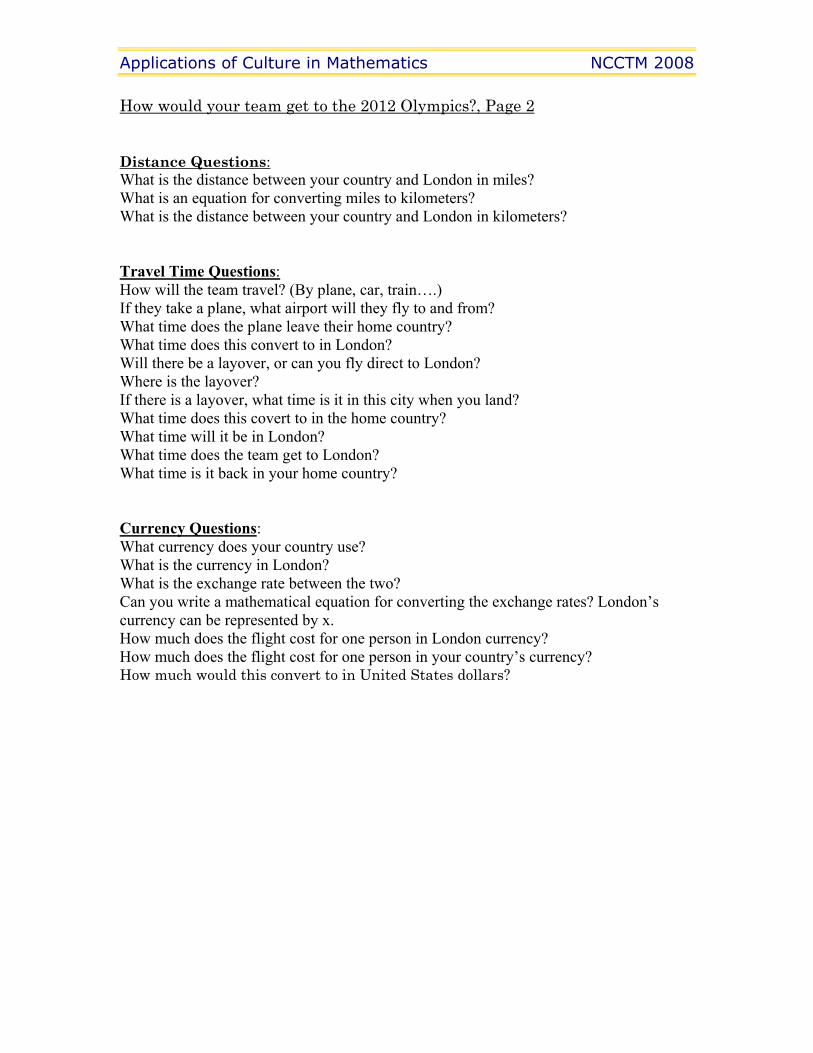
How would your team get to the 2012 Olympics?, Page 2
Distance Questions:What is the distance between your country and London in miles? What is an equation for converting miles to kilometers? What is the distance between your country and London in kilometers?
Travel Time Questions: How will the team travel? (By plane, car, train….) If they take a plane, what airport will they fly to and from? What time does the plane leave their home country? What time does this convert to in London? Will there be a layover, or can you fly direct to London? Where is the layover? If there is a layover, what time is it in this city when you land? What time does this covert to in the home country? What time will it be in London? What time does the team get to London? What time is it back in your home country?
Currency Questions: What currency does your country use? What is the currency in London? What is the exchange rate between the two? Can you write a mathematical equation for converting the exchange rates? London’s currency can be represented by x. How much does the flight cost for one person in London currency? How much does the flight cost for one person in your country’s currency? How much would this convert to in United States dollars?
Applications of Culture in Mathematics NCCTM 2008
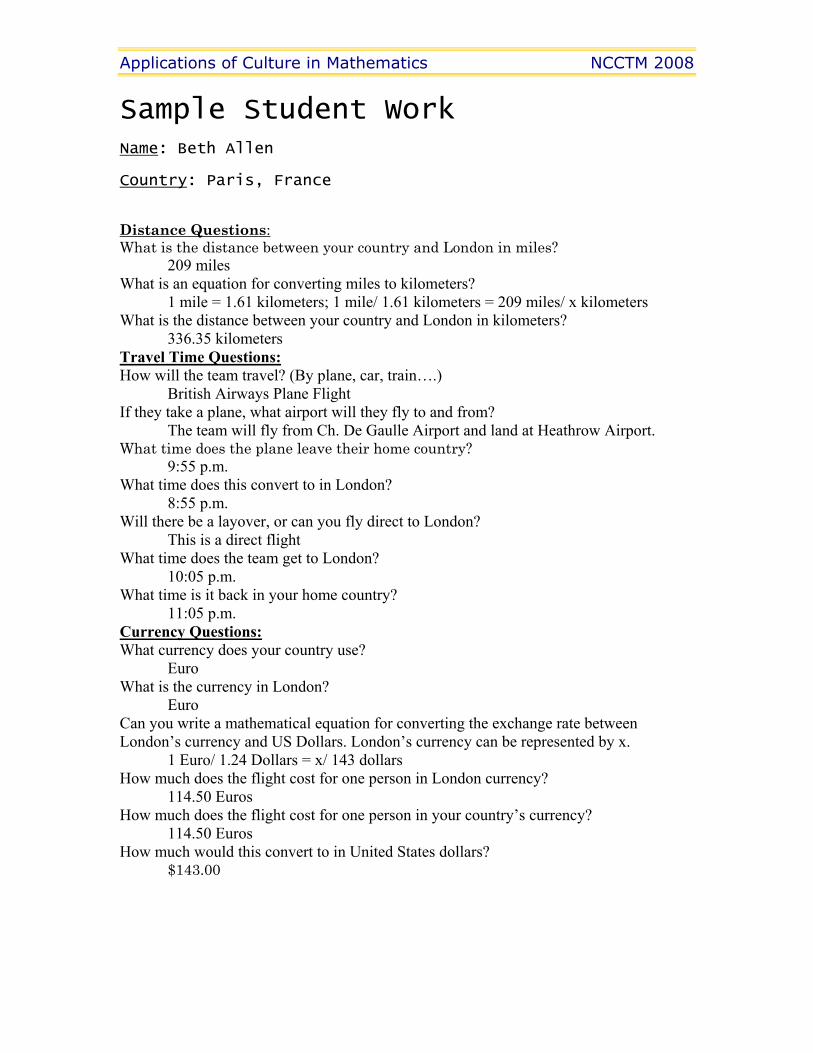
Sample Student Work Name: Beth Allen
Country: Paris, France
Distance Questions:What is the distance between your country and London in miles?
209 miles What is an equation for converting miles to kilometers?
1 mile = 1.61 kilometers; 1 mile/ 1.61 kilometers = 209 miles/ x kilometers What is the distance between your country and London in kilometers?
336.35 kilometers Travel Time Questions: How will the team travel? (By plane, car, train….)
British Airways Plane Flight If they take a plane, what airport will they fly to and from?
The team will fly from Ch. De Gaulle Airport and land at Heathrow Airport. What time does the plane leave their home country?
9:55 p.m. What time does this convert to in London?
8:55 p.m. Will there be a layover, or can you fly direct to London?
This is a direct flight What time does the team get to London?
10:05 p.m. What time is it back in your home country?
11:05 p.m. Currency Questions: What currency does your country use?
Euro What is the currency in London?
Euro Can you write a mathematical equation for converting the exchange rate between London’s currency and US Dollars. London’s currency can be represented by x.
1 Euro/ 1.24 Dollars = x/ 143 dollars How much does the flight cost for one person in London currency?
114.50 Euros How much does the flight cost for one person in your country’s currency?
114.50 Euros How much would this convert to in United States dollars?
$143.00
Applications of Culture in Mathematics NCCTM 2008
Christina Cook Wake Forest University
TOPIC: Distance-Rate-Time, Conversions, and Bullfighting
NCTM STANDARDS: Problem Solving, Communication, Connections
GOALS: Students will learn and form opinions about the Spanish tradition of bullfighting. Students will be able to use the distance equation to make calculations, as well as use proportions to make conversions.
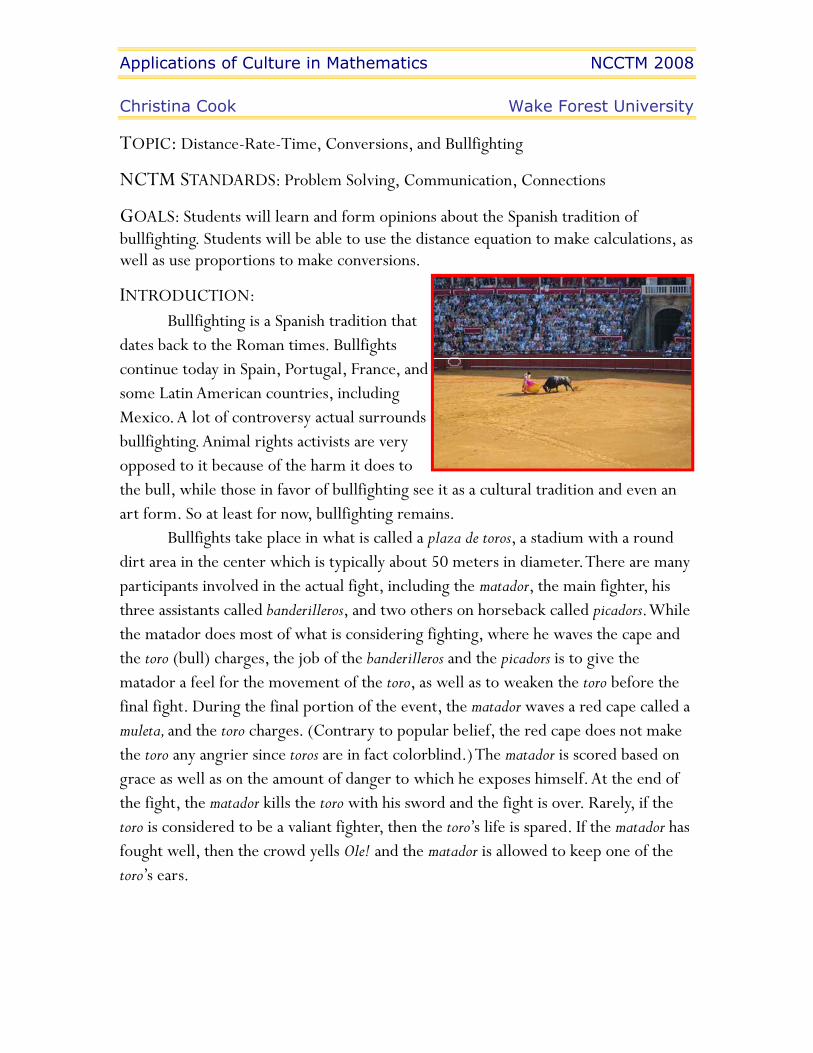
INTRODUCTION: Bullfighting is a Spanish tradition that dates back to the Roman times. Bullfights continue today in Spain, Portugal, France, and some Latin American countries, including Mexico. A lot of controversy actual surrounds bullfighting. Animal rights activists are very opposed to it because of the harm it does to the bull, while those in favor of bullfighting see it as a cultural tradition and even an art form. So at least for now, bullfighting remains. Bullfights take place in what is called a plaza de toros, a stadium with a round dirt area in the center which is typically about 50 meters in diameter. There are many participants involved in the actual fight, including the matador, the main fighter, his three assistants called banderilleros, and two others on horseback called picadors. While the matador does most of what is considering fighting, where he waves the cape and the toro (bull) charges, the job of the banderilleros and the picadors is to give the matador a feel for the movement of the toro, as well as to weaken the toro before the final fight. During the final portion of the event, the matador waves a red cape called a muleta, and the toro charges. (Contrary to popular belief, the red cape does not make the toro any angrier since toros are in fact colorblind.) The matador is scored based on grace as well as on the amount of danger to which he exposes himself. At the end of the fight, the matador kills the toro with his sword and the fight is over. Rarely, if the toro is considered to be a valiant fighter, then the toro�s life is spared. If the matador has fought well, then the crowd yells Ole! and the matador is allowed to keep one of the toro�s ears.

Applications of Culture in Mathematics NCCTM 2008
ACTIVITIES:
Part 1: Introduction to Bullfighting. Teacher neutrally introduces facts about bullfighting to students. Students become familiar with the role each character plays during a bullfight (see Introduction above).
Part 2: Introduction to the Distance Equation
distance = rate X time time = distance ÷÷ rate rate = distance ÷÷ time
*If rate (speed) is measured in kilometers per hour (kph), then the distance must be in kilometers and the time must be in hours. (i.e., if the units do not match up in what is given in the problem, then the units must first be converted so that they all match)
Example problem: If the matador, running at 13 kph, and the banderillero, running at 19 kph, both start at the center of the plaza de toros and run in opposite directions, how many seconds will it take until they are 30 meters apart?
First set up the scenario using the manipulatives to give students a visual representation about what our problem is asking.
◦Step 1: First notice that the rate is given in kph, but the distance is given in meters. Therefore, we must convert meters to kilometers by setting up a proportion:
xm
kmm 30
11000
= xmmkm •=• 100030.1mmkmx
1000301 •
= kmx 03.=
13kph19kph
30meters

Applications of Culture in Mathematics NCCTM 2008
◦Step 2: Now that we have the same units, we can begin to use our distance equation. Let d1
represent the distance run by the matador and d2 be the distance run by the banderillo. Let r1 be the rate of the matador and r2 the rate of the banderillero. In this example, we are solving for time so we will use the equation time = distance ÷ rate. Also, since we know they must be .03 km apart, we know d1 + d2 = .03 km so d2 = .03 - d1
t1 = d1÷÷r1 = d1÷÷1133 t2 = d2÷÷ r2= (.03 � d1)÷÷19
Setting the times equal gives: d1÷÷ 13 = (.03 � d1) ÷÷ 19 Cross multiplying gives: 19d1 = 13(.03 � d1) = .39 � 13 d1
Solving for d1 gives: 39 d1= .39 so d1= .01
◦Step 3: Plug d1= .01 into the distance equation to find the time.
t1 = d1÷÷r1 = .01 ÷÷1133 == .00077 hours
◦Step 4: Now we have found the time, but we are not quite done. The problem asks for the time in seconds, not hours. To convert .00077 hours to seconds, we must multiply by the number of seconds in an hour, which is 3600. .00077 x 3600 = 2.77 seconds!
Part 3: Bullfighting and Distance-Rate-Time Activity (see below)
Students should be divided into groups of two or three to collaborate and work on this assignment.

Applications of Culture in Mathematics NCCTM 2008
Bullfighting and Distance-Rate-Time
●Distance: The width of the plaza de toros is 50 meters.
●Conversions to know: 1 kilometer = 1000 meters 1 hour = 3600 seconds
Question: What are the two sides of the argument over bullfighting? After learning more about it, what is your opinion? Should bullfighting be allowed or not? ___________________________ ________________________________________________________________________________________________________________________________________________________________________________________________________________________
Directions: Solve the following problems with your partner. If it helps you, set up the scenario using the cut-outs so you can visualize what is happening in each problem. ¡Buena suerte!
1. Suppose the matador and the toro are 30 meters apart and the toro runs toward the matador, who is standing still, at 22 kph. How many seconds will it take for the toro to reach the matador?
2. If the banderillero, who runs 19kph, is 5 meters ahead of the toro when the toro starts chasing him at 24 kph, how many seconds will it take for the toro to catch up?
3. If the toro, running 25 kph, and the banderillero, running 19kph, start on opposite sides of the plaza de toros and run towards one another, how many meters will the toro have to run until they run into one another?
4. If the toro, who runs 23 kph, starts out 10 meters ahead of the picador, whose horse runs 29 kph, how many seconds will it take for the picador to catch the toro?
5. If the toro starts out 15 meters in front of the picador and runs 20 kph and the picador catches up to the toro in about 10 seconds, then how fast is the picador�s horse running?
6. Now you and your partner create and solve your own scenario (imagine yourself as one of the characters if you like). Then give the problem to another group to see if they are able to solve it!

Applications of Culture in Mathematics NCCTM 2008
MATADOR BANDERILLEROTORO PICADOR

Applications of Culture in Mathematics NCCTM 2008
Bullfighting and Distance-Rate-Time ANSWER KEY
1. Suppose the matador and the toro are 30 meters apart and the toro runs toward the matador, who is standing still, at 22 kph. How many seconds will it take for the toro to reach the matador? Step 1: Change meters to kilometers since we are dealing with kph. (3 meters =.03 kilometers)
Step 2: Use the equation time = distance ÷÷ rate since we are trying to figure out how many seconds (time) it will take. (.00136 hours) Step 3: Now convert hours to seconds. (4.91 seconds)
2. If the banderillero, who runs 19kph, is 5 meters ahead of the toro when the toro starts chasing him at 24 kph, how many seconds will it take for the toro to catch up? Step 1: First convert 5 meters to kilometers. (5 meters = .005 kilometers) Step 2: Let the rate of the banderillero be r1 = 19 kph. Let the rate of the toro be r2 = 24 kph. Step 3: Let d1 = the distance run by the banderillero, and let d2 = the distance run by the toro. We know that since the banderillero starts out 5 meters = .005km ahead of the toro, then d1 = d2 -.005.
Step 4: The times each must run are equal so now we are ready to use the equation time = distance ÷÷ rate. (d2 = .024)
Step 5: Now that we have solved for d2, we can plug it into the equation time = distance ÷÷ rate to find out how long it took the toro to catch up to the banderillero. (t2 = .001hours = 3.6 sec).
3. If the toro, running 25 kph, and the banderillero, running 19kph, start on opposite sides of the plaza de toros and run towards one another, how many meters will the toro have to run until they run into one another? Step 1: Let r1 be the rate of the toro, and r2 be the rate of the banderillero. Step 2: From the culture lesson, we know the width of the plaza de toros is 50 meters, which is .05 kilometers. Letting the distance the toro must run be d1 and the distance the banderillero must run d2, we know that d1 + d2 = .05, so d2 = .05 � d1
Step 3: They will be running the same amount of time until they run into each other so let t1=t2. Now using
the equation time = distance ÷÷ rate we can solve for d1. (d1=.0284km = 28.4 m)
4. If the toro, who runs 23 kph, starts out 3 meters ahead of the picador, whose horse runs 29 kph, how many meters will the picador go before he catches the toro? Step 1: Let t1 = the rate of the toro and t2=the rate of the picador�s horse and d1 = the distance the toro runs and d2 = the distance the picador�s horse runs. Step 2: Since the toro starts out 3 meters = .003km ahead of the picador, we know that d2=.003 + d1.
Step 3: We can now use the equation time = distance ÷÷ rate. d1 = .0115km=11.5m so (d2 = 14.5m)
5. If the toro starts out 15 meters in front of the picador and runs 20 kph and the picador catches up to the toro in about 10 seconds, then how fast is the picador�s horse running? Step 1: Let r1 = the rate of the toro and r2 = the rate of the picador. Let d1 = the distance the toro runs and d2
= the distance the picador runs. Let t1 = t2 = 10 seconds be the time it takes for the picador to catch up to the toro.Step 2: We know that d1=d2 - .015 since the toro starts out 15 m = .015 km ahead of the picador. Step 3: Convert the seconds to hours. (10 seconds = .00278 hours) Step 4: Set up and solve the equations. (r2 = 25.4kph)
Applications of Culture in Mathematics NCCTM 2008
Lindsey Bakewell Wake Forest University
Graffiti and Mathematics
INTRODUCTION: Many people recognize graffiti as an artform that vandalizes public property. However, graffiti has a rich history in personal expression and designs of mathematics. Graffiti artists find pride in their messages, as they often pertain to social issues or injustices. Graffiti, if defined as writings on the wall, dates back to ancient Rome. The urban graffiti that is known today, characterized by spray-paint and vivid colors, appeared first in New York City in the 1960s. Taki 183, who lived in the Washington Heights district, worked as a messenger. As he traveled throughout the city, he would write his name at his various stops, beginning the practice of “tagging.” Many others followed in this practice of the marking of territory, and soon, graffiti was widespread throughout the subway stations and other parts of the city. As graffiti artists competed to have the biggest, most intricate designs, the “style wars” of the 1970s began. While the transit authorities and the police attempted to put a stop to the graffiti, the graf writers (the term they prefer to identify themselves) continued to create their designs. In a society that told them they lacked talent and ambition, the graf writers, often from the slums or ghettos of the city, found great pride in their expressions of creativity. In the 21st Century, there are still some practicing graf writers from the 1970s, but graffiti can now be seen on CDs and t-shirts in addition to walls and street signs. It is a marked expression of hip-hop subculture. In studying the graffiti, it is interesting to note the mathematics that emerges from the designs. Graffiti is marked by ideas of symmetry, balance, patterns, measurement, and proportion.
NCTM STANDARDS: Measurement, Connections, and Representation
MATERIALS:
GOALS: Students will apply the concepts of graffiti to graphing in the Cartesian coordinate plane. Students will be able to graph parabolas, inequalities, exponential functions, cubic equations, absolute value equations, and circles.
ACTIVITIES: Part I: Introduction Students will discover the historical background of graffiti and its relation to concepts in mathematics. The teacher will review previously studied topics, such as quadratic functions, circles, cubic equations, etc. and the standard equations for each.
Part II: Research Students will use the Internet to find images of graffiti. They should choose appropriate pictures that demonstrate the different ideas of mathematics (symmetry, functions, circles, patterns). Students will create a poster that displays the graffiti design and highlights its mathematical characteristics.
ASSESSMENT: Students will create their own graffiti designs to demonstrate their graphing abilities of specific functions.
Applications of Culture in Mathematics NCCTM 2008
Part I: Introduction
For Part I and Part II, students will need a computer with Internet access. Teacher will direct students to the following website: http://www.ccd.rpi.edu/Eglash/csdt/subcult/grafitti/index.html. (Check prior to lesson to ensure that the website can be viewed on your school’s computers.) Students will need to read through the sections under CULTURE and Cartesian Coordinates under TUTORIAL. Students will fill in the answers to the Culture section on the Graffiti handout.
The teacher will then lead in reviewing the standard forms of the following functions: Quadratics cbxaxy ++= 2
Inequalities ≤y , y≥ , <y , >y Exponential Functions bay x += Cubics dcxbxaxy +++= 23
Higher Order Functions 012
21
1 ... axaxaxaxay nn
nn
nn +++++= −
−−
−
Absolute Value xy =
Circles 222 )()( rkyhx =−+−
Part II: Research
Students will use the Internet to find examples of graffiti that incorporate some of the mathematical concepts reviewed in Part I. Students are encouraged to look for symmetry, patterns, parabolic or cubic shapes, circles, etc. Students will make a poster displaying the graffiti. Their posters should identify the different mathematics they see in the graffiti. They must use the correct terminology. When identifying a function, students must also give an approximate equation to represent the function. For example, if a student identifies a parabolic shape, he or she should also write the equation and any other conclusions (i.e. a is positive/negative). Students must use appropriate citing when pulling an image off of the Internet.
ASSESSMENT:
Students will create their own graffiti designs. Students will need to follow the guidelines on the rubric to receive credit for their design. They will be graded on creativity and mathematical content. Students will create a graffiti design first by hand on graph paper. Then on Geometer’s Sketchpad, they will graph only the specific functions that are in their design. Both the Sketchpad printout and their sketch by hand will be part of their overall grade. To graph functions in Geometer’s Sketchpad, follow the steps below:
1. Open a new sketch in Geometer’s Sketchpad. 2. Go to Graph, and select Show Grid.3. Go to Graph, and select Plot New Function.4. Enter the equation for =y and click OK.5. Using the arrow Select Tool, highlight the equation that appears and right-click. Go to
Color, and change the color to one of your choice.

Applications of Culture in Mathematics NCCTM 2008
6. Using the arrow Select Tool, highlight the graph of the equation and right-click. Go to Color, and change the color to the same color as the equation.
7. Repeat Steps 3 – 6 until all equations are entered. NOTE: When trying to graph a circle, you may either use the Circle tool on the left sidebar or enter in two separate square root equations for =y . For entering absolute value functions, in Plot New Function, click on Function, and select abs. This will produce parentheses to represent the expression that belongs in absolute value.

Applications of Culture in Mathematics NCCTM 2008
Student Name: __________________________ Date: __________________
Directions: You will first learn about the history of graffiti and how it relates to concepts in math. You will then search on the Internet to find an example of graffiti that expresses these concepts and create a poster that showcases the art and math. The final part of the project is to design your own graffiti that incorporates at least 5 different functions. You will turn in your answers to the questions on the history of graffiti, your graffiti design on graph paper, and the Geometer’s Sketchpad printout with the equations for your functions. You will present to the entire class your poster of the graffiti you find on the Internet.
RubricHistory of Graffiti Questions (10 points)
Criteria (with possible points earned) Teacher Evaluation
Answer each question correctly (1 point each)
Graffiti Poster and Presentation (40 points) Criteria (with possible points earned) Teacher Evaluation
Select an appropriate graffiti design (5 points) Identify correctly the math concepts in the design (15 points) Poster is neat and organized (5 points) Present poster in a professional way (5 points)
Graffiti Design and Geometer’s Sketchpad Work (50 points) Criteria (with possible points earned) Teacher Evaluation
Use at least 5 functions in design (5 points) All functions are sketched clearly and correctly (10 points) All equations are written correctly (10 points) All equations are correct on Sketchpad work (10 points) Sketchpad work coincides with graph by hand (10 points) Sketch looks like a design of graffiti (5 points)
Student Score: _________________________

Applications of Culture in Mathematics NCCTM 2008
Name: ________________________ History of Graffiti
Directions: Visit http://www.ccd.rpi.edu/Eglash/csdt/subcult/grafitti/index.html and read through the sections under CULTURE and Cartesian Coordinates under TUTORIAL. Answer the following questions. (This portion of your project is worth 10 points.)
1. If we define graffiti as writings on the wall, where was the first graffiti? _____________
2. Where did the first urban style graffiti originate? _______________________________
3. Who is known as the first graf writer? ________________________________________
4. What is the term for writing your name on walls and subway cars? _________________
5. When were the “Style Wars”? _______________________________________________
6. What is one title that graf writers competed for? ________________________________
7. In addition to walls and subway cars, where can graffiti be seen now?
8. What were some obstacles that graf writers faced?
9. Graffiti is one of the four elements of hip hop culture. What are the other three elements?
10. How do graf writers use grids?
Applications of Culture in Mathematics NCCTM 2008
Answers to History of Graffiti Worksheet1. Rome 2. New York City 3. Taki 183 4. “tagging” 5. 1970s 6. “King of all Lines” 7. t-shirts, CD covers, and posters 8. police patrolling the area, transit authorities, their designs being washed off, barbed wired
fences, and guard dogs 9. emceeing, DJing, B-Boying 10. to plan out their designs as they would create them on the walls
Applications of Culture in Mathematics NCCTM 2008
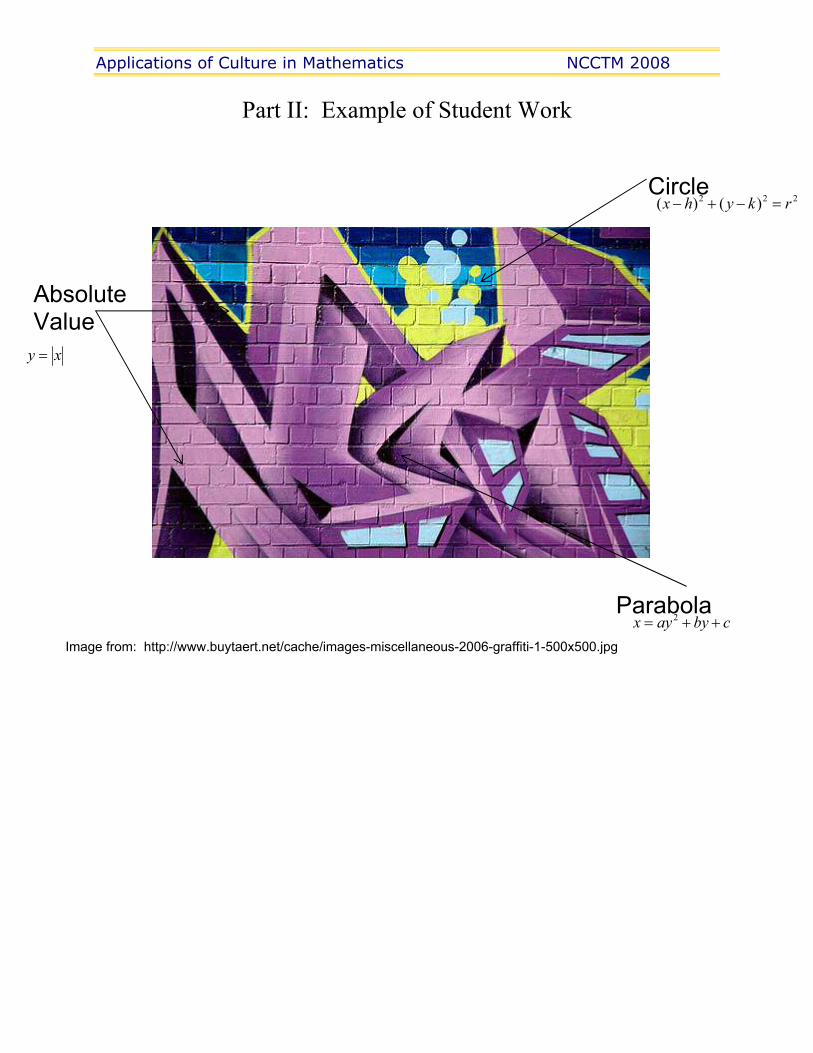
Part II: Example of Student Work
222 )()( rkyhx =−+−Circle
Absolute Value xy =
Parabola cbyayx ++= 2
Image from: http://www.buytaert.net/cache/images-miscellaneous-2006-graffiti-1-500x500.jpg
Applications of Culture in Mathematics NCCTM 2008
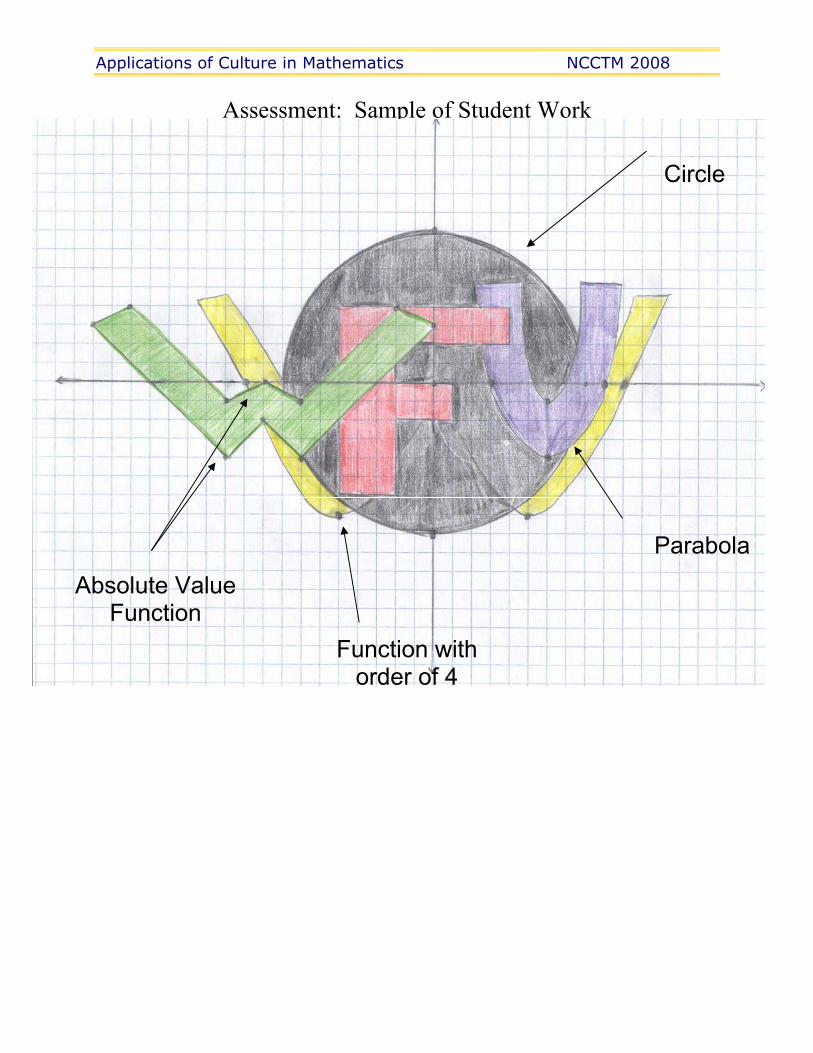
Assessment: Sample of Student Work
Absolute Value Function
Function with order of 4
Parabola
Circle

Applications of Culture in Mathematics NCCTM 2008
Assessment: Sample of Student Work (…cont…) Geometer’s Sketchpad
8
6
4
2
-2
-4
-6
-8
-10
-12
-14
-10 -5 5 10 15 20
s x( ) = -1
2( )⋅ x+9
r x( ) = - 64-x2
q x( ) = 64-x2
h x( ) = 0.00373 ⋅x4-0.3733 ⋅x2
g x( ) = 4
9( )⋅ x-6( )2-4
f x( ) = x+11 -4
Applications of Culture in Mathematics NCCTM 2008
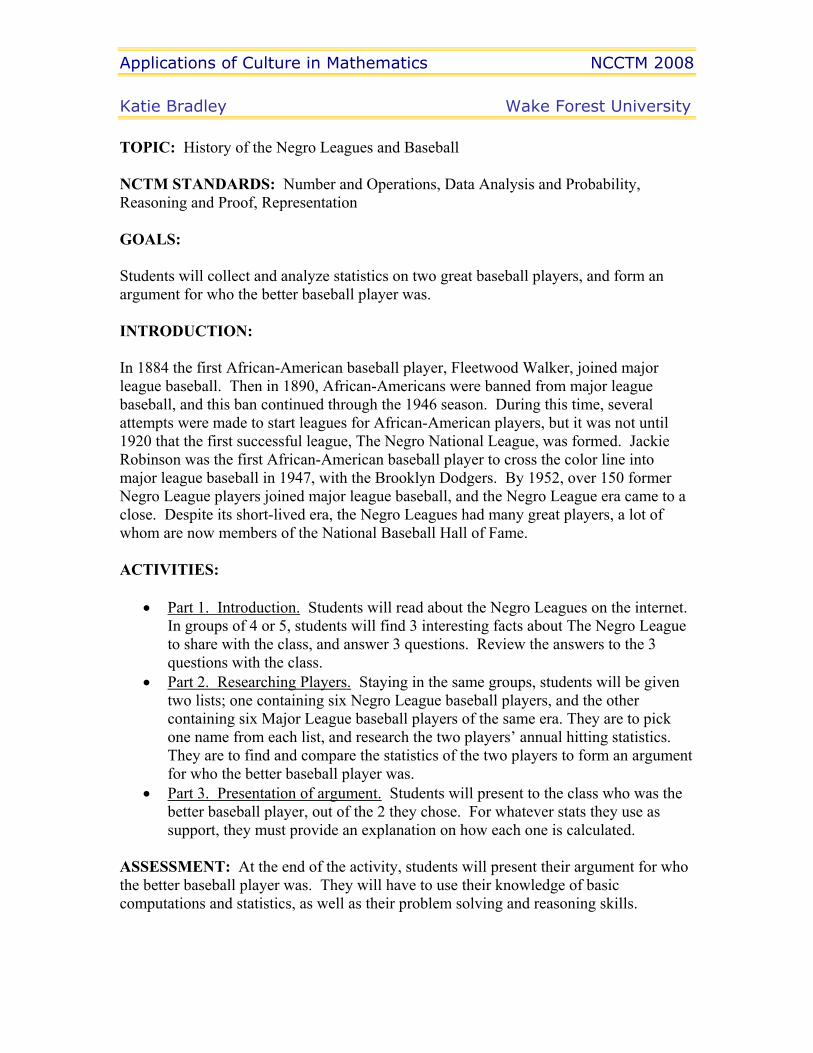
Katie Bradley Wake Forest University
TOPIC: History of the Negro Leagues and Baseball
NCTM STANDARDS: Number and Operations, Data Analysis and Probability, Reasoning and Proof, Representation
GOALS:
Students will collect and analyze statistics on two great baseball players, and form an argument for who the better baseball player was.
INTRODUCTION:
In 1884 the first African-American baseball player, Fleetwood Walker, joined major league baseball. Then in 1890, African-Americans were banned from major league baseball, and this ban continued through the 1946 season. During this time, several attempts were made to start leagues for African-American players, but it was not until 1920 that the first successful league, The Negro National League, was formed. Jackie Robinson was the first African-American baseball player to cross the color line into major league baseball in 1947, with the Brooklyn Dodgers. By 1952, over 150 former Negro League players joined major league baseball, and the Negro League era came to a close. Despite its short-lived era, the Negro Leagues had many great players, a lot of whom are now members of the National Baseball Hall of Fame.
ACTIVITIES:
• Part 1. Introduction. Students will read about the Negro Leagues on the internet. In groups of 4 or 5, students will find 3 interesting facts about The Negro League to share with the class, and answer 3 questions. Review the answers to the 3 questions with the class.
• Part 2. Researching Players. Staying in the same groups, students will be given two lists; one containing six Negro League baseball players, and the other containing six Major League baseball players of the same era. They are to pick one name from each list, and research the two players’ annual hitting statistics. They are to find and compare the statistics of the two players to form an argument for who the better baseball player was.
• Part 3. Presentation of argument. Students will present to the class who was the better baseball player, out of the 2 they chose. For whatever stats they use as support, they must provide an explanation on how each one is calculated.
ASSESSMENT: At the end of the activity, students will present their argument for who the better baseball player was. They will have to use their knowledge of basic computations and statistics, as well as their problem solving and reasoning skills.

Applications of Culture in Mathematics NCCTM 2008
Part 1. Introduction.
The Negro Leagues were an important part of early twentieth century African-American culture in the United States. Explore the following website to learn about the Negro Leagues.
http://www.negroleaguebaseball.com/
Find three facts you and your group members find interesting, and be prepared to share them with the class.
Fact 1:
Fact 2:
Fact 3:
Answer the following questions about the Negro Leagues’ history.
1. Who created the first successful Negro League?
2. True or False: There were no white players to play in the Negro Leagues. Support your answer.
3. List 2 reasons the Negro Leagues became less popular in the 1940’s, and eventually disbanded in 1952.

Applications of Culture in Mathematics NCCTM 2008
Part 2. Researching Players.
Pick two players to research from the following table; one from the Negro Leagues column and one from the Major Leagues column: Negro Leagues Major Leagues Biz Mackey Lou Gehrig Sam Jethroe Mel Ott Cool Papa Bell Rogers Hornsby Josh Gibson Jimmie Foxx Monte Irvin Joe DiMaggio Larry Doby Hank Greenberg
After choosing two players, go to the following websites and research the annual statistics for each of your players:
Major League Baseball: http://www.baseball-almanac.com/legendary/lisab100.shtml
Negro League Baseball: Josh Gibson: http://sports.jrank.org/pages/1645/Gibson-Josh-Career-Statistics.html
Biz Mackey: http://www.baseball-reference.com/bullpen/Biz_Mackey
Cool Papa Bell: http://www.baseball-almanac.com/players/p_bell1.shtml
The other 3 players: http://www.baseball-almanac.com/legendary/lisabr40.shtml
Your goal is to decide which baseball player was better. You may use any statistics you like to form your argument, and you must include an explanation for why you chose the statistics you did. If you choose to include percentages, such as batting average or slugging percentage, you must give an explanation of how each of percentage is calculated.
Part 3. Presentation of Argument.
At the completion of the project, your group will present your project to the class. There are two parts of the presentation:
1. Choose the 3 most interesting facts your group found about the Negro Leagues, and share with the class.
2. Explain to the class which of the two baseball players you researched was better. You must include the statistics used to support your argument.
Each group must turn in a one page, written summary including the 3 interesting facts their group chose to share, along with the players and statistics used to decide who the better baseball player was.
Applications of Culture in Mathematics NCCTM 2008
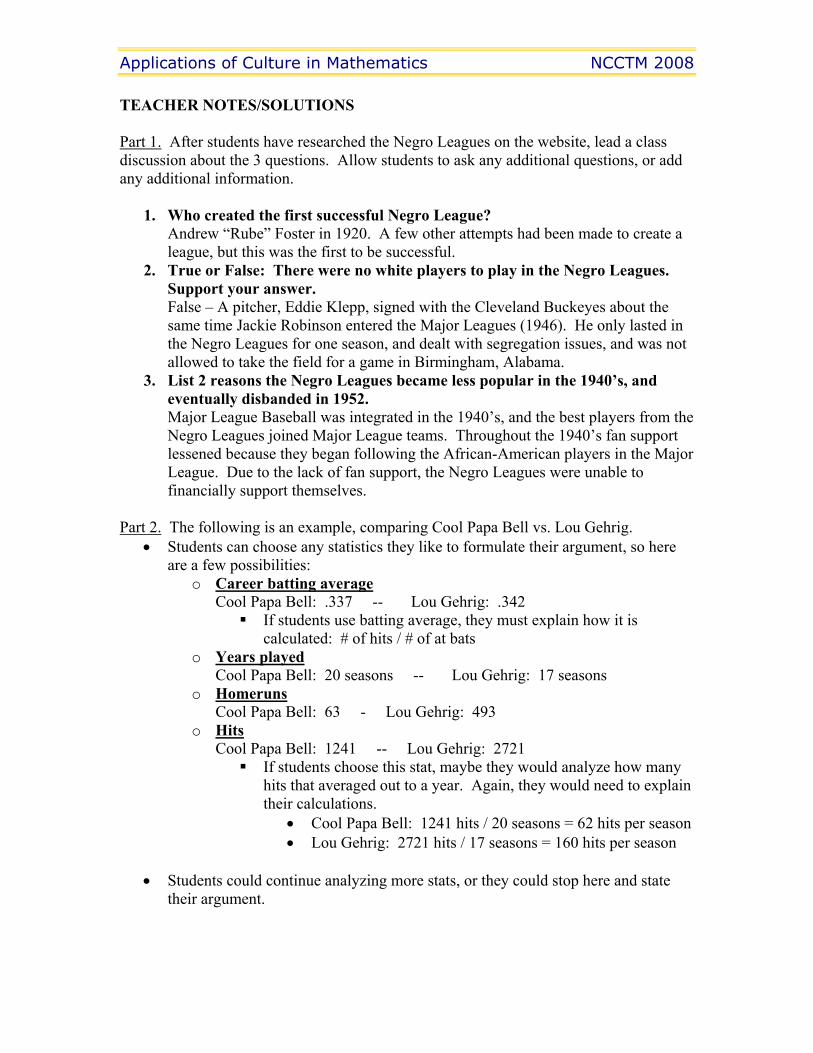
TEACHER NOTES/SOLUTIONS
Part 1. After students have researched the Negro Leagues on the website, lead a class discussion about the 3 questions. Allow students to ask any additional questions, or add any additional information.
1. Who created the first successful Negro League? Andrew “Rube” Foster in 1920. A few other attempts had been made to create a league, but this was the first to be successful.
2. True or False: There were no white players to play in the Negro Leagues. Support your answer. False – A pitcher, Eddie Klepp, signed with the Cleveland Buckeyes about the same time Jackie Robinson entered the Major Leagues (1946). He only lasted in the Negro Leagues for one season, and dealt with segregation issues, and was not allowed to take the field for a game in Birmingham, Alabama.
3. List 2 reasons the Negro Leagues became less popular in the 1940’s, and eventually disbanded in 1952. Major League Baseball was integrated in the 1940’s, and the best players from the Negro Leagues joined Major League teams. Throughout the 1940’s fan support lessened because they began following the African-American players in the Major League. Due to the lack of fan support, the Negro Leagues were unable to financially support themselves.
Part 2. The following is an example, comparing Cool Papa Bell vs. Lou Gehrig. • Students can choose any statistics they like to formulate their argument, so here
are a few possibilities: o Career batting average
Cool Papa Bell: .337 -- Lou Gehrig: .342 If students use batting average, they must explain how it is
calculated: # of hits / # of at bats o Years played
Cool Papa Bell: 20 seasons -- Lou Gehrig: 17 seasons o Homeruns
Cool Papa Bell: 63 - Lou Gehrig: 493 o Hits
Cool Papa Bell: 1241 -- Lou Gehrig: 2721 If students choose this stat, maybe they would analyze how many
hits that averaged out to a year. Again, they would need to explain their calculations.
• Cool Papa Bell: 1241 hits / 20 seasons = 62 hits per season • Lou Gehrig: 2721 hits / 17 seasons = 160 hits per season
• Students could continue analyzing more stats, or they could stop here and state their argument.

Applications of Culture in Mathematics NCCTM 2008
Part 3. Have each group present their three most interesting facts about the Negro Leagues. Then have each group will state who the two players were that they chose to compare, and then state which one they decided was better. After stating their decision, they must go through each statistic used, and explain how those statistics helped them reach their decision. Be sure to collect a one page, written summary from each group.

Applications of Culture in Mathematics NCCTM 2008
Jen Cipriano Wake Forest University
TOPIC: Egyptian Math
NCTM STANDARDS: Algebra, Geometry, Problem Solving, Reasoning, Connections
GOALS: • Students will use the Internet to complete a guided WebQuest on Egyptian
numerals. • Students will use geometry and algebra to solve problems about the Great
Pyramid. • Students will review geometry concepts including area, surface area, and
volume. • Students will compare and contrast Egyptian numerals with our current number
system.
INTRODUCTION: The Ancient Egyptians were one of the first civilizations to practice scientific arts, and were especially interested in applied mathematics. This meant that unlike other civilizations who delved in abstract mathematical thinking, the Egyptians were much more concerned with practical arithmetic, or what we might think of today as real world applications. Their earliest numerals were hieroglyphics, and all numbers could be expressed by seven symbols. This activity explores Egyptian numerals through word problems about pyramids, perhaps one of the greatest legacies of Ancient Egypt.
ACTIVITIES:
• Part 1. Egyptian Numerals - Students use the Internet to learn about Egyptian numerals.
• Part 2. Pyramid Problems – Students work in groups to solve word problems about the Great Pyramid. The must decipher Egyptian numerals in the process.
• Part 3. Extension - Students discover a method for adding and subtracting Egyptian numerals and compare and contrast this method to our number system.
ASSESSMENT: Students should be assessed on their work and answers to Part 2, as well the clarity of their reasoning in Part 3.
RESOURCES: Discovering Ancient Egypt - http://www.eyelid.co.uk/index.htm

Applications of Culture in Mathematics NCCTM 2008
Egyptian Math
Part 1: Egyptian NumeralsGo to http://www.eyelid.co.uk/numbers.htm and complete the following table of Egyptian numerals:
Number Symbol Description 1
Coil of rope
Lotus plant
10,000
100,000
Convert the following Egyptian numerals to numbers:
(1) = _________________
(2) = ___________________
Convert the following numbers to Egyptian numerals:
(3) 32,402 = _______________________________________
(4) 1,000,430 = _____________________________________

Applications of Culture in Mathematics NCCTM 2008
Part 2: Pyramid ProblemsAnswer the following questions about the Great Pyramid at Giza. Write your final answer as an Egyptian numeral.
(1) The Great Pyramid at Giza is a square pyramid. The sides of its base
measure feet. How much desert sand does this pyramid cover?
(2) The height of the peak of the Great Pyramid is
feet. If you wanted to climb the side of the pyramid, how many feet would you travel up it?
(3) If it were possible, how many gallons of water could you store inside the
Great Pyramid? (Hint: cubic feet = gallons). (You do not need to write this answer in Egyptian numerals!)
(4) Suppose the pharaoh decides to paint the Great Pyramid gold. If one gallon
of paint covers square feet, and the pyramid needs coats, how many gallons would he need to buy?
(5) The pyramid was constructed using approximately limestone
blocks. If each block weighs about pounds, how many
tons does the entire pyramid weigh? (HINT: ton = pounds)

Applications of Culture in Mathematics NCCTM 2008
Part 3: ExtensionAdd the following Egyptian numerals without converting them to real numbers. Your final answer should be in the most concise form of Egyptian numerals.
(1) +
= _______________________________
(2) +
= _____________________________
(3) +
= _____________________________
(4) Explain the method you used to add the numerals. How is this similar to addition of real numbers?
Challenge: Can you subtract the following Egyptian numerals without converting them to real numbers? Show your work and explain your method and how it is similar to real numbers.
- = ______________________________________
Applications of Culture in Mathematics NCCTM 2008
Egyptian Math – Teacher Notes
Part 1: Egyptian NumeralsGo to http://www.eyelid.co.uk/numbers.htm and complete the following table of Egyptian numerals:
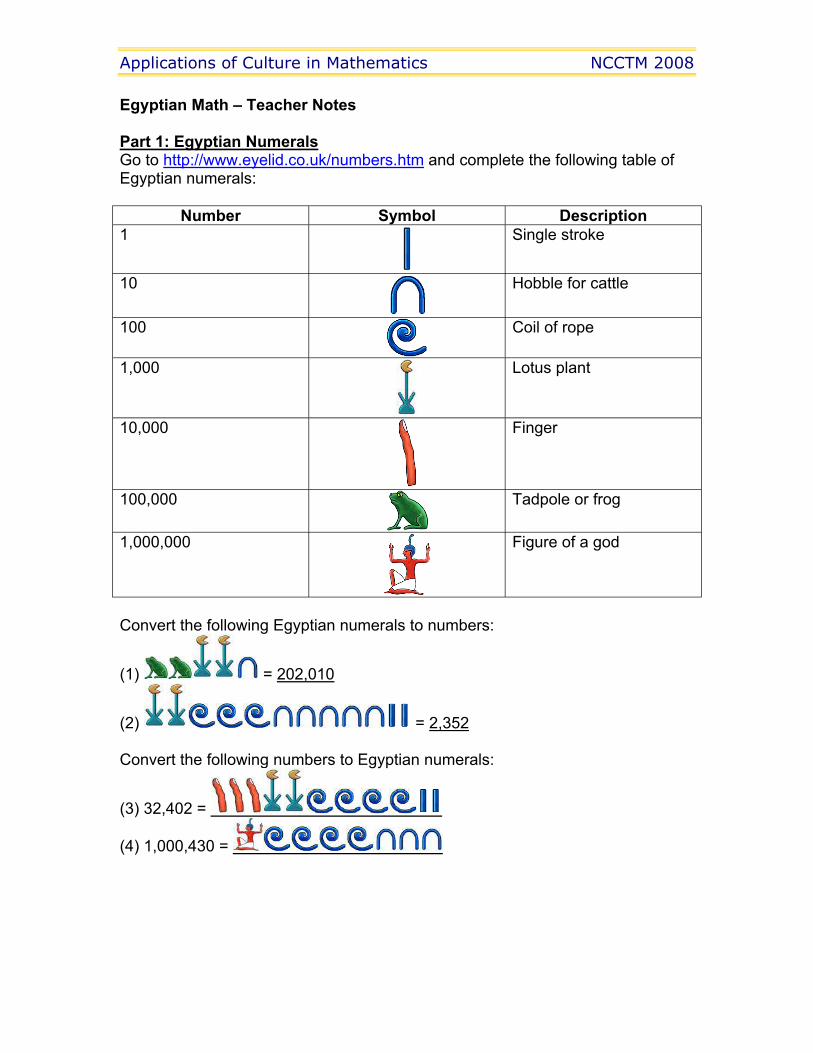
Number Symbol Description 1 Single stroke
10 Hobble for cattle
100 Coil of rope
1,000 Lotus plant
10,000 Finger
100,000 Tadpole or frog
1,000,000 Figure of a god
Convert the following Egyptian numerals to numbers:
(1) = 202,010
(2) = 2,352
Convert the following numbers to Egyptian numerals:
(3) 32,402 =
(4) 1,000,430 =
Applications of Culture in Mathematics NCCTM 2008
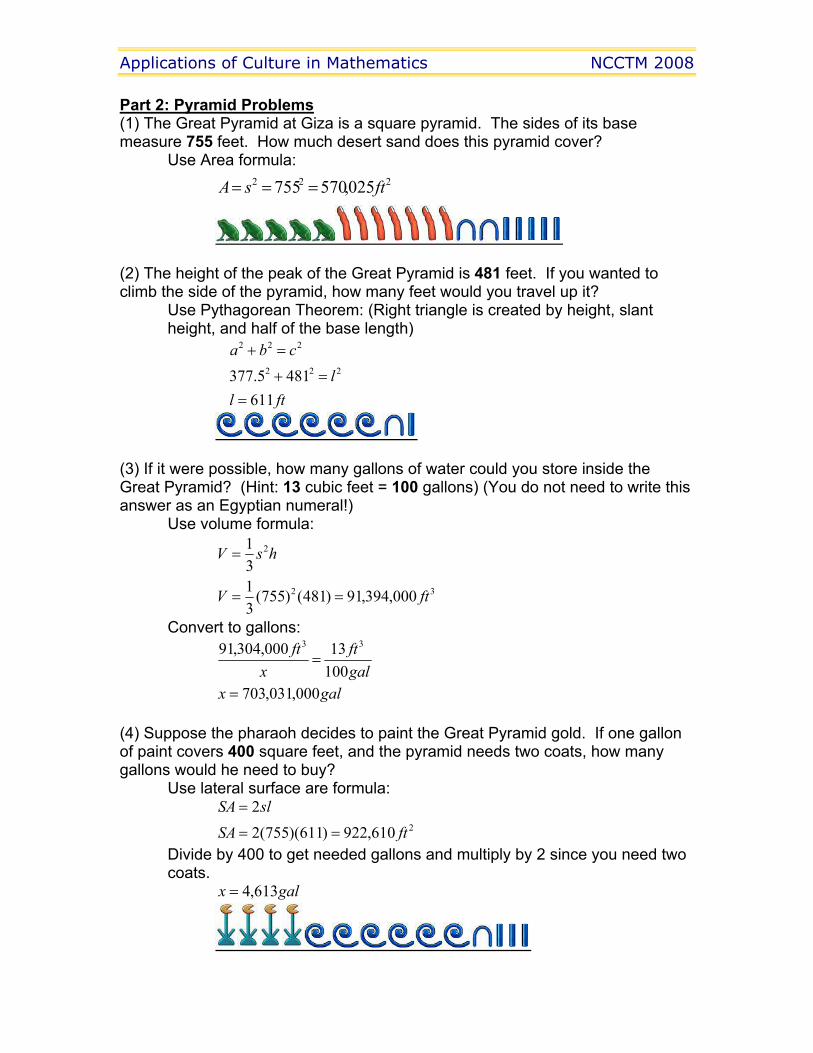
222 025,570755 ftsA ===
Part 2: Pyramid Problems(1) The Great Pyramid at Giza is a square pyramid. The sides of its base measure 755 feet. How much desert sand does this pyramid cover? Use Area formula:
(2) The height of the peak of the Great Pyramid is 481 feet. If you wanted to climb the side of the pyramid, how many feet would you travel up it? Use Pythagorean Theorem: (Right triangle is created by height, slant
height, and half of the base length)
ftll
cba
6114815.377 222
222
==+
=+
(3) If it were possible, how many gallons of water could you store inside the Great Pyramid? (Hint: 13 cubic feet = 100 gallons) (You do not need to write this answer as an Egyptian numeral!) Use volume formula:
32
2
000,394,91)481()755(3131
ftV
hsV
==
=
Convert to gallons:
galft
xft
10013000,304,91 33
=
galx 000,031,703=
(4) Suppose the pharaoh decides to paint the Great Pyramid gold. If one gallon of paint covers 400 square feet, and the pyramid needs two coats, how many gallons would he need to buy? Use lateral surface are formula:
2610,922)611)(755(22
ftSAslSA
==
=
Divide by 400 to get needed gallons and multiply by 2 since you need two coats.
galx 613,4=

Applications of Culture in Mathematics NCCTM 2008
(5) The pyramid was constructed using approximately 2,300,000 limestone blocks. If each block weighs about 2,500 pounds, how many tons does the entire weigh? (HINT: 1 ton = 1,000 pounds)
tonsx
x
000,575000,1
)500,2(000,300,2
=
=
Part 3: Extension
NOTE TO TEACHERS: Believe it or not, the Egyptian numeral system is very similar to the decimal system that we use today! While the Egyptians used pictures instead of actual numbers, both systems are base 10. Challenge students to add two Egyptian numerals without converting them to our number system first. They should group together like symbols. If they have 10 of one symbol, trade them for one of the next highest number…just like adding real numbers! For example, 12 coils become 1 lotus plant and 2 coils. If they get good at this, really challenge them with subtraction and borrowing!
Add the following Egyptian numerals without converting them to real numbers. Your final answer should be in the most concise form of Egyptian numerals.
(1) +
=
(2) +
=
(3) +
= (4) Explain the method you used to add the numerals. How is this similar to
addition of real numbers? **Group together like symbols, if there are 10 of one symbol, trade them for one of the next highest symbol.

Applications of Culture in Mathematics NCCTM 2008
Challenge: Can you subtract the following Egyptian numerals without converting them to real numbers? Show your work and explain your method and how it is similar to real numbers.
- =
-
=
**To subtract Egyptian numerals, it is necessary to borrow, just like when subtracting real numbers. Since there were no horseshoes (10s) in the first numeral, we turn a coil (100) into 10 horseshoes. Then, since there were not enough single strokes either, we turn one horseshoe into 10 single strokes. Now, we can cancel the symbols that are common to both numerals and our final numeral is composed of the symbols that are left.
Applications of Culture in Mathematics NCCTM 2008
Sarah Lovejoy Wake Forest University
TOPIC: Malawian Houses
NCTM STANDARDS: Geometry, Measurement, Connections, Representation
GOALS: Students will use the concepts of similarity, scale factors, and conversion factors to make scale drawings of different Malawian houses. Students will also practice the concepts and formulas of area and perimeter.
INTRODUCTION: In rural Malawi villages, there are both traditional and Western houses. The traditional huts are of a circular shape and are made of mud and branches. The Western style houses are rectangular and made of brick.
ACTIVITIES: • Part 1. Introduction. Teacher reviews the concepts of similarity, scale factor, and
conversion factor. The teacher also reviews the formulas for perimeter and area of a rectangle and circle. Then the teacher shows the students how to make a scale drawing of a simple rectangular and circular house.
• Part 2. Blueprint.. With a partner, students select two hut descriptions. The students then use the information given to construct blueprint of the houses that are drawn to scale and find the perimeter and area of each house.
• Part 3: Scale Model. Each group must choose one of the houses and then build a model that is similar to the actual physical house.
• Part 4: Other Countries. Students will use the internet to research other countries that have circular homes. Students must then pick a country and write a one page paper on the culture of that country.
ASSESSMENT: The students will use their knowledge of similarity, scale factors, perimeter, and area to complete the assignments which will be turned in.

Applications of Culture in Mathematics NCCTM 2008
Part 1: Introduction/Lesson In rural Malawi villages, there are both traditional and Western houses. The traditional huts are of a circular shape and are made of mud and branches. The Western style houses are rectangular and made of brick. Before people build houses, they create scale drawings.
• Does anyone know what a scale drawing is? Depiction of an object in which its dimensions (and those of its elements) are proportional to the actual dimensions in a predetermined ratio.
• What is the conversion factor? Factor by which a quantity that is expressed in one set of units must be multiplied in order to convert it into another set of units.
• What is a scale factor? The constant multiplier that scales your measurements. • What is the difference between scale and conversion factors? Conversion factors
are when you are changing a set of measurements into a different measuring system. For example: changing inches to centimeters. A scale factor is contained within the same measurement system. For example: inches to feet.
• What does it mean when two objects are similar? Similar polygons are polygons for which all corresponding angles are congruent and all corresponding sides are proportional. This means that the angles of the houses are the same physically and on paper but the length of the walls will be different.
• So how does all this relate to making blueprints? Our blueprints will be scale drawings and the drawing on paper will be “similar” to the actual house. Also, we will use a scale factor to make our blueprints.
• What are the formulas for perimeter and area of a rectangle? P=2l+2w and A=lw • What are the formulas for circumference and area of a circle? C=2πr and
A=πr^2
Now work through an example. Have a circular house with a diameter of ten feet. Therefore, the area would be 25π and the circumference would be 10π. For the blueprint, have one foot=one inch. So the house has a diameter of 10 inches. What is the scale factor? Since there are twelve inches in a foot, the scale factor is 12. Lets say the rectangular house has a length of 16 feet and a width of 14 feet. What is the area? 224 ft. What is the perimeter? 60 feet. What is the scale factor? Again, it is twelve since we are moving between inches and feet.

Applications of Culture in Mathematics NCCTM 2008
Part 2: Make your own blueprint with a partner Teacher will assign partners beforehand. Partners will choose a circular home and a rectangular home, draw a blueprint on worksheet and find the area and perimeter/circumference of each one.
Circular House choices: 1. Radius of 8 feet (height of 10 feet) 2. Diameter of 6 yards (height of 12 feet) 3. Diameter of 13 feet (height of 9 feet)
Rectangular House choices: 1. 17x20 with two rooms (height of 8 feet) 2. 15x15 with only one room (height of 9 feet) 3. 8x11 with one room (height of 10 feet)
At the end of the project, students will be given an opportunity to evaluate their partner and whether the work was shared evenly.
Part 3: Build a model Choose one of the houses that you used for the blueprint activity and build a physical model using whatever materials you wish. In Malawi, rectangular houses are built out of brick or mud whereas circular homes are always made out of mud. Your dimensions of the physical model need to be proportional to the blueprint and actual dimensions of the house. The roofs can be slanted or flat: choose whether the height will refer to the height at the peak or at lowest point. Suggested Materials: Clay, Play-Dough, Legos, Popsicle Sticks, Sugar cubes
Part 4: Culture Paper Each group will use the internet to research other countries that have predominately circular houses. Examples include Guinea, Lesotho, Kenya, and Zimbabwe. Students will then pick one of those countries and write a one page paper on the culture in that country. The paper can be on any aspect of culture and is very open-ended. Students will be graded on accuracy of information, correct citations, paper organization, and spelling.
Assessment Teacher will grade blueprint, physical model, and culture paper.
Applications of Culture in Mathematics NCCTM 2008
TEACHER NOTES/SOLUTIONS
Part 1: The teacher should use the notes provided in the students� introduction to review that material.
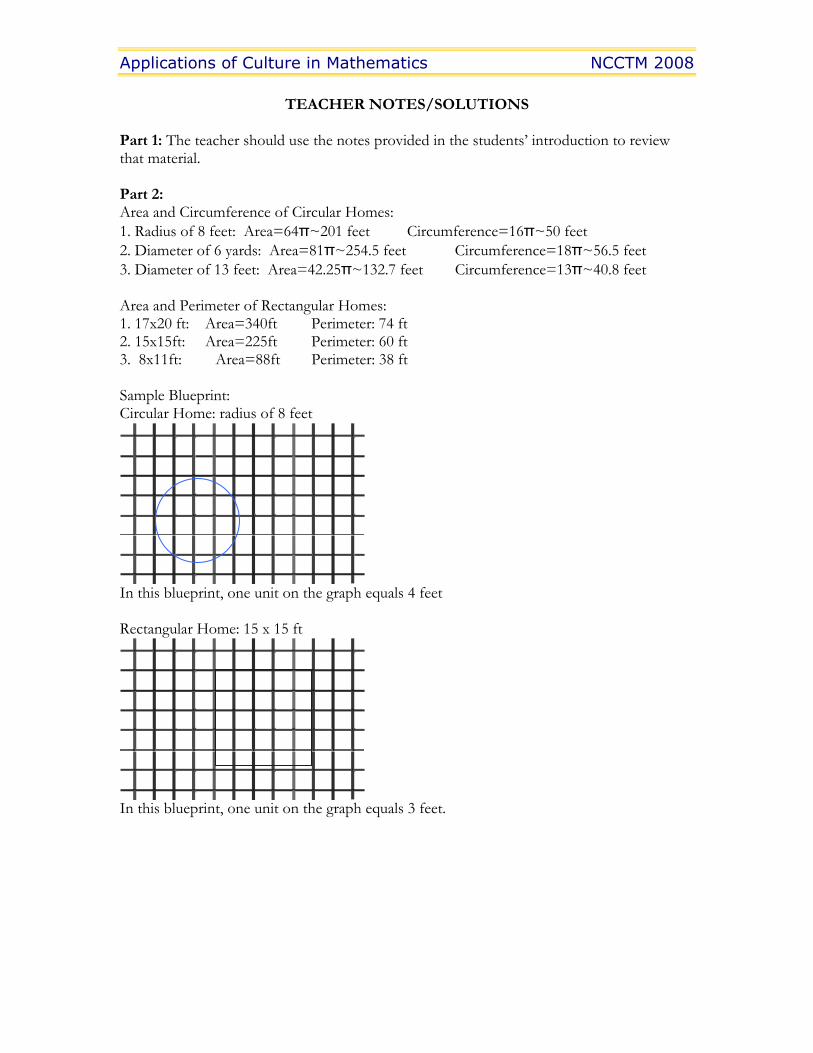
Part 2: Area and Circumference of Circular Homes: 1. Radius of 8 feet: Area=64π~201 feet Circumference=16π~50 feet 2. Diameter of 6 yards: Area=81π~254.5 feet Circumference=18π~56.5 feet 3. Diameter of 13 feet: Area=42.25π~132.7 feet Circumference=13π~40.8 feet
Area and Perimeter of Rectangular Homes: 1. 17x20 ft: Area=340ft Perimeter: 74 ft 2. 15x15ft: Area=225ft Perimeter: 60 ft 3. 8x11ft: Area=88ft Perimeter: 38 ft
Sample Blueprint: Circular Home: radius of 8 feet
In this blueprint, one unit on the graph equals 4 feet
Rectangular Home: 15 x 15 ft
In this blueprint, one unit on the graph equals 3 feet.

Applications of Culture in Mathematics NCCTM 2008
Rubric for Assessment:
It is possible to receive 100 points for this assignment. Number of Points 20 Correct blueprint of circular house (correctly drawn to scale) 20 Correct blueprint of rectangular house (correctly drawn to scale) 5 Correct area and circumference of circular house 5 Correct area and perimeter of rectangular house 20 Physical model is done to scale 20 Paper
• Accuracy of information in the paper (5 pts) • Correct Citations in paper (5 pts) • Solid organization of information in the paper (5 pts) • Correct spelling in the paper (f pts)
10 Partner Evaluation
Hint: Assign intermediate due dates for each part of the project.

Applications of Culture in Mathematics NCCTM 2008
Worksheet
Sketch blueprint of circular home:
Calculate circumference:
Calculate area:
Sketch blueprint of rectangular home:
Calculate perimeter:
Calculate area:

Applications of Culture in Mathematics NCCTM 2008
Matthew Smith Wake Forest University
TOPIC: Soccer, Currency, and a Global Market.
NCTM STANDARDS: Numbers and Operations, Algebra, Measurements, Data Analysis & Probability, Problem Solving, Reasoning, Connections, Communication
GOALS: Conversion exchange rates in global economy Use of line of best fit to model, analyze, and interpret real world situations
INTRODUCTION: Soccer or the sport more commonly known as football to the global community is not one of the major sports in the United States, but is one of the world’s most popular sports. 208 associations are recognized by Fédération Internationale de Football Association(FIFA or the world governing body of soccer)1 and a number of these 208 associations have domestic professional leagues. Unlike many United States professional leagues where players and draft picks are traded between teams, these European professional soccer leagues function in a system of transfer. In this system, an individual player may freely transfer to a new team when their contract ends, get loaned to another team by the professional team that pays his contract, or that player may be transferred in a trade of money. In this final exchange, a prospective team will offer the player’s current team a sum of money to transfer that player to the prospective team. This exchange of currency for players can often be difficult to understand when players transfer between different countries with different currency.
ACTIVITIES: • Part 1.
Introduction of Currency: Students will be given a handout called “Would you rather have…” Students will explore the concept of currency exchange rates in the global economy. Currency exchange rate can be found for by going to the currency converter website: http://www.xe.com/ucc/
• Part 2. Introduction of Soccer Transfer System: Students will investigate the top transfers of all time and practice converting them with exchange rates into US dollars and the players’ country of origin.
• Part 3. Incorporation of European Soccer: Students will combine their currency conversion knowledge and line of best fit to compare in US dollars spent on transfers and the record of the team the previous year. Students will pick either Premier League or La Liga to find the transfers for the league’s teams and the points record of those teams during the 2007-2008 season. Students will analyze their data plots and lines of best fit through a questionnaire.
1 http://www.fifa.com/aboutfifa/federation/associations.html

Applications of Culture in Mathematics NCCTM 2008
ASSESSMENT
Activity #3 RUBRIC
TASK POINTS DESCRIPTION
DATA TABLE 20 Students should have identified all 20 teams with their records and transfers in separate columns. Correct conversion of Euros to US dollars for all transfers.
DATA PLOT 20 Students should identify the axes and properly scaled the axes. Data plot should have a header identifying plot.
LINE OF BEST FIT 10 Line of best fit is correctly written as an equation and has been sketched on the data plot.
QUESTIONNAIRE 50 Correct responses to questionnaire. Partial credit may be given.

Applications of Culture in Mathematics NCCTM 2008
ACTIVITY #1.1:WOULD YOU RATHER HAVE …
Circle the amount of currency that you think is worth more.
1. 1 US Dollar or 10 Pesos
2. 1600 Yen or 15 US Dollars
3. 20 US Dollars or 20 Canadian Dollars
4. 20 Swiss Franc or 25 Euros
5. 5 British pounds or 40 Danish Kroner
6. 230 Yen or 30 Pesos
7. 200 Pesos or 8 British Pounds
8. 2 Euros or 2000 Italian Lira
9. 200 Spanish Pesetas or 10 Austrian Schillings
10. 5 Deutsch Marks or 300 Greek Drachmas
Applications of Culture in Mathematics NCCTM 2008
ACTIVITY #1.2: CURRENCY CONVERSION
1) How would you define the following terms (Write in space provided)
2) Go to http://www.xe.com/ucc/. Use the currency converter to investigate different relationships of world currency. Write down 3 of these relationships in the table provided.
X of Currency A = Y of Currency B
=
=
=
3) The specific definition of EXCHANGE RATE is the ratio (R) of your relationship for currency of one country (A) to another (B). Write this definition using fraction notation
Exchange Rate (R) = .
4) Solve for the exchange rates for each relationship in Question 2. Write the ratio and then solve for its decimal form rounded to 3 decimal places in each column.
Ratio
Decimal
CURRENCY:
CURRENCY EXCHANGE RATE:

Applications of Culture in Mathematics NCCTM 2008
ACTIVITY #2: Soccer Transfers
Soccer is a global sport where players not only change teams within their own leagues, but can even move to different country’s league. This creates a global economy based around soccer through the transfer system that soccer uses in the movement of players across borders of many countries that don’t share a common currency. Let’s use our knowledge of exchange rates to see how valued different soccer players have been when they transferred teams.
1) How do we use exchange rates to convert one country’s currency to another?
2) Choose 5 players from the transfer fee list at http://en.wikipedia.org/wiki/Football_transfer
3) You will use the values of the transfer fee in Euros (second column).
4) Convert each value to US dollars.
5) Click on each player to find out his country of origin. And then using http://www.xe.com/ucc/ find the exchange rate for Euros to the national currency.
6) For each of your five players, give the transfer fee in Euros, US dollars, and the national currency of his country. (Write in the Table Provided)
PLAYER EUROS US DOLLARS NATIONAL CURRENCY

Applications of Culture in Mathematics NCCTM 2008
ACTIVITY #3: Modeling European Soccer League Spending
You will choose either the English Premier League or Spanish La Liga to gather data about the 2007-2008 seasons. You will look up the 20 teams in each league, how many points did the teams accumulate during the season for their record and how much money did they spend in transfers. Every team play 38 games in a season and earns 3 points for a win, 1 point for a tie and 0 points for a loss. These values are used to calculate the points' record of a team during the league season.
ENGLISH PREMIER LEAGUE: • 2007-2008 Transfers:
http://www.soccernews.com/2007-2008-transfer-news/english-premier-league-transfers-2007-2008
• 2007 – 2008 Record by points: http://en.wikipedia.org/wiki/Premier_League_2007%E2%80%9308
SPANISH LA LIGA:• 2007 – 2008 Transfers:
http://www.soccernews.com/2007-2008-transfer-news/spanish-la-liga-transfers-2007-2008/
Notice not all teams have disclosed transfer fees. If they do not have complete data, you will want to leave them out.
• 2007 – 2008 Record by points: http://en.wikipedia.org/wiki/La_Liga_2007%E2%80%9308
• After the data has been collected, convert all transfer values into US dollars. • For each team, plot the amount of transfer spending (x) and the point record (y). • The x values will be represented by spending and y values will be represented by record
so that the line of best fit should predict how spending effects a teams record in league play.
• Plot the line of best fit to predict how spending effects a teams record in league play. • This may be done with the graphing calculator and graph link, or with an Excel
spreadsheet.

Applications of Culture in Mathematics NCCTM 2008
ACTIVITY #3. Part 2.
Answer the following questions, and submit with data tables, and complete graphs, which may be a printout or a sketch.
1) What is the range of spending by all teams in your league?
2) What is the range of points earned by all teams in your league?
3) Based on your data plot can you suggest any general trend between how much a team spends and how well that team should perform? State how you reached this thought?
4) How much money did the team that won your league spend PER point it earned?
5) How much money did the worst team in your league with transfers spent recorded spend PER point it earned?
6) What is the equation of the line of best fit?
7) If a team spent no money in transfer fees, then what record would you expect them to have?
8) Generally, for every million dollars a team spends in the transfer market, how many points do they expect to gain for their record?
9) How much would a team need to spend if they wanted to go undefeated? Does this value seem reasonable?
10) Based on your data plot and your line of best fit on top of it, how well do you think your model predicts how spending effects record? Write a few sentences describing how you reached this decision.
Applications of Culture in Mathematics NCCTM 2008
TEACHER NOTES/ SOLUTIONS:
Notes/ Solutions for Part 1:• All solutions for “What would you rather have…” are the first choices of the
paired options. • Specific definitions for Currency Conversion Question 1:
Currency is a unit of exchange, particularly you might be familiar with buying and selling goods, most commonly referred to as money. Currency Exchange Rates are ratios that can turn one form of currency to an equal amount in another.
Notes/ Solutions for Part 2:
Answers will vary based on players chosen.
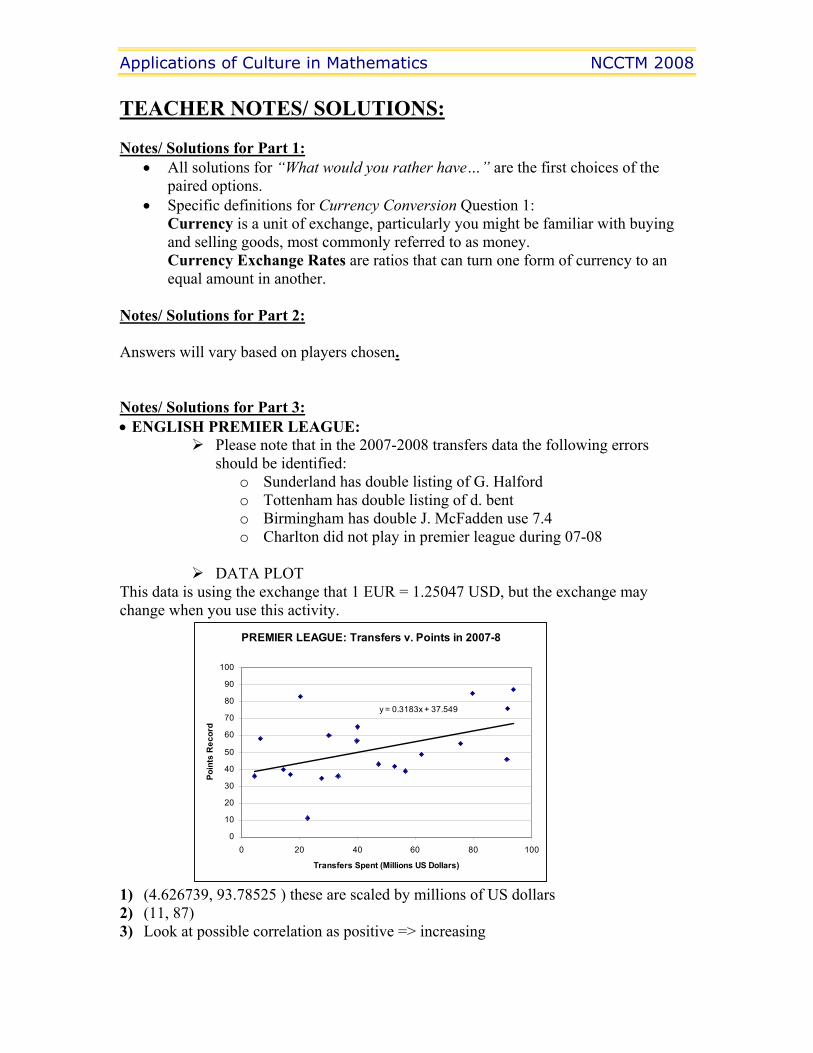
Notes/ Solutions for Part 3:• ENGLISH PREMIER LEAGUE:
Please note that in the 2007-2008 transfers data the following errors should be identified:
o Sunderland has double listing of G. Halford o Tottenham has double listing of d. bent o Birmingham has double J. McFadden use 7.4 o Charlton did not play in premier league during 07-08
DATA PLOT This data is using the exchange that 1 EUR = 1.25047 USD, but the exchange may change when you use this activity.
PREMIER LEAGUE: Transfers v. Points in 2007-8
y = 0.3183x + 37.549
0
10
20
30
40
50
60
70
80
90
100
0 20 40 60 80 100
Transfers Spent (Millions US Dollars)
Poin
ts R
ecor
d
1) (4.626739, 93.78525 ) these are scaled by millions of US dollars 2) (11, 87) 3) Look at possible correlation as positive => increasing
Applications of Culture in Mathematics NCCTM 2008
4) $1,077,991.38 5) $2,091,695.27 6) y = 0.3183x + 37.549 7) Y-Intercept of Line of Best Fit8) Slope of Line of Best Fit9) Let 38*3 = 0.3183x + 37.549. 10) Consider correlation OR difference of observed v. predicted values OR line’s distance
to data points
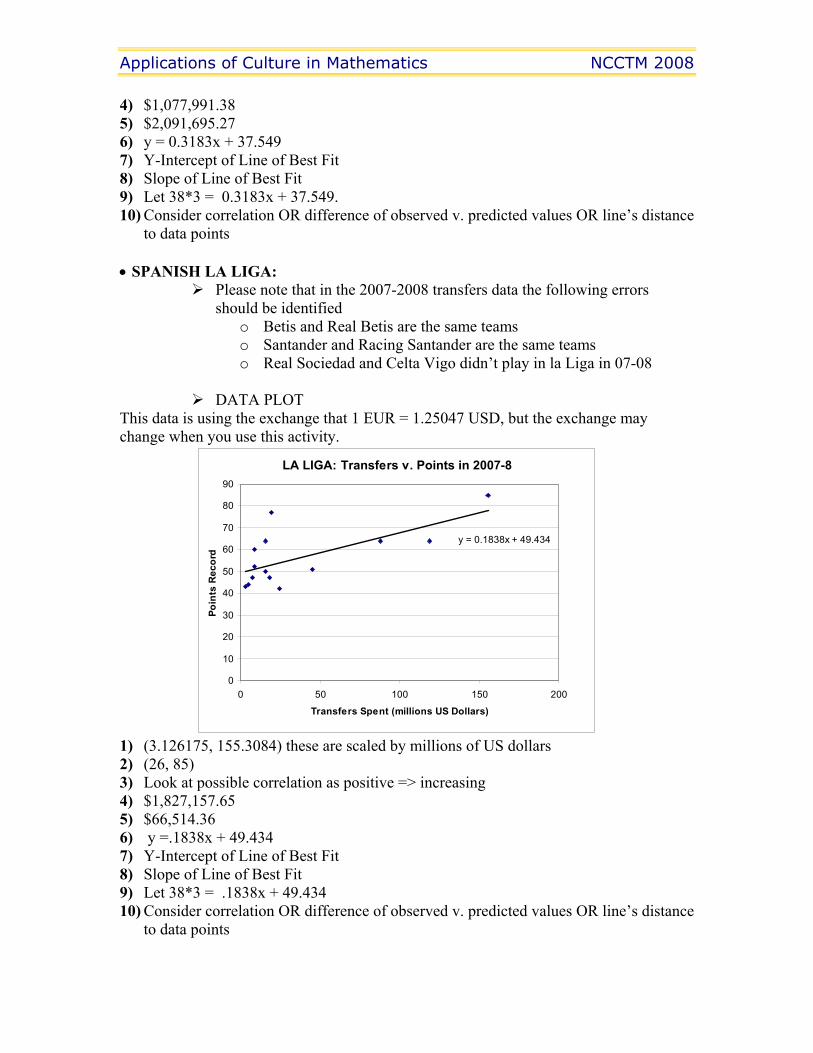
• SPANISH LA LIGA: Please note that in the 2007-2008 transfers data the following errors
should be identified o Betis and Real Betis are the same teams o Santander and Racing Santander are the same teams o Real Sociedad and Celta Vigo didn’t play in la Liga in 07-08
DATA PLOT This data is using the exchange that 1 EUR = 1.25047 USD, but the exchange may change when you use this activity.
LA LIGA: Transfers v. Points in 2007-8
y = 0.1838x + 49.434
0
10
20
30
40
50
60
70
80
90
0 50 100 150 200
Transfers Spent (millions US Dollars)
Poin
ts R
ecor
d
1) (3.126175, 155.3084) these are scaled by millions of US dollars 2) (26, 85) 3) Look at possible correlation as positive => increasing 4) $1,827,157.65 5) $66,514.36 6) y =.1838x + 49.434 7) Y-Intercept of Line of Best Fit8) Slope of Line of Best Fit9) Let 38*3 = .1838x + 49.434 10) Consider correlation OR difference of observed v. predicted values OR line’s distance
to data points