Embed Size (px)
Citation preview
1
Chapter 6
Applications of Meteorology to Agriculture
This Chapter was rewritten and coordinated by Robert Stefanski with contributions from
T. Rusakova, Z.Shostak, E.Zoidze, Simone Orlandini, and Nick Holden.
An internal review was undertaken by
Simone Orlandini and Nick Holden.
The Chapter was externally reviewed by
Terry Gillespie, Paulo Caramori and Hilton Pinto
2
6.1 Introduction
The application of meteorology to agriculture is essential, since every facet of agricultural activity depends on the weather. This chapter cites many examples of the utility of applied meteorology in order to make users aware of the potential benefits that farmers can gain to improve efficiency and ensure sustainability of their farm management, to protect and ensure the continuing health of their crops, livestock, and environment, to increase their yield and market value of their crops and to solve selected operational problems. Other agricultural decision makers derive benefit from agrometeorological applications such as government policy makers in ensuring adequate food supplies, affordable food prices for their consumers, sufficient farm income for their farmers, and reducing the impact of agricultural practices on the environment. Decision makers in international agricultural organizations also use applications of meteorology to ensure food security and to react to potential famine situations. At any level, these objectives can only be achieved through active co-operation between National Meteorological and Hydrological Services (NMHSs), agricultural extension services, farmers and their associations, agricultural research institutes, universities, and industry.
The topics given in this chapter were based on a classification of applications of micrometeorology to various agricultural problems given by WMO Technical Note 119 (1972). They are grouped according to the general type of problem, namely, improving production; averting dangers to production; physiology and growth; strategy; and tactics. These topics continued to be relevant for this edition of the Guide and only subtopics have modified depending on recent applications. The physiology and growth topics are covered in Chapter 13.
The main objective of the chapter is give to brief overviews and examples of applications at the local or farmer level. However, there are also important applications that will be discussed at the government or international organization level. In selecting the examples of applications of meteorology to agriculture, priority has been given to those that are used operationally. Also, an attempt has been made to cite examples for the different climates and regions of the world.
6.1.1 Users of agrometeorological information
The successful application of weather and climate information needs to integrate three components: data, analysis, and users, therefore, the ultimate goal of any application is to serve the needs of the users. A solid foundation of data is a prerequisite for successful agricultural meteorological applications (see Chapters 1 and 2). Then an analysis of these data is needed that tries to solve or address an agricultural problem. These analyses are described in this guide. Ultimately the users of agrometerological information and applications must be kept in mind when developing new applications. The user can be defined as any agricultural decision maker such as a farmer, extension agent, government official, media person, or the general public. Rijks and Baradas (2000) provide an overview of clients (users) of agrometeorological information. They discuss who the clients are, what do they require, what products agrometeorological services can offer, approaching clients, and assessing the value the product.
6.1.2 Temporal and spatial scales of agrometeorological information and applications Agrometeorological information and applications can be considered in temporal and spatial contexts. In a temporal context, strategic applications are defined as those aiding in issues and decisions that are assessed on a seasonal or yearly basis or only once such as in a planning process. These applications aid in the planning process whether the decision is choosing a specific crop variety to plant, whether an area should be exploited for forage products and livestock, help in designing and planning where or if greenhouses or animal shelters should be built, or aiding governments in setting agricultural pricing polices. Such decisions can be based on climatological analyses, agroclimatic information, and using complex soil-plant-atmospheric models. Tactical applications are considered to be short-term operational decisions relating to a period ranging from
3
a few hours to a few days. These often involve decisions, based on the state of the crop and current or forecast weather, for such farm operations as cultivating, irrigating, spraying, and harvesting. Holden and Ortiz (2003) provide a good description of macroclimate and mesoclimate in the context of agrometerological applications. Macroclimate is the largest and covers broad areas of a continent (millions of square kilometers) and deals with the interaction of large-scale topography (mountain ranges, large lakes, and ocean influences) with air masses. At this scale, climate characteristics should provide information on the suitability of a farm and whether the farm could be weather limited by pest, disease, and operational timing problems. Mesoclimate reflects the farmer’s view of the weather experienced in a region. Local surface features such as hills, small mountains, large forests, or extensive plains have a distinct effect at this scale. A country may have one or two macroclimate zones, but it will have many mesoclimates. It is at this scale that specific calculations can be made to define agroclimatic regions. At the smallest scale, Rosenberg et al (1983) defines microclimate as the climate near the ground, or in other words, the climate in which most much plants and animals live. In regards to meteorology, WMO (1972) regarded micrometeorology as dealing with the physical processes taking place within the boundary layers between the top of the plant, tree, or animal and the bottom of the roots of the soil. Most of the applications in this chapter are based on micrometeorological principles. The monograph by Gordeev et al (2006) presents the results of assessing the bioclimatic potential in Russia, the surrounding states, Europe and USA. Particular attention is given to the account of climatic and agroclimatic peculiarities in these territories when solving some social and economic problems.
6.1.3 Benefits derived from applications
Many benefits result from the application of meteorological services to agriculture. The productivity of a region or of a particular enterprise may be increased by the reduction of many kinds of loss resulting from unfavourable climate and weather, and also by the more rational use of labour and equipment. Greater economy of effort is achieved on the farm, largely by the reduction of activities that have little value or are potentially harmful. All of these increase the competitiveness of production, reduce risk and help to reduce the cost of the final products.
In the developed world, a significant portion of recent work in agricultural meteorology has shifted from increasing yields to reducing the environmental impact of agricultural fertilizer and pesticide use and combating pests and diseases. In the developing world, much of the focus remains on increasing agricultural production but there is also an emphasis on sustainable agricultural production and reducing the impact the pest and diseases (i.e. desert locusts). The following are brief examples of economic benefits of agrometeorological applications from Rijks and Baradas (2000). In Sudan, precise calculations of water requirements for the main irrigated crops (cotton, sorghum, and groundnut) were compared with available irrigation water to allow for more accurate estimates of potential irrigated wheat area. The net result was an additional 8000 ha of wheat grown that added more than US$ 2 million to the national economy at a cost of few thousand dollars for data, analysis, and staff. In the Gambia, groundnuts are stored in the open air and if the dry pods are wetted they are at high risk of developing aflatoxin that can reduce farmer prices for the crop by 60%. By providing forecasts of rainfall to warn farmers via local radio, farmers can cover the crop with plastic sheeting. It is estimated that for each percent of production saved, the benefit is US$ 60,000. In the Sahel, bush fires are common every year but the bush vegetation is needed for cattle and sheep grazing. By using wind, temperature, and humidity observations to indicate speed and direction of the fire, control burning can take place to prevent the fires from spreading. Reducing the burned area on 1% of the grazing land allows 5000 more sheep to graze or an annual value of US$100,000 added to national economy. Rijks (1992)
4
provided a framework for analyzing costs and benefits of agrometeorological applications in plant protection.
The results of studying the peculiarities of climate and weather conditions to optimize various cultural practices (i.e., determination of an advisable structure of areas under crops, dates and ways of soil treatment, optimum periods and doses of fertilizing) aimed at increased productivity of plant growing in Russia can be found in several papers by Fedoseev (1979, 1985). The economic efficiency of applied agrometeorological recommendations is given.
Other examples can be found in Omar (1980) and from a conference on the economic benefits of meteorological and hydrological services (WMO, 1994),
6.2 Applications for governments or other large administrative bodies
Government or other large administrative bodies need quality and reliable assessments for operational assessments of agricultural production. In regards to planning, this would involve questions of what kind of crops could the country economically produce and where would they grow them. These kinds of planning questions can be answered by macro and mesoscale agroclimatic surveys.
6.2.1 Operational Assessments
There are several examples of operational assessments of crop production that countries and international agencies carry out. These examples highlight the utility and need of integrating of data, staff, and resources to produce reliable crop production assessments among different agencies at a country level and among different countries, NGO’s, and other organizations at an international level. Boken et. al. (2005) provides many examples of successful drought monitoring and crop monitoring applications at these levels.
The Food and Agriculture Organization of the United Nations (FAO) established the Global Information and Early Warning System (GIEWS) in 1975 in response to the global food crisis of the early 1970’s. GIEWS provides information on food production and food security for every country based on crop monitoring assessments that involve remote sensing and ground-based weather station data (Mukhala, 2005). A number of these assessments are based on the FAO Crop Water Requirement Satisfaction Index (WRSI) model that determines a cumulative water balance for 10 day period from planting to maturity. WRSI is a combination of dynamic water balance and statistical approaches and the index represents at any time of the growing season the ratio between the actual and potential evaporation. The World Agricultural Outlook Board (WAOB) of the The United States Department of Agriculture (USDA) is mandated to provide official monthly U.S. government forecasts of agricultural commodities through the World Agricultural Supply and Demand Estimates (WASDE) publication (Motha and Stefanski, 2006). These supply and demand estimates are based on official country reports, US embassy reports, travel reports of USDA personnel, economic analysis, remote sensing information, and of course global weather information. USDA meteorologists routinely collect, monitor, and analyze global weather and agricultural information conditions to determine the impact of growing season weather conditions on crops and livestock production prospects. These activites are supported by meteorologists from the U.S. National Weather Service who are located within WAOB offices to serve the agricultural community (Puterbaugh, et al. 1997; Motha and Heddinghaus 1986). Rusakova et al. (2006) describes the application of an automated Russian forecasting system which allows to present the information about observed weather conditions, state of crops, crop yield forecast and the total harvest in the regions of Russia. Comprehensive application of climatic and weather information at the governmental level as well as in a concrete field management is demonstrated with the help of a developed Russian information-advising system meant for solving
5
some practical problems of planning and organization of agricultural production (Zhukov et. al. 1989). In Brazil, there are several centers generating daily updated agrometeorological information to support decision making, including Agritempo (www.agritempo.gov.br), that provides information for the whole country, and regional centers such as Cepagri/Unicamp (www.cpa.unicamp.br) and IAC (www.ciiagro.iac.sp.gov.br) for the state of Sao Paulo, IAPAR/SIMEPAR (www.iapar.br/sma) for the state of Parana and Ciram (www.chlimerh.rct.sc.br) for the state of Santa Catarina. Cooperatives of farmers also have been providing agrometeorological information to their farmers and field technicians (eg. www.fundacaoabc.org.br) (Pinto, 2007). Other examples include Famine Early Warning System or FEWS (Rowland et. al., 2005), the European Union’s Monitoring Agriculture with Remore Sensing (Negre, 2006), the National Agricultural Monitoring System in Australia (Leedman, 2007) and the Farmweather service (Baier, 2004) and agrometeorological services in Kazakhstan (Baier, 2004).
6.2.2 Agroclimatic surveys
Concerning macroscale agroclimatic surveys, the joint inter-agency project on agroclimatology between FAO, WMO, and UNESCO has been very successful in producing 5 publications and is the foundation of current agroclimatic zoning studies. The most important practical applications of macroclimatic surveys include: choosing crops, varieties and domestic animals; determining favourable periods for sowing, hay-making and harvesting; establishing areas where dry-land farming is possible and where irrigation has to be applied; planning afforestation and re-afforestation; finding the optimum range of climatic variables for increasing yields and agricultural production in general; establishing potentials for the agricultural use of rangelands; and determining requirements and potentialities for efficient storage and transportation of crops.
The agroclimatology in the semi-arid and arid zones of the Near East focused on the estimation of the boundary areas where dry-land farming is possible and where irrigation is needed. (Perrin de Brichambaut and Wallén, 1963). The agroclimatology of semi-arid areas in West Africa dealt with dry-land farming in West Africa and length of the growing seasons that is strictly associated the rainy season (Cochemé and Franquin, 1967). The agroclimatology of the highlands of eastern Africa focused on which crop water requirements were met in the various localities of the this area (Brown and Cochemé, 1973). The agroclimatology of the Andes looked at the unique effects of high elevation and high solar radiation input on crops (Frère et. al, 1978). The study of the agroclimatology survey of the humid tropics of South-east Asia. (Oldeman and Frère, 1982) illustrated the role of agroclimatology in determining strategies to increase food production in the humid tropics. 6.2.3 Mesoscale agroclimatic surveys With the advent of widespread computing capability (personal computers) and Geographic Information Systems (GIS), climatic and agroclimatic mapping has become widespread. There are been many examples of using these methods for climatological and agroclimatic analyses. The European Union sponsored COST Action 719 on the Use of Geographic Information Systems in climatology and meteorology which has provided several examples of these agroclimatic mapping methods including temperature mapping, climate parameter mapping in mountainous areas, and an agro-ecological decision system (Dyras and Wilhelmi 2005). The Parameter-Elevation Regression on Independent Slopes Model (PRISM) has been used to map daily weather and climatic parameters in mountainous areas (Hunter and Meetemeyer 2005; Daly et al 1994). Zoidze and Ovcharenko (2000) assessed the agricultural potential of climate in the territory of Russia and some its regions for each crop based on general indices of heat and water supply, radiation regime, unfavourable agroclimatic phenomena, soil fertility and relief essential to develop strategic and tactical agricultural policies in different regions, and as well as measures to optimize environmental conditions.
6
Motroni (2002) focused on the development of a methodology to assess climatic and agroclimatic risks. Land capability was classified for Sardinia by using climate, geographic and soil data. A climatic risk index was computed based on 30 year averages of climatic data. Petr (1991) described a mesoscale agroclimatic classification scheme for Czechoslovakia based on a hydrothermic coefficient, HTC = R / (0.1TS10) where R is the rainfall sum in millimeters and TS10 is the degree-days above 10 oC. Such an approach could be used with any degree-day base temperature and adapted for specific crops. In Brazil, there have been recent nationwide efforts in agroclimatic risk zoning for agricultural crops that characterizes the potential and climatic risks for several crops, including maize, soybeans, beans, wheat, barley, rice, cotton, coffee, cassava and different species of fruits (Pinto, 2007). The recommendations are used by the Brazilian Government to provide financing to the farmers at very low rates. Furthermore, those who follow the recommendation of the agricultural zoning can contract official insurance at special rates. To be eligible for the bank credit, the farmers must also adopt the best agronomical practices recommended by the extension service. These efforts combined with farmers using optimum planting dates has increased the productivity of Brazilian agriculture (Pinto, 2007). 6.3 Applications for farmers or groups of farmers 6.3.1 Improvements to production
As stated in the introduction, the original topics were based on a classification of application of micrometeorology to various agricultural problems in WMO Technical Note 119 (1972).
6.3.1.1 Irrigation
In its broadest terms, irrigation involves water balance calculations based on rainfall, estimation of water infiltration (effective rainfall), runoff, evapotranspiration (ET), and soil moisture. For soil moisture, there are several reliable direct measurements such as manual gravimetric and neutron probe for routine application in agricultural practice (see Chapter 2) and indirect measurements based on remotely sensed information (see Chapter 12). Early irrigation and soil moisture applications can be found in HMSO (1967), Baier and Robertson (1965), Rider (1958), and Stanhill et al (1968). Over the years there has been a large amount of work related to irrigation, especially measuring and estimating evapotranspiration. A number of textbooks provide good overviews on this subject including Rosenberg et al (1983).
Smith (2000) gives an overview of the widely accepted practical procedures that have been developed by FAO and others to estimate crop water requirements and yield response to water stress. The methodologies of crop water requirements were first published in 1974 as FAO Irrigation and Drainage Paper 24 and revised in 1977 (Doorenbos and Pruit, 1977). A review and update of the methodologies are contained in FAO Irrigation and Drainage Paper No. 56 Crop Evaporation (Allen et al., 1998). These methodologies use the Penman-Monteith equation that estimates daily reference crop evapotranspiration (mm/day) based on net radiation, soil heat flux, average air temperature, wind speed, vapor pressure deficit, and other humidity parameters. The two publications listed above give details on estimating all these parameters based on weather and climate data and when data sources are limited. The FAO CROPWAT software program incorporates these methodologies and procedures to simulate crop water use under various climate, crop, and soil conditions. This software is available from FAO at http://www.fao.org/landandwater/aglw/cropwat.stm. Lomas (2000) describes several operational applications to increase the water use efficiency including an irrigation advisory system in Israel calculated based on a modified Penman potential ET equation. Molendijk (2000) describes the Irrigation Planner that has been developed into a
7
computer software application irrigation of grassland in the Netherlands. Results show that using the system can reduce irrigation water by 15-20%. Kroes (2005) provides on overview of the Soil-Water-Atmosphere-Plant (SWAP) model that integrates water flow, solute transport, and crop growth. The SWAP model can be used at the local scale by farmers and extension agents for irrigation demand, potentials, and strategies and at the regional level by policy makers for spatial and sectoral irrigation strategies. Venäläinen et al (2005) used numerical weather forecast model data to model soil moisture for input into irrigation models. Potential evaporation was calculated using the Penman-Monteith equation based on data from high resolution limited area model. The data were input into the AMBAV and SWAP irrigation models. 6.3.1.2 Shelter from the wind
WMO Technical Note No. 59 and Chapter 9 of Rosenberg et al (1983) deals comprehensively with windbreaks and shelterbelts and Van Eimem (1968) discussed problems of shelter planning. Grace (1977, as cited by Rosenberg) provides an overview on the direct influences of wind on plant growth.
Rosenberg et al (1983) defines windbreaks as structures that reduce wind speed and shelterbelts as rows of trees planted for wind protection. Both of these can reduce physiological stresses due to wind on plants and animals. They reviewed the literature and found that shelter effects on the microclimate are the following: reduced potential and actual evapotranspiration; improved internal plant water relations (greater internal water potential and lower stomatal resistance), improved opportunity for photosynthesis, and finally shelter generally increases yield. These generalities are subject to variation depending on soil moisture and the benefits may be most dramatic in dry years or under critical moisture shortages. Examples of widespread use of windbreak include the Great Plains in the US after the Dust Bowl years in the 1930s (Rosenberg et al, 1983); the Rhone Valley in southeastern France, and the Netherlands (Van Eimem, 1968). Marshall (1967) has reviewed the literature on the effect of shelter on the productivity of grasslands and field crops, and showed how the proportional decrease of windspeed with distance from the shelter corresponds with a decrease in evaporation. Nighttime temperature decrease, relative humidity, daytime air and soil temperature increase vary with distance from the barrier but decline to no effect at a distance of about 12 times the height of the shelter. In conjunction with these parameters, the greatest soil moisture availability and crop yield are found in the zone at a distance of 2 to 4 times the height of the shelter. Windbreaks reduce of force of the wind in the sheltered zone. Van Eimern et al (1964) show that a dense barrier may protect an area about 10-15 times the height downwind and by increasing the porosity to about 50%, the downwind influence can be increased to 20-25 times the height. Rosenberg et al (1983) state that for the best wind reduction and greatest downwind influence the windbreak should be most porous near the ground and the density of the barrier should increase logarithmically with height in accordance with wind speed profile. Wind reduction is a function of shelter location as well as the height above the plants. Questions of orientation and spacing of shelter can be regarded as meteorological applications, particularly if mesoclimatic wind surveys are used in advance. 6.3.1.3 Shade Shelters of various types can also be used to provide shade from the sun; a well-known example is the use of taller growing "shade trees" to protect cacao, coffee or tea plants. Camargo and Pereira (1994) state that as coffee originally developed as an understory shrub in the rain forests of central Africa, it might be assumed that shading or arborization of coffee trees is a well defined cultural practice. However, there has been much discussion on the validity of this practice. Most of the commercial crop in Brazil is unshaded, while it is a common practice in
8
Colombia, Costa Rica, Salvador, Guatemala, Uganda, Tanzania, and in the higher elevation areas of northeastern Brazil. In most of Brazil, an unshaded crop facilitates the harvesting and natural ground drying of the crop as the microclimate is sunnier hence warmer and drier. In most places, coffee berries are hand picked at the cherry stage and if this stage is extended it provides for an easier and longer harvest period. Therefore, shading can be advantageous since it increases the cherry stage of the crop because the microclimate is cooler and moist which slows the maturation process. Shading also aids in maintaining high soil organic matter. Camargo and Pereira (1994) also cite several characteristics of good shading trees and several other advantages and disadvantages. Shelters may also be used to reduce production losses from lactating dairy cows because of the heat load during the summer (Hahn and McQuigg, 1970). 6.3.1.4 Greenhouses (Glass and plastic) Greenhouses have been used in temperate climates for over 100 years and serve mainly to reduce heat loss and permit complete control over the watering of plants. Recently, CO2 enrichment of the atmosphere has become an additional technique in greenhouse cultivation. A detailed discussion on greenhouses is presented in Seeman (1974) and in Holden and Ortiz (, 2003). Holden and Ortiz (2003) give many benefits derived from indoor agriculture (greenhouses): protection against damage by UV light; improved ambient temperature conditions; protection of crops from adverse climatic conditions; increased productivity; reduced production costs; controllable harvest and better product quality. They also list several climate elements that must be managed for good performance from greenhouses. The covering of the greenhouse is important in regards to visible light transmission for plant photosynthesis. Knowledge of the climatology solar radiation, cloudiness, relative humidity, temperature and wind profiles of a greenhouse site are important. In regards to the construction material, most greenhouses covering are made of glass, fibreglass, and plastic while plastic agricultural tunnels are less widely used (Holden and Ortiz, 2003). In order to choose the best covering suitable for a geographical location, the maximum, minimum and average temperatures, the possibility of frost, the climatology of the wind and relative humidity, rainfall distribution and intensity, solar radiation, and specific crops need to be taken into account. A climatological analysis of the solar radiation, temperature and relative humidity is important for siting greenhouses. These parameters will determine how much internal environmental control will be needed for optimum plant growth depending on the plants grown. Wind speed and direction are very important factors when designing a greenhouse. High winds could damage the structure or coverings. Wind is also used in simple greenhouse designs to maintain the thermal balance by reducing energy costs for heating or cooling. Wind ventilation can be used for balancing internal temperatures by air circulation, reducing relative humidity, crop pollination, and replenishing carbon dioxide and removing oxygen for plant photosynthesis.
For some crops the degree of control is such that firm advice can be given on the optimum temperatures for different growth stages (e.g. tomatoes); it is possible to differentiate between the environmental temperatures that should be maintained during the day and during the night. This knowledge has led to the design of "blueprints" for the production of certain crops. There is scope for further assistance by meteorologists on research into environmental control. Practical help can also be given at the advisory level, as far greenhouse siting, design, and fuel consumption. Meteorological factors are probably most useful in siting greenhouses. In analyzing possible greenhouse sites, standard radiation data can be adjusted for latitude and mean cloudiness to give an estimate of the radiation input (and therefore plant growth) at each location. Such factors as shelter and radiation must be balanced; highly exposed sites are undesirable because of extra fuel consumption and the risk of physical damage. In regards to fuel consumption, if a crop requires the temperature to be kept at a given level, the quantity of fuel needed can be calculated from the number of degree-days below that temperature.
9
6.3.1.5 Ground cover (Mulching)
Soil mulches of various kinds (i.e. straw cover or artificial materials such as plastics) are used to modify the heat and moisture balance in the soil to benefit the plants. Davies (1975) provides a good overview of the effects of mulching on plant climate and yield and states that mulches are particularly useful in conversing moisture, reducing temperature extremes, and minimizing erosion. Chapter 6 of Rosenberg et al (1983) provides several examples of various mulches used with different crops. Camargo and Pereira (1994) list the following advantages of grass straw mulching with the coffee crop in Kenya: protects the soil from excessive heating that destroys the soil structure, lowers temperatures that result in lower evaporation rates, provides organic matter to the soil, reduces soil erosion from heavy rainfalls; and minimizes weeds. They also cite studies that indicate that mulching can reduce the frequency of irrigation. On the negative side, mulching requires a large amount of grass, and more importantly, straw mulches can aggravate frost problems as the air temperature above the mulch is much warmer during the day and cooler at night. The mulch also prevents the ground from absorbing heat during the day, which is subsequently released during the night. Studies on the effect of straw mulching on air temperatures indicate that at 5cm above the ground the maximum temperature was 6.6 C higher and the minimum was 1.7 C lower than the bare ground Camargo and Pereira (1994). Gurnah and Mutea (1982; cited from Camargo and Pereira) tested different plastic coverings on the soil temperature and concluded that on areas subject to frost, transparent plastic should be used and elsewhere white plastic should be used since it responds approximately to the same thermal regime as bare soil. 6.3.1.6 Animal housing Meteorological data are required when assessing whether and how animal housing should be put into use. Evaluation should also take into account the potential economic returns, energy cost, and availability (Starr, 1980). Animal housing is undertaken because of the thermal imbalance results in adverse effects on animal productivity. Weather and climate can determine the efficiency of livestock production by direct and indirect influences (Starr, 1980). Direct influences affect the heat balance of the animal and includes extreme meteorological events. Indirect influences are disease and parasites. Excessive heat or cold increases the metabolic energy required to maintain the animal’s body temperature thus reducing the energy available for productivity. This energy imbalance is usually corrected by increased feed, which is an increased cost to the farmer. The use of climatological data and analysis is useful in this case. Starr (1980) provides many examples of using weather and climate information in application of animal housing. He mentions that siting, external wind, temperature, and humidity affect both entry conditions and influencing patterns of internal air movement in environmentally controlled housing. Smith (1964 a, b, c) has shown the importance of the ventilation rate in animal housing, and how it may be estimated by a psychrometric method simple enough to be applied on a farm scale. The siting of animal shelters is also important, particularly in relation to other shelters, as alternating positive and suction pressures may result from nearby obstructions. 6.3.1.7 Storage For some crops, storage is as important as production and weather may affect the quality of the food product and may modify the storage environment causing loss of product and economic value. 6.3.1.7.1 Fruit and Vegetables WMO (1963) states that the storage life of fruit is terminated by the onset of rotting caused by specific fungi, physiological diseases, and senescent breakdown. The rate of development of these storage disorders is determined by storage conditions such as temperature, concentration of CO2 and oxygen and by pre-storage treatments. Porteous (1996) states that the maturity of the apple
10
fruit has a major impact on the quality of fruit during storage and that there have been many studies on modelling apple maturity using climatic data. Pashairdis (1990) states that monitoring of the storage environment and weather forecasts are used in many countries to determine the optimum conditions for potato tubers. In the former Czechoslovakia, humidity and temperature data (the mean number of hours exceeding the limits of 3 oC, 7 oC, and 10 oC during the winter months) were used for the design and construction of large potato storage facilities. Friesland (2002) reviewed the scientific literature on the quality and storage of grapes and potatoes. He cites the most important meteorological parameters for grape quality as temperature and solar radiation and lists several quality models for these crops. Potato storage quality is determined by evaporation, transpiration, respiration, and germination. 6.3.1.7.2 Grain
Smith and Cough (1990) have revised the previous WMO Technical Note on this subject. Agrometeorology can provide guidance for the construction of grain storage based on local climate modification and environmental control. Stored grain interacts with its environment exchanging heat and moisture. The level of biological activity of grain and potentially damaging organisms must be minimized. For safe storage, grain must be kept cool and dry, requirements that are affected both by the characteristics of the building or structure for housing and by the external environment. Heat uptake from outside must be minimized while heat loss from storage must be maximized. The moisture exchange between the grain and the external environment should generally lead to a reduction in grain moisture content. When hot dry grain must be cooled to prevent insect infection, the resulting moisture increase must be kept to an acceptable level.
The siting of storage facilities and their design and construction materials can all be influenced by meteorological factors. For example, in hot dry regions with no refrigeration, there are advantages to storage facilities of high thermal capacity, with air space ventilated at night when the air is coolest. In warm wet regions with small diurnal temperature ranges, good storage may be difficult to design. Meteorological factors become more important to the farmer when natural air grain drying systems are used. In the state of Ohio in the US, for example, best results of shelled corn occur when the climatic conditions provide temperatures in the range of -1 to 10 C and relative humidities in the range of 60 to 70% (Hansen et al, 1990). In most western Ohio counties, October and November provide high probabilities for good climatic conditions for natural-air drying of soybeans and shelled corn. There is also an impact of weather conditions due to rainfall before storage that can be important. High temperature and rain that occurs shortly before harvest are the most important direct weather effects on spring barley quality (Freisland, 2002). 6.3.2 Averting dangers to production
These dangers may be the direct result of weather (e.g. frost) or they may be indirect and carried by biological agents that are affected by the weather (e.g. pests and diseases which attack plants and animals). 6.3.2.1 Direct weather hazards
6.3.2.1.1 Frost
The occurrence of frost has been studied in detail by many agrometeorologists mainly because of its economic effect on high-value crops, and because some crops can be protected. Some examples were taken from WMO (1963) and Hurst and Rumney (1971) in the previous edition of this chapter. Bagdonas et al (1978), Rosenberg et al (1983), and Brunetti (1997), Synder and
11
Paulo de Melo-Abreu (2005) provide more recent overviews and examples of protection against frost damage.
Frost-risk maps, dates of first and last frost are a simple but useful applications of climate data applied to agriculture. These maps are made at the macro to mesoscale and are useful for specifying general planting dates for cereal crops and assessment of crop damage when combined with phenological data.
6.3.2.1.1.1 Sites
Assessment of potential sites for frost-sensitive crops is crucial, since it will discourage growers from planting in frost-areas especially for high-value crops such as fruit tree and coffee crops. Topoclimatology and local-scale agroclimatic zoning are important tools and methodologies in this regard. An early overview of concepts and some examples are given in (MacHattie and Schnelle, 1974). Gat et al (1997) describes agrotopoclimatology as being concerned with the local differences in climate arising from topography, soil, and vegetation within a uniform macroclimatic zone (this was defined earlier in this chapter as being mesoclimate). They show some examples of using topoclimatological analysis in developing probability of frost occurrence maps over complex terrain. With the increase in availability and speed of personal computers in recent years, these types of applications have increased. (See Chapter 12, GIS applications). One example uses an spatial interpolation methods to determine the spring frost hazard in the hilly areas of French vineyards based on digital elevation data and weather station (Madelin and Beltrando 2005).
6.3.2.1.1.2 Protection against frost damage
Rosenburg et. al. (1983) describes two kinds of frosts that can impact crops and therefore need to have different protection techniques. Advection frost usually occurs during or after a change in airmass, and is accompanying by strong winds (cold front). The number of protection techniques against this kind of frost is limited. Radiation frost occurs under the influence of a high-pressure system and typically the winds associated with this kind of frost are very light. They list the following frost protection methods: site selection, radiation interception, thermal insulation, air mixing, direct convective air heating, radiant heating, release of the heat fusion, and soil manipulation. Most of these methods are only effective against radiation frosts but some can be applicable to both.
Bagdonas (1978) describes many direct or active and indirect or passive frost protection methods taken from mostly Russian and European sources. Direct methods of frost protection include: protective covers; smoke generation and artificial fogs; open-air heating of plants and areas; irrigation and sprinkling; and mixing air. Indirect methods include: biological methods such as hardening, seed treatment, selection of frost-hardy strains, development of new frost-hardy varieties, and regulation of bud development and ecological methods such as control of mineral nutrition and crop site selection. Synder et al (2005) list many recommended methods of passive and active frost protection along with detailed practical overviews of each method. They list recommended passive methods such as site selection, managing cold air drainage, plant selection, canopy trees, plant nutrition management, pest management, pruning, plant and soil covers, soil cultivation, irrigation, removal of cover crops, trunk wraps and painting, and bacterial control. Recommended active methods of frost protection include the use of heaters, wind machines, helicopters, various types of sprinklers, surface irrigation, foam insulation, and some combination of these methods. They also review of critical temperatures for annual, biennial, perennial crops, fruit and citrus trees, grapes, and other small fruits. A companion volume details several practical EXCEL spreadsheets that help users to compute the probability of temperatures falling below critical temperatues (TempRisk.xls), the risk of frost damage specific to a crop (DEST.xls), and the to determine the economic risk of frost damage protection (FrostEcon.xls).
12
6.3.2.1.2 Hail
Hail can destroy high-value crops within a short time and many countries have therefore sought to reduce its frequency or to reduce the damage that it causes. Hurst and Rumney (1971) give a short summary of the protection methods that involve adding condensation nuclei to hail-forming clouds, by means of missiles or aircraft, with the object of producing small hailstones or soft hail.
Large reductions of hail have been claimed by a number of groups. According to the Commission on Atmospheric Science, the weight of scientific evidence to date is inconclusive, neither affirming nor denying the efficacy of hail suppression activities. It is recommended that interested parties consult the WMO Statement on the Status of Weather Modification for further information. 6.3.2.2 Indirect weather hazards 6.3.2.2.1 Introduction to Crop and Animal Pest/Diseases
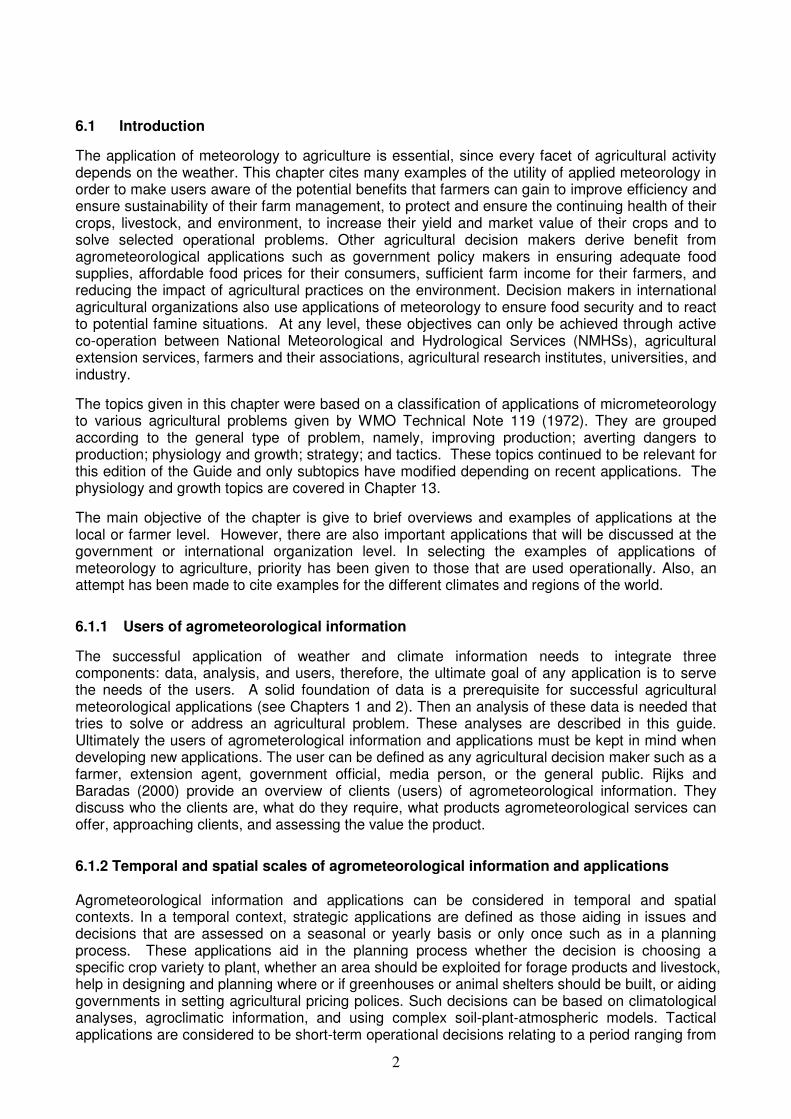
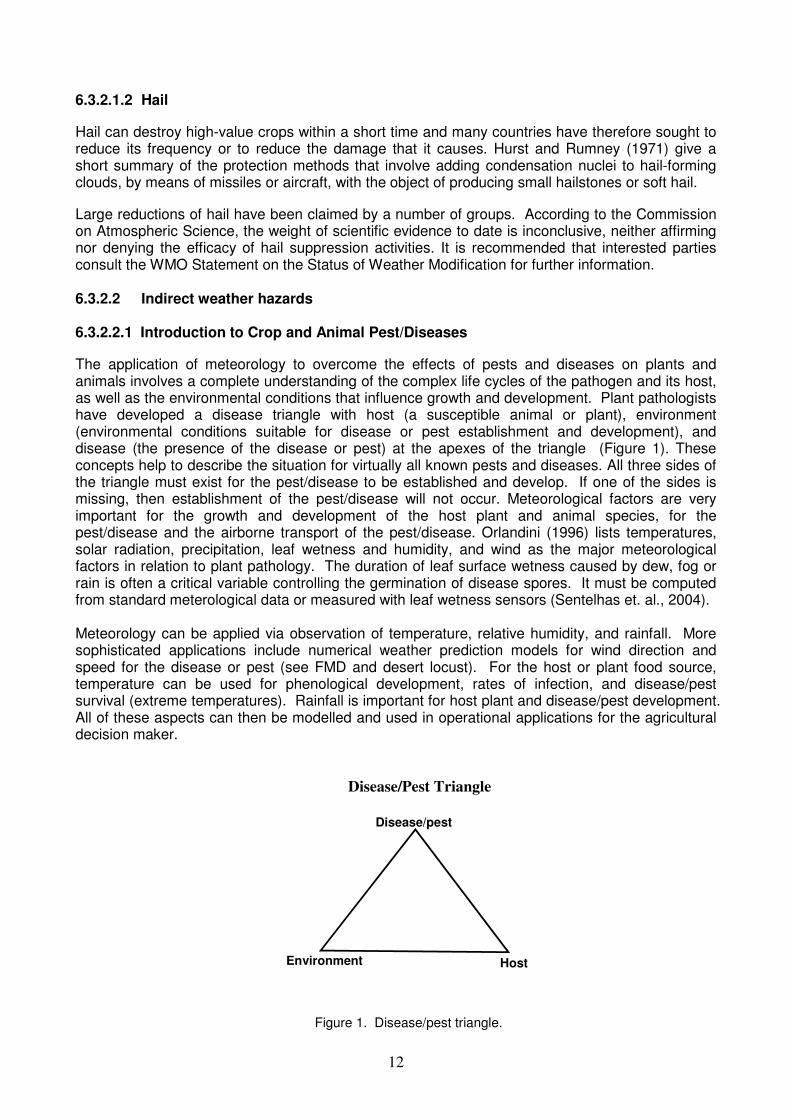
The application of meteorology to overcome the effects of pests and diseases on plants and animals involves a complete understanding of the complex life cycles of the pathogen and its host, as well as the environmental conditions that influence growth and development. Plant pathologists have developed a disease triangle with host (a susceptible animal or plant), environment (environmental conditions suitable for disease or pest establishment and development), and disease (the presence of the disease or pest) at the apexes of the triangle (Figure 1). These concepts help to describe the situation for virtually all known pests and diseases. All three sides of the triangle must exist for the pest/disease to be established and develop. If one of the sides is missing, then establishment of the pest/disease will not occur. Meteorological factors are very important for the growth and development of the host plant and animal species, for the pest/disease and the airborne transport of the pest/disease. Orlandini (1996) lists temperatures, solar radiation, precipitation, leaf wetness and humidity, and wind as the major meteorological factors in relation to plant pathology. The duration of leaf surface wetness caused by dew, fog or rain is often a critical variable controlling the germination of disease spores. It must be computed from standard meterological data or measured with leaf wetness sensors (Sentelhas et. al., 2004). Meteorology can be applied via observation of temperature, relative humidity, and rainfall. More sophisticated applications include numerical weather prediction models for wind direction and speed for the disease or pest (see FMD and desert locust). For the host or plant food source, temperature can be used for phenological development, rates of infection, and disease/pest survival (extreme temperatures). Rainfall is important for host plant and disease/pest development. All of these aspects can then be modelled and used in operational applications for the agricultural decision maker.
Disease/Pest Triangle
Disease/pest
HostEnvironment
Figure 1. Disease/pest triangle.
13
One important use of weather and climate information is in the field of Integrated Pest Management (IPM). IPM strategies include not using chemical unless there is economic damage to the crop. There have been numerous studies and models on the influence of temperature on plant and insect growth and development. Pruess (1983) gives an overview of degree-day methods for pest management. WMO Technical Note 192 provides many examples of agrometeorological aspects of operational crop protection including plant diseases, insect pests, weeds, meteorological data requirements, and application of weather forecasts. Das (1997) provides a brief overview of the meteorological factors related to vegetable pests and diseases. Pedgley (1982) provides a good overview of the meteorology of windborne pests and diseases with some examples. Sections of the book deal with weather at take-off, organisms staying airborne, downwind drift, insect flight within and above the boundary layer, swarms, dispersion and concentrations, and forecasting.
6.3.2.2.2 Crop pests
There are many applications of the meteorology applied to crop pests. By using the concepts related to the pest/disease triangle, applications focus on using temperatures to predict insect development and host plant development. Any additional weather parameters can than be added depending on the nature of crop pest.
6.3.2.2.2.1 Desert locust
There has been much work on weather and desert locusts. Early studies include meteorology and desert locust migration (Rainey, 1963) and the accompanying training seminars (WMO, 1963). Later work focused on meteorology for locust control (WMO, 1991; Sadi, 1992; Ambar, 1992; Pedgely, 1997).
Pedgely (1997) gives a good overview of the meteorological factors for locust control. Rainfall large determines the extent and intensity of breeding therefore is the most important factor in the development of an outbreak or plague. Rainfall location is more important than actual amounts and this is where satellite rainfall estimates are particularly useful. Once there is a significant rainfall event (25 mm or more during a month or two), the tender grass vegetation in the desert starts to grow which is the main food source for desert locusts. It is these abnormal rainfall events that can trigger locust outbreaks and plagues. There have been cases in the Arabian peninsula where a landfalling tropical cyclone has spurred a locust outbreak, e.g. in 1969. Temperature affects the rate of development of all stages of the desert locust life cycle. Since this pest is native to hot desert climates, temperatures gain in importance typically when swarm takeoff is needed on a daily basis or when the desert locust migrates outside the desert climates. Likewise, wind direction and speed are need for swarm flight and for tactical spraying applications from aircraft or the ground.
The biological activity of desert locusts determines the kind of weather data needed over a given period of time. The desert locust is normally a solitary insect and does not threaten crops and food security. This is called the recession period and rainfall data are needed to determine where locust control personnel are to scout for locust activity. During a desert locust outbreak or plague, the type and amount of meteorological information increases to include daily temperatures and forecasts of temperature, rainfall, and especially important wind forecasts. Recently, more attention has been given to high-resolution regional numerical weather prediction models.
6.3.2.2.2.2 Other Crop pests WMO Technical Note No. 41 was prepared for the European and Mediterranean Plant Protection Organization to delineate the areas where the climate is suitable for the permanent settlement of the Japanese Beetle in Europe. Most of the life of the beetle is spent beneath the ground as a grub. The appropriate environmental model therefore takes account of summer rainfall (as a substitute for soil moisture) and summer and winter soil temperatures. Volvach (1987) describes the model
14
used to consider the effect of agrometeorological conditions on principal characteristics of the Colorado beetle activity – duration of development, reproduction, and death of individuals. The preliminary amount of chemical treatments of potato is calculated based on the forecasted intensity of the Colorado beetle reproduction, then it is corrected with the account of observed weather conditions. There have been many studies relating meteorological factors with important crop pests such as the cotton leaf worm and pink bollworm (Omar 1980), the Colorado Potato Beetle (Hurst 1975), various pests of sugarcane (Biswas 1988), and cassava mites Nyiira (1980). 6.3.2.2.3 Crop diseases
The application of meteorology as an aid to the farmer in combating plant disease differs according to the mechanisms by which each pathogen is spread. The pathogen may be a year-round resident which increases and spreads whenever the weather is suitable for itself and the host plant, e.g. the fungal disease, potato blight. In some areas a pathogen may not be capable of surviving the year, and may not reappear unless transported in sufficient quantity from a distant source, e.g. black wheat rust. In recent years, the development of crop disease models has focused on the high-economic value crops such as fruit trees, vineyards, and vegetables since the models need meteorological observation in the field settings that usually require the establishment of automatic weather stations.
6.3.2.2.3.1 Potato Blight
There are two approaches available for the forecasting of late blight with a view to limiting agrochemical use compared to 7 and 10 day routine spraying:
(1) Simple meteorological rules related to the life cycle of Phytophthora infestans that use rainfall, temperature and humidity over 12-48 hr periods to predict spore production (“critical periods”) and possibly subsequent periods when risk of infection is greatest. These methods can be used with either hourly observation data or with synoptic weather maps;
(2) Computer based decision support systems (DSS), usually utilising the simple rules that rely on data from in-field automatic weather stations or available as digital files from (usually) Internet sources.
The rules (Table 1) differ only in detail and require some regional or site-specific calibration. Mercer et al (2004) indicate that ideal conditions for spore production are relative humidity >95% and temperature >10OC at nightime, and for serious infection to occur, free water must be available on the crop surface so rainfall and prolonged high relative humidity are also required after spore production. Simple rule based methods predict critical periods from late spring until late summer using the following general rules:
(a) Minimum temperature >10 OC for a period of between 12 to 48 hours
(b) Relative humidity >90% for the same time period
(c) Rainfall in the period following (4 hours to 10 days later)
Evidence of disease is expected between 7 to 21 days after a critical period has been predicted and a suitable crop protection strategy can be put in place. If possible, prediction should be based on hourly observation of temperature and relative humidity. Synoptic maps can be used (particularly where observations are sparse) to make predictions based on the likelihood of current and forecast weather systems causing suitable conditions for a critical period to occur (e.g. passage of warm, moist tropical air giving rise to high humidity and temperature; slow moving depressions giving rise to overcast, humid, rainy conditions, Bourke, 1955; Bourke, 1957).
DSS systems (Table 2) typically require site-specific automatic weather station data but can be interfaced to alternative data sources (Hansen, 1999). The systems automate the use of the simple rule based methods and usually provide spray strategy recommendations as well.
15
6.3.2.2.3.2 Wheat Diseases
WMO Technical Note 99 (WMO, 1969) provides an overview of the various wheat rusts that occur around the world and the meteorological factors that the transport of spore and disease outbreaks for various types of wheat rusts.
Seghi et al (2000) provide a survey of many crop disease models including several on wheat. They describe EPIPRE as a system devised to support decision making in pest and disease control in winter wheat with the aim of reducing pesticide use. The system integrates six fungal diseases and three aphid pests of wheat. Spirouil-Epure was developed in France and has been used for many years to support extension services for brown wheat rust. The model uses meteorological data along with some agronomic and phenological data and provides advice on the dates for first fungicide application within micro-regions and well-defined crop zones.
6.3.2.2.3.3 Apple Scab Apple scab is caused by the fungi Venturia inaequalis and is an economically important disease for apple producers. Post et. al (1963) provided one of first overviews of the disease, investigations in various countries and descriptions of the early warning systems. More recently in Germany, the apple scab model ASCHORF was developed and can provide practical recommendations to plant protection services and apple growers (Freisland, 2005). The modelled infection risk is dependant on temperature and leaf wetness duration. Leaf wetness duration is calculated but not measured and is based on energy balance principles. The model uses a sliding 10-day time series by inputing data for the previous four days from the standard meteorological network and then inputting grid point data from numerical weather prediction models.
6.3.2.2.3.4 Downy Mildew Downy mildew (Plasmopara vitcola) is one of the most important fungal diseases for wine grapes (Vitis vinifera) and can lead to considerable losses in grape yield and quality. Friesland et al (2005) developed the PERO model that calculates the start of infection of the grapevine disease Peronospora that is determined by temperature and leaf wetness. The PERO model is based on laboratory and field experiments and the inputs are hourly air temperature, relative humidity, calculated leaf wetness, daily extreme temperatures, and daily rainfall. The model outputs are infection dates and oilspot balances (lesions) that are used for agrometeorological advice. The PLASMO (Plasmopora Simulation Model) model was developed to simulate the biological cycle and the disease leaf area of grapevine downy mildew allowing for the best timing for fungicide treatments (Orlandini et al 2005). Data inputs are hourly temperature, relative humidity, rainfall and leaf wetness. The results are expressed in percentage of leaf area covered by oilspot lesion. The PLASMO model has been developed into computer program for distribution and is also available on the internet for greater access. Weather data can be uploaded to the model website for running of the model (Rossi, et al, 2005). 6.3.2.2.3.5 Other Applications Norway has developed a web-based site-specific warning system called VIPS that calculates warnings for several pests and diseases in selected fruits, vegetables, and cereals (Folkedal and Brevig, 2005). The warnings are linked to over 70 weather stations and a color coding of warnings ranging from danger (red) to no danger (green) are given for each county for the previous five days and are forecasting for the upcoming five days. VIPS incorporates previous work done in Norway on pests and diseases such as NORPRE (Magnus et. al., 1991). NORPRE is a cereal disease and pest control system that uses daily weather data as input to number of different submodels. The system uses field observations of pest disease occurrence from farmers to validate the models and adjust threshold values. The system includes the following pest models: cabbage moth, turnip moth, carrot fly, and codling fly (Leskinen 2000). There have been many surveys of crop disease models undertaken over the years. Seghi et al (2000) produced a survey focused on fungal pathogens and lists 58 crops and 133 pathogens.
16
6.3.2.2.4 Animal Pests/Diseases
The approach of the meteorologist to problems of animal disease is basically the same as for plant disease. Smith (1970) provides a good overview of practical links between weather and animal disease that may be wind-borne, parasitic, fungal or the result of environmental or nutritional stress. More recent reviews include WMO (1989) and Starr (1980) that detail internal animal parasites and cold and hot weather stress. Starr (1980) states that there are two lines of enquiry in using climate information as a measure of disease incidence. The first uses climatic factors to develop climatic indices known to influence the development of the animal parasite during its life-cycle outside the animal. The second uses biological development rates, calculated from the study of parasites under laboratory conditions in constant temperature chambers to determine the influence of temperature variation on parasite development in actual field conditions. Besides the animal diseases listed below for which meteorological applications have been developed, Starr (1980) also provides information on nematodiriasis and parasitic gastro-enteritis (Starr, 1980)
6.3.2.2.4.1 Foot and Mouth Disease
The 1968-69 FMD epidemic in the UK led to research that concluded meteorological factors account for the majority of the virus spreading during a foot and mouth outbreak (Smith and Hugh-Jones, 1969; Wright, 1969). The virus is spread by being exhaled by animals as the nuclei of water droplets, and then being dispersed by winds. The most important meteorological factors are wind, humidity and rainfall; the synoptic situation will determine to some degree the distance over which the virus can spread. Wind speed and direction will determine the pattern of dispersion of the virus. Stable atmospheric conditions favour dispersion over large distances because vertical distribution is minimised, while high winds and turbulence usually reduce the transport range. Humidity will determine the duration that the virus remains protected by its water droplet. Maximum infectivity is associated with relative humidity >60% (Murphy et al, 2004). Rainfall will influence when the virus is deposited from the atmosphere. In rainy conditions the virus will be deposited on herbage within short distances of the source rather than moving to infect other animals.
The more recent 2001 UK epidemic has resulted in the development, utilisation and testing of models for predicting the spread of virus based on (a) the predicted viral load at a source location; (b) the predicted spread due to surface weather conditions (Gloster et al, 2003; Mikkelsen et al, 2003; McGrath and Finkle, 2001); and (c) latitude and topography. McGrath and Finkle (2001) noted that older models depended on synoptic observations and thus suffered error due to potential remoteness of observation stations from outbreak sources. Mikkelsen et al (2003) tested four dispersion models: (1) 10 km Gaussian Plume (Gloster et al, 1981); (2) Nuclear Accident Model (NAME, Ryall and Maryon, 1998); (3) RIsø Mesoscale PUFF model (RIMPUFF, Mikkelsen et al, 1984); and (4) Danish Emergency Response Model of the Atmosphere (DERMA, Sørensen, 1998). NAME and DERMA are long range models driven by numerical weather prediction (NWP) output, and produced similar results despite being driven by different NWP models. The local-scale models, driven by nearby observation data, were also used to analyse local infection. It was concluded that 24 hr average virus concentrations do not adequately represent infection risk, rather short-term high concentration levels are needed to account for the pattern of infection that was observed (Gloster et al, 2003).
For local-scale prediction the most important observation/NWP output is 10 m wind speed, estimates of three-dimensional dispersion, the relative humidity and the chance of rainfall occurring. For regional scale modelling, 1 to 3 hour NWP output are preferred and should include wind speed, wind direction, relative humidity, cloud cover and precipitation.
6.3.2.2.4.2 Facial eczema of sheep
A warning system for this fungal disease was devised in New Zealand (Robertson, 1963, 1968). Even before a definite link was established between the disease and fungus present in grass, soil temperatures and rainfall were used for warning. High humidities and ambient temperatures in the 21-27 C range are favourable for the spores and the discovery of the fungus reinforced the
17
empirical approach. Spore traps and counts are now being used to confirm the meteorological evidence.
6.3.2.2.4.3 Fascioliasis in sheep
Fascioliasis (common called liver fluke disease) is a parasitic disease caused by Fasciola hepatica that affects sheep. The complicated life-cycle consists of infected sheep passing fluke eggs in dung that hatch into free-swimming larva in the open pasture and infect the fluke's intermediate host, a snail, Lymnea trunculata. This is the most sensitive stage of the life cycle. The larvre will die if they cannot enter a snail within 24 hours. Ollernshaw (1966) describes a wetness index (Mt) based on monthly rainfall, potential transpiration, and the number of rain days that was developed in England and Wales. The index is acculumated over a season, and based on comparison with historical disease statistics, thresholds for treatments can be established. Part I of Gibson (1978) provides an updated and very through overview of using weather information in the various models and methods of this disease in Europe and states that the most important meteorological factors in the development of Fasciola hepatica are temperatures above 10 C for the development of the parasite inside the snail host and the presence of free water. Starr (1980) also lists several analytical and simulation models that predict parasite populations in pasture and in the host. He sites the use of analytical models for strategic disease control policies and simulation models for tactical control procedures.In Part II of Gibson (1978), there are several examples of using weather information to study and/or model nematodiriassis in sheep, tapeworms, ticks, and nematodes.
6.4 Other applications
There are many other applications of meteorology for agriculture besides those already mentioned. They are covered in other chapters in detail because of their importance. One important group relates to the physiology and growth of plants, from germination to final yield. These are affected somewhat by the applications already dealt with, for example, irrigation, shelter, cover and disease. Other applications can be cited, including the use of degree-days or other indices to determine the phenological stages of crops such as flowering, reproduction, and maturity. These stages are very important for pest/disease management. Typically, growing-degree-day or heat-unit calculations are made by subtracting a threshold temperature from the average daily temperature and then accumulating these units over time to model plant and insect development. The simplest form on a daily basis is: Degree-day = [ (Tmax + Tmin)/2] – Tbase. Robertson (1983) describes these calculations as temperature-remainder models (TRIM) and provides an extensive overview of the various methodologies to calculate crop development. See Chapters (5 and 13) for a more detailed overview of these concepts. Another group of applications concerns field operations. Since cultivation, drilling, spraying and harvesting are all highly weather-dependent, the meteorologist can give considerable help in assessing the probability of weather suitable for these operations, which may greatly affect the requirements for labour and machinery. Fedoseev (1979) showed that lodging results in a significant crop yield drop (to 20-30%), degradation of grain and straw quality, makes harvesting difficult. Operation of harvesting units in case of lodged crops is extremely difficult and their efficiency decreases by 25-50% that results in prolongation of harvesting. But even in case of observance of optimum terms of harvesting the grain loss is 10-25%. Biological losses depending on the terms of lodging are 5-10 to 40% on the average. In all applications meant for the farmer it is of the utmost importance that the meteorologist should work closely with the biological or husbandry experts on individual problems.
18
References Allen, R. Pereira, L.A., Raes, D., Smith, M. 1998. Crop Evapotranspiration. FAO Irrigation and
Drainage Paper 56. FAO, Rome, Italy. 294 pp.
Ambar, B. 1992. La Météorologie au service de la lutte anti-acridienne. CAgM Report 53. WMO/TD-No. 527.
Bagdonas, A., Georg, J.C., and Gerber, J.F. 1978. Techniques of Frost Prediction and Methods of Frost and Cold Protection. WMO Technical Note 157. WMO No 487. WMO. Geneva, Switzerland.
Baier, W. and Robertson, G. W., 1965: Estimation of latent evaporation from simple weather
observations. Can. 1. Plant Sci., 45, pp. 276-284. Baier, W. 2004. Experts for Collection of Case Studies of Economically Beneficial
Agrometeorological Applications and Services and Other Success Stories in Agrometeorology for Policy Matters, by W. Baier. CAgM Report 93. WMO/TD No. 1202.
Beaumount, A. (1947). The dependence on weather of the dates of potato blight epidemics. Transactions of the British Mycological Society 31, 45 - 53.
Biswas, B.C. 1988. Agroclimatology of the sugarcane crop. Technical note 193. WMO No 703. Boken, V.K, Cracknell, A.P. and R.L. Heathcote. Eds.2005. Monitoring and Predicting Agricultural
Drought: A Global Study. Eds. Oxford University Press. New York, New York.
Bouma, E. and Hansen, J.G. (1999). Overview of standard descriptions of Phytophthora Decision Support Systems In: Proceedings of the workshop on the European Network for development of an integrated control strategy of potato blight. Uppsala, Sweden, 4th – 13th September 1998. (Eds, H. Schepers and E. Bouma) Pub. Applied Research for Arable Farming and Field Production of Vegetables, Lelystad, Netherlands.
Bourke, P.M.A. (1955). The forecasting from weather data of potato blight and other plant diseases and pests. WMO Technical Note 10. WMO No. 42. TP 16.
Bourke, P. M. A. (1957). The use of synoptic weather maps in potato blight epidemiology. Technical Note No. 23. Meteorological Service, Glasnevin, Dublin 9, Ireland (now Met Éireann).
Brown, L.H. and Cochemé, J. 1973. A study of the agroclimatology of the highlands of eastern Africa. WMO Technical Note No. 125. FAO/UNESCO/WMO Interagency Project on Agroclimatology. WMO Publication No. 339. Geneva, Switzerland.
Brunetti, A. 1997. Methods and techniques for microscale modification to avoid or reduce losses in
agricultural production. In CagM Report 74. Weather/Climate and Sustainable Agricultural Production and Protection. WMO T/D No. 838, WMO. Geneva, Switzerland.
Cochemé, J, and Franquin, P. 1967. An agroclimatology survey of a semi-aird areas in Africa south of the Sahara. WMO Technical Note No. 86. FAO/UNESCO/WMO Interagency Project on Agroclimatology. WMO Publication No. 210. Geneva, Switzerland.
Das, H.P. 1997. Definition of agrometeorological information required for vegetable crops. CAgM
report 75. WMO TD 866. Davies, J.W. 1975. Mulching Effects on Plant Climate and Yield. WMO Technical Note 136. WMO
Pub 388.
19
Doorenbos, J. and Pruitt, W.O. 1977. Guidelines for predicting crop water requirments. FAO Irrigation and Drainage Paper 24 Revised. FAO, Rome, Italy. 156 pp.
Everdingen, E. van (1926). Het verband tusschen de weergesteldheid en de aardappelziekte (P. infestans). Tijdschrift Plantenziekten 32, 129 – 140.
Fedoseev A. P. 1979. Field management and weather. Leningrad. Hydrometeoizdat. 240 pp. Fedoseev A. P. 1985. Agrometeorological conditions for the effectiveness of fertilization. Leningrad,
Hydrometeoizdat, 144 pp. Folkedal, A. and C. Brevig. 2005. VIPS – A web-based decision support system for crop protection
in Norway. In Irrigation and pest and disease models: Evaluation in different environments and web-based applications. Eds. G. Maracchi, L. Kajfez-Bogataj, S. Orlandini, F. Rossi, and M Barazutti. European Commission. Cost Action 718: Meteorological Applications for Agriculture. p. 157-163.
Forsund, E. (1983). Late blight forecasting in Norway 1957-1980. EPPO Bullitin 13, 255-258
Frère, M., Rijks, J. Q., and Rea, J. 1978. Estudio agroclimatológico de la zona andina. WMO Technical Note No. 161. FAO/UNESCO/WMO Interagency Project on Agroclimatology. WMO Publication No. 506. Geneva, Switzerland.
Friesland H. 2002. Review of the Scientific literature on the effect of climate and weather,
especially during the ripening period, on the quality and storage capacity of grapes, spring barley, and potatoes. In Report of RA VI Working Group on Agricultural meteorology. WMO/TD 1113.
Friesland, H. 2005. Description and testing of the model ASCHORF for Apple scab infections. In
Irrigation and pest and disease models: Evaluation in different environments and web-based applications. Eds. G. Maracchi, L. Kajfez-Bogataj, S. Orlandini, F. Rossi, and M Barazutti. European Commission. Cost Action 718: Meteorological Applications for Agriculture. p 103-113.
Friesland, H., S. Orlandini, and A. Susnik. 2005. Description and testing of the model PERO for
grapevine Downy Mildew Predictions. In Irrigation and pest and disease models: Evaluation in different environments and web-based applications. Eds. G. Maracchi, L. Kajfez-Bogataj, S. Orlandini, F. Rossi, and M Barazutti. European Commission. Cost Action 718: Meteorological Applications for Agriculture. p. 127-139.
Gat, Z., Erner, Y, and Goldschmidt, E.E.. 1997. The Effect of Temperature of the Citrus Crop.
WMO Technical Note 198. WMO No 840. WMO. Geneva, Switzerland. Gibson, T.E. 1978. Weather and Parasitic Animal Disease. WMO Technical Note 159. WMO No.
497. WMO, Geneva, Switzerland.
Gloster, J., Blackall, R. M., Sellers, R. F., and Donaldson, A. I.1981, Forecasting the airborne spread of foot-and-mouth disease. Veterinary Record 110, 47–52.
Gloster J, Champion HJ, Sorensen JH, Mikkelsen T, Ryall DB, Astrup P, Alexandersen S, Donaldson AI (2003). Airborne transmission of foot-and-mouth disease virus from Burnside Farm, Heddonon-the-Wall, Northumberland, during the 2001 epidemic in the United Kingdom. Veterinary Record 152, 525-533
Gordeev A. V., Kleschenko A. D., Chernyakov B. �
. and Sirotenko �. D. 2006. Bioclimatic potential of Russia: Theory and practice. Moscow Ed. Gordeev A. V., 509 pp.
Hahn, D. and McQuigg, J.D., 1970: Evaluation of climatological records for rational planning of
livestock shelters. Agric. Meteorol., 7, pp. 131-141.
20
Hansen, J. G. (1999). NegFry 99, A decision support system for scheduling the chemical control of potato late blight. User Manual. I Danish Institute of Agricultural Sciences, Dept. of Agricultural Systems, Research Centre Foulum, 8830 Tjele, Denmark.
Hansen, R.C., Keener, H.M. and Gustafson, R.J. 1990. Natural Air Grain Drying in Ohio. Ohio
State University Extension Factsheet. AEX-202-90. HMSO, 1967: Potential transpiration. Min. Agric. Fish Food Tech., Bull. No. 16, London. Hogg, W.
H., 1967: Atlas of long-term irrigation needsfor England and Wales. Min. Agric. Fish Food, London.
Holden, N.M. and M.C. Ortiz. 2003. Agrometeorological aspects of organic agriculture, urban
agriculture, indoor agriculture, and precision agriculture. CAgM Report No. 90. WMO/TD No. 1158. WMO, Geneva, Switzerland.
Hurst, G.W. (1975) WMO Technical Note 137. Meteorology and the Colorado Potato Beetle.
WMO 391. Hurst, G.W. and Rumney, R.P. 1971. Protection of Plants against adverse weather. WMO
Technical Note 118. WMO No 281. WMO. Geneva, Switzerland.
Hyre, R. A. (1954). Progress in forecasting late blight of potato and tomato. Plant Disease Reporter 38, 245-253.
Johnson, D. A., Alldredge, J. R. and Vakoch, D. L. (1996). Potato late blight forecasting models for the semiarid environment of south-central Washington. Phytopathology 86, 480-484.
Keane, T. (1982). Weather and Potato Blight. Agrometeorological Memorandum No. 8. Meteorological Service, Glasnevin, Dublin 9. Ireland (now Met Éireann).
Kroes, J.G. 2005. An introduction to the SWAP model. In Irrigation and pest and disease models:
Evaluation in different environments and web-based applications. Eds. G. Maracchi, L. Kajfez-Bogataj, S. Orlandini, F. Rossi, and M Barazutti. European Commission. Cost Action 718: Meteorological Applications for Agriculture. p 1-8.
Leedman, A. 2007. The Australian National Agricultural Monitoring System – a national climate risk
management application. Proceedings of the Expert Team Meeting on Management of Natural and Environmental Resources for Sustainable Agricultural Development, February 13-17, 2006, Portland, Oregon, USA. Washington, D.C., USA: United States Department of Agriculture; Geneva, Switzerland, World Meteorological Organization. To be Published.
Leskinen, L. 2000. An Outlook to the models, forecasting methods and information systems used
for plant protection against pests. In Report of the RA VI Working Group on Agricultural Meteorology. CAgM No. 82. WMO/TD No. 1022. WMO, Geneva, Switzerland.
Lomas, J. 2000. Operational applications of agrometeorological information to increase the
efficiency of water and energy uses. In Report of the RA VI Working Group on Agricultural Meteorology. CAgM No. 82. WMO/TD No. 1022. WMO, Geneva, Switzerland.
MacHattie, L.B. and F. Schnelle. 1974. An Introduction to Agrotopoclimatology. WMO Technical Note 133. WMO No. 378. WMO, Geneva, Switzerland.
Madelin, M. and G. Beltrando. 2005. Spatial interpolation-based mapping of the spring forst hazard in the Champagne vineyards. Meteorol. Appl. 12 51-56. Magno, R., Crisci, A, Genesio, L. 2006. Climate analysis for the assessment of vulnerability to
desertification in Mediterranean environment. Proceedings of the Workshop on Climatic
21
Analysis and Mapping in Agriculture held in Bologna, Italy from 14-16 June 2005. To be Published.
Magnus, H.A., Munthe, K., Sundheim, E., and Ligaarden, A. 1991. PC-technology in plant
protection warning systems in Norway. Danish Journal of Plant and Soil Science, 85 (S-2161): 1-6.
Marshall, J. K., 1967: The effect of shelter on the productivity of grasslands and field crops. Field
Crop Abs., 20, pp. 1-14.
McGrath, R and Finkle, K. (2001). HIRLAM Foot-and-mouth disease dispersion model. Hirlam Progress Report 21, Met Éireann, Glasnevin, Dublin 9, Ireland.
Mercer, P. C., Bell, A., Cooke, L. R., Dowley, L., Dunne, B., Keane, T., Kennedy T. and Leonard, R.. (2001). Crop and animal disease forecasting and control – regional perspectives. Chapter 7 in N. M. Holden (editor) Agro-meteorological Modelling – Principles, Data and Applications. Agmet, Dublin.
Mikkelsen, T., Larsen, S. E., and Thykier-Nielsen, S. 1984. Description of the Risø puff diffusion model. Nuclear Technology 67, 56–65.
Mikkelsen, T. Alexandersen, S, Astrup, P, Champion, H. J, Donaldson, A. I., Dunkerley, F. N, Gloster, J., Sørensen, J. H., and Thykier-Nielsen, S. (2003). Investigation of airborne foot-and-mouth disease virus transmission during low-wind conditions in the early phase of the UK 2001 epidemic. Atmospheric Chemistry and Physics 3, 2101-2110.
Molendijk, M. 2000. The Irrigation Planner: A management instrument for irrigation of grassland in
the Netherlands. In Report of the RA VI Working Group on Agricultural Meteorology. CAgM No. 82. WMO/TD No. 1022. WMO, Geneva, Switzerland.
Motroni A., Duce P., Spano D. and Canu S. 2002. Estimation of climatic risk for agriculture in a
Mediterranean region. Proceedings from the 15th Conference on Biometeorology and Aerobiology Joint with 16th International Congress on Biometeorology of the International Society of Biometeorology (ISB),Kansas City, MO, USA 28 October - 1 November 2002.
Motha, R. and T. Heddinghaus. 1986. The Joint Agricultural Weather Facility’s Operational
Assessment Program. American Meteorological Society Bulletin. 67:1114-1112. Motha. R. and Stefanski, R. 2006. United States Department of Agriculture’s Weather and Climate
Information System for Operational Applications in Agriculture. Meteorological Applications. Volume 13, Supplement 1. 31-47.
Mukhala, E. 2005. Food and Agriculture Organization and Agricultural Drought. In Monitoring and
Predicting Agricultural Drought: A Global Study. Eds. V.K. Boken, A.P. Cracknell, and R.L. Heathcote. Oxford University Press. New York, New York.
Murphy, T. M., O’Brien, D. J. and Gray, J. S. (2004). Weather, pests and epidemiology of animal diseases. Chapter 12 in (T. Keane and J. F. Collins (eds). Climate, Weather and Irish Agriculture (2nd Edition). Agmet, Dublin.
Negre, T. 2006. EU/JRC Agrometeorological Monitoring and National Services: Opportunities and
Challenges. In Strengthening Operational Agrometeorological Services at the National Level. Proceedings of the Inter-Regional Workshop, 22-26 March 2004, Manila, Philippines. (Eds) R. Motha, M.V.K. Sivakumar, and M. Bernardi. Washington, D.C., USA: USDA; Geneva, Switzerland, WMO; Rome, Italy: FAO. Technical Bulletin WAOB-2006-1 and AGM-9. WMO/TD-No. 1277.
Nyiira, Z.M. 1980. Meteorological Factors and their influence on the Epidemiology of the Cassava
Mites. CAgM Report 5.
22
Oldeman, L. R. and M. Frère. 1982. An study of the agroclimatology survey of the humid tropics of South-east Asia. WMO Technical Note No. 179. FAO/UNESCO/WMO Interagency Project on Agroclimatology. WMO Publication No. 597. Geneva, Switzerland.
Omar M.H. (1980) Meteorological Factors affecting the epidemiology of the cotton leaf worm and
the pink bollworm. WMO NO 532. Omar . 1980. The Economic value of agrometeorological information and advice. WMO Technical
Note 164. WMO No. 526. WMO, Geneva, Switzerland. Orlandini, S. 1996. Agrometeorological models for crop protection. In International Symposium on
Applied Agrometeorology and agroclimatology. Proceedings held in Volos, Greece, 24-26 April 1996. COST 77, 79, 711. European Commission. EUR 18328 EN.
Orlandini, S., A.D. Marta, H. Friedland, and A. Susnik. 2005. Description and testing of PLASMO
model the simulation of grapevine downy mildew. In Irrigation and pest and disease models: Evaluation in different environments and web-based applications. Eds. G. Maracchi, L. Kajfez-Bogataj, S. Orlandini, F. Rossi, and M Barazutti. European Commission. Cost Action 718: Meteorological Applications for Agriculture. p. 140-149.
Paes de Camargo, A.P and Pereira, A.R. 1994. Agrometeorology of the Coffee Crop. CAgM
Report No. 58. WMO/TD-No. 615, 95 pp Pashairdis, S. 1990. Part I: Survey of operational models in use for agrometeorlogical services for
potato crop production. In CAgM Report 35. WMO TD No. 381. p 19. Pedgley, D. 1982. Windborne Pests and Diseases: Meterology of Airbourne Organisms. John
Wiley and Sons. New York, New York. 250 p.
Pedgley, D.E. 1997. Agrometeorological Information for Locust Control. In Extreme Agrometeorological Events. CAgM Report 73. WMO/TD-No. 836.
Perrin de Brichambaut, G., Wallén, C.C. 1963. A study of agroclimatology in semi-arid and arid zones of the Near East. WMO Technical Note No. 56. WMO Publication No. 141. Geneva, Switzerland.
Petr, J. 1991. Weather and Yield. Developments in Crop Science 20. Elsevier Amsterdam. Pinto, H. 2007. Personnel communication. Porteous, A.S, 1996. Agroclimatology of the apple crop. CAgM report no. 68. WMO TD No. 750. Pruess, K.P. 1983. Day-degree methods for pest management. Environmental Entomolgy, 12:
613-619. Puterbaugh, T., R. Stefanski, M. Brusberg. 1997. The Joint Agricultural Weather Facility’s
Operational Procedures for Processing and Analyzing Global Crop and Weather Data. Proceedings of the 13th Conference on Interactive Information and Processing Systems, Long Beach, California, Amer. Meteor. Soc., 46-49 pp.
Rainey, R.C. 1963. Meteorology and the Migration of Desert Locusts. WMO Technical Note 54.
Rider, N.E. 1958. Measurement of Evaporation Humidity in the Biosphere and Soil Moisture. Technical Note No. 21. WMO No. 71, 49 pp.
23
Rijks, D. 1992. Meteorology and plant protection: an introduction. In: Rijks, D., Hopper, B. (Eds.), Agrometeorologia y proteccion de plantas, Actas del coloquio de Ascunión. World Meteorological Organization, Geneva.
Rijks, D. and Baradas, M.W. 2000. The clients for agrometeorological information. Agric. For.
Meteorol. 103, 27-42. Rosenberg, N.J., B.L. Blad, and S.B. Verma. 1983. Microclimate: The Biological Environment. 2nd
Edition. John Wiley and Sons, New York, New York. Rossi, F., S. Orlandini, M. Magli, and G. Maracchi. 2005. PLASMO Project – an internet application.
In Irrigation and pest and disease models: Evaluation in different environments and web-based applications. Eds. G. Maracchi, L. Kajfez-Bogataj, S. Orlandini, F. Rossi, and M Barazutti. European Commission. Cost Action 718: Meteorological Applications for Agriculture. p. 150-153.
Rowland, J., J. Verdin, A. Adoum, and G. Senay. 2005. Drought Monitoring Techniques for Famine
Early Warning Systems in Africa. In Monitoring and Predicting Agricultural Drought: A Global Study. Eds. V.K. Boken, A.P. Cracknell, and R.L. Heathcote. Oxford University Press. New York, New York.
Rusakova T. I., Lebedeva V. M., Gringof I. G. and Shklyaeva N. M. Modern technology of stage-
by-stage forecasting of crop yield and gross collection. Meteorology and hydrology, 2006, No.7, p.101-108.
Ryall DB, Maryon RH (1998). Validation of the UK Met. Office's name model against the ETEX dataset. Atmospheric Environment 32, 4265-4276.
Sadi, O. 1992. Part II - Report on Locust and Crop Pests. Partie II - Rapport sur la lutte contre les acridiens et autres ennemis des cultures. CAgM Report 39. WMO/TD-No. 480.
Seemann, J. 1974. Climate Under Glass. Technical Note No. 131. WMO No. 373. 40 pp. Seghi, L., Orlandini, S., Gozzini, B. 2000. Survey of Models of Plant Diseases. In Report of the RA
VI Working Group on Agricultural Meteorology. CAgM No. 82. WMO/TD No. 1022. WMO, Geneva, Switzerland.
Sentelhas, P.C., T.J. Gillespie, M.L. Gleason, J.E.B.A. Monteiro, and S.T. Helland. 2004. Operational exposure of leaf wetness sensors. Agric. and Forest Meteorol. 126: 59-72. Smith, C. V., 1964a, b, c: Animal housing and meteorology. I: Ventilation and associated pattern of
air flow; II: The rating of ventilation systems for animal houses; III: A quantitative relationship between environment, comfort and animal productivity. Agric. Meteorol., 1.
Smith, C.V. and Cough, M. C. 1990. Meteorology and Grain Storage. WMO Technical Note. 101.
WMO Pub 243. Geneva, Switzerland.
Smith, L. P. (1956). Potato blight forecasting by 90 per cent humidity criteria. Plant Pathology 5, 83 - 87.
Smith, L. P. and Hugh-Jones, M. E. (1969). The effects of wind on the spread of foot-and-mouth disease. Nature 223, 712-715.
Smith, L.P. 1970. Weather and Animal Diseases. WMO Technical Note 113. WMO publication 268,
TP 152. Smith, M. 2000. The application of climate data for planning and management of sustainable
rainfed and irrigated crop production. Agric. For. Meteorol. 103, 99-108.
24
Synder, R.L., J. Paulo de Melo-Abreu, S. Matulich. 2005. Frost Protection: Fundamentals, practice, and economics. Volume 1 and 2. FAO Environment and Natural Resources Service Series, No. 10. FAO, Rome, Italy.
Sørensen, J. H.: Sensitivity of the DERMA long-range dispersion model to meteorological input and diffusion parameters, Atmospheric Environment 32, 4195–4206.
Stanhill, G., Baier, W., Doyle, J.J., Gangopadhyaya, M., Razumova, L.A., Winter, E.J. 1968. Practical Soil Moisture Problems in Agriculture. Technical Note No. 97. WMO No. 235, 69 pp.
Starr, J.R. 1980. Weather, Climate, and Animal Performance. WMO Technical Note No. 190. WMO Publication No. 684. WMO, Geneva, Switzerland.
Ullrich J. and Schrodter H., 1966. Das problem der vorhersage des aufretens der kartoffelkrautfaule ((Phytophthorainfestans) und die moglichkeit seiner losung durch eine negativprognose. Nachrichtenblatt Dt. Pflanzenschutzdienst (Braunschweig) 18, 33-40.
van Eimern, J., 1968: Problems of shelter planning. Proc. Reading Symp. on Agroclimat. Methods,
UNESCO, pp. 157-166. van Eimern, J., Karschon, R., Razumova, L.A., Robertson, G.W. 1964. Windbreaks and
Shelterbelts. . WMO No. 147, 188 pp
van Rij N.C. and du Preez, E.D. (2004). Use of empirical rules in the development and implementation of a potato late blight (Phytophthora infestans) incidence map for KwaZulu Natal. Presented at 42nd Annual Congress of the Southern African Society for Plant Pathology held at Cathedral Peak Hotel, Underberg, KwaZulu-Natal, 18-21 January 2004. (see http://www.saspp.org/abstracts2004/SASPP2004.pdf)
Venäläinen, A, T. Salo, and C. Fortelius. (2005). The use of numerical weather forecast model predictions as a source of data for irrigation modeling. Meteorol. Appl. 12, 307-318.
Volvach V. V. 1987. Simulation of the Effects of Agrometeorological Conditions on the Development of Colorado Beetle. Leningrad, Hydrometeoizdat, 239 pp.
Winstel, K. 1993. Kraut- und knollenfaule der kartoffel eine eeue prognosemoglichkeit-sowie bekampfungsstrategien. Med. Fac. Landbouww. Univ. Gent, 58/3b.
WMO. 1963. The effect of weather and climate upon the keeping quality of fruit. WMO Techincal
Note 53. WMO Publication 137. Geneva, Switzerland.
WMO. 1965. Meteorology and the Desert Locusts. Proceedings of the WMO/FAO Seminar in Tehran, Iran. Dec 1963. WMO Technical Note No. 69. 1965.
WMO. 1988. Agrometeorological Aspects of Operational Crop Protection. WMO Technical Note 192. WMO No. 687.
WMO. 1991. Meteorology for Locust Control. La Météorologie au service de la lutte anti-acridienne.
CAgM Report 36. WMO/TD-No. 404. WMO. 1972. The Application of micrometeorology to agricultural problems. Ed. L.P. Smith. WMO
Technical Note No. 119. WMO TD. No. 298. WMO. Geneva, Switzerland. WMO. 1994. Conference on the economic benefits of meteorological and hydrological services.
Extended abstracts of papers. WMO/TD No. 630. WMO, Geneva, Switzerland.
25
WMO. 1963. Protection against frost damage. WMO Technical Note 51. WMO No 133. WMO. Geneva, Switzerland.
Wright, P. B. (1969). Effects of wind and precipitation on the spread of foot-and-mouth disease.
Weather 24, 204-213
Zadoks, J.C. 1981. EPIPRE: A disease and pest management system for winter wheat developed in the Netherlands. EPPO Bulletin 11 (3): 365-369.
Zhukov V. A., Polevoy A. N., Vitchenko A. N. and Daniyelov S. A. 1989. Mathematical methods for the assessment of agroclimatic resources. Leningrad. Hydrometeoizdat. 207 pp.
Zoidze E. K., Ovcharenko L. I. 2000. Comparative assessment of the agricultural potential of
Russian climate and the degree of utilization of its agroclimatic resources by crops. Saint Peterburg. Hydrometeoizdat, 75 pp.
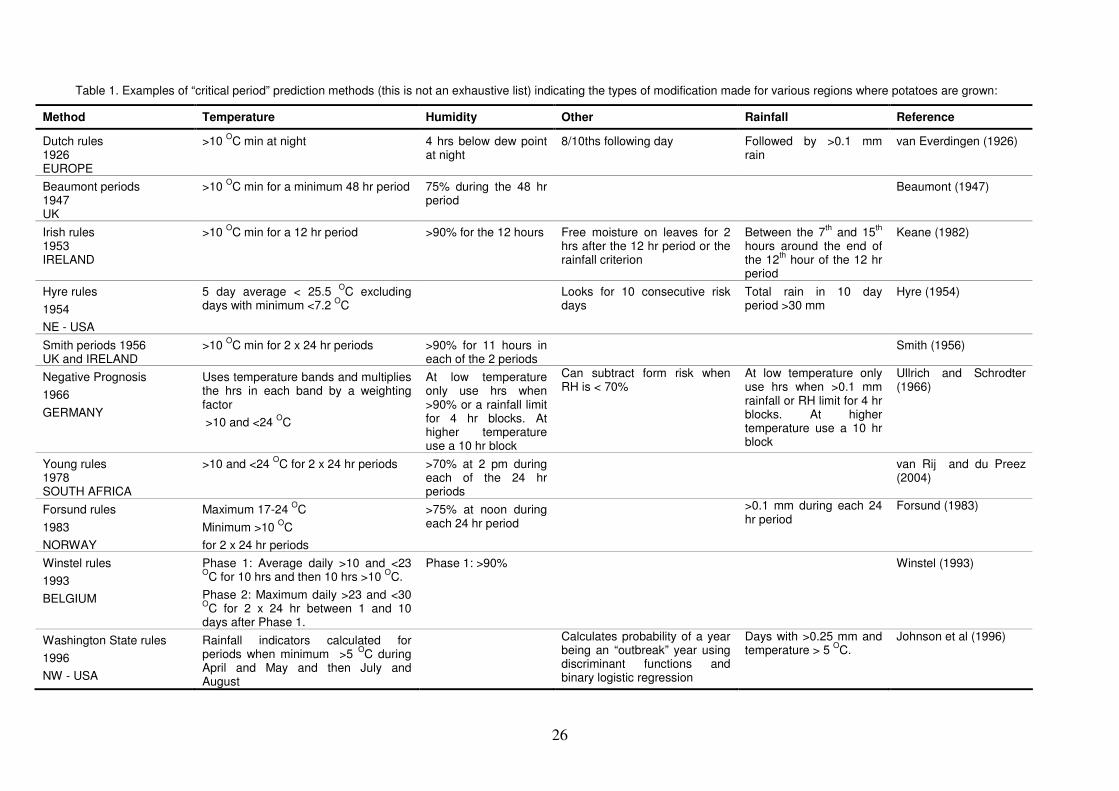
26
Table 1. Examples of “critical period” prediction methods (this is not an exhaustive list) indicating the types of modification made for various regions where potatoes are grown:
Method Temperature Humidity Other Rainfall Reference
Dutch rules 1926 EUROPE
>10 OC min at night 4 hrs below dew point at night
8/10ths following day Followed by >0.1 mm rain
van Everdingen (1926)
Beaumont periods 1947 UK
>10 OC min for a minimum 48 hr period 75% during the 48 hr period
Beaumont (1947)
Irish rules 1953 IRELAND
>10 OC min for a 12 hr period >90% for the 12 hours Free moisture on leaves for 2 hrs after the 12 hr period or the rainfall criterion
Between the 7th and 15th hours around the end of the 12th hour of the 12 hr period
Keane (1982)
Hyre rules
1954
NE - USA
5 day average < 25.5 OC excluding days with minimum <7.2 OC
Looks for 10 consecutive risk days
Total rain in 10 day period >30 mm
Hyre (1954)
Smith periods 1956 UK and IRELAND
>10 OC min for 2 x 24 hr periods >90% for 11 hours in each of the 2 periods
Smith (1956)
Negative Prognosis
1966
GERMANY
Uses temperature bands and multiplies the hrs in each band by a weighting factor
>10 and <24 OC
At low temperature only use hrs when >90% or a rainfall limit for 4 hr blocks. At higher temperature use a 10 hr block
Can subtract form risk when RH is < 70%
At low temperature only use hrs when >0.1 mm rainfall or RH limit for 4 hr blocks. At higher temperature use a 10 hr block
Ullrich and Schrodter (1966)
Young rules 1978 SOUTH AFRICA
>10 and <24 OC for 2 x 24 hr periods >70% at 2 pm during each of the 24 hr periods
van Rij and du Preez (2004)
Forsund rules
1983
NORWAY
Maximum 17-24 OC
Minimum >10 OC
for 2 x 24 hr periods
>75% at noon during each 24 hr period
>0.1 mm during each 24 hr period
Forsund (1983)
Winstel rules
1993
BELGIUM
Phase 1: Average daily >10 and <23 OC for 10 hrs and then 10 hrs >10 OC.
Phase 2: Maximum daily >23 and <30 OC for 2 x 24 hr between 1 and 10 days after Phase 1.
Phase 1: >90% Winstel (1993)
Washington State rules
1996
NW - USA
Rainfall indicators calculated for periods when minimum >5 OC during April and May and then July and August
Calculates probability of a year being an “outbreak” year using discriminant functions and binary logistic regression
Days with >0.25 mm and temperature > 5 OC.
Johnson et al (1996)
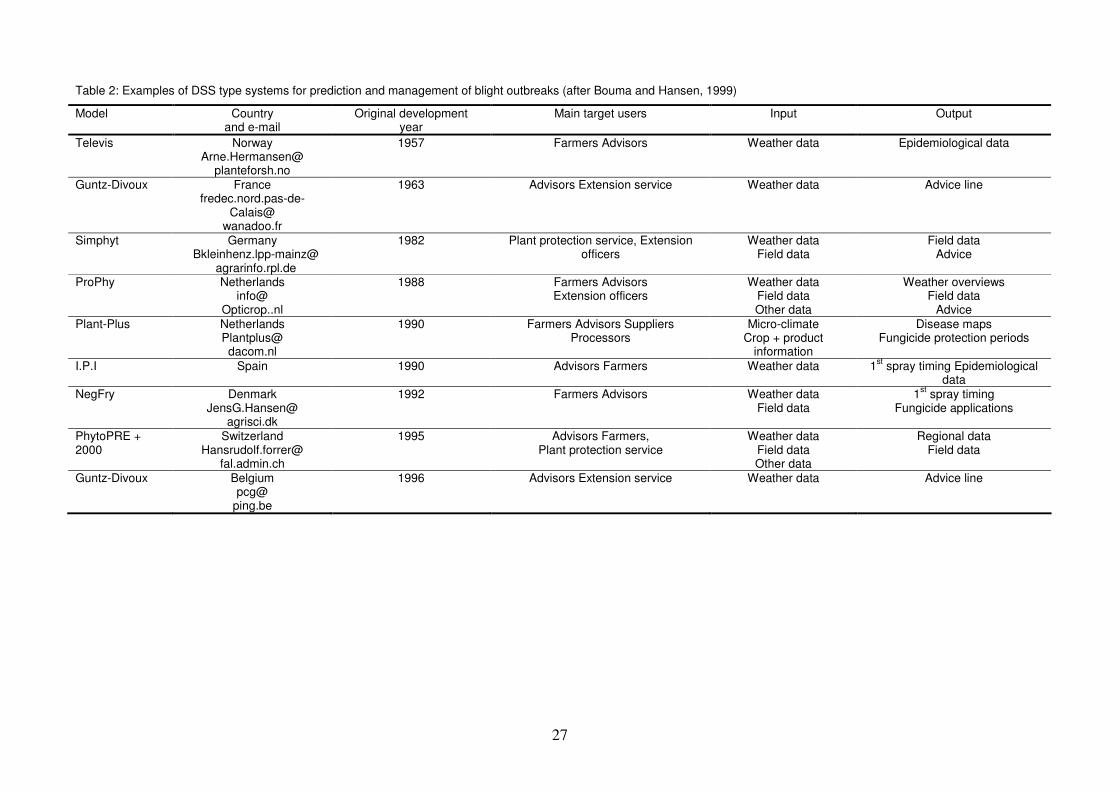
27
Table 2: Examples of DSS type systems for prediction and management of blight outbreaks (after Bouma and Hansen, 1999)
Model Country and e-mail
Original development year
Main target users Input Output
Televis Norway Arne.Hermansen@
planteforsh.no
1957 Farmers Advisors Weather data
Epidemiological data
Guntz-Divoux France fredec.nord.pas-de-
Calais@ wanadoo.fr
1963 Advisors Extension service Weather data
Advice line
Simphyt Germany Bkleinhenz.lpp-mainz@
agrarinfo.rpl.de
1982 Plant protection service, Extension officers
Weather data Field data
Field data Advice
ProPhy Netherlands info@
Opticrop..nl
1988 Farmers Advisors Extension officers
Weather data Field data Other data
Weather overviews Field data
Advice Plant-Plus Netherlands
Plantplus@ dacom.nl
1990 Farmers Advisors Suppliers Processors
Micro-climate Crop + product
information
Disease maps Fungicide protection periods
I.P.I Spain 1990 Advisors Farmers Weather data 1st spray timing Epidemiological data
NegFry Denmark JensG.Hansen@
agrisci.dk
1992 Farmers Advisors Weather data Field data
1st spray timing Fungicide applications
PhytoPRE + 2000
Switzerland Hansrudolf.forrer@
fal.admin.ch
1995 Advisors Farmers, Plant protection service
Weather data Field data Other data
Regional data Field data
Guntz-Divoux
Belgium pcg@
ping.be
1996 Advisors Extension service Weather data
Advice line