Embed Size (px)
Citation preview
APPROVED: Robert C. Benjamin, Major Professor Arthur J. Eisenberg, Committee Member H. Gill-King, Committee Member Sarah A. McIntire, Committee Member Douglas D. Root, Committee Member Art J. Goven, Chair of the Department of
Biological Sciences Sandra L. Terrell, Dean of the Robert B.
Toulouse School of Graduate Studies
APPLICATIONS OF MOLECULAR GENETICS TO HUMAN IDENTITY
Meredith A. Turnbough, B.S., M.S.
Dissertation Prepared for the Degree of
DOCTOR OF PHILOSOPHY
UNIVERSITY OF NORTH TEXAS
December 2008
Turnbough, Meredith A. Applications of Molecular Genetics to Human Identity.
Doctor of Philosophy (Molecular Biology), December 2008, 98 pp., 19 figures,
references, 52 titles.
The primary objectives of this project were: 1. to develop improved methods for
extraction of DNA from human skeletal remains, 2. to improve STR profiling success of
low-copy DNA samples by employing whole genome amplification to amplify the total
pool of DNA prior to STR analysis, and 3. to improve STR profiling success of damaged
DNA templates by using DNA repair enzymes to reduce the number/severity of lesions
that interfere with STR profiling.
The data from this study support the following conclusions. Inhibitory compounds
must be removed prior to enzymatic amplification; either during bone section
pretreatment or by the DNA extraction method. Overall, bleach outperformed UV as a
pretreatment and DNA extraction using silica outperformed microconcentration and
organic extraction. DNA repair with PreCR™ A outperformed both whole genome
amplification and repair with PreCR™ T6. Superior DNA extraction results were
achieved using the A6 PMB columns (20 ml capacity column with 6 layers of type A
glass fiber filter), and DNA repair with PreCR™ A led to an overall improvement in
profile quality in most cases, although whole genome amplification was unsuccessful.
Rapid, robust DNA isolation, successful amplification of loci from the sample-derived
DNA pool, and an elimination of DNA damage and inhibitors may assist in providing
sufficient genetic information from cases that might otherwise lie on the fringe of what is
possible to obtain today.

ii
Copyright 2008
by
Meredith A. Turnbough
iii
ACKNOWLEDGEMENTS
Graduate student fellowship funding for this project was provided by the National
Institute of Justice (NIJ). Many thanks to Tanya Norris and Shea Chester at the UNT
research services office for skillful navigation of the grant submission process.
Reagents, supplies, use of equipment, and sage advice kindly provided by Arthur
J. Eisenberg at the UNT Center for Human Identification (UNTCHI) and Robert C.
Benjamin. PMB columns were generously provided by Mike Brownleader, whose
collaboration has been essential to this research. PreCR™ mixes were generously
provided by Tom Evans and Lixin Chen at New England Biolabs®. Bone samples were
provided by H. Gill-King at the Tad Lott Osteology Lab. Amicon® Ultra-4 devices were
provided by Rhonda Roby. Many thanks to Christina Capt, Suzy Gonzalez, Linda
LaRose, Amy Smuts, Lauren Fuqua, and everyone at the UNTCHI who selflessly took
time out of their busy schedules to assist me. I would also like to thank Cindy Biggs,
Aaron Binder, Tracy Lamson, Lynn Preston, Neil Stewart, and Heath Wessler who were
my lab-mates and are my friends; as well as Bobby LaRue, Candace Stewart, and Jeff
Whitt, who understand the importance of good friends and C2H6O, regardless of the
time.
I owe a debt of gratitude to Phillip C. Williamson for the use of his ABI 7300 and
other lab equipment, as well as emotional and moral support that defies quantitation.
Special thanks go to my parents, who wouldn’t let me drop out of school in the
second grade, and to all of my family for being so supportive on this (and every)
journey.
iv
TABLE OF CONTENTS
Page
ACKNOWLEDGEMENTS ............................................................................................... iii LIST OF FIGURES.......................................................................................................... v Chapters
1. INTRODUCTION ....................................................................................... 1 DNA Isolation from Bone................................................................. 4 Whole Genome Amplification.......................................................... 8 DNA Repair ................................................................................... 12 Genetic Analysis ........................................................................... 14 Objectives ..................................................................................... 14
2. MATERIALS AND METHODS ................................................................. 16
Sample Sectioning and Cataloguing ............................................. 16 Bone Surface Decontamination .................................................... 19 Bone Pulverization ........................................................................ 20 DNA Extraction.............................................................................. 21 DNA Quantitation .......................................................................... 28 Whole Genome Amplification........................................................ 30 DNA Repair ................................................................................... 31 Genetic Analysis ........................................................................... 32
3. RESULTS ................................................................................................ 37
DNA Extraction.............................................................................. 37 Quantitation................................................................................... 40 Average STR Peak Heights .......................................................... 57 Whole Genome Amplification........................................................ 69 DNA Repair ................................................................................... 69
4. DISCUSSION .......................................................................................... 82 5. SUMMARY .............................................................................................. 89
REFERENCES.............................................................................................................. 92
v
LIST OF FIGURES
Page
1. Representative photographic documentation of bone sections .......................... 18
2. The range of amplicon sizes possible at each locus when using the Profiler Plus™ ID multiplex ............................................................................................. 35
3. Comparison of recovery of known DNA quantities and size standards (HinfI digested pBR322 and HindIII digested λ phage) with the QIAamp® (QA) and QIAquick® (QQ) columns ................................................................................... 39
4. DNA recovery estimated with Quantifiler® from bleach pretreated samples using silica-based devices ........................................................................................... 46
5. DNA recovery estimated with Quantifiler® from UV pretreated samples using silica-based devices ........................................................................................... 48
6. DNA recovery was estimated using Quantifiler® from four elutions (E1, E2, E3, E4) from PMB columns A1, A3, B1, and B3 ....................................................... 50
7. DNA recovery estimated using Quantifiler® from four elutions (E1, E2, E3, E4) using PMB columns A3, A6, and B3................................................................... 52
8. DNA recovery estimated using Quantifiler® from bleach pretreated bone using Amicon® ultrafiltration devices ........................................................................... 54
9. DNA recovery estimated using Quantifiler® from UV pretreated bone using Amicon® ultrafiltration devices ........................................................................... 56
10. Average STR peak heights for bleach or UV pretreated bone extracted with either 1 ml or 3 ml extraction buffer and processed through QIAquick® columns ........................................................................................................................... 60
11. Average STR peak heights for bleach or UV pretreated bone extracted with A1, A3, or B1 PMB columns (washed with a single 1 ml aliquot of PE buffer) .......... 62
12. Average STR peak heights for UV pretreated bone extracted with A1, A3, or B1 PMB columns (washed with a single 5 ml aliquot of PE buffer) .......................... 64
13. Average STR peak heights for UV pretreated bone extracted with A3, or A6 PMB columns (washed with a 2 x 5 ml or 3 x 5 ml PE buffer) ..................................... 66
14. Average STR peak heights for bleach pretreated bone using Amicon® ultrafiltration devices and the Modified AFDIL protocol....................................... 68
15. PreCR™ A repair of UV pretreated, 3 ml QIAquick® extracted DNA ................. 73
vi
16. PreCR™ A repair of UV pretreated, PMB A6 (2 x 5 ml wash) extracted DNA.... 75
17. PreCR™ A repair of UV pretreated, PMB A6 (3 x 5 ml wash) extracted DNA.... 77
18. PreCR™ A repair of bleach pretreated, Amicon® Ultra-4 50K NMWL extracted DNA.................................................................................................................... 79
19. PreCR™ A repair of bleach pretreated, Centricon® 30 extracted DNA.............. 81
CHAPTER 1
INTRODUCTION
Each year, a large number of human remains are found that cannot be identified
by traditional gross morphological methods such as visage, dental, radiological, or
fingerprinting. The condition of these remains varies widely and, in many cases, a few
pieces of a disarticulated skeleton are all that are ever recovered. This is, of course,
because teeth and bones are the most durable portions of the human body, persisting
long after soft tissues have succumbed to decay. The unique mineral composition of
these structures also works to stabilize DNA, protecting it to some degree from the
oxidative and hydrolytic damage that otherwise would rapidly occur in all but the coldest
of climates (19). All of these properties make bone-derived DNA a natural focal point in
the field of missing persons identification.
DNA has been used for forensic analysis since 1984, when Alec Jeffreys
adapted David Botstein’s restriction fragment length polymorphism (RFLP) technique to
examine human polymorphic loci and thus identify an individual as the likely source of
DNA evidence found at a crime scene (42). RFLP has an excellent power of
discrimination, but it is a labor-intensive technique that requires relatively large
quantities of high-quality DNA (the fragments analyzed in RFLP are on the order of
thousands of base pairs long, and the analysis of multiple loci must be conducted
sequentially, requiring weeks to complete even a four-locus profile). Two years after
Jeffreys’ innovation, Kary Mullis developed the polymerase chain reaction (PCR),
technology which was first applied to human identity using the polymorphic HLA DQα
1
locus. The first dot blot strip test was rapid and required far less template DNA than did
the RFLP process, but it only analyzed a single locus with six possible alleles.
Therefore, it had a substantially reduced discriminatory power. Improvements were
made to the dot strip systems, adding loci and refining the technique to provide the HLA
DQA1 system and later the Amplitype® PM+DQA1 system (F. Hoffman-La Roche Ltd.,
www.roche.com) (42). These iterations increased the power of discrimination of the
approach, but it was the development of PCR primers to amplify short tandem repeat
(STR) loci (and the multiplexing of primers that followed) that finally combined the ease
and sensitivity of PCR amplification with a power of discrimination that approached and
ultimately surpassed that of RFLP analysis. The STR typing profiles were also readily
entered into databases (as were the RFLP profiles before them) that allow law
enforcement to quickly compare STR profiles obtained from evidentiary samples to
reference profiles obtained from convicted criminals, unsolved crime scene evidence
databases, and to family members of missing persons.
In 2001, the Texas state legislature funded the profiling of DNA samples from
unidentified human remains and the creation of the Texas Missing Persons DNA
Database (TMPDD) at the University of North Texas Health Science Center (UNTHSC)
at Fort Worth. The TMPDD began accepting samples from Texas law enforcement
agencies in 2003. Under the new moniker of the University of North Texas Center for
Human Identification (UNTCHI), and with federal funding, the UNT Center for Human
Identification currently operates as a national facility in conjunction with the Federal
Bureau of Investigation’s Combined DNA Index System (CODIS). Its mission continues,
generating and associating short tandem repeat (STR) profiles from unidentified
2
remains with reference STR profiles (50). To date, the UNT Center for Human
Identification has successfully identified the remains of over 100 missing persons based
upon genetic analysis of submitted samples (15).
Endogenous, PCR amplifiable nuclear and mitochondrial DNA can, under optimal
conditions, persist in skeletal remains for thousands of years (23). However, the
environmental milieu to which remains are exposed is often not conducive to DNA
preservation. As a result, DNA from these remains may show signs of substantial
degradation. The currently applied methodologies for generating nuclear genetic profiles
from highly degraded samples do not always yield full STR profiles from forensic or
archeological human remains. Post-mortem degradation affects both the quantity and
quality of DNA which, as noted by Svante Paabo, is “invariably of a low average
molecular size and damaged by oxidative processes” (38). In these cases, due to the
high copy number and smaller, more durable nature of the mitochondrial genome, it is
often still possible to generate a mitochondrial DNA (mtDNA) profile well beyond the
point where standard nuclear STR analyses fail. Mitochondrial haplotypes can reliably
exclude an individual as a possible genetic donor, but cannot include an individual to
nearly the same degree as a full nuclear STR profile. In particular, mtDNA profiles are
not useful to distinguish between relatives with the same maternal lineage nor are they
of any use in the absence of maternal-lineage family reference samples.
New tools and techniques are constantly becoming available in the rapidly
evolving fields of molecular genetics and biochemistry, many of which offer the
opportunity to obtain more genetic information from highly degraded samples. Although
many techniques exist, often the bits and pieces of them that are adopted and applied
3
are “chosen” more as the result of happenstance rather than based upon a broad,
thorough effort to systematically evaluate the strengths of each portion of the available
protocol(s). There are three areas of forensic DNA analysis in particular that may benefit
from new technology: DNA isolation, amplification of sample DNA prior to genetic
analysis via whole genome amplification, and improvement of DNA template quality
using repair enzymes. The goal of this project is to identify the protocols presently
available to molecular biologists in each of these three areas, compare their relative
performance, and create new hybrid variant protocols based upon the strong points of
each method. This should make possible an improved level of standardization for
molecular-based identification of human remains, particularly those that have been
recalcitrant to presently utilized DNA profiling techniques.
DNA Isolation from Bone
The first priority of any DNA isolation protocol must be to produce a DNA extract
that can be successfully profiled. This means that it must yield DNA of a minimum
quality and quantity, preferably at an acceptable cost. The ideal DNA isolation protocol
should be streamlined and provide a maximum yield of DNA free from inhibitory
compounds that can affect downstream applications. For example, when dealing with
samples containing very low levels of or highly degraded DNA, it is important to
minimize sample handling steps, as every manipulation provides an opportunity for
sample loss, contamination from exogenous human DNA sources or, in forensic
laboratories, previously amplified STR loci/ PCR reaction products. Even small
4
quantities of “introduced” DNA can stoichiometrically out-compete the “sample” DNA in
subsequent enzymatic amplification reactions, leading to a loss (or dropout) of “sample-
derived” alleles (22). Reduced sample manipulation also limits the loss of DNA through
repeated extractions and transfers. Another important consideration is that bone is rife
with PCR inhibitory compounds, including but certainly not limited to the Ca++ present in
the hydroxyapatite matrix. Removal of these inhibitory compounds is required for
subsequent successful generation of a genetic profile. A simplified and robust DNA
isolation protocol has the added benefit of overall cost reduction, by reducing the labor
involved in the initial extraction, as well as a reduced likelihood that the procedure will
have to be repeated due to a failure of the STR profiling reaction. The latter benefit
becomes even more critical in cases where the quantity of bone available for DNA
isolation is limited.
In order to extract DNA from bone, there are five major phases: bone surface
decontamination, bone pulverization, decalcification, collagen matrix digestion, and
separation of nucleic acids from undesirable compounds. A variety of bone surface
cleaning methods exist, both chemical and physical. Some of the most widely used
chemical techniques involve treating the surface of the bone with acid, ethanol,
hydrogen peroxide, sodium hypochlorite (bleach), or a commercially available product
such as DNA Away™ (produced by Molecular BioProducts, San Diego, CA,
www.mbpinc.com; it likely consists of concentrated sodium hydroxide) (22).
“Mechanical” techniques include surface sanding and irradiation of the surface of the
bone with UV light. Drilling into a bone so that only internal material is collected
circumvents, to a certain degree, the issue of surface contamination. Bones that have
5
been previously examined by a forensic anthropologist will likely already have been
macerated, a process that removes any soft tissue from the bone so that signs of
trauma and anthropomorphic features can be more readily observed. The specific
maceration technique employed by the forensic anthropologist can affect the state of
preservation of the DNA (45), but that is currently beyond the scope of this study. Once
a clean section of bone is acquired, an initial reduction of the bone sample to powder
vastly increases the surface area accessible to extraction reagents, enhancing the
effectiveness of the subsequent steps of the isolation protocol. Bone powder can be
generated by 1) grinding in a mortar and pestle, 2) drilling into the bone, 3) grinding in a
coffee mill or blender, 4) pulverization in a freezer/mill® (SPEX CertiPrep, Metuchen, NJ,
www.spexcsp.com), or a range of other methods. However, each of these methods
have significant weaknesses including difficulty in the decontamination of the grinding
vessel (mortar and pestle, coffee mill, blender), unacceptable heating of the substrate
(drilling), labor intensive processing (mortar and pestle), and relatively high initial
equipment cost (freezer/mill). The method of choice for most human identity laboratories
is the freezer/mill, which rapidly pulverizes the bone, maintains liquid nitrogen
temperatures during grinding, and has only three smooth stainless steel parts plus a
readily disposable polycarbonate vial in direct contact with the sample.
Decalcification is generally accomplished by incubation of the bone powder with
0.5 M ethylenediaminetetraacetic acid (EDTA), pH 8.0. EDTA chelates the Ca++ ions,
helping to release DNA that has adsorbed to the hydroxyapatite matrix of the bone (as
previously noted, high Ca++ levels can also inhibit PCR) (16). EDTA also inhibits
nuclease activity by chelating other metal ions (such as Mg++) that are required by many
6
of these enzymes. DNA in bone is trapped in and protected to a certain degree by the
collagen matrix as well as being adsorbed to the hydroxyapatite. In fact, the amount of
collagen present in a bone correlates well with the presence of DNA (16). Like Ca++,
collagen is an inhibitor of PCR, and so must be digested (often with proteinase K) both
to release the DNA and to prevent interference with downstream applications (41).
The DNA released from the bone must then be separated from the proteins,
carbohydrates, lipids, and other compounds that have co-extracted with it. Of particular
significance are humic acid, fulvic acid, and melanoidins (the products of the Maillard
reaction, polymers and copolymers of covalently bound sugars and proteins) (38).
These brown, inhibitory products will often partition with the DNA into the aqueous
phase even after multiple phenol/chloroform extractions. A myriad of purification
methods exist, but ultrafiltration, organic extraction, and silica column purification are
some of the most prevalent. Ultrafiltration (UF) devices such as Microcon®, Centricon®,
or Amicon® Ultra 4 columns (Millipore Corporation, Billerica, MA, www.millipore.com)
may be used for sample concentration, buffer exchange, and removal of contaminants
smaller than the nominal molecular weight cutoff of the device’s filtration membrane.
These devices typically must be used in conjunction with another purification method
such as organic extraction or silica column purification in order to sufficiently reduce
inhibitory compounds. One of the most promising solutions for reduction of inhibitory
compound is the isolation the DNA by taking advantage of a biochemical property that
allows DNA to specifically bind to a silica substrate in the presence of a high-salt
solution. Other mixture components are then washed away, and the DNA is eluted from
the silica by a low salt solution. This procedure also facilitates the buffer exchange
7
necessary to eliminate EDTA used earlier in the protocol (just as EDTA inhibits
nucleases by chelation of metal ions, it also effectively inhibits the polymerases in
PCR). DNA adsorbs to silica particularly well in the presence of chaotropic salts such as
guanidinium thiocyanate (GITC) and guanidine hydrochloride, which are also useful due
to their protein denaturation properties (11). Although these types of extractions were
originally performed with a slurry of diatoms or glass milk (9), there are now
commercially available silica columns such as the QIAquick® and QIAamp® columns
(Qiagen Inc., Valencia, CA, www1.qiagen.com), and the DNA Wizard Prep® columns
(Promega Corporation, Madison, WI, www.promega.com). Prototype silica columns
(PMB columns), with a larger volume capacity, have been produced in collaboration
with Mike Brownleader at Generon Inc., to more effectively handle typically encountered
working volumes of crude DNA extract. This simplification of the protocol substantially
reduces the number of handling steps and sample transfers required, as well as
eliminating the use of hazardous compounds such as phenol and chloroform.
Whole Genome Amplification
Although PCR has a theoretical limit of one copy of the target DNA, the practical
limit is often much higher. This becomes an even greater problem when the target DNA
is in less than pristine condition, as damage (such as apurinic/apyrimidinic sites) can
cause the DNA polymerase (particularly non-proofreading enzymes such as Taq) to
dissociate from the DNA strand prematurely. Forensic samples in particular often suffer
from the dual problem of low quantity and low quality. Whole genome amplification
8
(WGA) is a technique designed to address the issue of limited DNA template quantity by
amplifying all the DNA in a sample (not just the loci that lie between specific forward and
reverse PCR primers). Some WGA techniques have shown great promise, generating
sufficient quantities of DNA from laser micro-dissected tumor biopsies for analysis of
chromosomal copy number aberrations (21). There are several distinct approaches that
each fall under the procedural umbrella of whole genome amplification: primer
extension pre-amplification (PEP), tagged PCR (T-PCR), degenerate oligonucleotide
primed PCR (DOP-PCR), and Φ29 isothermal amplification (also known as multiple
displacement amplification or MDA). The primary concern for forensic scientists is that
the product of a WGA reaction must reflect unbiased and high-fidelity amplification of
the original genetic material.
Primer extension pre-amplification is a Taq polymerase-based WGA method that,
much like standard PCR, involves a series of primer annealing and extension steps.
Improved primer extension pre-amplification (I-PEP) is identical to PEP except for the
use of a proofreading polymerase in addition to Taq polymerase (6). The primary
difference between standard PCR and PEP/I-PEP is that instead of using a specific set
of primers, these methods use a collection of 15-mer, completely degenerate
oligonucleotides (25). This degenerate primer mix includes a total of 109 different 15-
mer sequences that anneal at random intervals (though generally not too distantly
spaced) throughout the genome (47). Although PEP/I-PEP can provide good coverage
of the genome, the “random” priming creates shorter and shorter products with each
subsequent cycle (due to priming within previously amplified segments) and the process
does not produce the exponential amplification seen with standard PCR.
9
Tagged PCR, which is also Taq-based, combines the genome coverage of
random priming with the exponential amplification of standard PCR by making use of
two separate sets of amplification steps. First, T-PCR uses low-stringency annealing
conditions and “hybrid” primers that have the same degenerate 3’ sequences as before
with a constant 5’ sequence (the tag sequence). The first cycle produces large-fragment
full coverage of the entire genome while “tagging” each of the amplified sequences at
their 5’ ends. Several subsequent cycles randomly prime on the first cycle’s products to
yield amplicons with the conserved primer tag sequence at both ends. The
unincorporated hybrid primers are then removed and the dual-tagged amplicons are
used for high-stringency amplifications using primers complementary to the tag
sequence. While this method yields considerably more product than PEP, there can be
a tendency toward preferential amplification of shorter tagged sequences during the
high stringency round of amplification. There is also the added concern that the primer
removal step can result in the selective loss of some initial amplicons (47).
Degenerate oligonucleotide-primed PCR also uses partially degenerate (hybrid)
primers and amplification using low-stringency annealing conditions followed by
amplification using high-stringency conditions. Here, however, there is no need for
primer removal between steps. Originally a Taq-based application, many researchers
have substituted proofreading polymerases (alone or in combination with Taq) in an
effort to improve overall fidelity (25). This practice has also shown promise with
degraded DNA samples. The proofreading polymerase can correct base pair
mismatches that often occur with Taq, as well as bypass small replication errors, both of
which promote more complete elongation products (49).
10
Multiple displacement amplification varies from the previously discussed methods
in that it does not rely on repeated cycles of denaturation, annealing, and elongation for
the enzymatic amplification of DNA. The Φ29 viral DNA polymerase is a highly
processive enzyme (70,000 nucleotides incorporated following a single binding event)
that simultaneously displaces the non-template strand of the DNA as it elongates the
nascent strand at the rate of 25-50 nucleotides/second (8). This process is carried out at
30-31°C, uses 3’ exonuclease-resistant random hexamer primers and requires that the
template be denatured only before the first amplification cycle. After which, the strand
displacement function of the enzyme provides ample single-stranded DNA for further
priming and subsequent amplification. MDA-replicated DNA from tumor cell lines has, in
one study, shown 96% concordance with original sample DNA, with only one
translocation (in which the target sample had very low levels of that particular DNA
fusion) escaping detection (32). Another study found 99.86% concordance between
native and MDA-amplified DNA (7).
Replicative fidelity and genome coverage are primary concerns with all WGA
methods. Other problems include difficulty with accurate quantitation of the DNA post-
WGA. Whole genome amplified DNA is difficult to quantify with standard techniques as
the telomeric and repetitive centromeric regions, targeted by Quantifiler® and
Quantiblot® (Applied Biosystems Inc., Forster City, CA, www.appliedbiosystems.com)
respectively, are not effectively amplified by WGA (4). In addition, electrophoretic and
spectrophotometric DNA quantitation methods do not accurately represent the quantity
of MDA amplified target DNA, due to the production of large amounts of nonspecific
11
product (4). Though promising, the accuracy and utility of DNA profiles generated from
WGA amplified templates has yet to be verified.
DNA Repair
A range of types of DNA damage begin to accumulate as soon as the living
tissue loses integrity. These can be the result of activities integral to the cell such as the
release of hydrolytic enzymes or as a result of environmental factors such as UV
irradiation. DNA damage can negatively impact the ability to obtain STR profiles.
Recently, mixtures of enzymes designed to repair DNA, such as New England Biolabs
PreCR™ product (New England Biolabs, Ipswitch, MA, www.neb.com), have become
commercially available. These cocktails have the ability to repair damage such as
apurinic/apyrimidinic (AP) sites, thymine dimers, single-strand breaks, gaps,
deaminated cytosine, 8-oxo-guanine, and to restore free 3’ hydroxyl groups (36). While
the reduction of such lesions would certainly improve the efficiency of subsequent PCR-
based applications, the potential to inadvertently generate alterations in the sequence of
the DNA template as a result of the activities of these enzymes must be carefully
examined.
The PreCR DNA repair enzyme cocktail contains 8-oxoguanine DNA glycosylase
(Fpg), endonuclease VIII, uracil-DNA glycosylase (UDG), T4 endonuclease V (T4 PDG),
endonuclease IV, Bst DNA polymerase, and Taq DNA ligase. Oxidatively damaged
purines (such as 8-oxoguanine) are removed from double stranded DNA by 8-
oxoguanine DNA glycosylase (Fpg) to generate a single nucleotide gap flanked by a 5’
12
phosphate and 3’ hydroxyl, respectively (48). Damaged pyrimidines are released from
double stranded DNA by the N-glycosylase activity of endonuclease VIII, creating an AP
site. The enzyme’s AP-lyase activity then cleaves 5’ and 3’ of the AP site, leaving a
phosphate on both sides (12). E. coli uracil DNA glycosylase removes uracil from DNA
by cleavage of the N-glycosylic bond, creating an apyrimidinic site (29). Thymine dimers
caused by UV irradiation are rectified using T4 endonuclease V, also known as T4
bacteriophage pyrimidine dimer glycosylase (T4 PDG), whose glycoslase activity
cleaves at the 5’ end of the dimer and AP-lyase activity cleaves the phosphodiester
bond at the AP site (18). Endonuclease IV hydrolyzes AP sites, leaving an intact 5’
phosphate and 3’ deoxyribose on the respective adjacent nucleotides (27). The large
fragment of Bst DNA polymerase fills gaps in one strand of double stranded DNA using
its 5’ → 3’ polymerase activity, but lacks the domain responsible for the 5’ → 3’
exonuclease activity responsible for nick translation and seen in the native Bacillus
stearothermophilus polymerase (3). Taq DNA ligase will seal nicks between adjacent 3’
hydroxyl and 5’ phosphate groups, but only if the surrounding bases are perfectly base
paired to a complementary strand of DNA and no gaps are present (5). Although not all
types of DNA damage are reparable by this cocktail, and indeed some types of repair
(such as fragment ligation) should be avoided entirely to preserve sequence integrity of
the template DNA, it is theoretically possible to achieve a significant reduction in many
of the lesions that are disruptive to downstream applications.
13
Genetic Analysis
The UNT Center for Human Identification and CODIS databases both rely, in
part, on thirteen core autosomal STR loci that make up each profile. When amplified
with the Applied Biosystems Incorporated® (ABI®) Profiler Plus™ ID, COfiler™, and
Identifiler™ (Applied Biosystems Inc., Forster City, CA, www.appliedbiosystems.com),
the product sizes for these STR amplicons range from 97-352 base pairs. Since DNA
degradation is marked by a reduction in average strand length, the loci with larger
products tend to “drop out” of STR profiles generated from severely degraded DNA.
This results in the “ski slope” effect, where the electropherogram’s smaller STR
amplicons show significantly greater peak heights than do the larger amplicons. This is
due to inequity in the relative abundance of intact DNA template for each locus, as the
odds of fragmenting within a 400 base pair section of DNA are twice that for a 200 base
pair section.
Objectives
This study was conducted as part of the President’s DNA Initiative to advance
justice through DNA technology (13). One of the goals of the President’s 5-year, $1
billion initiative is to “ensure that DNA forensic technology is used to its full potential to
solve missing persons cases and identify human remains” (13). In keeping with that
goal, the primary objectives of this project were: 1. to develop improved methods for
extraction of DNA from human skeletal remains, 2. to improve STR profiling success of
14
low-copy DNA samples by employing whole genome amplification to amplify the total
pool of DNA prior to STR analysis, and 3. to improve STR profiling success of damaged
DNA templates by using DNA repair enzymes to reduce the number/severity of lesions
that interfere with STR profiling. Together, all three of these objectives should aid in the
development of more robust methods for analyzing DNA from degraded, aged, or
otherwise compromised skeletal remains.
15
CHAPTER 2
MATERIALS AND METHODS
Sample Sectioning and Cataloguing
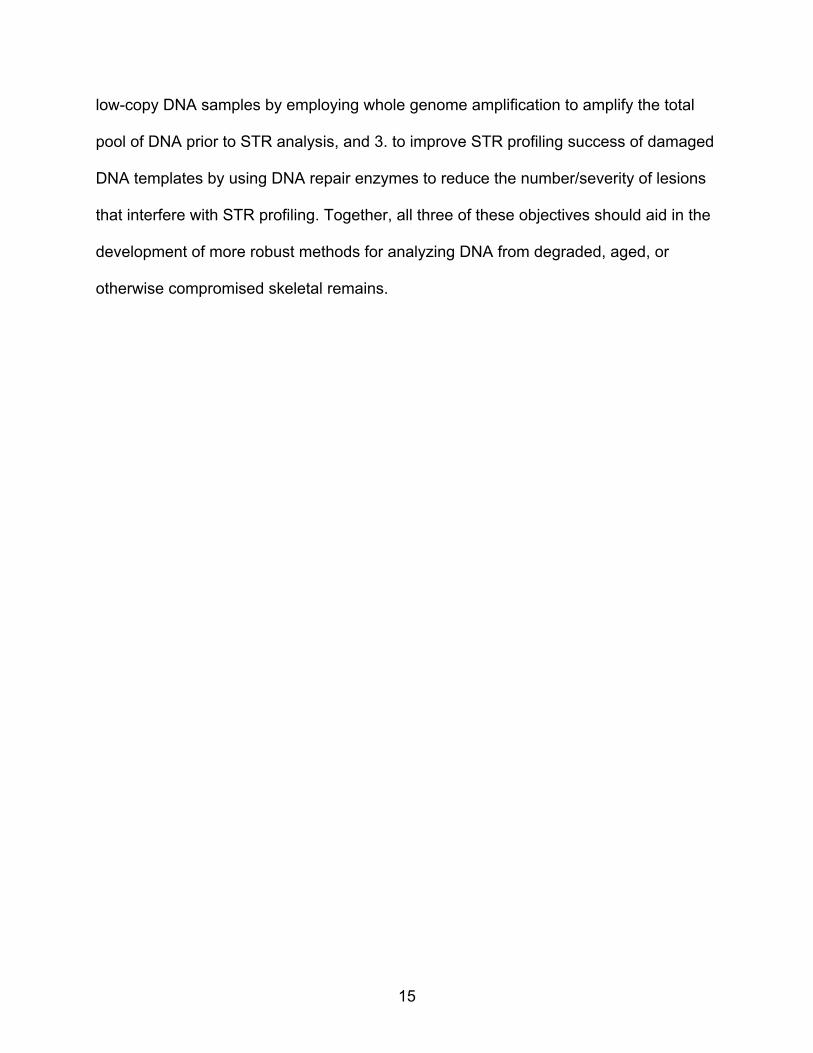
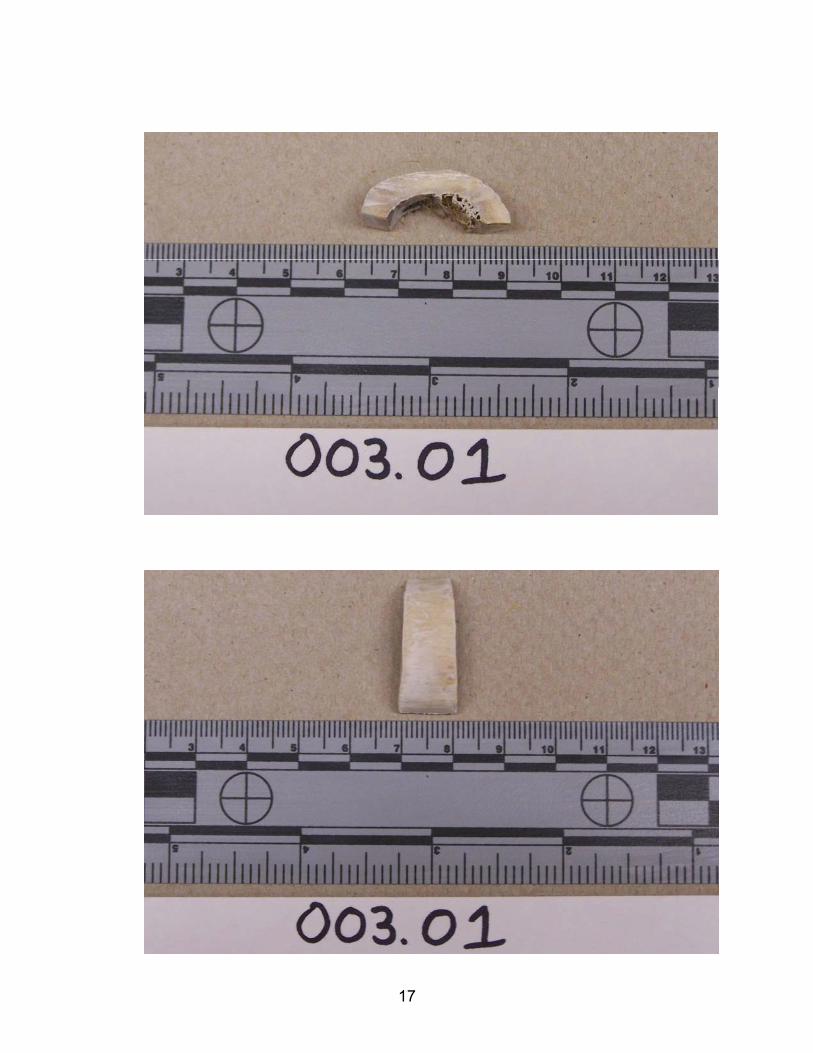
All bone samples were obtained from adult femoral cortical bone. Bones were
sectioned with a Stryker® saw (Stryker Corporation, Kalamazoo, MI) to produce C-
shaped segments weighing from 2 grams (g) to 5 g each. The first two digits (XX.xx.xx)
of the assigned sample number indicate the identity of the whole bone from which the
sample was derived (all “03” samples are from the same bone). The second set of
numbers (xx.XX.xx) refers to the actual section cut from the whole bone, with the 01
being closest to the proximal (hip) end of the femoral shaft (section 03.09.xx is more
proximal than section 03.17.xx). Bone 03 was divided into 48 sections, with odd
numbered sections coming from the anterior face of the femur and even numbered
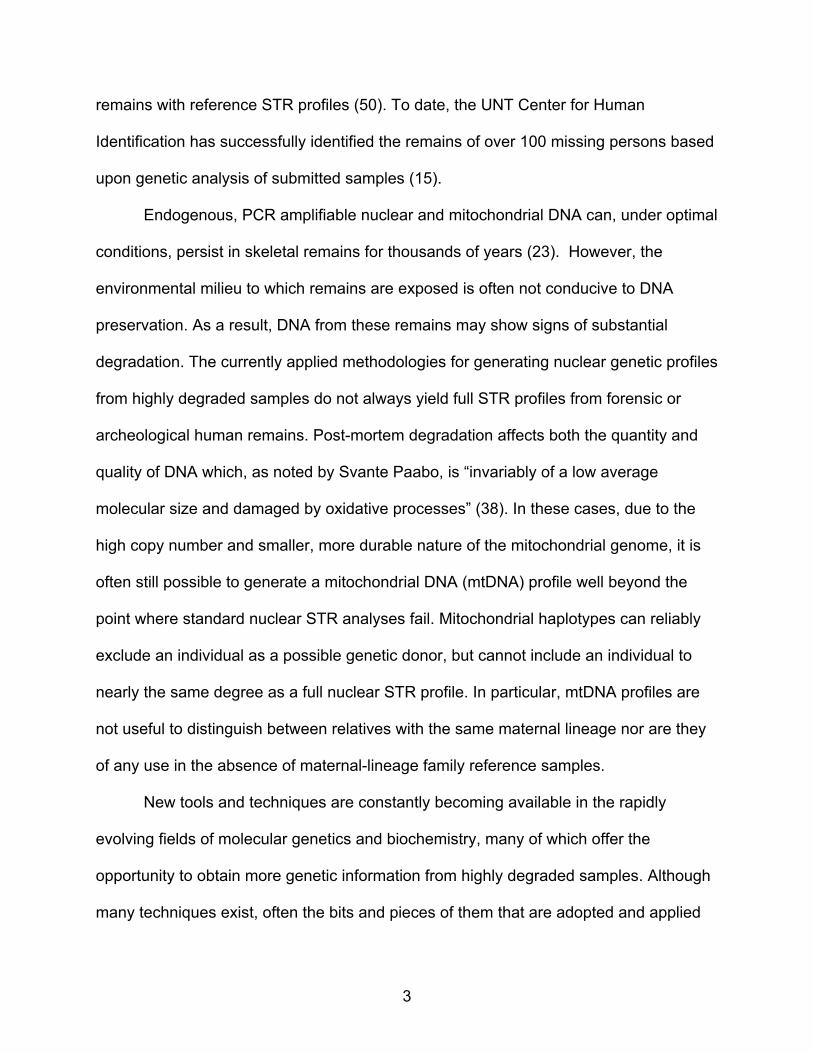
sections coming from the posterior face. Each bone section was photographed to record
the gross morphology of the bone (see Figure 1).
Individual sections were pulverized in one vial during a single grind cycle. Bone
sections too large to be processed in a single grinding tube were noted by assigning a
letter to each batch of ground bone (for example, 03.20A.xx, 03.20B.xx). The third set of
numbers (xx.xx.XX) defines the individual aliquot of the total bone powder obtained from
a single pulverized sample (for example, all 03.09.xx samples were ground
simultaneously and then separated into aliquots to generate samples 03.09.01 through
03.09.04).
16
17

FIG. 1 Representative photographic documentation of bone sections.
18
Bone Surface Decontamination
Surface decontamination was accomplished by either 1) UV irradiation in a CL
1000 Ultraviolet Crosslinker at 254 nanometers (nm), 120 Joules per centimeter
squared (Jcm-2) two times for 5 minutes each, rotating the bone 180° between
exposures or 2) by soaking the bone for 15 minutes in 3% sodium hypochlorite (NaOCl,
commercially available bleach is approximately 6% NaOCl), followed by repeated
rinsing with sterile nuclease-free water as described by Kemp and Smith (22). UV
irradiation is considered a “non-destructive” method, reducing exogenous DNA on the
bone surface without damaging the bone itself. However, this method does nothing to
remove/reduce PCR inhibitors that are often present on bone surfaces. These inhibitors
include humic acid and fulvic acid, which are often seen as a brown color on the surface
of the bone (particularly those that have been exposed to soil or other organic material)
and commonly co-extract with DNA. Immersion for 15 minutes in 3% sodium
hypochlorite, followed by repeated rinsing with sterile DNase/RNase free ddH2O, can
remove not only exogenous DNA but also surface-bound inhibitory compounds. The
primary concern with this method is the risk of endogenous DNA destruction.
Decontaminated bone sections were stored at room temperature in 50 ml conical tubes
prior to pulverization.
19
Bone Pulverization
The bone section (and resulting powder) comes into contact with four
components of the freezer/mill® (SPEX CertiPrep, Metuchen, NJ, www.spexcsp.com)
during pulverization, all of which need to be free of contaminating DNA. Polycarbonate
grinding vials were decontaminated by treating inside and out with a 10% bleach
solution and then allowing the vial to soak for 5-10 minutes. The vial was next rinsed by
liberally spraying with 70% ethanol, followed by 95% ethanol, and finally allowed to air
dry in a clean dead air space. The pair of stainless steel end caps and the impactor
were scrubbed thoroughly with corrosion-inhibited detergent, rinsed with distilled water,
and then treated in the same manner as the grinding vials to ensure removal of
contaminating DNA. Clean, dry vials and stainless steel parts were then sealed in sterile
50 ml conical tubes at room temperature until they were to be used. Individual sets of
two end caps and one impactor were designated and always used together (as a
contamination control measure). Bone sections were ground in a SPEX 6750
freezer/mill at 15 impacts per second for 5 minutes following a 10 minute liquid nitrogen
pre-chill. The resulting bone powder was then weighed and separated into 0.5 g (± 0.02
g) aliquots in sterile 15 ml conical tubes that were stored at -20°C until needed.
20
DNA Extraction
First, a commercially available silica column needed to be selected for further
study. In order to directly compare the efficiency of DNA recovery using the QIAquick®
and QIAamp® (Qiagen Inc., Valencia, CA, www1.qiagen.com) column kits (from 500 µl
of 0.5 M EDTA, 0.5% SDS, 100 µg/ml ProK extraction buffer), known quantities of DNA
were added to the buffer and then recovered following the manufacturer’s directions
with both types of column (39, 40). The QIAquick and QIAamp DNA extraction kits use
different reagents in the DNA binding and washing steps, so this also served to test the
compatibility between the extraction buffer and the Qiagen chemistries (39, 40). Two
DNA sources were used to evaluate both total and size-dependent DNA recovery: λ–
phage DNA digested with HindIII, which consists of seven major fragments (23,130,
9416, 6557, 4361, 2322, 2027, and 564 bp), and a HinfI digestion of the plasmid
pBR322, which includes ten fragments (1631, 516, 506, 396, 344, 298, 221, 220, 154,
and 75 bp). Either 31 or 62.5 ng of λ HindIII DNA was loaded onto each column for
recovery comparisons. Recovery comparisons for pBR322 HinfI DNA used 125 or 250
ng of DNA. Although each of these amounts is larger than the quantity of DNA likely to
be present in 0.5 g of bone powder, these amounts were empirically set to be at the limit
of detection for the smallest fragment in each digestion. Analysis of λ–phage and
pBR322 DNA recovery was accomplished via electrophoresis in Tris-borate/EDTA
(TBE) electrophoresis buffer using 1% and 2% agarose gels, respectively (43). The gels
were stained with 1x SYBR® green (Invitrogen Corporation, Carlsbad, CA,
21
www.invitrogen.com) and the DNA visualized with a Bio-Rad Molecular Imager FX™
(Bio-Rad Laboratories, Hercules, CA, www.bio-rad.com).
Six DNA extraction methods were examined during the completion of this
project; each starting with 0.5 g (± 0.02 g) of bone powder. The first three methods were
silica-based DNA extraction protocols, modified from Yang, Eng et al. (52). These
procedures began with an overnight decalcification and protein digestion. The resulting
slurry was centrifuged to pellet the remaining bone powder, and the supernatant was
processed through a 0.75 ml capacity QIAquick silica column (according to the
manufacturer’s instructions) or through a 20 ml capacity PMB column. The last three
methods coupled organic extraction with ultrafiltration. The HSC/YM100 protocol utilized
two sequential overnight incubations (10). The first incubation decalcified the sample
and the second digested the protein matrix. The final slurry was again centrifuged to
collect undissolved bone powder and the resultant supernatant subjected to organic
extraction. The aqueous phase of the organic extraction was transferred to a Microcon®
YM100 ultrafiltration device (Millipore Corporation, Billerica, MA, www.millipore.com) for
concentration and the DNA eluted in sterile, nuclease-free water. The AFDIL and
modified AFDIL procedures shared the single overnight decalcification and protein
digestion step with the silica-based methods, but the resulting supernatant was then
subjected to organic extraction followed by further purification and volume reduction
using either a Centricon® 30 or one of the Amicon® Ultra-4 ultrafiltration devices
(Millipore Corporation, Billerica, MA, www.millipore.com). Each allotment of powdered
bone generated multiple 0.5 g aliquots, so it was possible to compare the quantity and
22
quality of DNA obtained from each of the techniques using an identical bone powder
substrate.
The QIAquick/1 ml extraction involved single step overnight decalcification and
protein digestion in 1 ml of Yang extraction buffer (YEB - 0.5 M EDTA, 0.5% SDS, 100
µg/ml ProK) at 56°C, followed by DNA recovery via QIAquick silica gel column (as
modified from Yang, Eng et al., 1998) (52). The QIAquick kit makes use of three buffers:
PB buffer contains guanidine hydrochloride and is used to bind the DNA to the silica
bed; PE buffer contains ethanol and is used to wash the undesirable mixture
components from the column; and EB buffer (10 mM Tris-HCl pH 8.5) is the elutant for
the DNA bound to the column (40). Approximately 0.5 g of bone powder was transferred
to a 2 ml screw-cap microcentrifuge tube and 1 ml YEB was added to the bone powder.
The mixture was vortexed thoroughly to suspend the bone powder. The suspension was
incubated at 56°C with constant agitation overnight (up to 24 hours) in a rotating
hybridization oven. The remaining bone powder was pelleted via centrifugation at
12,800 x g for 5 minutes. The supernatant was transferred to a 15 ml conical tube and 5
volumes of PB buffer added. The contents were then mixed well by repeated inversion
(to avoid excessive foaming). In order to bind the DNA to the QIAquick column, 0.75 ml
of sample/PB mixture was added to a column that had been placed in one of the 2 ml
“catch” tubes supplied with the kit. The unit was then centrifuged at 17,900 x g for 1
minute, after which the flow through buffer was discarded. The remainder of the sample
was loaded 0.75 ml at a time, repeating the centrifugation steps until all of the
sample/PB mixture had been passed through the column. The column was then washed
with 0.75 ml PE buffer and centrifuged at 17,900 x g for 1 minute. The binding and
23
washing processes can be accomplished more rapidly by attaching the column to a
vacuum manifold using disposable connectors. The flow-through was discarded and the
column centrifuged once more at 17,900 x g for 1 minute. This “dry” centrifugation step
was necessary to remove residual alcohol. After the “dry” centrifugation, the column
was then transferred to a new 1.5 ml microcentrifuge tube and 50 µl EB buffer (10 mM
Tris-HCl pH 8.5) was added directly to the unit’s silica gel membrane. The column was
now incubated at room temperature for 1 minute and centrifuged at 17,900 x g for 1
minute to collect the eluate in a microcentrifuge tube. The elution step was then
repeated with a fresh microcentrifuge tube. The two elutions were stored separately at -
20°C until further analyzed.
The QIAquick/3 ml extraction method was identical to the QIAquick/1 ml
extraction, except that 3 ml of YEB was used to decalcify and digest the bone powder in
a 15 ml conical tube. The remaining bone powder was pelleted by centrifugation for 5
minutes at 2545 x g. The increased total volume also necessitated the use of a 50 ml
conical tube for the addition of the 5 volumes of PB buffer.
The PMB extraction method used single step overnight decalcification and
protein digestion in 3 ml of Improved Extraction Buffer (IEB - 0.5 M EDTA, 1% sodium
lauroyl sarcosinate, 100 µg/ml ProK). Sodium lauroyl sarcosinate (sarkosyl) was used
instead of sodium dodecyl sulfate (SDS) because sarkosyl is soluble in 0.5 M EDTA at
room temperature, while YEB must be heated before the SDS will fully solubilize. The
QIAquick/1 ml Extraction protocol was then modified to process the sample through the
various PMB column types (40). Remaining bone powder was pelleted by centrifugation
for 5 minutes at 2545 x g. Due to their larger size, the entire volume of crude DNA
24
extract/PB buffer mixture (approximately 18 ml) could be processed with a single
centrifugation step for 10 minutes 2545 x g. The PMB columns were constructed on the
20 ml capacity Proteus™ (AbD Serotec, Raleigh, NC, www.abdirect.com) protein
purification column platform (designed to be seated in a 50 ml conical tube during use),
and contain one of two types of glass fiber filter (A or B). Type B glass fiber is more
densely “woven” than type A. Five types of experimental prototype PMB columns were
used: type A constructed with type A glass fiber filter with one, three, or six layers, and
type B units constructed with type B glass fiber filter with one or three layers. Volumes
of PE wash buffer were initially increased to 1 ml for use with the larger columns. Poor
performance of columns containing multiple layers of glass fiber led to the use of higher
wash volumes and multiple washing steps. A 5 ml wash was investigated as a single
step; as was a 5 ml wash repeated 2 or 3 times (for total wash volumes of 5, 10, or 15
ml, respectively). Collection of the washes was carried out by centrifugation for 5
minutes at 2545 x g, with a final dry column centrifugation in an empty 50 ml conical
tube for 5 minutes at 2545 x g. DNA elution was accomplished using a 100 µl of EB
treatment, which was repeated as many as four times per PMB column, and always with
an extended 5 minute incubation time at 25°C prior to centrifugation for 10 minutes at
2545 x g.
The HSC/YM100 extraction method was the only one to include sequential
overnight decalcification and protein digestion steps, followed by organic extraction and
subsequent volume reduction via Microcon YM100 micro-concentrator (100,000
nominal molecular weight limit) (34). Approximately 0.5 g of bone powder was
transferred to a 1.5 ml microcentrifuge tube and vortexed to suspend the bone powder.
25
The bone powder was decalcified overnight with constant agitation in 1 ml of 0.5 M
EDTA at 25°C. The bone powder was pelleted via centrifugation, at 12,800 x g for 5
minutes, and the EDTA supernatant was discarded. The bone powder was washed
(vortexed and collected by centrifugation) with 1 ml of sterile, nuclease-free water,
which was discarded. The remaining (partially decalcified) bone powder was incubated
with constant agitation in a hybridization oven at 56°C in 600 µl stain extraction buffer
(SEB: 10 mM Tris, 100 mM NaCl, 39 mM DTT, 10 mM EDTA, 2% SDS) to which was
added 20 µg of ProK. Residual bone powder was pelleted by centrifugation at 12,800 x
g for 5 minutes, and the resulting supernatant removed to a clean microcentrifuge tube.
An equal volume of 25:24:1 phenol:chloroform:isoamyl alcohol (PCIA) was added to the
supernatant, the tube briefly vortexed, and centrifuged for 3 minutes at 10,000 x g at
25°C. The organic extraction may be repeated at the technician’s discretion, based
upon the intensity of the extract color. The aqueous layer was transferred to a Microcon
YM100 micro-concentrator. The concentrator was centrifuged at 500 x g for 20 minutes,
400 µl of sterile, nuclease-free water was then added, and the centrifugation step
repeated (34). The sample was then recovered from the device by placing 20-60 µl of
heated sterile, nuclease-free water on the side of the filter opposite the sample and
centrifuging the device upside down in a fresh 1.5 ml microcentrifuge tube for 3 minutes
at 1000 x g (personal communication, Christina Capt (10)).
The AFDIL extraction utilizes a single step overnight decalcification and protein
digestion at 56°C, followed by two rounds of organic extraction with PCIA, a single
butanol extraction, and subsequent volume reduction. First, 0.5 g (± 0.02 g) of bone
powder was transferred to a 15 ml conical tube, then 3 ml AFDIL extraction buffer (0.5
26
M EDTA, 1% sodium lauroyl sarcosinate, 1 mg/ml ProK was added to the bone powder,
and the mixture was vortexed to suspend the bone powder. The suspension was
incubated at 56°C with constant agitation overnight (up to 24 hours) in a hybridization
oven. Organic extraction was performed using an equal volume (3 ml) of PCIA and
vortexing to create a uniform emulsion. This was centrifuged at 650 x g in a swinging
bucket rotor for 3 minutes, and the aqueous layer transferred to a clean 15 ml conical
tube. The organic extraction was repeated a second time with PCIA, followed by an
extraction with butanol. The final aqueous layer was transferred to either a Centricon 30
or one of the Amicon Ultra-4 ultrafiltration devices. Amicon Ultra-4 devices with three
different nominal molecular weight limits (NMWL) were used: 10K (10,000 NMWL), 30K
(30,000 NMWL), and 50K (50,000 NMWL) (33). The ultrafiltration devices were
centrifuged at 650 x g until the level of retentate approximated 50 µl, monitoring the
level at 30 minute intervals to prevent excessive drying of the membrane. At this time, 2
ml of TE was added, and the centrifugation process repeated until the retentate volume
had again dropped to 50 µl. This TE wash step was then repeated. The final
concentrated retentate was then pipetted from the ultrafiltration reservoir into a 1.5 ml
microcentrifuge tube. A 50 µl aliquot of sterile, nuclease-free water was pipetted up and
down in the emptied reservoir to collect any residual sample and this was pooled with
the original retentate to give a final recovered volume of approximately 100 µl (30, 31).
The different ultrafiltration devices varied in the number of 30 minute centrifugation
intervals required to reduce the retained volume to 50 µl, as would be expected due to
the variation in membrane pore size (NMWL) and membrane orientation. The Centricon
30 has a single horizontal membrane, while the Amicon Ultra-4 devices have dual
27
vertical membranes designed to reduce problems associated with clogging. The
Centricon 30 required a total centrifugation time of 6.5 hours, the Ultra-4 10K 6 hours,
and both the 30K and 50K required 4.5 hours.
The modified AFDIL protocol differed from the original AFDIL extraction method
in four ways: pelletization of the bone powder after the overnight digestion step,
reduction of the amount of ProK, an increase in the number and type of organic
extractions, and the number and composition of washes used on the sample in the
ultrafiltration device. The protocol began with single step overnight decalcification and
protein digestion in 3 ml of: 0.5 M EDTA, 1% sodium lauroyl sarcosinate, 100 µg/ml
ProK (IEB) at 56°C and subsequent centrifugation at 650 x g for 10 minutes to clear the
slurry of any remaining bone powder. This was followed by two rounds of PCIA
extraction, one round of chloroform extraction (24:1 chloroform:isoamyl alcohol), a
single butanol extraction, and subsequent volume reduction via Centricon 30 or one of
the Amicon Ultra-4 ultrafiltration devices. The reduced extract was “washed” twice using
2 ml of TE for each device and once with 2 ml of sterile, nuclease-free water.
DNA Quantitation
The initial comparisons of DNA extraction methods were carried out using results
from the Applied Biosystems Quantifiler® (Applied Biosystems Inc., Forster City, CA,
www.appliedbiosystems.com) real-time PCR kit for human DNA quantitation. The
Quantifiler kit uses two TaqMan® probes (Roche Molecular Systems Inc., Alameda, CA,
www.roche.com), one labeled with FAM™ dye (Applied Biosystems Inc., Forster City,
28
CA, www.appliedbiosystems.com) that detects a 62 base pair amplicon from an intron in
the human telomerase reverse transcriptase gene (hTERT, located on the “p” arm of
chromosome 5) and another probe labeled with VIC® dye (Applied Biosystems Inc.,
Forster City, CA, www.appliedbiosystems.com) that detects the amplicon generated as
the internal positive control (IPC) (2). All necessary reaction components required to
generate the IPC amplicon are supplied in the reaction mix, and consist of a synthetic
DNA template and primers complementary to its sequence. The signal generated by the
FAM probe and the hTERT amplicon allows for quantitation of human DNA by
comparison to signals generated from a dilution series of human DNA standards of
known quantity. The IPC reaction runs simultaneously in each tube, and since every
reaction begins with the same amount of synthetic template, differences in the signal
from the IPC reaction can be used to asses the relative levels of inhibitory compounds
in each sample. The same ABI® 7300 real-time PCR system (Applied Biosystems Inc.,
Forster City, CA, www.appliedbiosystems.com) was used for all of the Quantifiler
reactions with a thermal cycling profile of 10 minutes at 95°C (once), followed by 40
cycles of 15 seconds at 95°C, 1 minute at 60°C. A dilution series of 50, 16.7, 5.56,
1.85,0.62, 0.21, 0.068, and 0.023 ng/µl was made from the ABI supplied human DNA
standard and used for each reaction plate. No template controls (NTC) and
independently obtained 1.0 and 0.1 ng reference standards of 9947A female human
control DNA (9947A DNA is commercially produced from lymphoblast cell cultures (26))
were also quantified with each plate. Each bone-derived DNA extract was quantified
using 2 µl of template, 10.5 µl of primer mix, and 12.5 µl of PCR reaction mix (as per the
manufacturer’s instructions) and performed in duplicate. Standard STR typing with
29
Profiler Plus™ ID (Applied Biosystems Inc., Forster City, CA,
www.appliedbiosystems.com) followed quantitation.
Whole Genome Amplification
There are a wide variety of reasons why a sample would yield an incomplete
STR profile or no profile at all. These include the failure of reaction
conditions/components other than the DNA extract, the presence of high levels of
inhibitory compounds, insufficient DNA resulting in STR profile failure, and DNA
degraded to the point that the number of full length templates becomes limiting
(especially at larger amplicons). The latter two situations may be improved through the
use of whole genome amplification (WGA), although problems with genome coverage
are known to increase substantially as WGA is used in an attempt to compensate for
problems associated with template quantity and quality (6). The REPLI-g® whole
genome amplification kit (Qiagen Inc., Valencia, CA, www1.qiagen.com) is based on
multiple displacement amplification (MDA) using the Phi 29 polymerase and
exonuclease-resistant primers. The DNA is isothermally amplified with MDA. Only a
single denaturation step is required, as subsequent strand displacement activity of the
polymerase continuously generates single-stranded template DNA.
The REPLI-g protocol restricts the user to a single microliter of template DNA,
and is optimized for >10 ng of DNA. For many of the forensic applications where WGA
would be most useful, a 10 ng/µl concentration of sample DNA is unrealistic and a total
of 10 ng is more than is generally required for genetic analysis. In order to determine
30
the efficacy of the protocol under conditions likely to be encountered using bone-derived
DNA, 1 µl of DNA extract was added “as is”. The total quantity of DNA added as
template ranged from 0.0043 ng to 0.0875 ng. Prior to MDA, initial denaturation of the
template DNA would typically be accomplished by “melting” the DNA at 94-95°C.
However, the REPLI-g kit utilized chemical denaturation with 1 µl of the potassium
hydroxide-based buffer D1 for 3 minutes at room temperature, after which the solution
was neutralized with 2 µl of buffer N1. The denatured template was then combined with
15 µl REPLI-g ultrafast reaction buffer and 1 µl REPLI-g ultrafast DNA polymerase. All
WGA reactions were incubated in a thermal cycler at 30°C for 90 minutes, after which
the polymerase was heat inactivated at 65°C for 3 minutes. The reactions were then
stored on ice (or stored at -20°C) until they could be incorporated into STR typing
reactions using Profiler Plus ID.
DNA Repair
Two DNA repair cocktails were investigated. The first was the commercially
available PreCR™ repair mix (cocktail A) (New England Biolabs, Ipswitch, MA,
www.neb.com), which contains Taq DNA ligase, endonuclease IV, Bst DNA
polymerase, 8-oxoguanine DNA glycosylase (fpg), uracil-DNA glycosylase (UDG), T4
endonuclease V (T4 PDG), and endonuclease VIII. The second was the PreCR T6
repair mix (T6 cocktail), for which the precise makeup has not yet been disclosed, as it
is still in the research and development phase at New England Biolabs (NEB). Cocktail
A is marketed as a multipurpose DNA repair kit, and the T6 cocktail has been
31
recommended for use on bone-derived DNA (14). The manufacturer recommends using
50-500 ng of template DNA in a 50 µl repair reaction. For the purposes of this project,
the input was reduced to 0.066-1.34 ng of DNA in a 20 µl repair reaction. The reaction
composition was the same for both cocktails: 1x NEB ThermoPol buffer, 100 µM NEB
dNTPs, 1x NEB NAD+, 1x NEB BSA, and the maximum volume of DNA possible (15.32
µl of extract, which contained 0.066-1.34 ng DNA, depending on the sample). The repair
reaction was carried out for 20 minutes at 37°C with cocktail A, and for 30 minutes at
room temperature with the T6 cocktail. Afterwards, the reactions were placed on ice (or
stored at -20°C) in preparation for use in STR typing with Profiler Plus ID.
Genetic Analysis
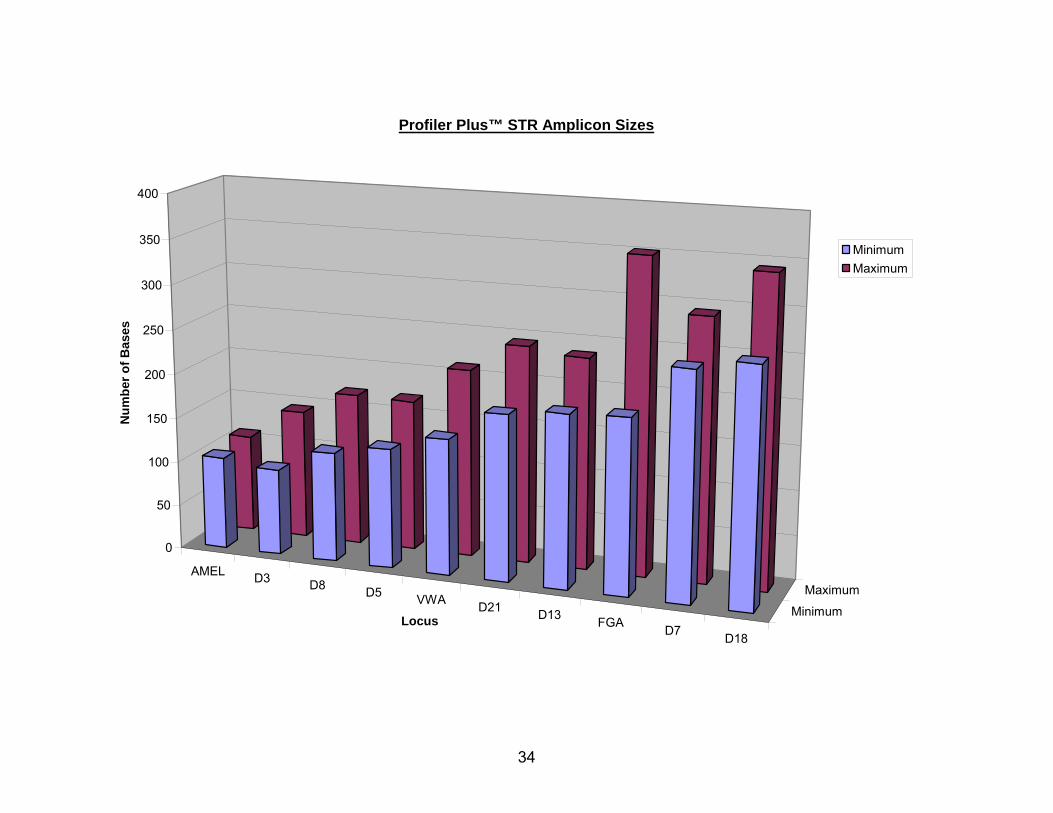
All DNA preparations that contained quantifiable amounts of human DNA were
subjected to STR profiling with Profiler Plus ID prior to any subsequent manipulation.
Although normally combined with COfiler™ (Applied Biosystems Inc., Forster City, CA,
www.appliedbiosystems.com) to generate a full thirteen-locus profile, Profiler Plus ID by
itself is a cost-effective method for screening DNA extracts for “profilability” and success
at these nine loci is predictive for success at the remaining four COfiler specific loci. The
9 autosomal loci represented in the Profiler Plus multiplex are: D3S1358 (D3), a mixture
of [TCTA] and [TCTG] repeats on the p arm of chromosome 3 (28); D8S1179 (D8), a
combination of [TCTA] and [TCTG] repeats on the q arm of chromosome 8 (37);
D5S818 (D5), an [AGAT] tetranucleotide repeat on the q arm of chromosome 5 (20);
von Willebrand factor type A (vWA), a complex [TCTA] [TCTG] [TCCA] repeat region
32
33
located in the 40th intron of the vWA gene near the terminus of the q arm of
chromosome 21 (24); D21S11 (D21), an often imperfect [TCTA] [TCTG] repeat on the q
arm of chromosome 21 (44); D13S317 (D13), a [TATC] repeat on the q arm of
chromosome 13 that can also include an [AATC] repeat (20); alpha fibrinogen (FGA), a
complex [TTTC]3TTTTTTCT[CTTT]nCTCC[TTCC]2 tetranucleotide repeat located in the
3rd intron of the FGA gene on the q arm of chromosome 4 (35); D7S820 (D7), a [GATA]
repeat on the q arm of chromosome 7 (17); and D18S51 (D18), an [AGAA] repeat on
the q arm of chromosome 18 (51). The amelogenin locus (AMEL) is also included for
gender determination, though it is not actually an STR locus. The AMEL gene occurs on
both the X and Y chromosomes, but the copy on the X chromosome has a six base pair
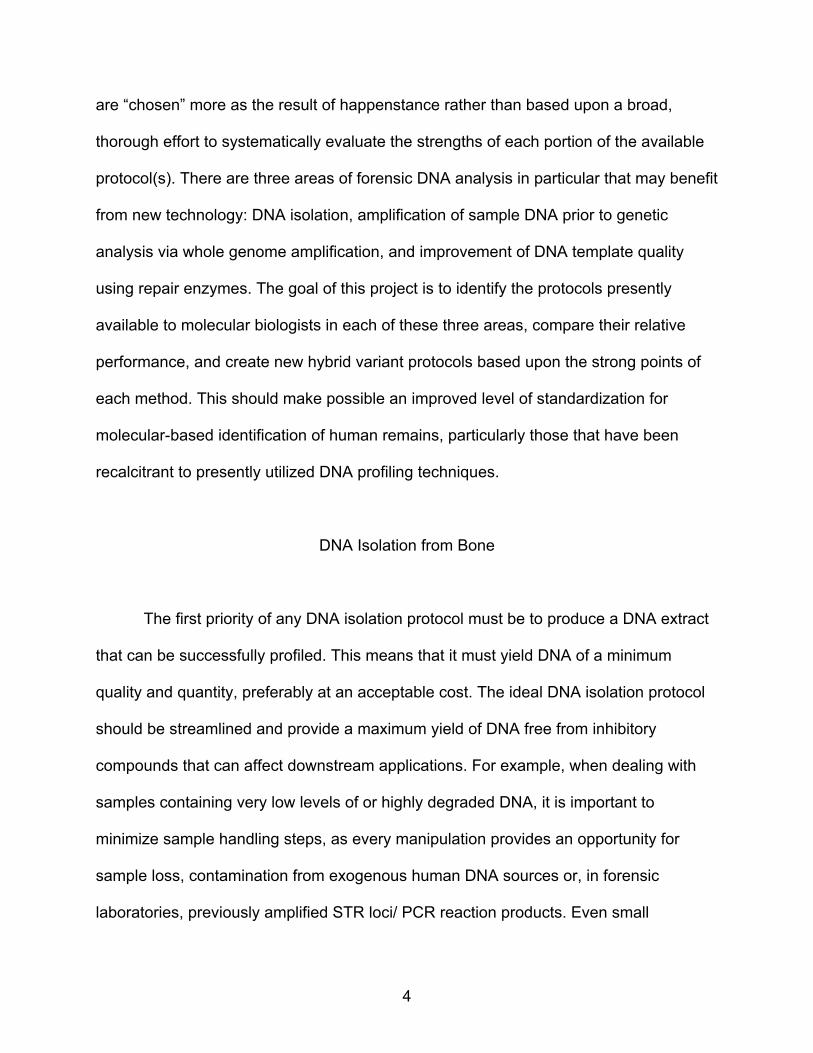
deletion that allows for discrimination between the amplicons (46). See Figure 2 for the
range of amplicon sizes generated by Profiler Plus ID.
AMEL D3 D8 D5 VWA D21 D13 FGA D7 D18
Minimum
Maximum
0
50
100
150
200
250
300
350
400
Num
ber o
f Bas
es
Locus
Profiler Plus™ STR Amplicon Sizes
MinimumMaximum
34
FIG. 2 The range of amplicon sizes possible at each locus when using the Profiler Plus
ID multiplex.
35
The standard protocol for STR typing with Profiler Plus ID uses a master mix
containing 21 µl AmpFℓSTR® (Applied Biosystems Inc., Forster City, CA,
www.appliedbiosystems.com) Profiler Plus PCR reaction mix, 1 µl AmpliTaq Gold®
(Applied Biosystems Inc., Forster City, CA, www.appliedbiosystems.com) and 11 µl
AmpFℓSTR Profiler Plus Primer set for each sample to be run. This formulation includes
3 µl of overrun per sample, as only 30 µl of master mix should be added to 20 µl DNA
plus water (1). In order to double the number of samples that could be typed from a
single kit, all of these amounts were halved to yield a total volume of 25 µl per reaction.
The manufacturer recommended thermal cycling parameters are 11 minutes at 95°C
(once), followed by 28 cycles of 1 minute at 94°C, 1 minute at 59°C, 1 minute at 72°C.
The 28 cycles of denaturing, annealing, and extending is followed by an unusually long
final extension step of 45 minutes at 60°C, and a hold at either 25°C or 10°C (25°C if
the samples were to be left in the thermal cycler for less than 18 hours, 10°C if they
were to be left longer) (1). In order to compensate for the low copy number and
degradation of the DNA templates, the number of cycles was increased from 28 to 32
for all Profiler Plus ID reactions (10). All DNA extracts that could be successfully
quantified with Quantifiler were subjected to STR typing with Profiler Plus ID (in
triplicate) prior to other manipulations. The quantity of extract added varied with DNA
concentration, with the goal to add 0.5-1 ng DNA total. Some DNA extracts were so
dilute that even 10 µl maximum was still significantly less than 0.5 ng of DNA in the
reaction. However, this is a common problem with bone-derived as well as other
forensic DNA samples, and these extracts were included as representative of the low
DNA copy numbers often encountered in casework.
36
CHAPTER 3
RESULTS
DNA Extraction
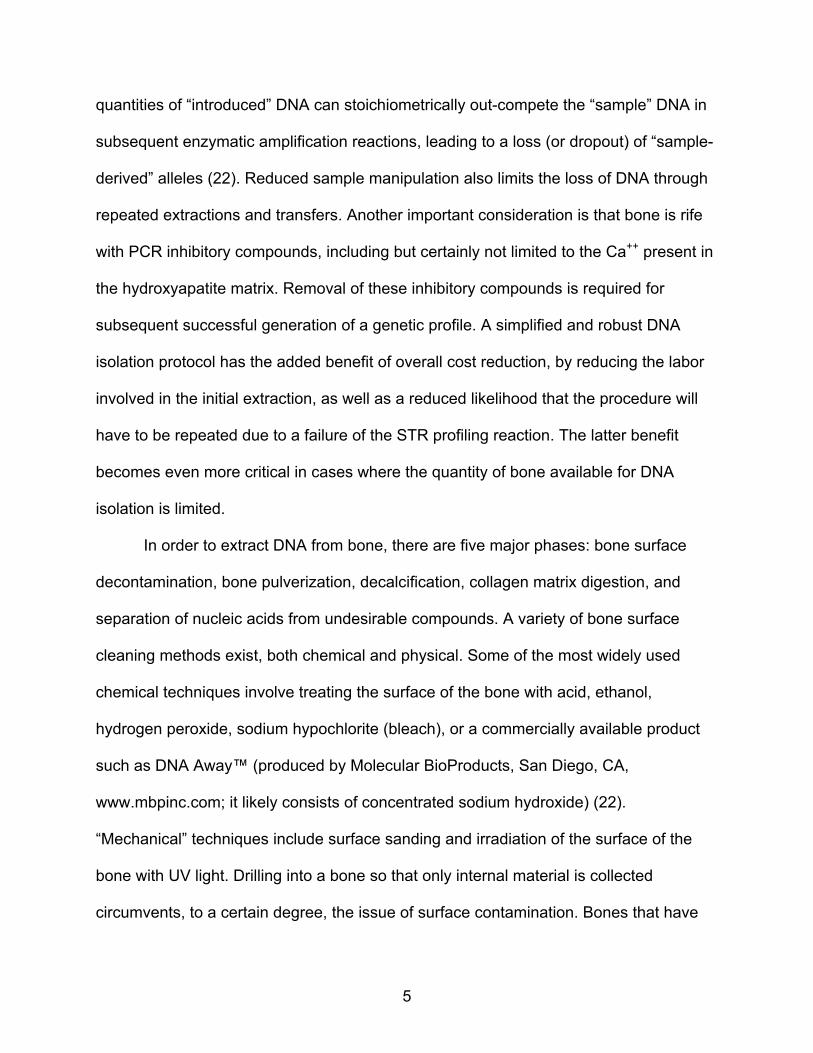
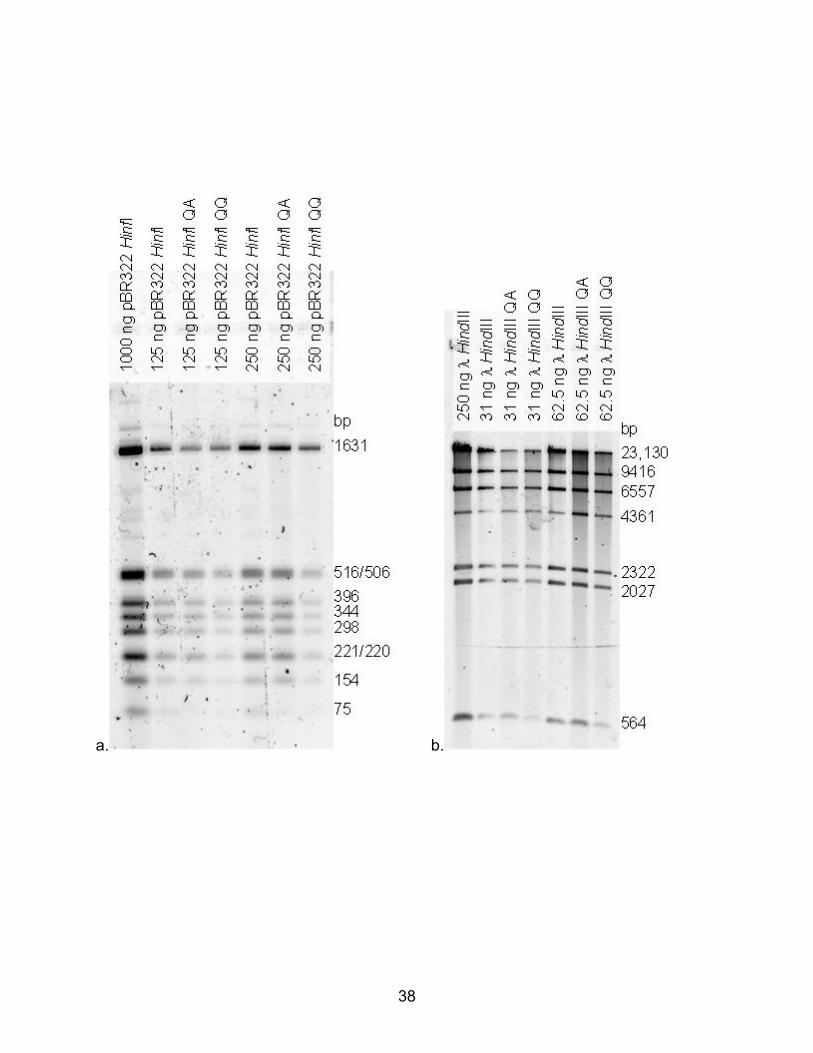
Initial comparisons of the performance of the QIAquick® (QQ) and QIAamp® (QA)
DNA extraction kits (Qiagen Inc., Valencia, CA, www1.qiagen.com) using pBR322 HinfI
and λ HindIII DNA showed no substantial bias for retention or loss of DNA fragments
based upon size. Although, the smaller DNA fragments became more difficult to
visualize as total recovered DNA decreased (see Fig. 3a and 3b for representative gel
photos); this simply reflected the lower initial signal for these fragments. This effect was
particularly evident for the 75 bp band as seen in Figure 3a. The reagents for both
columns were compatible with the YEB extraction buffer. The DNA recovered from the
QIAamp columns was closer in band intensity to the unprocessed DNA. Even though
the buffers/reagents were themselves compatible in mock extractions, the addition of
ethanol (after the guanidine hydrochloride binding buffer AL was added, as per the
QIAamp kit protocol (39)) caused an interesting problem with YEB after decalcification
and protein digestion of bone powder. The load of calcium carried by the buffer rapidly
precipitated (likely as calcium phosphate) upon addition of the ethanol, causing the
entire sample to solidify. This occurred even when the sample and ethanol were
preheated to 56°C, and somewhat surprisingly this problem could not be overcome by
further dilution of the sample with water. As a result, QIAquick columns were used for all
subsequent DNA extractions with a commercially available silica column.
37
a. b.
38
FIG. 3. Comparison of recovery of known DNA quantities and size standards (HinfI
digested pBR322 and HindIII digested λ phage) with the QIAamp® (QA) and QIAquick®
(QQ) columns. A) Electrophoresis was carried out using 2% agarose in TBE at 100
volts. Gel was stained with SYBR green and recorded using a BioRad® Molecular
Imager FX™. B). Conditions as in A, but gel composed of 1% agarose. Lanes labeled
only HinfI or HindIII are untreated samples, lanes labeled QA show samples using
QIAamp® protocol and lanes labeled QQ isolated using the QIAquick® protocol.
39
Quantitation
The Quantifiler® (Applied Biosystems Inc., Forster City, CA,
www.appliedbiosystems.com) results provided two types of data: human DNA
quantitation (in ng/µl), which was then multiplied by the volume of extract recovered to
give total DNA recovery in nanograms (ng), and internal positive control (IPC) cycle
threshold (CT) values that are relative to the progress of a DNA amplification reaction
and does not involve external template DNA. The presence of inhibitors in the reaction
will often increase the IPC CT, because the reaction (with inhibition) requires a greater
number of cycles to reach the set amplification threshold. Since IPC CT values should
only be directly compared within the same Quantifiler run, all IPC values for bone
extracts are presented as the difference between the sample IPC CT and the average of
the IPC CT values of DNA standards from the same run. If the IPC CT shows a positive
shift, then inhibition is probable.
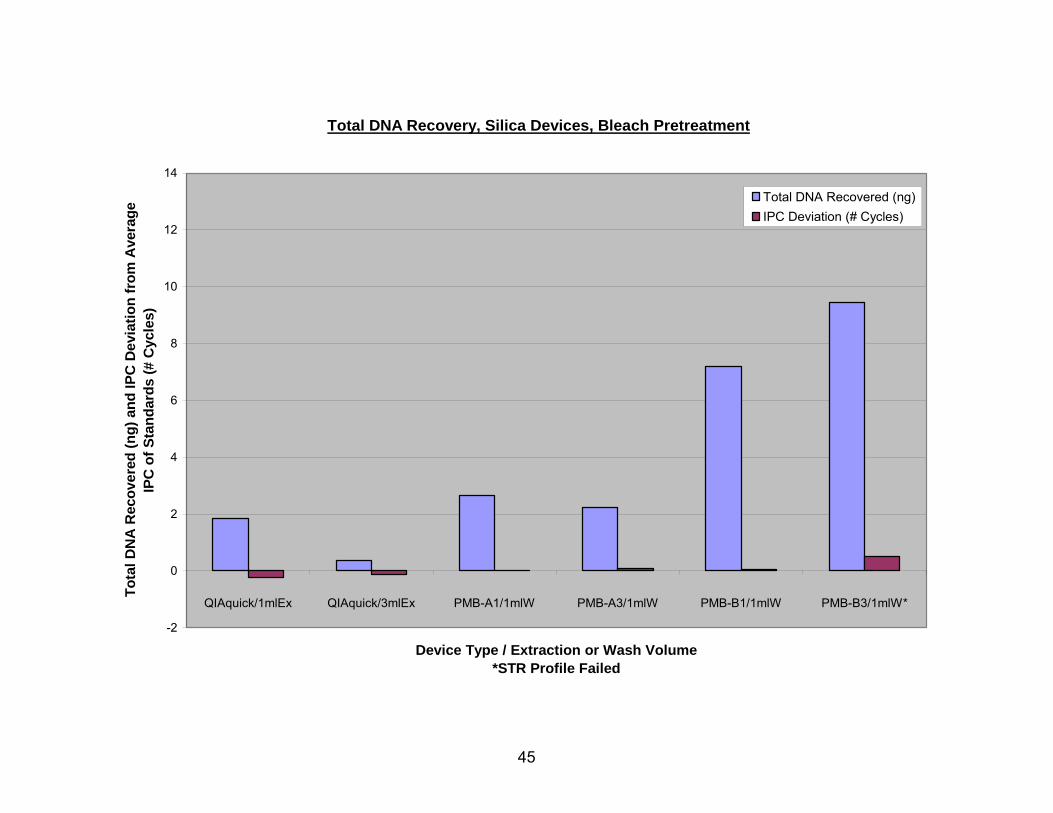
Of the silica devices, the QIAquick columns recovered the least DNA (0.3 ng for
a 3 ml extraction and 1.8 ng for a 1 ml extraction), but also had negative shifts in IPC CT
values, indicating that there were fewer inhibitors in these samples than were present in
the ABI standards. As noted earlier, PMB column descriptions are given as the type of
glass fiber (A or B), followed by the number of layers of glass fiber (1, 3, or 6). The glass
fiber type B columns with three layers (B3) recovered the most DNA (from 7.8-9.8 ng),
but often had positive shifts in the IPC CT values. The other PMB columns varied
considerably in DNA recovery and IPC CT shifts depending upon the sample
pretreatment method utilized, the number of washes with PE buffer, and the number of
40
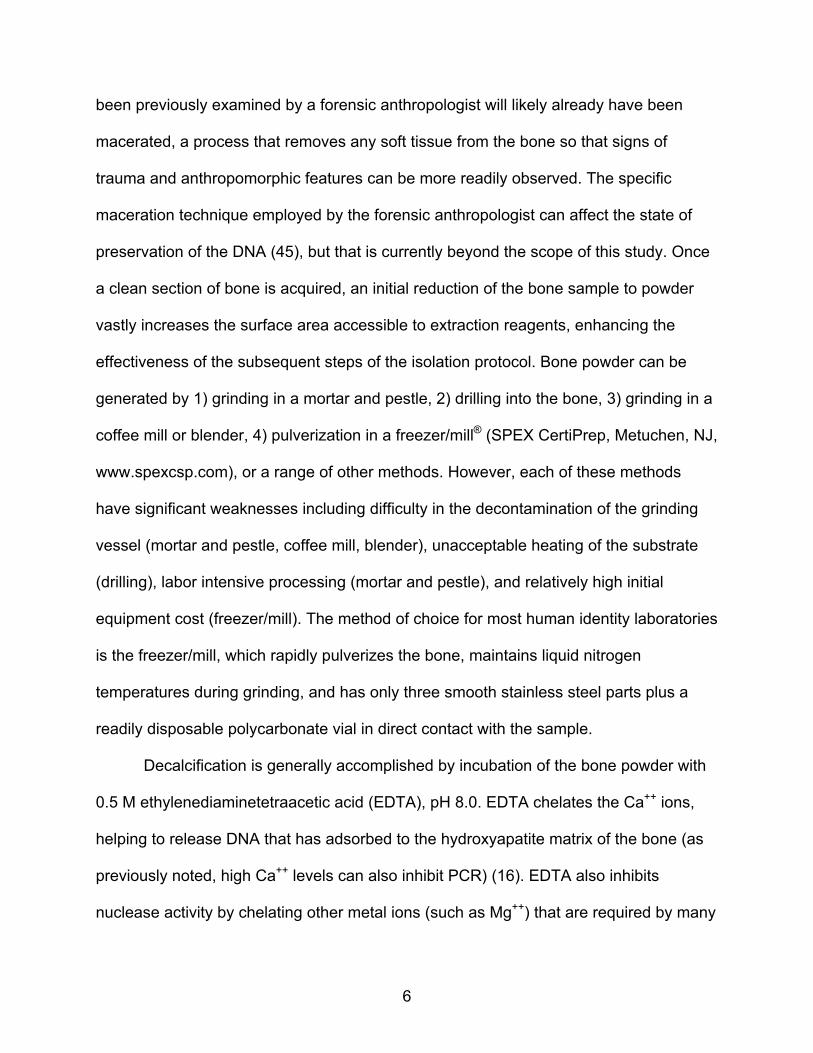
elutions (see Fig. 4-7). Figure 4 shows estimated DNA recoveries from bleach
pretreated bone using various silica devices. The QIAquick/1 ml Ex. used 1 ml of YEB,
and the QIAquick/3 ml Ex. used 3 ml of YEB. All four types of PMB column extractions
started with 3 ml of IEB and were washed with a single 1 ml aliquot of buffer PE. The
DNA recovered by the QIAquick columns was found in the first elution only, and all
subsequent elutions did not yield quantifiable amounts of DNA. The quantity given as
DNA recovered from the PMB columns is the sum of DNA recovered in the first and
second elutions which both contained measurable amounts of DNA. While three layers
of type B glass fiber captured by far the most DNA, this type of column also had the
greatest IPC CT deviation.
Figure 5 shows estimated DNA recovery from UV pretreated bone with various
silica devices. The QIAquick/1 ml Ex. used 1 ml of YEB, and the QIAquick/3 ml Ex. used
3 ml of YEB. All four types of PMB column extractions started with 3 ml of IEB and were
washed with either a 1 ml aliquot of buffer PE (1 ml W), a 5 ml aliquot of buffer PE (5 ml
W), 2 separate 5 ml aliquots of buffer PE (10 ml W), or 3 separate 5 ml aliquots of buffer
PE (15 ml W). Again, the DNA recovered by the QIAquick columns was found only in
the first elution and the DNA recovered from the PMB columns is the sum of DNA
recovered in the first and second elutions. While three layers of type B glass fiber again
captured by far the most DNA, it continued to have the greatest IPC CT deviation,
regardless of the number of washes. It is of particular interest to note that the type A
glass fiber with 6 layers recovered the second largest quantity of DNA, and this sample
exhibited a negative shift in the IPC CT value when washed 3 times.
41
Figure 6 demonstrates that DNA was recovered in four sequential elutions (E1,
E2, E3, E4) from PMB columns A1, A3, B1, and B3. All columns were washed with a
single 5 ml aliquot of PE buffer. PMB column descriptions are given as the type of glass
fiber (A or B), followed by the number of layers of glass fiber (1 or 3), followed by the
elution number (i.e. first elution from 1 layer of type A fiber would be A1/E1). PMB
column A1 bound very little DNA to begin with, and all of it was released in the first 100
µl elution. PMB columns A3 and B1 released about 2/3 of the total DNA in the first
elution, with the other third to follow in elution 2 for column A3 and elutions 2 and 3 for
column B1. Column B3 released only half of the total DNA in the first elution, and the
majority of the remaining DNA eluted in the second and third. Thus, in general,
additional layers of glass fiber filter gave the column additional capacity but required
additional elution steps to recover the DNA.
The estimated DNA recovered in four elutions (E1, E2, E3, E4) from PMB
columns A3, A6, and B3 is shown in Figure 7. Column descriptions are given as the
type of glass fiber (A or B), followed by the number of layers of glass fiber (3 or 6),
followed by the number of times that column was washed with 5 ml of PE buffer (2 or 3),
followed by the elution number (i.e. the first elution from 3 layers of type A fiber washed
twice would be A3(2) E1). Regardless of the number of washes, the B3 columns
captured the largest amount of DNA but also had the largest positive shifts in IPC CT
values. However, the IPC CT values did improve in subsequent elutions. The most
promising balance of high DNA recovery coupled with a negative shift in IPC CT value
was seen with column A6 when washed with 3 x 5 ml of PE buffer. It should be noted
42
that multiple elution steps were performed on all silica devices, but only the PMB
columns had quantifiable DNA in elutions two through four.
The HSC/YM100 protocol using the Microcon® YM100 ultrafiltration device
(Millipore Corporation, Billerica, MA, www.millipore.com) recovered the least DNA (~2
ng), but as was seen with the QIAquick® columns, had negative shifts in IPC CT values.
All other ultrafiltration devices recovered between 6 and 12 ng of DNA, and had positive
IPC CT shifts of 1-3.5 cycles (see Fig. 8, 9). Figure 8 shows estimated DNA recovery
from bleach pretreated bone using Amicon® ultrafiltration devices (Millipore Corporation,
Billerica, MA, www.millipore.com). These included the Microcon YM100 (nominal
molecular weight limit of 100,000), Centricon® 30 (nominal molecular weight limit of
30,000) (Millipore Corporation, Billerica, MA, www.millipore.com), and the Amicon Ultra-
4 ultrafiltration devices with three different nominal molecular weight limits (NMWL) 10K
(10,000 NMWL), 30K (30,000 NMWL), and 50K (50,000 NMWL). The Amicon Ultra-4
devices with 30K and 50K NMWL recovered the largest amount of DNA, followed by the
Centricon 30, Ultra-4 10K NMWL, and the YM100. With the exception of the YM100 (on
bleach pretreated bone), the use of all ultrafiltration devices resulted in sizeable positive
shifts in the IPC CT values ranging from 0.75 to 3.5 cycles. Of these, the Ultra-4 50K
had the smallest shift in IPC CT value.
Figure 9 demonstrates estimated DNA recovery from UV pretreated bone using
Amicon ultrafiltration devices. The Amicon Ultra-4 device with the 50K NMWL recovered
the largest amount of DNA, followed by the Ultra-4 30K, Centricon 30, Ultra-4 10K
NMWL, and the YM100. With UV pretreated bone, all ultrafiltration devices yielded DNA
that exhibited large positive shifts in IPC CT values. Of the ultrafiltration devices, the
43

44
YM100 and the Ultra-4 50K had the smallest positive shifts in IPC CT value when used
to extract DNA from UV pretreated bone.
Total DNA Recovery, Silica Devices, Bleach Pretreatment
-2
0
2
4
6
8
10
12
14
QIAquick/1mlEx QIAquick/3mlEx PMB-A1/1mlW PMB-A3/1mlW PMB-B1/1mlW PMB-B3/1mlW*
Device Type / Extraction or Wash Volume*STR Profile Failed
Tota
l DN
A R
ecov
ered
(ng)
and
IPC
Dev
iatio
n fr
om A
vera
ge
IPC
of S
tand
ards
(# C
ycle
s)
Total DNA Recovered (ng)IPC Deviation (# Cycles)
45
46
FIG. 4 DNA recovery from bleach pretreated samples using silica-based devices,
estimated with Quantifiler. The QIAquick/1 ml Ex. used 1 ml of YEB, and the QIAquick/3
ml Ex. used 3 ml of YEB. All four types of PMB column extractions started with 3 ml of
IEB and were washed with a 1 ml aliquot of buffer PE.
QIAquick/1 ml Ex – bone powder digested with 1 ml Yang extraction buffer, recovered with QIAquick
column, washed with 0.75 ml PE buffer
QIAquick/3 ml Ex – bone powder digested with 3 ml Yang extraction buffer, recovered with QIAquick
column, washed with 0.75 ml PE buffer
PMB-A1 – bone powder digested with 3 ml improved extraction buffer, recovered with 20 ml PMB column
containing 1 layer of type A glass fiber
PMB-A3 – bone powder digested with 3 ml improved extraction buffer, recovered with 20 ml PMB column
containing 3 layers of type A glass fiber
PMB-B1 – bone powder digested with 3 ml improved extraction buffer, recovered with 20 ml PMB column
containing 1 layer of type B glass fiber
PMB-B3 – bone powder digested with 3 ml improved extraction buffer, recovered with 20 ml PMB column
containing 3 layers of type B glass fiber
1 ml W – washed with 1 ml PE buffer
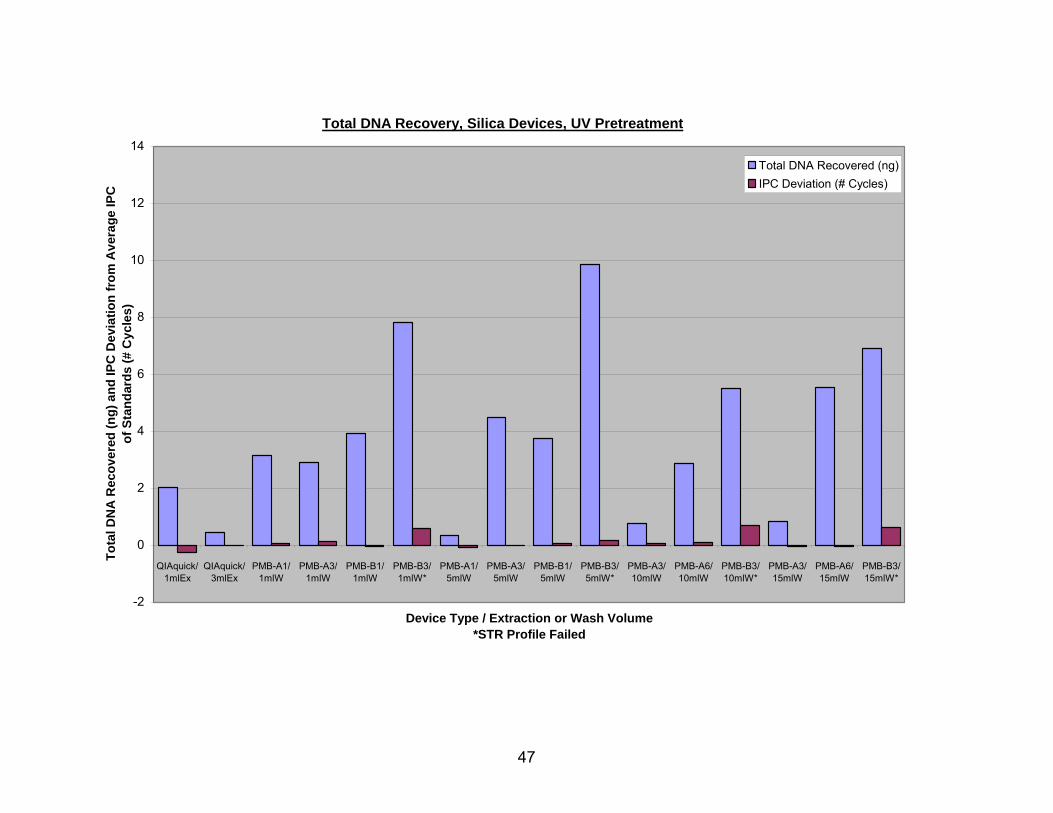
Total DNA Recovery, Silica Devices, UV Pretreatment
-2
0
2
4
6
8
10
12
14
QIAquick/1mlEx
QIAquick/3mlEx
PMB-A1/1mlW
PMB-A3/1mlW
PMB-B1/1mlW
PMB-B3/1mlW*
PMB-A1/5mlW
PMB-A3/5mlW
PMB-B1/5mlW
PMB-B3/5mlW*
PMB-A3/10mlW
PMB-A6/10mlW
PMB-B3/10mlW*
PMB-A3/15mlW
PMB-A6/15mlW
PMB-B3/15mlW*
Device Type / Extraction or Wash Volume*STR Profile Failed
Tota
l DN
A R
ecov
ered
(ng)
and
IPC
Dev
iatio
n fr
om A
vera
ge IP
C
of S
tand
ards
(# C
ycle
s)
Total DNA Recovered (ng)IPC Deviation (# Cycles)
47
48
FIG. 5 DNA recovery from UV pretreated samples using silica-based devices, estimated
with Quantifiler. The QIAquick/1 ml Ex. used 1 ml of YEB, and the QIAquick/3 ml Ex.
used 3 ml of YEB. All four types of PMB column extractions started with 3 ml of IEB and
were washed with either a 1 ml aliquot of buffer PE (1 ml W), a 5 ml aliquot of buffer PE
(5 ml W), 2 separate 5 ml aliquots of buffer PE (10 ml W), or 3 separate 5 ml aliquots of
buffer PE (15 ml W).
QIAquick/1 ml Ex – bone powder digested with 1 ml Yang extraction buffer, recovered with QIAquick
column, washed with 0.75 ml PE buffer
QIAquick/3 ml Ex – bone powder digested with 3 ml Yang extraction buffer, recovered with QIAquick
column, washed with 0.75 ml PE buffer
PMB-A1 – bone powder digested with 3 ml improved extraction buffer, recovered with 20 ml PMB column
containing 1 layer of type A glass fiber
PMB-A3 – bone powder digested with 3 ml improved extraction buffer, recovered with 20 ml PMB column
containing 3 layers of type A glass fiber
PMB-B1 – bone powder digested with 3 ml improved extraction buffer, recovered with 20 ml PMB column
containing 1 layer of type B glass fiber
PMB-B3 – bone powder digested with 3 ml improved extraction buffer, recovered with 20 ml PMB column
containing 3 layers of type B glass fiber
1 ml W – washed with 1 ml PE buffer
5 ml W – washed with 5 ml PE buffer
10 ml W – washed with 2 aliquots PE buffer, 5 ml each
15 ml W – washed with 3 aliquots PE buffer, 5 ml each
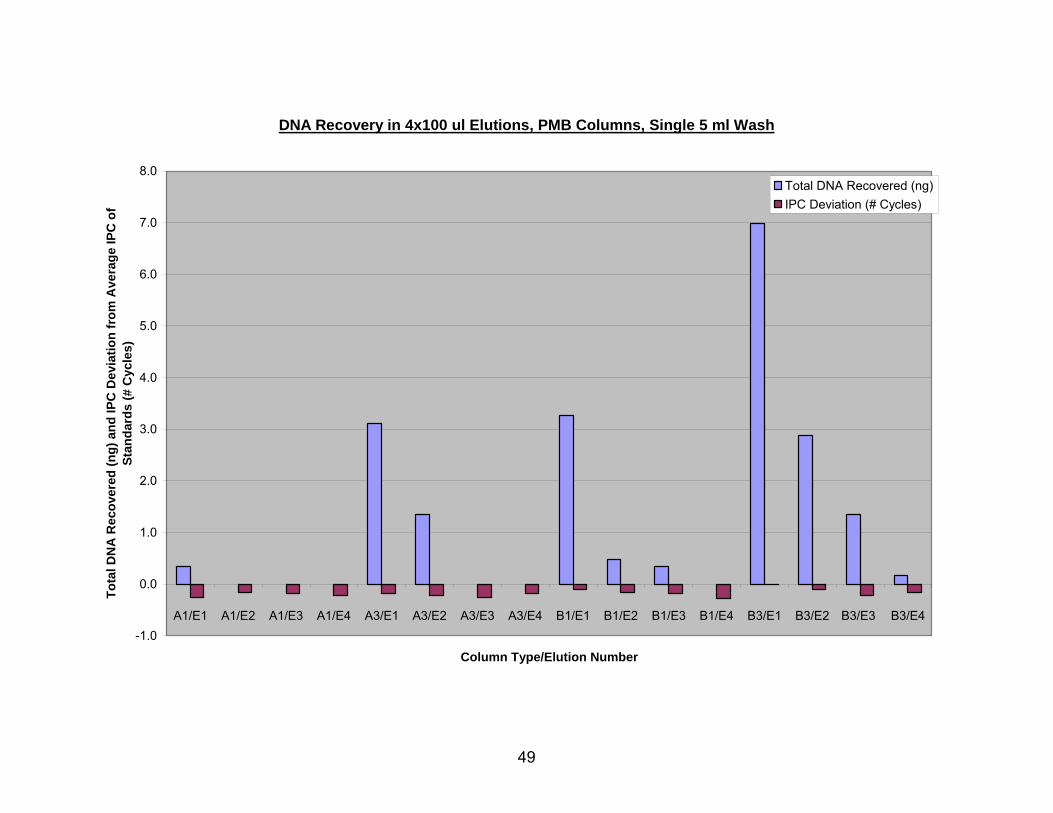
DNA Recovery in 4x100 ul Elutions, PMB Columns, Single 5 ml Wash
-1.0
0.0
1.0
2.0
3.0
4.0
5.0
6.0
7.0
8.0
A1/E1 A1/E2 A1/E3 A1/E4 A3/E1 A3/E2 A3/E3 A3/E4 B1/E1 B1/E2 B1/E3 B1/E4 B3/E1 B3/E2 B3/E3 B3/E4
Column Type/Elution Number
Tota
l DN
A R
ecov
ered
(ng)
and
IPC
Dev
iatio
n fr
om A
vera
ge IP
C o
f St
anda
rds
(# C
ycle
s)
Total DNA Recovered (ng)IPC Deviation (# Cycles)
49
50
FIG. 6 DNA recovery from four elutions (E1, E2, E3, E4) from PMB columns A1, A3, B1,
and B3, estimated with Quantifiler. All columns were washed with a single 5 ml aliquot
of PE buffer. PMB column descriptions are given as the type of glass fiber (A or B),
followed by the number of layers of glass fiber (1 or 3), followed by the elution number.
A1 – bone powder digested with 3 ml improved extraction buffer, recovered with 20 ml PMB column
containing 1 layer of type A glass fiber
A3 – bone powder digested with 3 ml improved extraction buffer, recovered with 20 ml PMB column
containing 3 layers of type A glass fiber
B1 – bone powder digested with 3 ml improved extraction buffer, recovered with 20 ml PMB column
containing 1 layer of type B glass fiber
B3 – bone powder digested with 3 ml improved extraction buffer, recovered with 20 ml PMB column
containing 3 layers of type B glass fiber
E1 – First 100 µl elution
E2 – Second 100 µl elution
E3 – Third 100 µl elution
E4 – Fourth 100 µl elution
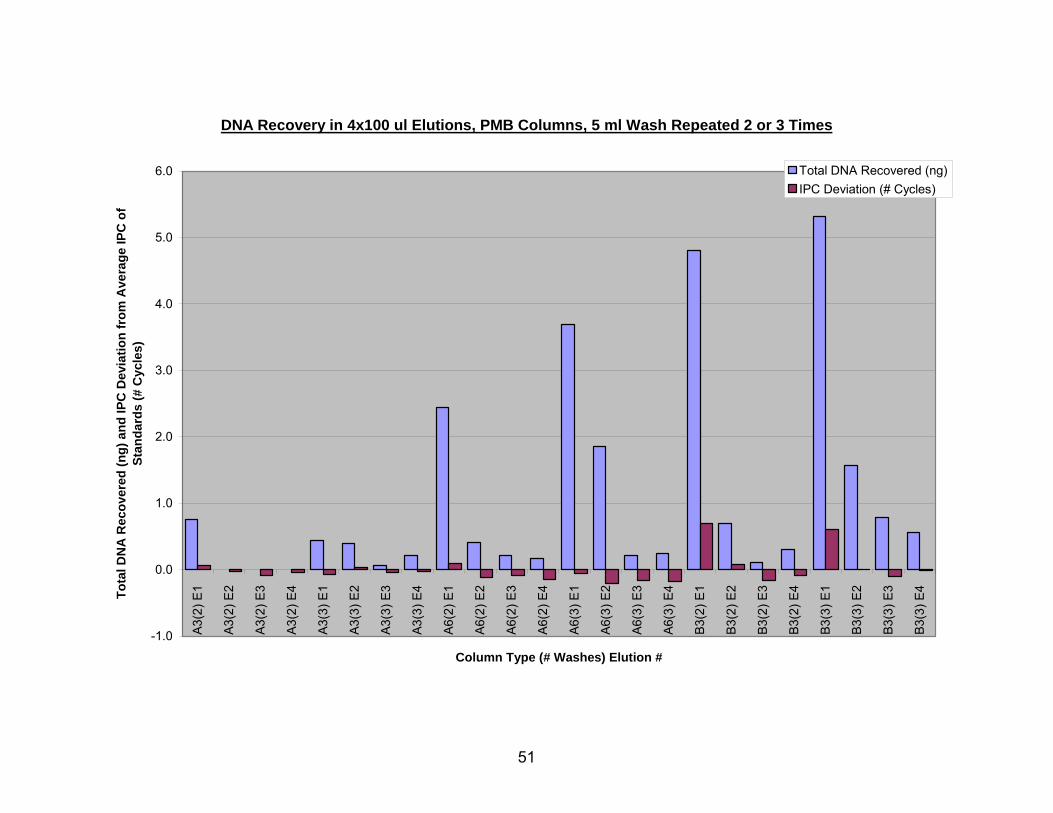
DNA Recovery in 4x100 ul Elutions, PMB Columns, 5 ml Wash Repeated 2 or 3 Times
-1.0
0.0
1.0
2.0
3.0
4.0
5.0
6.0
A3(2
) E1
A3(2
) E2
A3(2
) E3
A3(2
) E4
A3(3
) E1
A3(3
) E2
A3(3
) E3
A3(3
) E4
A6(2
) E1
A6(2
) E2
A6(2
) E3
A6(2
) E4
A6(3
) E1
A6(3
) E2
A6(3
) E3
A6(3
) E4
B3(2
) E1
B3(2
) E2
B3(2
) E3
B3(2
) E4
B3(3
) E1
B3(3
) E2
B3(3
) E3
B3(3
) E4
Column Type (# Washes) Elution #
Tota
l DN
A R
ecov
ered
(ng)
and
IPC
Dev
iatio
n fr
om A
vera
ge IP
C o
f St
anda
rds
(# C
ycle
s)
Total DNA Recovered (ng)IPC Deviation (# Cycles)
51
52
FIG. 7 DNA recovery from four elutions (E1, E2, E3, E4) using PMB columns A3, A6,
and B3, estimated with Quantifiler. Column descriptions are given as the type of glass
fiber (A or B), followed by the number of layers of glass fiber (3 or 6), followed by the
number of times that column was washed with 5 ml of PE buffer (2 or 3), followed by the
elution number.
A3 – bone powder digested with 3 ml improved extraction buffer, recovered with 20 ml PMB column
containing 3 layers of type A glass fiber
A6 – bone powder digested with 3 ml improved extraction buffer, recovered with 20 ml PMB column
containing 6 layers of type A glass fiber
B3 – bone powder digested with 3 ml improved extraction buffer, recovered with 20 ml PMB column
containing 3 layers of type B glass fiber
(2) – washed with 2 aliquots PE buffer, 5 ml each
(3) – washed with 3 aliquots PE buffer, 5 ml each
E1 – First 100 µl elution
E2 – Second 100 µl elution
E3 – Third 100 µl elution
E4 – Fourth 100 µl elution
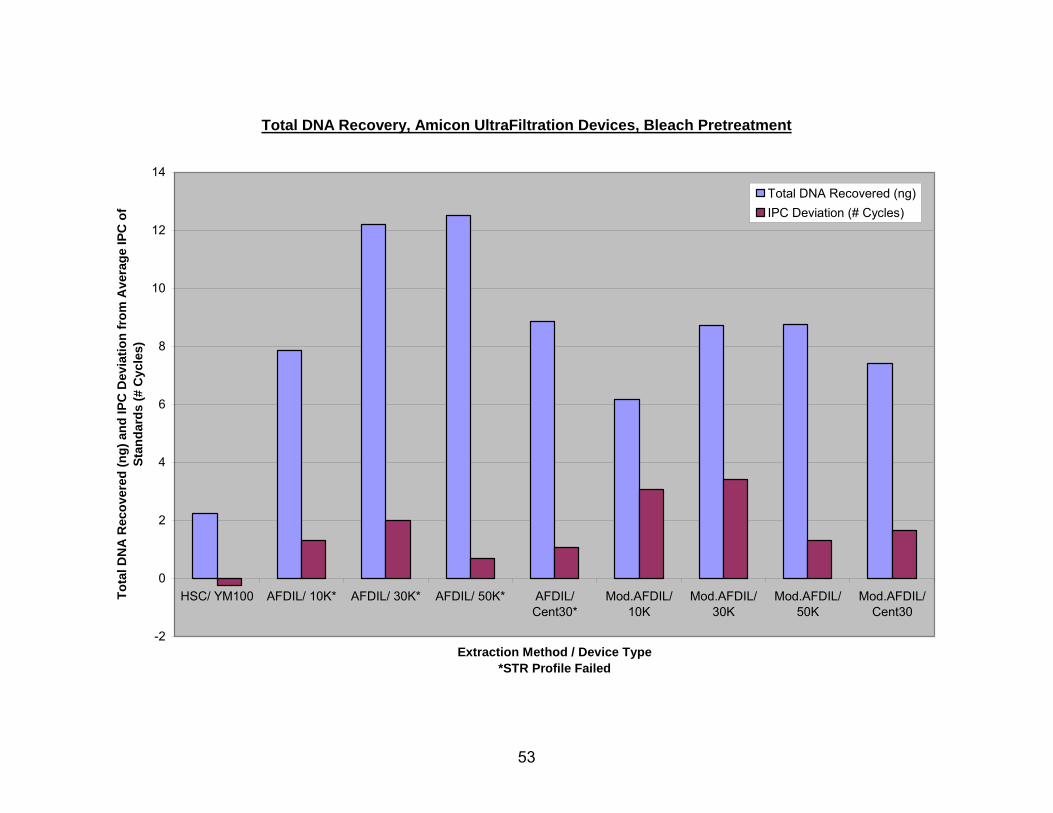
Total DNA Recovery, Amicon UltraFiltration Devices, Bleach Pretreatment
-2
0
2
4
6
8
10
12
14
HSC/ YM100 AFDIL/ 10K* AFDIL/ 30K* AFDIL/ 50K* AFDIL/Cent30*
Mod.AFDIL/10K
Mod.AFDIL/30K
Mod.AFDIL/50K
Mod.AFDIL/Cent30
Extraction Method / Device Type*STR Profile Failed
Tota
l DN
A R
ecov
ered
(ng)
and
IPC
Dev
iatio
n fr
om A
vera
ge IP
C o
f St
anda
rds
(# C
ycle
s)
Total DNA Recovered (ng)IPC Deviation (# Cycles)
53
54
FIG. 8 DNA recovery from bleach pretreated bone using Amicon ultrafiltration devices,
estimated with Quantifiler®. These included the Microcon YM100 (nominal molecular
weight limit of 100,000), Centricon 30 (nominal molecular weight limit of 30,000), and
the Amicon Ultra-4 ultrafiltration devices with three different nominal molecular weight
limits (NMWL) 10K (10,000 NMWL), 30K (30,000 NMWL), and 50K (50,000 NMWL).
HSC/YM100 – bone powder decalcified with 1 ml 0.5 M EDTA, digested with 1 ml stain extraction buffer,
subjected to organic extraction, recovered with Microcon YM100 device, horizontal membrane, nominal
molecular weight limit 100,000
AFDIL – bone powder digested with 3 ml improved extraction buffer, subjected to three rounds of organic
extraction, ultrafiltrate washed once with TE
Mod.AFDIL – bone powder digested with 3 ml improved extraction buffer, subjected to four rounds of
organic extraction, ultrafiltrate washed twice with TE, once with nuclease-free water
10K – recovered with Amicon Ultra-4 device, vertical membrane, nominal molecular weight limit 10,000
30K – recovered with Amicon Ultra-4 device, vertical membrane, nominal molecular weight limit 30,000
50K – recovered with Amicon Ultra-4 device, vertical membrane, nominal molecular weight limit 50,000
Cent30 – recovered with Centricon 30 device, horizontal membrane, nominal molecular weight limit
30,000
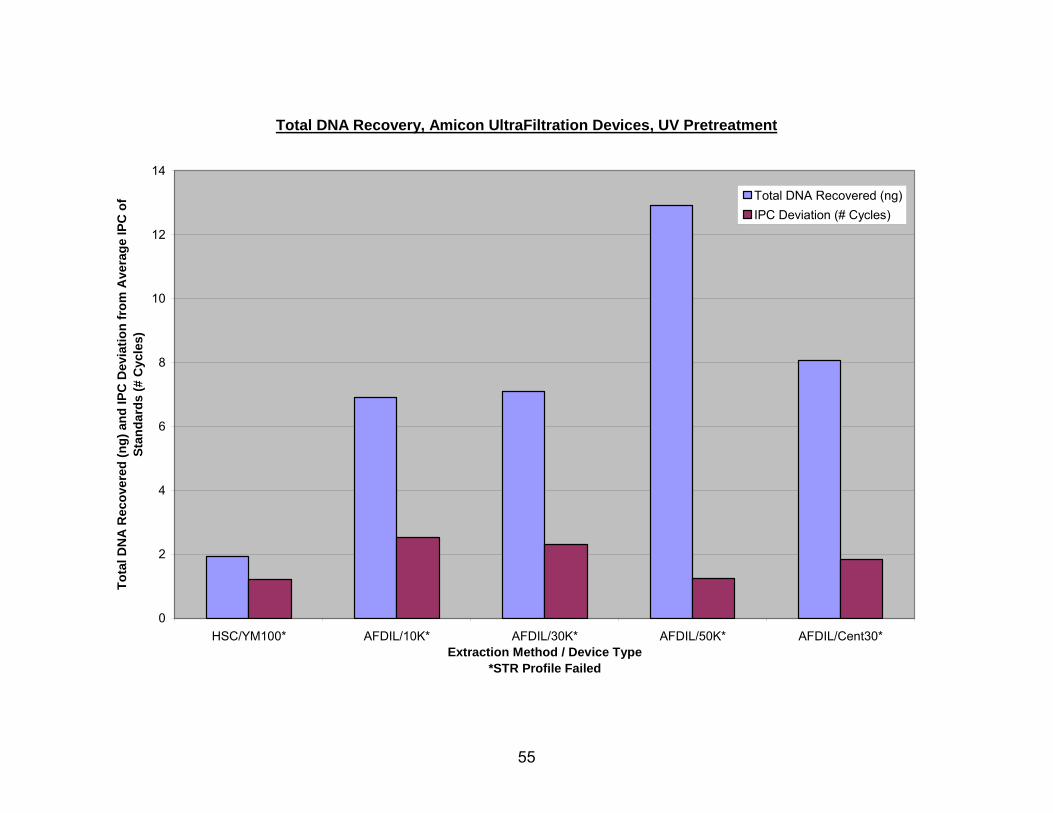
Total DNA Recovery, Amicon UltraFiltration Devices, UV Pretreatment
0
2
4
6
8
10
12
14
HSC/YM100* AFDIL/10K* AFDIL/30K* AFDIL/50K* AFDIL/Cent30*Extraction Method / Device Type
*STR Profile Failed
Tota
l DN
A R
ecov
ered
(ng)
and
IPC
Dev
iatio
n fr
om A
vera
ge IP
C o
f St
anda
rds
(# C
ycle
s)
Total DNA Recovered (ng)IPC Deviation (# Cycles)
55
FIG. 9 DNA recovery from UV pretreated bone using Amicon ultrafiltration devices,
estimated with Quantifiler. The columns represented here include the Microcon YM100
(nominal molecular weight limit of 100,000), Centricon 30, and the Amicon Ultra-4
ultrafiltration devices: 10K (10,000 NMWL), 30K (30,000 NMWL), and 50K (50,000
NMWL).
HSC/YM100 – bone powder decalcified with 1 ml 0.5 M EDTA, digested with 1 ml stain extraction buffer,
subjected to organic extraction, recovered with Microcon YM100 device, horizontal membrane, nominal
molecular weight limit 100,000
AFDIL – bone powder digested with 3 ml improved extraction buffer, subjected to three rounds of organic
extraction, ultrafiltrate washed once with TE
10K – recovered with Amicon Ultra-4 device, vertical membrane, nominal molecular weight limit 10,000
30K – recovered with Amicon Ultra-4 device, vertical membrane, nominal molecular weight limit 30,000
50K – recovered with Amicon Ultra-4 device, vertical membrane, nominal molecular weight limit 50,000
Cent30 – recovered with Centricon 30 device, horizontal membrane, nominal molecular weight limit
30,000
56
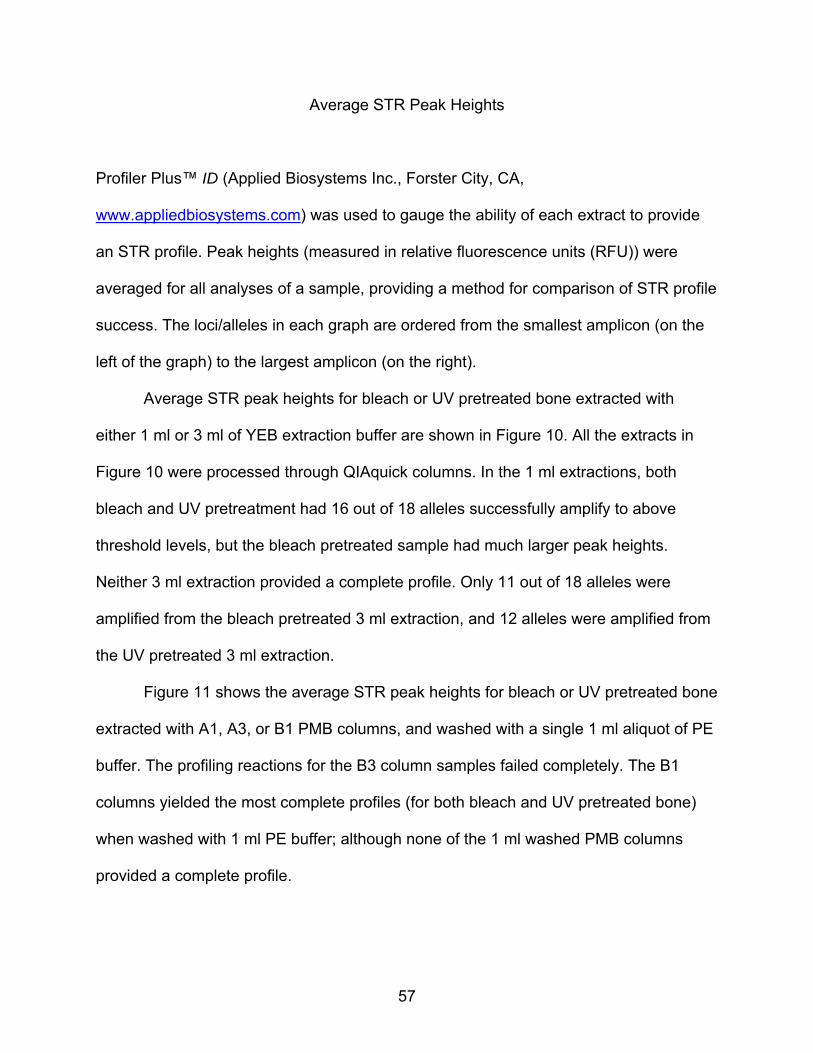
Average STR Peak Heights
Profiler Plus™ ID (Applied Biosystems Inc., Forster City, CA,
www.appliedbiosystems.com) was used to gauge the ability of each extract to provide
an STR profile. Peak heights (measured in relative fluorescence units (RFU)) were
averaged for all analyses of a sample, providing a method for comparison of STR profile
success. The loci/alleles in each graph are ordered from the smallest amplicon (on the
left of the graph) to the largest amplicon (on the right).
Average STR peak heights for bleach or UV pretreated bone extracted with
either 1 ml or 3 ml of YEB extraction buffer are shown in Figure 10. All the extracts in
Figure 10 were processed through QIAquick columns. In the 1 ml extractions, both
bleach and UV pretreatment had 16 out of 18 alleles successfully amplify to above
threshold levels, but the bleach pretreated sample had much larger peak heights.
Neither 3 ml extraction provided a complete profile. Only 11 out of 18 alleles were
amplified from the bleach pretreated 3 ml extraction, and 12 alleles were amplified from
the UV pretreated 3 ml extraction.
Figure 11 shows the average STR peak heights for bleach or UV pretreated bone
extracted with A1, A3, or B1 PMB columns, and washed with a single 1 ml aliquot of PE
buffer. The profiling reactions for the B3 column samples failed completely. The B1
columns yielded the most complete profiles (for both bleach and UV pretreated bone)
when washed with 1 ml PE buffer; although none of the 1 ml washed PMB columns
provided a complete profile.
57
58
Average STR peak heights for UV pretreated bone extracted with A1, A3, or B1
PMB columns, and washed with a single 5 ml aliquot of PE buffer are shown in Figure
12. The B3 columns were also used to extract DNA from bone powder using a single 5
ml wash, but these extracts were not successfully profiled. DNA recovered from the A3
columns provided the only complete profile when used in conjunction with a 5 ml wash,
although the A1 and B1 columns both amplified 15 out of 18 alleles.
Figure 13 shows average STR peak heights for UV pretreated bone extracted
with A3, or A6 PMB columns (washed with a 2 x 5 ml or 3 x 5 ml PE buffer). Extractions
were performed with the B3 columns using both 2 x 5 ml and 3 x 5 ml wash
combinations, but none of the recovered DNA samples were successfully profiled. All
DNA extracts from the A3 and A6 columns washed with 10 ml or more of PE buffer
provided full profiles. However, the DNA isolated using a combination of the A6 column
and 15 ml wash resulted in the highest overall RFU values.
Figure 14 shows average STR peak heights for samples isolated from bleach
pretreated bone using Amicon ultrafiltration devices and the Modified AFDIL protocol.
The Amicon Ultra-4 device with the 50K NMWL yielded the only complete profile. The
sample concentrated with the YM100 yielded a partial profile 15 out of the 18 possible
alleles, the Centricon 30 provided 13 of 18, the Ultra-4 30K provided 12 out of 18
alleles, and the Ultra-4 10K sample yielded only 5 of 18. When used in conjunction with
the AFDIL protocol, neither the Ultra-4 devices nor the Centricon 30 provided samples
that could be successfully profiled (regardless of pretreatment method).
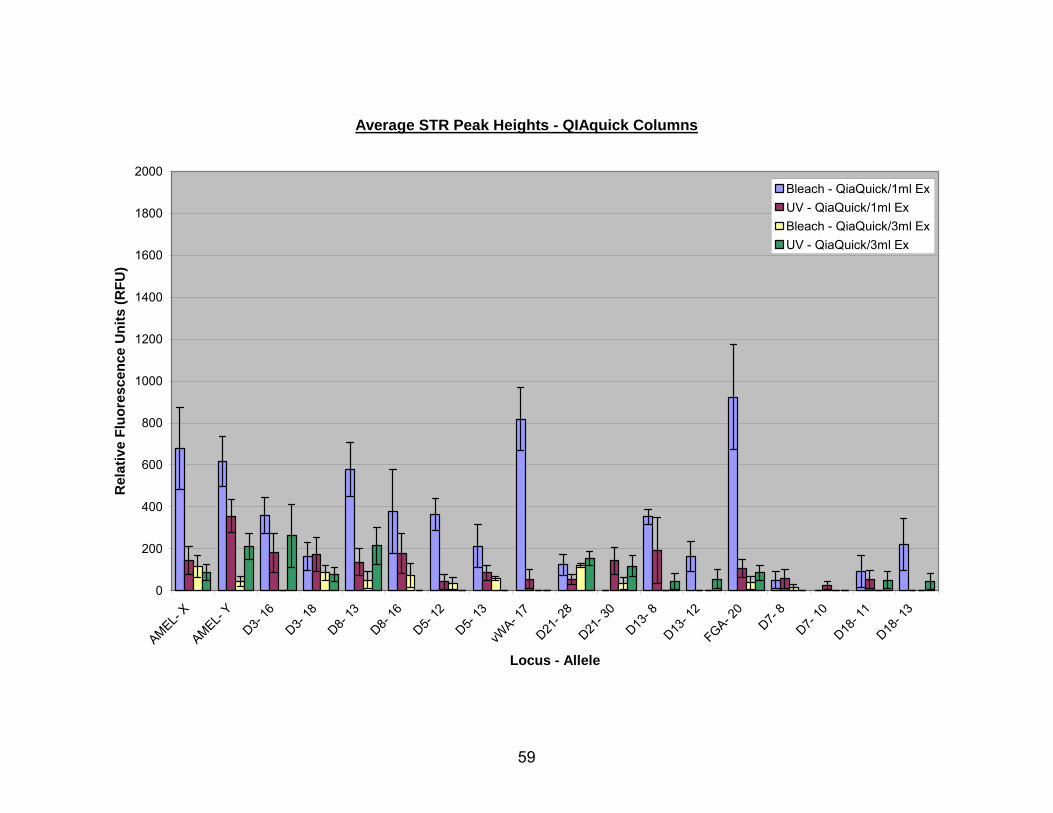
Average STR Peak Heights - QIAquick Columns
0
200
400
600
800
1000
1200
1400
1600
1800
2000
AMEL- X
AMEL- Y
D3- 16
D3- 18
D8- 13
D8- 16
D5- 12
D5- 13
vWA- 1
7D21
- 28
D21- 3
0D13
- 8D13
- 12
FGA- 20
D7- 8
D7- 10
D18- 1
1D18
- 13
Locus - Allele
Rel
ativ
e Fl
uore
scen
ce U
nits
(RFU
)
Bleach - QiaQuick/1ml ExUV - QiaQuick/1ml ExBleach - QiaQuick/3ml ExUV - QiaQuick/3ml Ex
59
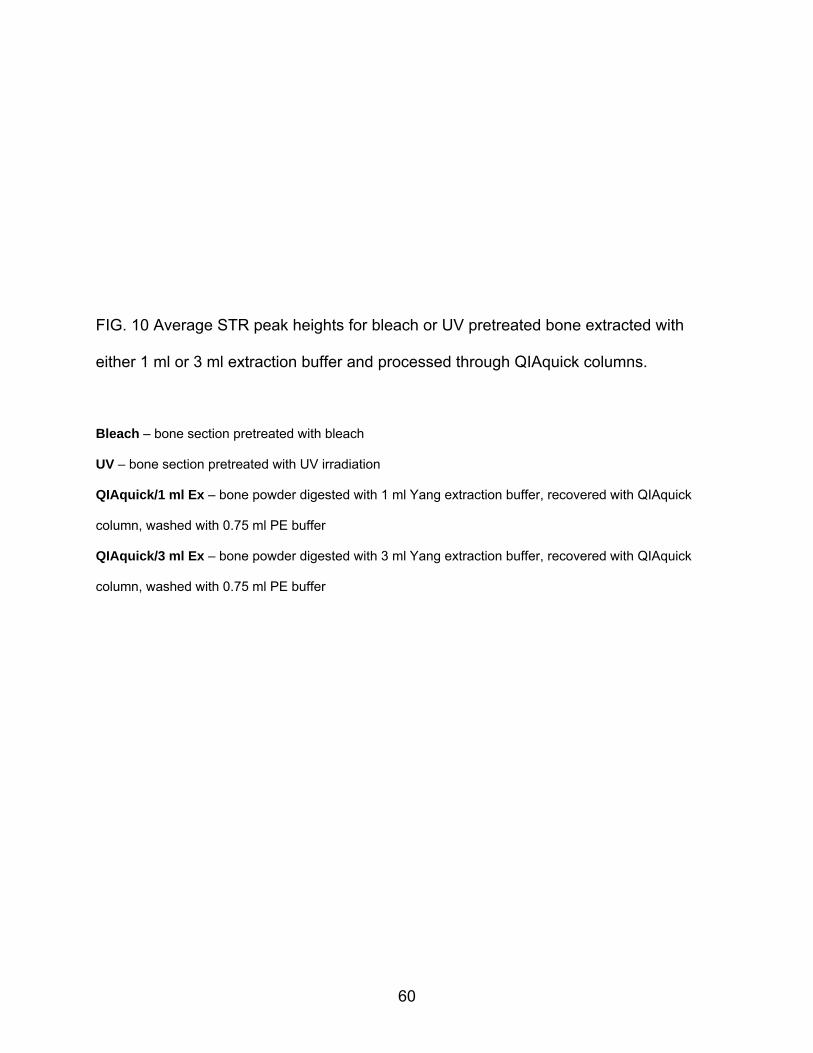
60
FIG. 10 Average STR peak heights for bleach or UV pretreated bone extracted with
either 1 ml or 3 ml extraction buffer and processed through QIAquick columns.
Bleach – bone section pretreated with bleach
UV – bone section pretreated with UV irradiation
QIAquick/1 ml Ex – bone powder digested with 1 ml Yang extraction buffer, recovered with QIAquick
column, washed with 0.75 ml PE buffer
QIAquick/3 ml Ex – bone powder digested with 3 ml Yang extraction buffer, recovered with QIAquick
column, washed with 0.75 ml PE buffer
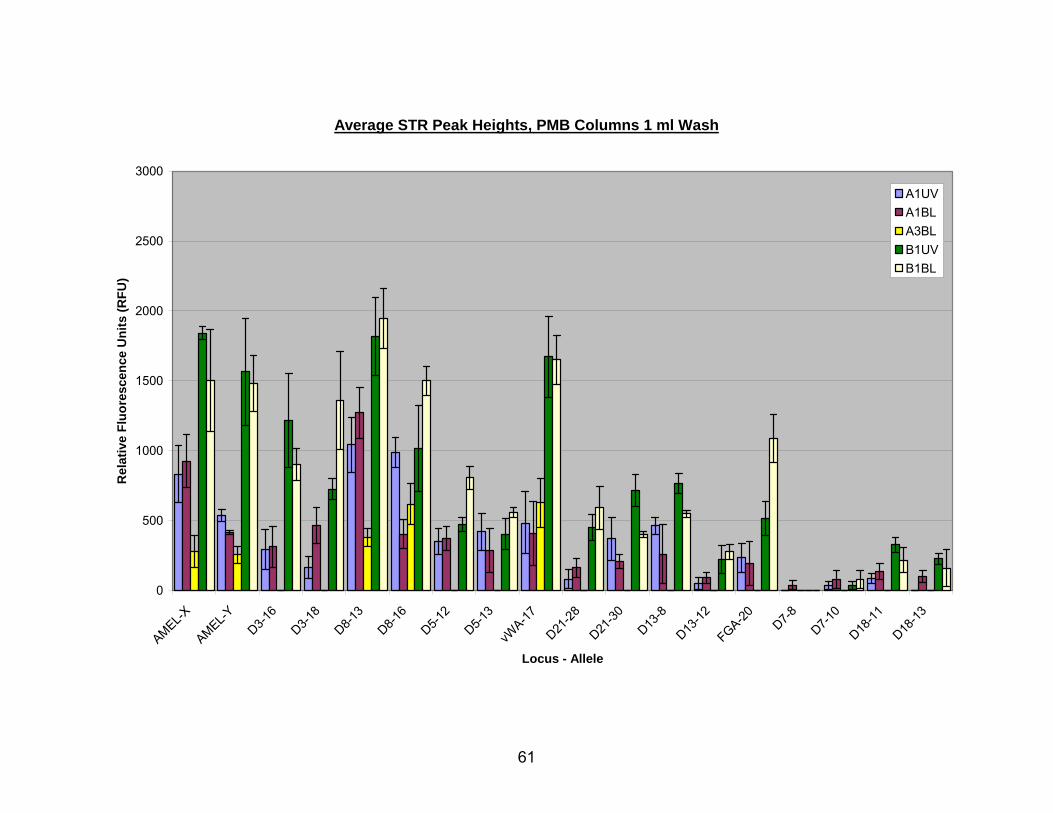
Average STR Peak Heights, PMB Columns 1 ml Wash
0
500
1000
1500
2000
2500
3000
AMEL-XAMEL-Y
D3-16
D3-18
D8-13
D8-16
D5-12
D5-13
vWA-17
D21-28
D21-30
D13-8
D13-12
FGA-20 D7-8
D7-10
D18-11
D18-13
Locus - Allele
Rel
ativ
e Fl
uore
scen
ce U
nits
(RFU
)
A1UVA1BLA3BLB1UVB1BL
61
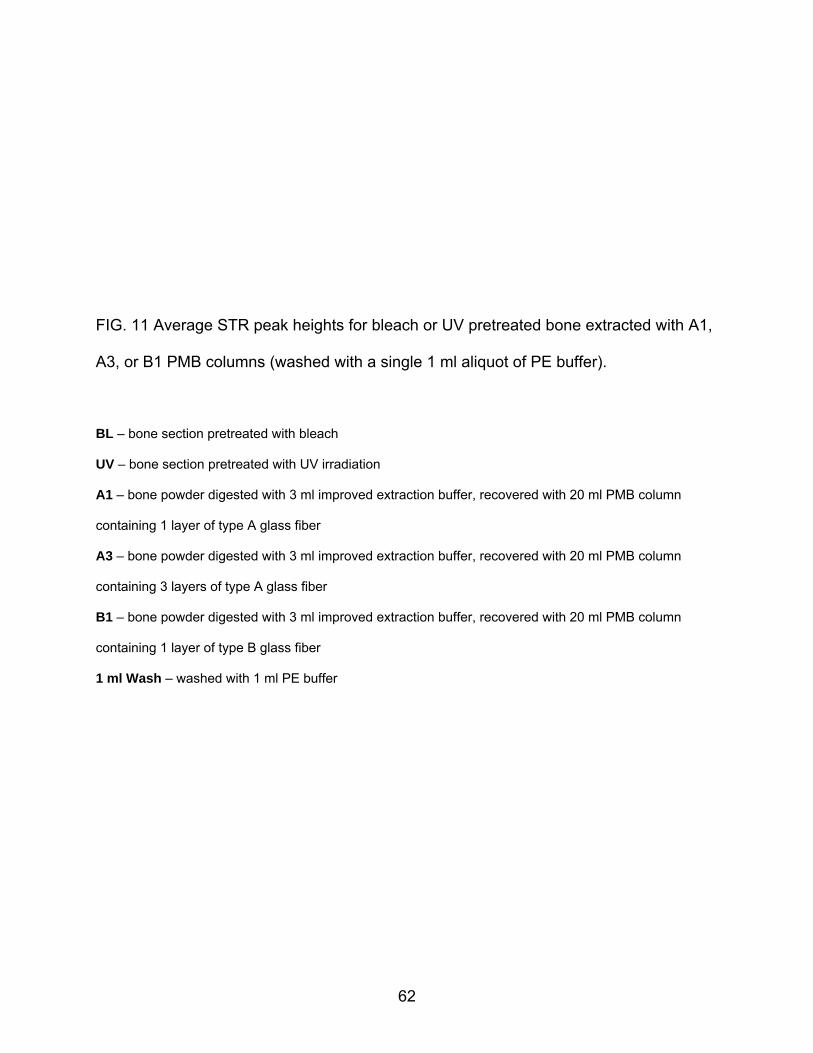
62
FIG. 11 Average STR peak heights for bleach or UV pretreated bone extracted with A1,
A3, or B1 PMB columns (washed with a single 1 ml aliquot of PE buffer).
BL – bone section pretreated with bleach
UV – bone section pretreated with UV irradiation
A1 – bone powder digested with 3 ml improved extraction buffer, recovered with 20 ml PMB column
containing 1 layer of type A glass fiber
A3 – bone powder digested with 3 ml improved extraction buffer, recovered with 20 ml PMB column
containing 3 layers of type A glass fiber
B1 – bone powder digested with 3 ml improved extraction buffer, recovered with 20 ml PMB column
containing 1 layer of type B glass fiber
1 ml Wash – washed with 1 ml PE buffer
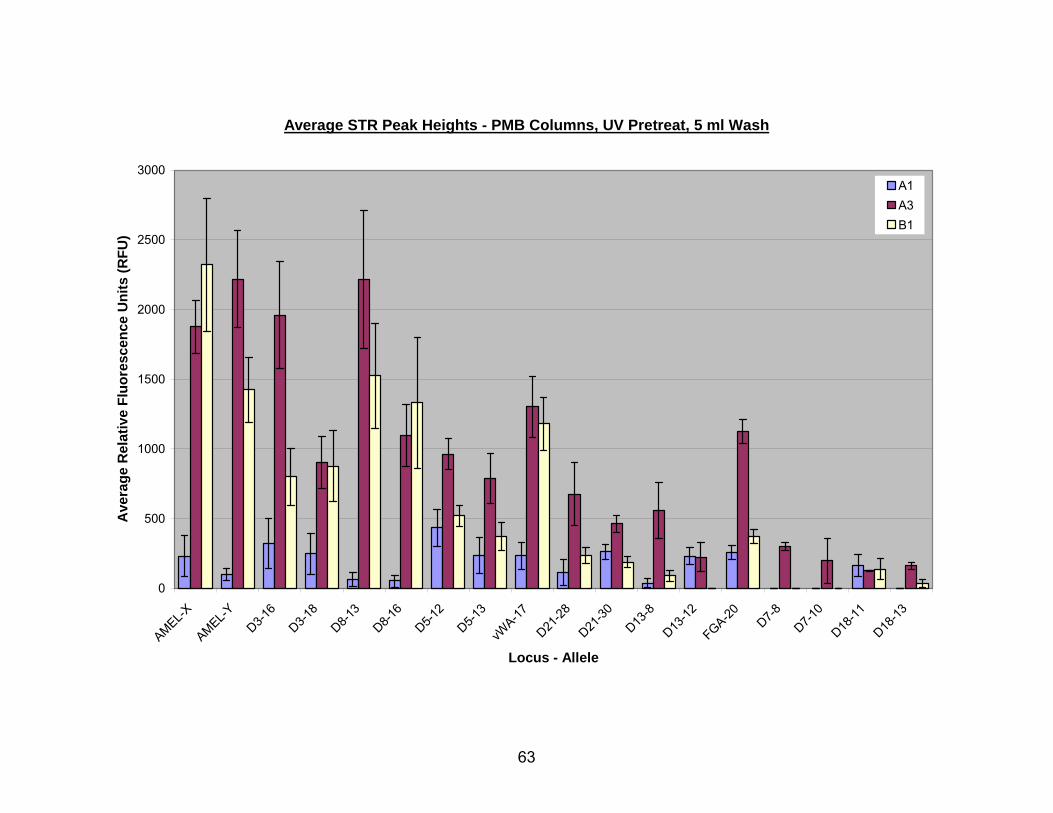
Average STR Peak Heights - PMB Columns, UV Pretreat, 5 ml Wash
0
500
1000
1500
2000
2500
3000
AMEL-XAMEL-Y
D3-16
D3-18
D8-13
D8-16
D5-12
D5-13
vWA-17
D21-28
D21-30
D13-8
D13-12
FGA-20 D7-8
D7-10
D18-11
D18-13
Locus - Allele
Ave
rage
Rel
ativ
e Fl
uore
scen
ce U
nits
(RFU
)
A1A3B1
63

64
FIG. 12 Average STR peak heights for UV pretreated bone extracted with A1, A3, or B1
PMB columns (washed with a single 5 ml aliquot of PE buffer).
A1 – bone powder digested with 3 ml improved extraction buffer, recovered with 20 ml PMB column
containing 1 layer of type A glass fiber
A3 – bone powder digested with 3 ml improved extraction buffer, recovered with 20 ml PMB column
containing 3 layers of type A glass fiber
B1 – bone powder digested with 3 ml improved extraction buffer, recovered with 20 ml PMB column
containing 1 layer of type B glass fiber
5 ml Wash – washed with 5 ml PE buffer
Average STR Peak Heights - PMB Columns, UV Pretreat, 10 or 15 ml Wash
0
1000
2000
3000
4000
5000
6000
7000
AMEL-XAMEL-Y
D3-16
D3-18
D8-13
D8-16
D5-12
D5-13
vWA-17
D21-28
D21-30
D13-8
D13-12
FGA-20 D7-8
D7-10
D18-11
D18-13
Locus - Allele
Rel
ativ
e Fl
uroe
scen
ce U
nits
(RFU
)_
A3/10ml WashA3/15ml WashA6/10ml WashA6/15ml Wash
65
66
FIG. 13 Average STR peak heights for UV pretreated bone extracted with A3, or A6
PMB columns (washed with a 2 x 5 ml or 3 x 5 ml PE buffer).
A3 – bone powder digested with 3 ml improved extraction buffer, recovered with 20 ml PMB column
containing 3 layers of type A glass fiber
A6 – bone powder digested with 3 ml improved extraction buffer, recovered with 20 ml PMB column
containing 6 layers of type A glass fiber
10 ml Wash – washed with 2 aliquots PE buffer, 5 ml each
15 ml Wash – washed with 3 aliquots PE buffer, 5 ml each
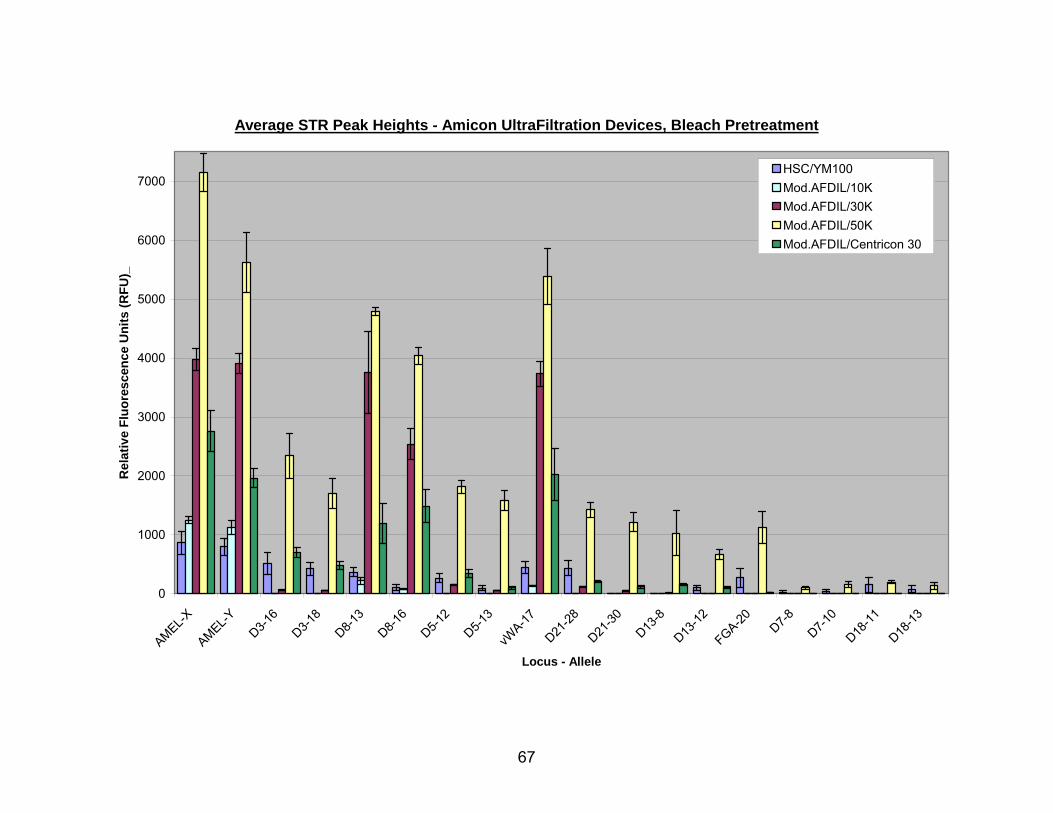
Average STR Peak Heights - Amicon UltraFiltration Devices, Bleach Pretreatment
0
1000
2000
3000
4000
5000
6000
7000
AMEL-XAMEL-Y
D3-16
D3-18
D8-13
D8-16
D5-12
D5-13
vWA-17
D21-28
D21-30
D13-8
D13-12
FGA-20 D7-8
D7-10
D18-11
D18-13
Locus - Allele
Rel
ativ
e Fl
uore
scen
ce U
nits
(RFU
)_
HSC/YM100Mod.AFDIL/10KMod.AFDIL/30KMod.AFDIL/50KMod.AFDIL/Centricon 30
67
FIG. 14 Average STR peak heights for bleach pretreated bone using Amicon
ultrafiltration devices and the Modified AFDIL protocol.
HSC/YM100 – bone powder decalcified with 1 ml 0.5 M EDTA, digested with 1 ml stain extraction buffer,
subjected to organic extraction, recovered with Microcon YM100 device, horizontal membrane, nominal
molecular weight limit 100,000
Mod.AFDIL – bone powder digested with 3 ml improved extraction buffer, subjected to four rounds of
organic extraction, ultrafiltrate washed twice with TE, once with nuclease-free water
10K – recovered with Amicon Ultra-4 device, vertical membrane, nominal molecular weight limit 10,000
30K – recovered with Amicon Ultra-4 device, vertical membrane, nominal molecular weight limit 30,000
50K – recovered with Amicon Ultra-4 device, vertical membrane, nominal molecular weight limit 50,000
Cent30 – recovered with Centricon 30 device, horizontal membrane, nominal molecular weight limit
30,000
68
Whole Genome Amplification
The REPLI-g® kit (Qiagen Inc., Valencia, CA, www1.qiagen.com) was chosen as
a WGA method for three reasons: recent publications have suggested that multiple
displacement amplification (MDA) outperforms PCR-based methods when used with
forensic samples (4), the GenomiPhi® MDA kit (Amersham Biosciences UK Limited,
Buckinghamshire, United Kingdom) had already been tested on forensic-type samples
as reported in multiple publications (4, 6), and the REPLI-g kit uses chemical
denaturation instead of heat denaturation. (The GenomiPhi MDA kit uses heat
denaturation.)
In no case did whole genome amplification (WGA) with the REPLI-g kit improve
the STR profile of a sample. The electropherograms generated from WGA samples
often contained a multitude of above threshold off-ladder peaks, particularly in the size
range of 100-200 bases. The most complete profiles contained a maximum of 1-3
successfully amplified alleles. The amplified alleles were often immediately preceded by
stutter peaks of up to 45% of the height of the legitimate peak.
DNA Repair
DNA repair protocols were performed with PreCR™ (New England Biolabs,
Ipswitch, MA, www.neb.com) cocktail A and PreCR T6 cocktail on five different sample
types. The average relative fluorescence units (RFU) were obtained by determining the
mean for 3 Profiler Plus ID reactions; 1 each with 2, 7, or 10 µl of finished repair
69
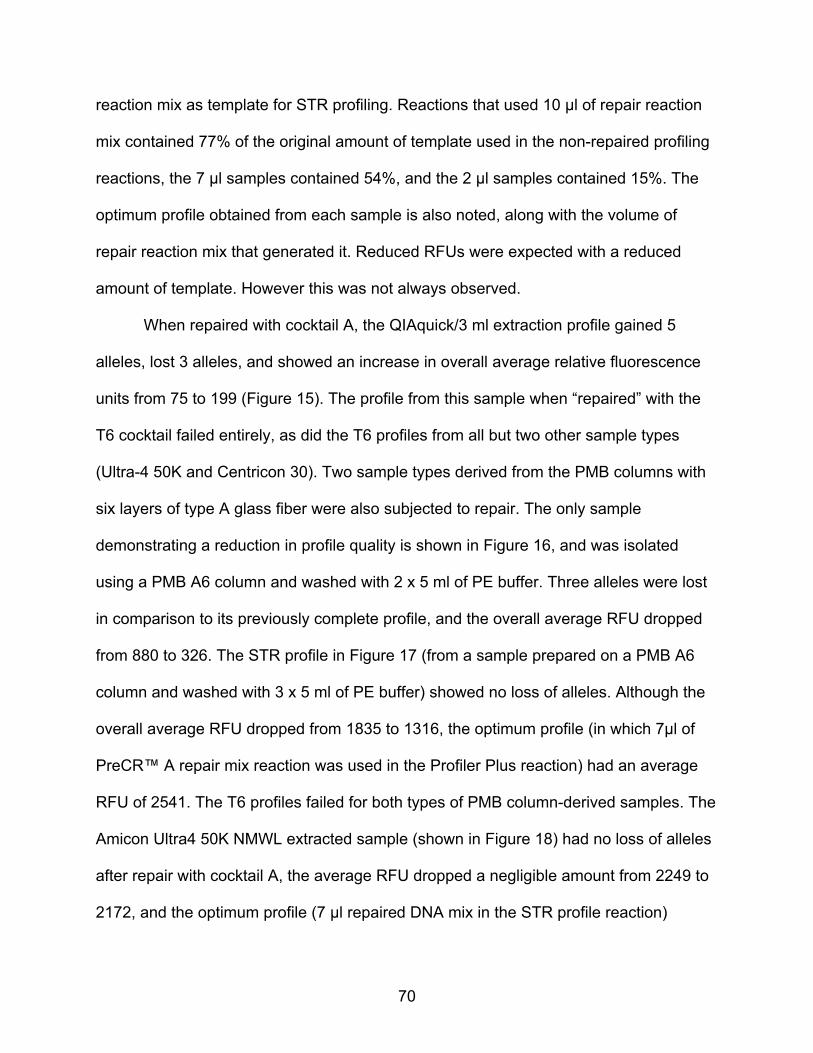
reaction mix as template for STR profiling. Reactions that used 10 µl of repair reaction
mix contained 77% of the original amount of template used in the non-repaired profiling
reactions, the 7 µl samples contained 54%, and the 2 µl samples contained 15%. The
optimum profile obtained from each sample is also noted, along with the volume of
repair reaction mix that generated it. Reduced RFUs were expected with a reduced
amount of template. However this was not always observed.
When repaired with cocktail A, the QIAquick/3 ml extraction profile gained 5
alleles, lost 3 alleles, and showed an increase in overall average relative fluorescence
units from 75 to 199 (Figure 15). The profile from this sample when “repaired” with the
T6 cocktail failed entirely, as did the T6 profiles from all but two other sample types
(Ultra-4 50K and Centricon 30). Two sample types derived from the PMB columns with
six layers of type A glass fiber were also subjected to repair. The only sample
demonstrating a reduction in profile quality is shown in Figure 16, and was isolated
using a PMB A6 column and washed with 2 x 5 ml of PE buffer. Three alleles were lost
in comparison to its previously complete profile, and the overall average RFU dropped
from 880 to 326. The STR profile in Figure 17 (from a sample prepared on a PMB A6
column and washed with 3 x 5 ml of PE buffer) showed no loss of alleles. Although the
overall average RFU dropped from 1835 to 1316, the optimum profile (in which 7µl of
PreCR™ A repair mix reaction was used in the Profiler Plus reaction) had an average
RFU of 2541. The T6 profiles failed for both types of PMB column-derived samples. The
Amicon Ultra4 50K NMWL extracted sample (shown in Figure 18) had no loss of alleles
after repair with cocktail A, the average RFU dropped a negligible amount from 2249 to
2172, and the optimum profile (7 µl repaired DNA mix in the STR profile reaction)
70
71
showed an increase in RFU to 3224. The most complete profile from the T6 cocktail
“repaired” sample (from the 50K ultrafiltration device) lost 6 alleles. Shown in Figure 19,
the final sample type to undergo repair was extracted using the Centricon 30
ultrafiltration device. The average RFU went up after repair, from 648 to 744, and one
allele was gained. The optimum profile (10 µl) had an average RFU of 970.
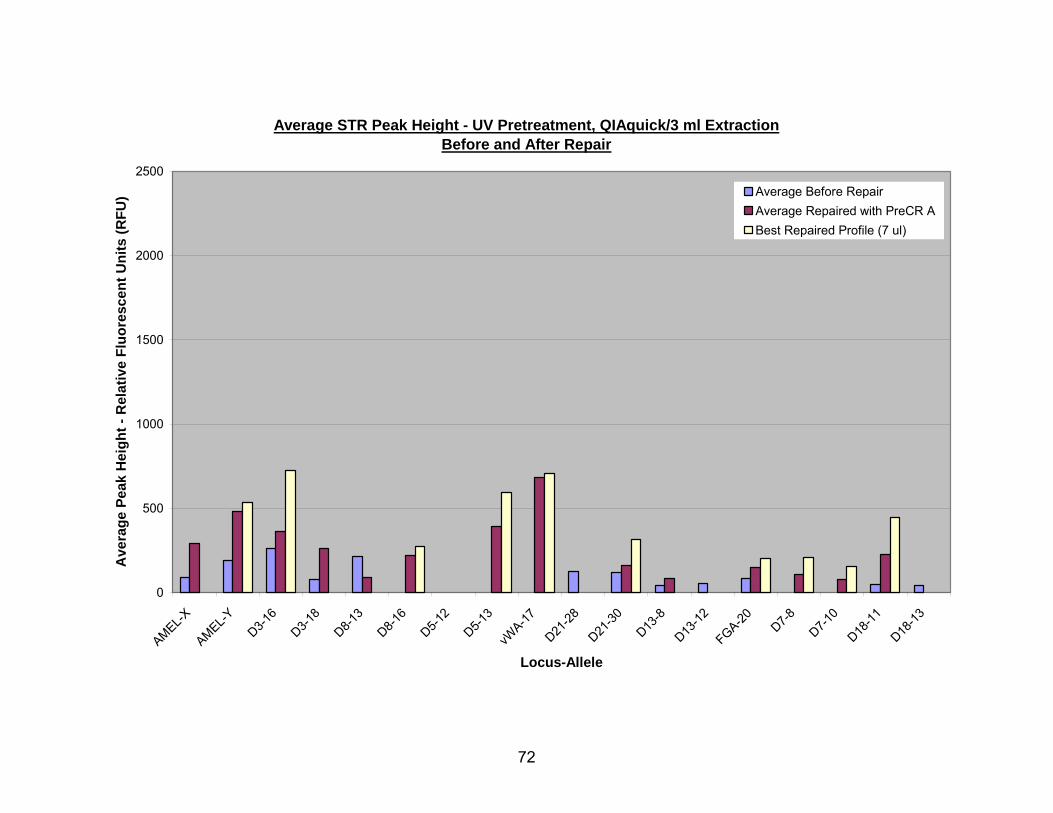
Average STR Peak Height - UV Pretreatment, QIAquick/3 ml ExtractionBefore and After Repair
0
500
1000
1500
2000
2500
AMEL-XAMEL-Y
D3-16
D3-18
D8-13
D8-16
D5-12
D5-13
vWA-17
D21-28
D21-30
D13-8
D13-12
FGA-20 D7-8
D7-10
D18-11
D18-13
Locus-Allele
Ave
rage
Pea
k H
eigh
t - R
elat
ive
Fluo
resc
ent U
nits
(RFU
) Average Before RepairAverage Repaired with PreCR ABest Repaired Profile (7 ul)
72
73
FIG. 15 PreCR A repair of UV pretreated, 3 ml QIAquick® extracted DNA.
QIAquick/3 ml Extraction – bone powder digested with 3 ml Yang extraction buffer, recovered with
QIAquick column, washed with 0.75 ml PE buffer
UV – bone section pretreated with UV irradiation
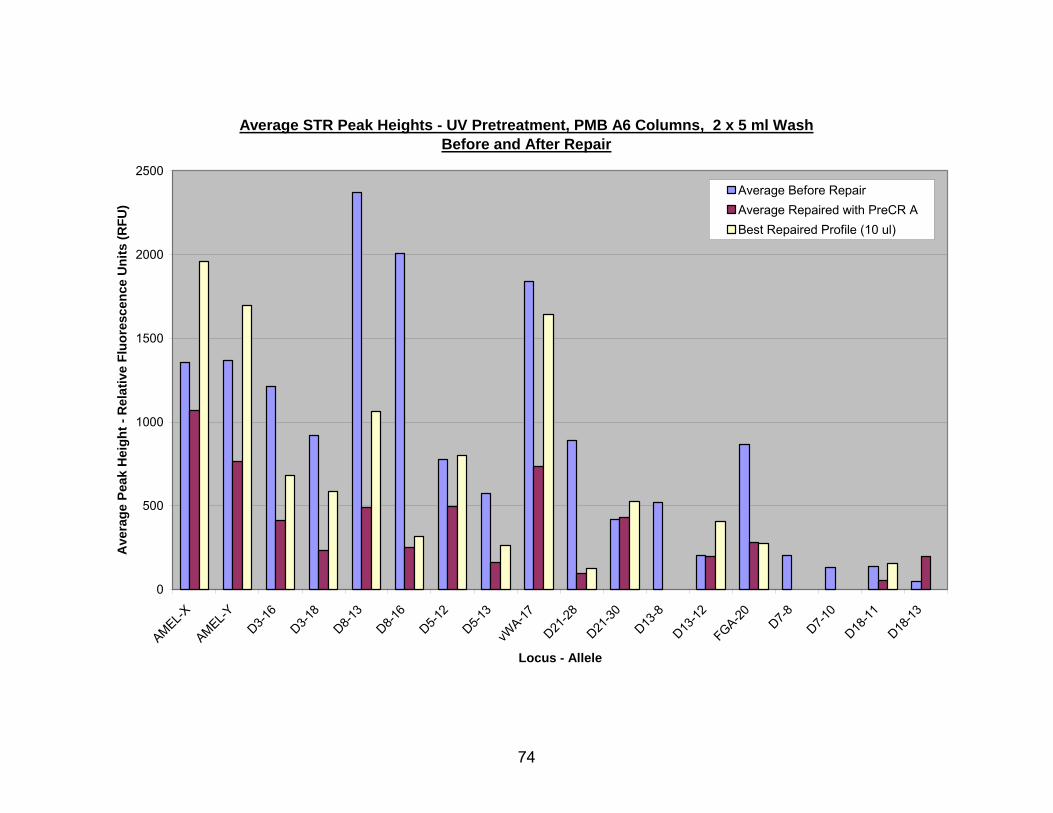
Average STR Peak Heights - UV Pretreatment, PMB A6 Columns, 2 x 5 ml WashBefore and After Repair
0
500
1000
1500
2000
2500
AMEL-XAMEL-Y
D3-16
D3-18
D8-13
D8-16
D5-12
D5-13
vWA-17
D21-28
D21-30
D13-8
D13-12
FGA-20 D7-8
D7-10
D18-11
D18-13
Locus - Allele
Ave
rage
Pea
k H
eigh
t - R
elat
ive
Fluo
resc
ence
Uni
ts (R
FU)
Average Before RepairAverage Repaired with PreCR ABest Repaired Profile (10 ul)
74
75
FIG. 16 PreCR A repair of UV pretreated, PMB A6 (2 x 5 ml wash) extracted DNA.
A6 – bone powder digested with 3 ml improved extraction buffer, recovered with 20 ml PMB column
containing 6 layers of type A glass fiber
2 x 5 ml Wash – washed with 2 aliquots PE buffer, 5 ml each
UV – bone section pretreated with UV irradiation
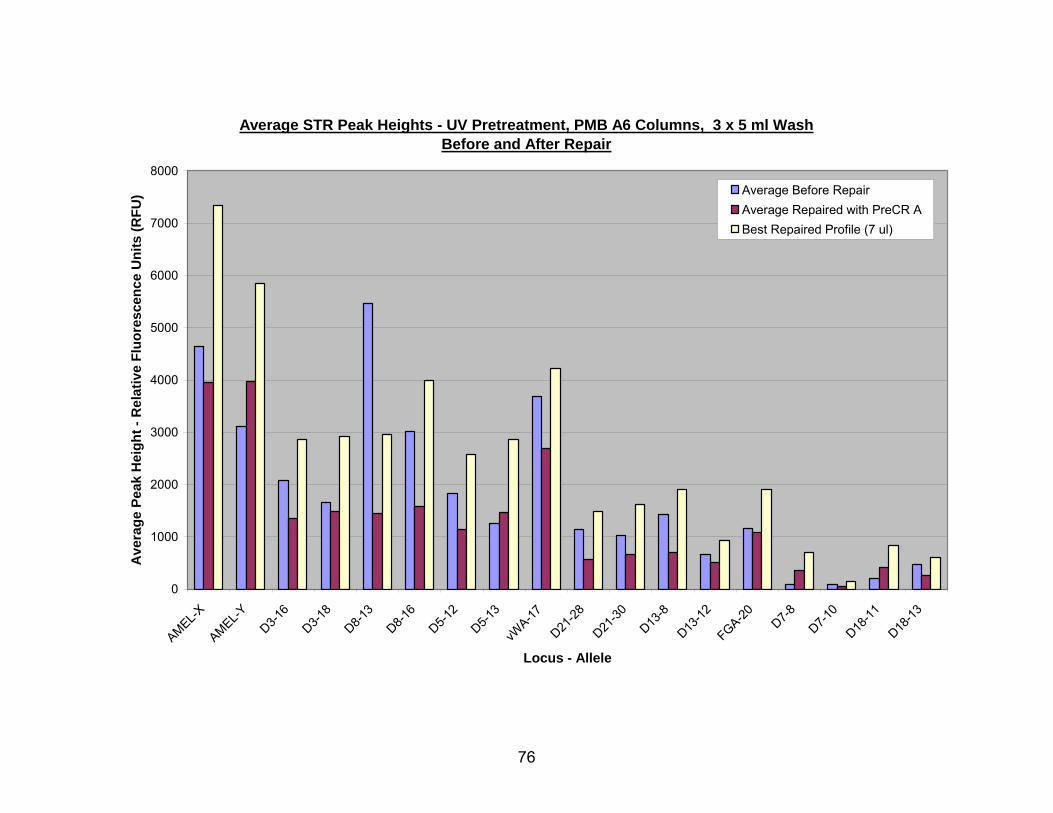
Average STR Peak Heights - UV Pretreatment, PMB A6 Columns, 3 x 5 ml WashBefore and After Repair
0
1000
2000
3000
4000
5000
6000
7000
8000
AMEL-XAMEL-Y
D3-16
D3-18
D8-13
D8-16
D5-12
D5-13
vWA-17
D21-28
D21-30
D13-8
D13-12
FGA-20 D7-8
D7-10
D18-11
D18-13
Locus - Allele
Ave
rage
Pea
k H
eigh
t - R
elat
ive
Fluo
resc
ence
Uni
ts (R
FU) Average Before Repair
Average Repaired with PreCR ABest Repaired Profile (7 ul)
76
77
FIG. 17 PreCR A repair of UV pretreated, PMB A6 (3 x 5 ml wash) extracted DNA.
A6 – bone powder digested with 3 ml improved extraction buffer, recovered with 20 ml PMB column
containing 6 layers of type A glass fiber
3 x 5 ml Wash – washed with 3 aliquots PE buffer, 5 ml each
UV – bone section pretreated with UV irradiation
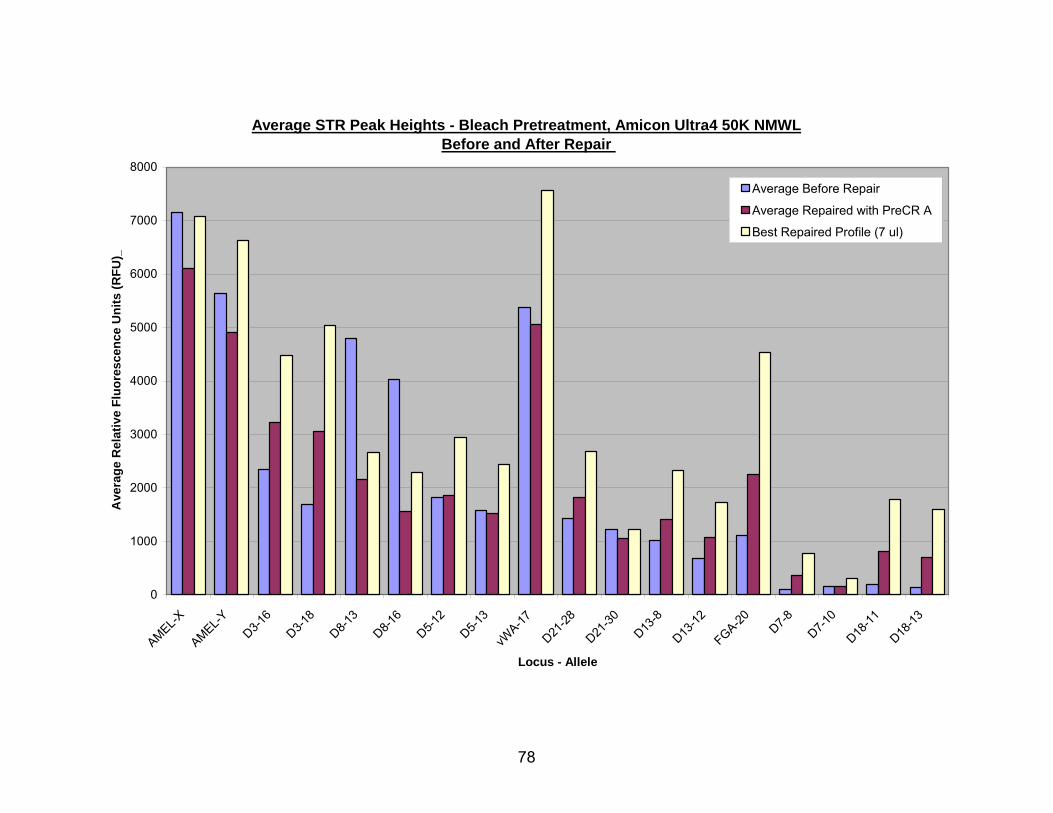
Average STR Peak Heights - Bleach Pretreatment, Amicon Ultra4 50K NMWLBefore and After Repair
0
1000
2000
3000
4000
5000
6000
7000
8000
AMEL-XAMEL-Y
D3-16
D3-18
D8-13
D8-16
D5-12
D5-13
vWA-17
D21-28
D21-30
D13-8
D13-12
FGA-20 D7-8
D7-10
D18-11
D18-13
Locus - Allele
Ave
rage
Rel
ativ
e Fl
uore
scen
ce U
nits
(RFU
)_
Average Before Repair
Average Repaired with PreCR A
Best Repaired Profile (7 ul)
78
79
FIG. 18 PreCR A repair of bleach pretreated, Amicon Ultra-4 50K NMWL extracted
DNA.
Amicon Ultra-4 50K – recovered with Amicon Ultra-4 device, vertical membrane, nominal molecular
weight limit 50,000
Bleach – bone section pretreated with bleach
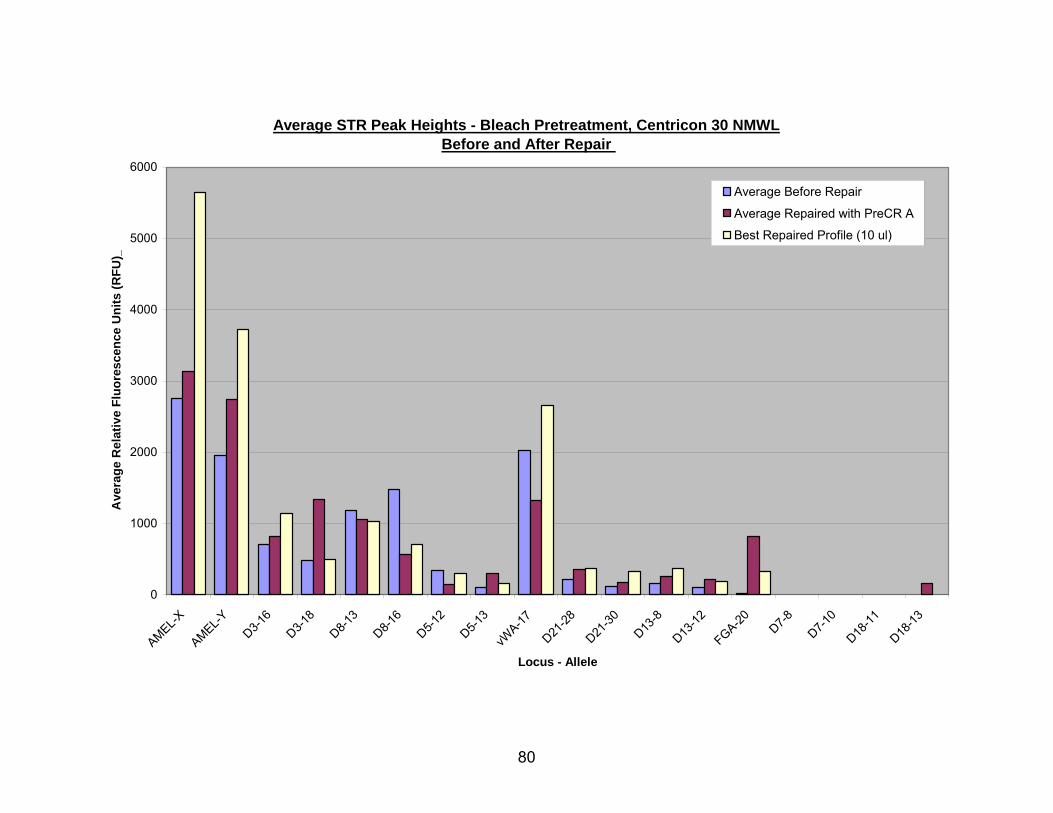
Average STR Peak Heights - Bleach Pretreatment, Centricon 30 NMWLBefore and After Repair
0
1000
2000
3000
4000
5000
6000
AMEL-XAMEL-Y
D3-16
D3-18
D8-13
D8-16
D5-12
D5-13
vWA-17
D21-28
D21-30
D13-8
D13-12
FGA-20 D7-8
D7-10
D18-11
D18-13
Locus - Allele
Ave
rage
Rel
ativ
e Fl
uore
scen
ce U
nits
(RFU
)_
Average Before Repair
Average Repaired with PreCR A
Best Repaired Profile (10 ul)
80
FIG. 19 PreCR A repair of bleach pretreated, Centricon 30 extracted DNA.
Cent30 – recovered with Centricon 30 device, horizontal membrane, nominal molecular weight limit
30,000
Bleach – bone section pretreated with bleach
81
CHAPTER 4
DISCUSSION
Virtually all extraction methods provided more DNA and better quality profiles
with bleach pretreated samples than with UV pretreated samples. By using these two
general approaches, it was possible to generate “high inhibitor” (UV) and “low inhibitor”
(bleach) samples from the same bone, allowing for simulation of a more diverse range
of sample types while retaining the benefits of comparing various methods using a
single sample source. The availability of “high” and “low inhibitor” samples allows a
particular method to be challenged not only with DNA recovery, but with removal of
varying levels of inhibitory compounds commonly encountered in forensic samples. The
varied taphonomy of forensic samples often leaves them impregnated with highly
undesirable plant and microbial derived compounds. Many of the compounds, such as
humic acid, are potent inhibitors of PCR-based genetic analyses. Thus, reduction of
inhibition is essential for successful STR profiling. In many cases it is inhibition, and not
DNA quantity, that hampers efforts to obtain a useable profile from DNA recovered from
a piece of skeletal remains. Simply put, the cleaner the isolated DNA, the more
efficiently downstream processes will work. Therefore, when assessing any extraction
or isolation method, one must strike a balance between maximizing DNA recovery and
minimizing contaminants. An additional consideration when designing the “perfect”
protocol for isolating DNA from skeletalized remains is that not all skeletalized remains
or even bones are the same and each may present a different set of obstacles to be
overcome. Although the results in this study showed that bleach treated bones
82
outperformed UV treated bones in virtually every case, bleach may not always prove to
be the most effective method for surface decontamination. Porous or extremely friable
bone would be quite different with regard to permeability to bleach solutions and in this
case it might be necessary to re-evaluate which decontamination is optimal as part of
ongoing development of DNA extraction methods.
Bone, by its very nature, has a relatively low DNA content. Cell density is well
below that of other common tissues and of course, most forensic bone samples are
collected after a significant post-mortem interval and thus most of the original DNA has
been degraded by natural processes. For this reason, it is critical to recover as much
DNA that remains in a forensic bone sample as is possible. However, increased DNA
recovery is unfortunately often accompanied by increased recovery of unwanted
substances and thus many of the methods that recovered the largest quantities of DNA
also seemed to recover the most inhibitory compounds (AFDIL / 50K UltraFiltration,
PMB B3), complicating downstream applications. This co-purification of some inhibitors
with DNA is not surprising since they often act in a competitive fashion, binding to many
enzymatic components of the downstream processing reactions. It was therefore not
surprising that the extraction methods that were most successful overall (Modified
AFDIL / 50K UltraFiltration, PMB A3, PMB A6) seemed to forgo a small amount of DNA
recovery in favor of increased DNA purity.
Results from the isolations from the QIAquick® columns (Qiagen Inc., Valencia,
CA, www1.qiagen.com) clearly demonstrated that larger extract volumes resulted in
smaller DNA recoveries and reduced quality of the subsequent STR profiles. The effect
of a three-fold increase in extract volume was assessed to determine whether this might
83
allow for greater recovery of DNA from the 0.5 g bone powder sample. It appears that,
although more DNA may have been solubilized form the bone, the overall increase in
extracted material may have caused an excessive accumulation of filtrates on the
membrane surface, prohibiting proper contact of the DNA with the glass fiber matrix and
in the final analysis leading to lower DNA recoveries. In addition, it is likely that reduced
washing efficiency also occurred for this reason, leading to poorer STR profile quality
when the recovered DNA was subjected to analysis with Profiler Plus™ ID (Applied
Biosystems Inc., Forster City, CA, www.appliedbiosystems.com). Discussions with Dr.
Mike Brownleader led to a collaboration with Generon Inc. to produce larger prototype
silica columns (PMB columns) that would be able to more effectively handle larger
volumes of crude DNA extract. As has been shown in this study, these columns allow
for purification of nucleic acids directly after decalcification and protein digestion, without
the need for organic extraction or sample concentration (52). This simplification of the
protocol substantially reduces the number of handling steps and sample transfers
required, as well as eliminating the use of hazardous compounds such as phenol and
chloroform. For example, the entire volume of crude DNA extract plus binding buffer can
be loaded onto the PMB column in a single step. Based upon the overall performance of
these columns, we intend to continue the effort to “fine-tune” the protocol to further
enhance DNA recovery as well as reduce the presence of co-purifying inhibitors.
Recovery of DNA from bone can involve a long and labor-intensive protocol. In
the case of the protocols assessed in this study, most required an overnight digestion
step, with the exception being HSC/YM100, which actually required two. Although this is
a “set-it and forget it” step, it does increase the time required to complete the overall
84
process substantially and in forensics time can sometimes be a critical consideration.
Bench time, here defined as the analyst’s hands-on time required to complete the
extraction, is also an important factor when designing new isolation protocols
particularly since it is prudent for analysts to work single cases or even single samples
at a time.
Following the extended decalcification/digestion steps, each of the isolation
procedures required hand-on processing time that varied from ~2.5 hours for the PMB
columns to ~4+ hours for the Modified AFDIL ultrafiltration method. Here it is clear that
less time spent handling an extraction translates into the ability to process more
samples in a given period of time. The PMB process also eliminates the phenol and
chloroform treatments. The elimination of steps involving dangerous organic
compounds has several positive outcomes. Phenol is a corrosive contact hazard that
anesthetizes the skin as destroys it, leaving many laboratory workers unaware there is a
problem until the damage is quite severe. Phenol and chloroform are both inhalation
hazards; chloroform can cause permanent, cumulative liver damage and is a known
carcinogen. The inhalation hazard necessitates the use of a chemical fume hood when
carrying out organic extractions and thus the elimination of this step gives substantial
cost savings by eradicating several handling steps (labor), and reducing or eliminating
the need for chemical fume hoods, as well as the time and expense associated with the
proper disposal of hazardous organic compounds.
Forensic scientists have explored the application of whole genome amplification
to improve results when dealing with low copy number samples. The goal of WGA is to
increase the number of copies of DNA in a sample without substantially altering
85
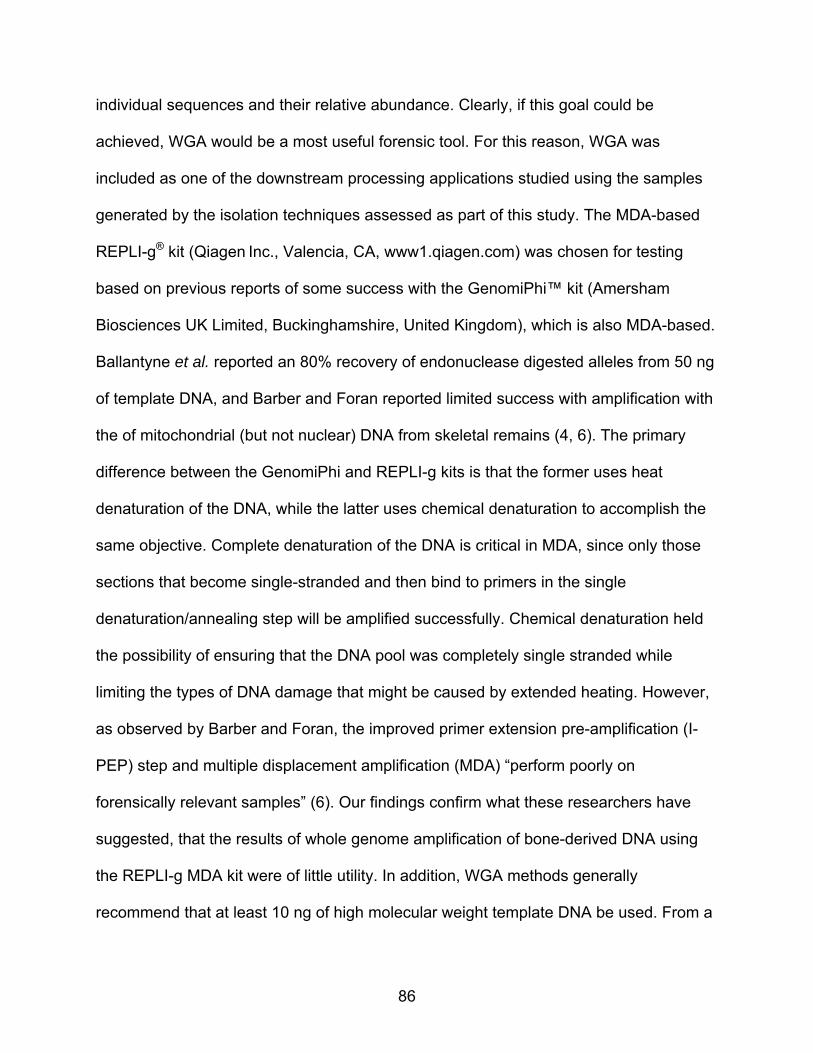
individual sequences and their relative abundance. Clearly, if this goal could be
achieved, WGA would be a most useful forensic tool. For this reason, WGA was
included as one of the downstream processing applications studied using the samples
generated by the isolation techniques assessed as part of this study. The MDA-based
REPLI-g® kit (Qiagen Inc., Valencia, CA, www1.qiagen.com) was chosen for testing
based on previous reports of some success with the GenomiPhi™ kit (Amersham
Biosciences UK Limited, Buckinghamshire, United Kingdom), which is also MDA-based.
Ballantyne et al. reported an 80% recovery of endonuclease digested alleles from 50 ng
of template DNA, and Barber and Foran reported limited success with amplification with
the of mitochondrial (but not nuclear) DNA from skeletal remains (4, 6). The primary
difference between the GenomiPhi and REPLI-g kits is that the former uses heat
denaturation of the DNA, while the latter uses chemical denaturation to accomplish the
same objective. Complete denaturation of the DNA is critical in MDA, since only those
sections that become single-stranded and then bind to primers in the single
denaturation/annealing step will be amplified successfully. Chemical denaturation held
the possibility of ensuring that the DNA pool was completely single stranded while
limiting the types of DNA damage that might be caused by extended heating. However,
as observed by Barber and Foran, the improved primer extension pre-amplification (I-
PEP) step and multiple displacement amplification (MDA) “perform poorly on
forensically relevant samples” (6). Our findings confirm what these researchers have
suggested, that the results of whole genome amplification of bone-derived DNA using
the REPLI-g MDA kit were of little utility. In addition, WGA methods generally
recommend that at least 10 ng of high molecular weight template DNA be used. From a
86
forensic perspective, a yield of 10 ng of high-quality DNA extracted from any sample
represents a more than sufficient quantity of DNA for virtually any and all desired
downstream analyses. Clearly, the potential benefit, if any, is far outweighed by the
potential risk of altering the endogenous sequences or their relative abundance.
Forensic DNA samples are well-known for experiencing destructive taphonomic
conditions, and thus have often endured a wide range of microbial and other
environmental insults. This often results in DNA molecules that have been substantially
reduced in size and that contain a wide range of DNA damage. Relevant types of DNA
damage range from simple single-strand breaks to missing or modified bases. The goal
of incorporating a DNA repair protocol into downstream processing of samples is simply
to achieve a reduction in those lesions that interfere with subsequent enzymatic
amplification of the DNA during PCR-based genetic analyses. The results obtained in
this study confirmed the utility of the commercially available New England Biolabs
PreCR™ A DNA repair enzyme cocktail (New England Biolabs, Ipswitch, MA,
www.neb.com) to improve STR profile quality for almost all samples isolated using a
range of protocols. This improvement could be achieved even when the repair process
resulted in a moderate reduction in template quantity. Through a collaboration with
scientists at New England Biolabs, it was possible to asses an as yet commercially
unavailable related DNA repair cocktail tentatively named PreCR T6. The T6 cocktail
uniformly failed to improve the quality of all samples on which it was tested, leading to
their failure to profile. This included even the undamaged 9947A control sample, whose
reaction failed after treatment with the cocktail. Although this new cocktail under
development may have properties that will prove useful with forensic samples in the
87
future, it appears at this time that the T6 cocktail includes buffer components which are
incompatible with downstream genetic analyses such as Profiler Plus ID. However,
although it is clear that there are issues still to be resolved, it is equally clear that the
application of DNA repair cocktails to many forensic DNA isolates will substantially
improve our ability to successfully generate STR or other genetic profiles.
As a final thought, for good scientific reasons all results were obtained from bone
powder generated from a single femur. This provided the most consistent basis possible
for comparison of various extraction methods. However, as noted above, not all forensic
samples are the same even if limited to comparing those which are classified as skeletal
remains. With this in mind, there will be a future need to further assess isolation
techniques using a wider range of bone sources with varied taphonomic histories. This
would include an assessment of our most promising extraction protocols (PMB A6,
Modified AFDIL 50K ultrafiltration) using a wider range of sample types. Further testing
is also needed to explore the possibility of improving whole genome amplification results
by circularizing the DNA template molecules prior to multiple displacement amplification
with Φ29 polymerase. In addition, the overall utility of whole genome amplification and
DNA repair must be assessed using the variety of samples generated during testing of
DNA extraction methods on various bone sources. This project has laid the foundation
for improvement of STR profiling results via improved extraction methods and DNA
repair. What remains to be done is to challenge the robustness of these methods on
skeletal remains representative of the diverse preservation states likely to be
encountered in forensic casework.
88
CHAPTER 5
SUMMARY
Forensic molecular biology has made enormous technical advances in the last
two decades, allowing its practitioners to put to rest cases that would have been
deemed unsolvable thirty years ago. The pace of technological advancement has not
slowed, but while the methods in common practice today are powerful discriminatory
tools, many are labor-intensive, technically challenging, and unable to cope with the
myriad of preservation states encountered in missing persons cases. Updated,
streamlined protocols can require less time from a technician, be less error-prone, and
are less likely to necessitate repeated processing of the same sample – contributing to
increased sample throughput and reduced case backlog.
The primary objectives of this project were: 1. to develop improved methods for
extraction of DNA from human skeletal remains, 2. to improve STR profiling success of
low-copy DNA samples by employing whole genome amplification to amplify the total
pool of DNA prior to STR analysis, and 3. to improve STR profiling success of damaged
DNA templates by using DNA repair enzymes to reduce the number/severity of lesions
that interfere with STR profiling.
Regardless of extraction method, bleach pretreated samples provided more DNA
and better quality profiles than UV pretreated samples. Bleach and UV pretreatment
also provide an opportunity to generate “high inhibitor” (UV) and “low inhibitor” (bleach)
samples from the same bone, allowing for simulation of a more diverse range of sample
types while retaining the benefits of comparing various methods using a single sample
source.
89
In the case of DNA extraction from bone, sometimes less is more. Many of the
methods that recovered the largest quantities of DNA also seemed to recover more
inhibitory compounds (AFDIL / 50K UltraFiltration, PMB B3). The methods that were
most successful overall (Modified AFDIL / 50K UltraFiltration, PMB A3, PMB A6)
seemed to forgo a small amount of DNA recovery in favor of increased DNA purity.
Another example of “less is more” is that the larger the volume of extract processed
through the QIAquick® (Qiagen Inc., Valencia, CA, www1.qiagen.com) columns, the
smaller the amount of DNA recovered and the poorer the STR profile. This was likely
caused by filtrates accumulating on the membrane surface, prohibiting proper contact of
the DNA and other reagents with the glass fiber (silica).
All methods tested required at least one overnight digestion step (with the
exception of HSC/YM100, which required two), but the time required to complete the
extraction varied from 2.5 hours for the PMB columns (which also eliminated the use of
phenol and chloroform) to 4-6 hours for the Modified AFDIL ultrafiltration methods.
Attempts to perform whole genome amplification with REPLI-g® (Qiagen Inc.,
Valencia, CA, www1.qiagen.com) significantly reduced profile quality. DNA repair with
PreCR™ A (New England Biolabs, Ipswitch, MA, www.neb.com) led to STR profile
improvement in all but one case, and 2-100+ fold increases in peak height for the larger
amplicons in half of the samples. DNA repair with PreCR T6 led to a loss of loci present
in the profiles. The Profiler Plus™ ID (Applied Biosystems Inc., Forster City, CA,
www.appliedbiosystems.com) reaction was likely affected by inhibitors present in the
PreCR T6 mix, as even the undamaged control DNA failed to yield a full profile when
combined with the T6 cocktail.
90
Inhibitory compounds must be removed prior to enzymatic amplification; either
during bone section pretreatment or by the DNA extraction method. Overall, bleach
outperformed UV as a pretreatment and DNA extraction using silica outperformed
microconcentration and organic extraction. DNA repair with PreCR A outperformed both
whole genome amplification and repair with PreCR T6. Superior DNA extraction results
were achieved using the A6 PMB columns, and DNA repair with PreCR A led to an
overall improvement in profile quality in most cases, although whole genome
amplification was unsuccessful. Rapid, robust DNA isolation, successful amplification of
loci from the sample-derived DNA pool, and an elimination of DNA damage and
inhibitors may assist in providing sufficient genetic information from cases that might
otherwise lie on the fringe of what is possible to obtain today.
91
REFERENCES
1. ABI. 2006. AmpFlSTR Profiler Plus Amplification. In B. Applied (ed.),
Amplification Protocol.
2. ABI. 2006. Quantifiler kits. In A. Biosystems (ed.), Quantifiler human DNA
quantification kit and quantifiler Y human male DNA quantification kit.
3. Aliotta, J. M., J. J. Pelletier, J. L. Ware, L. S. Moran, J. S. Benner, and H.
Kong. 1996. Thermostable Bst DNA polymerase I lacks a 3'-->5' proofreading
exonuclease activity. Genet Anal 12:185-95.
4. Ballantyne, K. N., R. A. van Oorschot, and R. J. Mitchell. 2007. Comparison
of two whole genome amplification methods for STR genotyping of LCN and
degraded DNA samples. Forensic Sci Int 166:35-41.
5. Barany, F. 1991. Genetic disease detection and DNA amplification using cloned
thermostable ligase. Proc Natl Acad Sci U S A 88:189-93.
6. Barber, A. L., and D. R. Foran. 2006. The utility of whole genome amplification
for typing compromised forensic samples. J Forensic Sci 51:1344-9.
7. Barker, D. L., M. S. Hansen, A. F. Faruqi, D. Giannola, O. R. Irsula, R. S.
Lasken, M. Latterich, V. Makarov, A. Oliphant, J. H. Pinter, R. Shen, I.
Sleptsova, W. Ziehler, and E. Lai. 2004. Two methods of whole-genome
amplification enable accurate genotyping across a 2320-SNP linkage panel.
Genome Res 14:901-7.
92
8. Blanco, L., A. Bernad, J. M. Lazaro, G. Martin, C. Garmendia, and M. Salas.
1989. Highly efficient DNA synthesis by the phage phi 29 DNA polymerase.
Symmetrical mode of DNA replication. J Biol Chem 264:8935-40.
9. Boom, R., C. J. Sol, M. M. Salimans, C. L. Jansen, P. M. Wertheim-van
Dillen, and J. van der Noordaa. 1990. Rapid and simple method for purification
of nucleic acids. J Clin Microbiol 28:495-503.
10. Capt, C. 2006. In M. Turnbough (ed.). Ft. Worth, TX.
11. Creighton, T. E. 1993. Proteins: structures and molecular properties, 2 ed, vol.
W. H. Freeman and Company, New York.
12. Dizdaroglu, M., J. Laval, and S. Boiteux. 1993. Substrate specificity of the
Escherichia coli endonuclease III: excision of thymine- and cytosine-derived
lesions in DNA produced by radiation-generated free radicals. Biochemistry
32:12105-11.
13. DNA.gov. 2003. Advancing justice through DNA technology. In P. s. D. Initiative
(ed.). Department of Justice.
14. Evans, T., and L. Chen. 2008. Investigational DNA repair enzymes. In M.
Turnbough (ed.). New England Biolabs.
15. Gammon, S. 2006. In M. Turnbough (ed.). Fort Worth, TX.
16. Gotherstrom, A., M. J. Collins, A. Angerbjorn, and K. Liden. 2002. Bone
preservation and DNA amplification. Archaeometry 44:395-404.
17. Green, E. D., R. M. Mohr, J. R. Idol, M. Jones, J. M. Buckingham, L. L.
Deaven, R. K. Moyzis, and M. V. Olson. 1991. Systematic generation of
sequence-tagged sites for physical mapping of human chromosomes: application
93
to the mapping of human chromosome 7 using yeast artificial chromosomes.
Genomics 11:548-64.
18. Higgins, K. M., and R. S. Lloyd. 1987. Purification of the T4 endonuclease V.
Mutat Res 183:117-21.
19. Hoss, M., P. Jaruga, T. H. Zastawny, M. Dizdaroglu, and S. Paabo. 1996.
DNA damage and DNA sequence retrieval from ancient tissues. Nucleic Acids
Res 24:1304-7.
20. Hudson, T. J., L. D. Stein, S. S. Gerety, J. Ma, A. B. Castle, J. Silva, D. K.
Slonim, R. Baptista, L. Kruglyak, S. H. Xu, X. Hu, A. M. Colbert, C.
Rosenberg, M. P. Reeve-Daly, S. Rozen, L. Hui, X. Wu, C. Vestergaard, K. M.
Wilson, J. S. Bae, S. Maitra, S. Ganiatsas, C. A. Evans, M. M. DeAngelis, K.
A. Ingalls, R. W. Nahf, L. T. Horton, Jr., M. O. Anderson, A. J. Collymore, W.
Ye, V. Kouyoumjian, I. S. Zemsteva, J. Tam, R. Devine, D. F. Courtney, M. T.
Renaud, H. Nguyen, T. J. O'Connor, C. Fizames, S. Faure, G. Gyapay, C.
Dib, J. Morissette, J. B. Orlin, B. W. Birren, N. Goodman, J. Weissenbach, T.
L. Hawkins, S. Foote, D. C. Page, and E. S. Lander. 1995. An STS-based map
of the human genome. Science 270:1945-54.
21. Hughes, S., G. Lim, B. Beheshti, J. Bayani, P. Marrano, A. Huang, and J. A.
Squire. 2004. Use of whole genome amplification and comparative genomic
hybridisation to detect chromosomal copy number alterations in cell line material
and tumour tissue. Cytogenet Genome Res 105:18-24.
22. Kemp, B. M., and D. G. Smith. 2005. Use of bleach to eliminate contaminating
DNA from the surface of bones and teeth. Forensic Sci Int 154:53-61.
94
23. Keyser-Tracqui, C., E. Crubezy, and B. Ludes. 2003. Nuclear and
mitochondrial DNA analysis of a 2,000-year-old necropolis in the Egyin Gol
Valley of Mongolia. Am J Hum Genet 73:247-60.
24. Kimpton, C., A. Walton, and P. Gill. 1992. A further tetranucleotide repeat
polymorphism in the vWF gene. Hum Mol Genet 1:287.
25. Kittler, R., M. Stoneking, and M. Kayser. 2002. A whole genome amplification
method to generate long fragments from low quantities of genomic DNA. Anal
Biochem 300:237-44.
26. Levin, B. C., H. Cheng, and D. J. Reeder. 1999. A human mitochondrial DNA
standard reference material for quality control in forensic identification, medical
diagnosis, and mutation detection. Genomics 55:135-46.
27. Levin, J. D., A. W. Johnson, and B. Demple. 1988. Homogeneous Escherichia
coli endonuclease IV. Characterization of an enzyme that recognizes oxidative
damage in DNA. J Biol Chem 263:8066-71.
28. Li, H., L. Schmidt, M. H. Wei, T. Hustad, M. I. Lerman, B. Zbar, and K. Tory.
1993. Three tetranucleotide polymorphisms for loci: D3S1352; D3S1358;
D3S1359. Hum Mol Genet 2:1327.
29. Lindahl, T., S. Ljungquist, W. Siegert, B. Nyberg, and B. Sperens. 1977. DNA
N-glycosidases: properties of uracil-DNA glycosidase from Escherichia coli. J
Biol Chem 252:3286-94.
30. Loreille, O. M., and S. M. Barritt. 2006. Standard practice - demineralization
extraction procedure for aged skeletal remains. In M. Turnbough (ed.), Updated
AFDIL protocol ed., Rockville, MD.
95
31. Loreille, O. M., T. M. Diegoli, J. A. Irwin, M. D. Coble, and T. J. Parsons.
2007. High efficiency DNA extraction from bone by total demineralization.
Forensic Science International: Genetics 1:191-195.
32. Luthra, R., and L. J. Medeiros. 2004. Isothermal multiple displacement
amplification: a highly reliable approach for generating unlimited high molecular
weight genomic DNA from clinical specimens. J Mol Diagn 6:236-42.
33. Millipore. 2007. Amicon Ultra-4 centrifugal filter devices. User Guide. Millipore
Corporation.
34. Millipore. 2005. Microcon centrifugal filter devices. User Guide. Millipore
Corporation.
35. Mills, K. A., D. Even, and J. C. Murray. 1992. Tetranucleotide repeat
polymorphism at the human alpha fibrinogen locus (FGA). Hum Mol Genet
1:779.
36. New England Biolabs, I. 2007. PreCR Repair Mix. Technical Bulletin for PreCR
Repair Mix.
37. Oldroyd, N. J., A. J. Urquhart, C. P. Kimpton, E. S. Millican, S. K. Watson, T.
Downes, and P. D. Gill. 1995. A highly discriminating octoplex short tandem
repeat polymerase chain reaction system suitable for human individual
identification. Electrophoresis 16:334-7.
38. Paabo, S. 1989. Ancient DNA: extraction, characterization, molecular cloning,
and enzymatic amplification. Proc Natl Acad Sci U S A 86:1939-43.
39. Qiagen. 2003. QIAamp DNA Micro Handbook. Product Literature for Purification
of Genomic DNA with QIAamp Kit Qiagen.
96
40. Qiagen. 2002. QIAquick spin handbook. Product Literature for QIAquick PCR
purification kit.
41. Ritchie, P. 2002. Ancient DNA extractions, p. 1-6.
42. Rudin, N., and K. Inman. 2002. An introduction to forensic DNA analysis, 2nd
ed, vol. CRC Press LLC, Boca Raton, Florida.
43. Sambrook, J., E. F. Fritch, and T. Maniatis. 1989. Molecular cloning
A laboratory manual, 2nd ed, vol. Cold Spring Harbor Laboratory Press, Cold Spring
Harbor.
44. Sharma, V., and M. Litt. 1992. Tetranucleotide repeat polymorphism at the
D21S11 locus. Hum Mol Genet 1:67.
45. Steadman, D. W., L. L. DiAntonio, J. J. Wilson, K. E. Sheridan, and S. P.
Tammariello. 2006. The effects of chemical and heat maceration techniques on
the recovery of nuclear and mitochondrial DNA from bone. J Forensic Sci 51:11-
7.
46. Sullivan, K. M., A. Mannucci, C. P. Kimpton, and P. Gill. 1993. A rapid and
quantitative DNA sex test: fluorescence-based PCR analysis of X-Y homologous
gene amelogenin. Biotechniques 15:636-8, 640-1.
47. Sun, F., N. Arnheim, and M. S. Waterman. 1995. Whole genome amplification
of single cells: mathematical analysis of PEP and tagged PCR. Nucleic Acids
Res 23:3034-40.
48. Tchou, J., V. Bodepudi, S. Shibutani, I. Antoshechkin, J. Miller, A. P.
Grollman, and F. Johnson. 1994. Substrate specificity of Fpg protein.
97
Recognition and cleavage of oxidatively damaged DNA. J Biol Chem 269:15318-
24.
49. Thompson, L., D. N. Rodier, K. E. Lewis, K. M. Meyer, and T. D. Cruz. 2006.
Presented at the American Academy of Forensic Sciences Annual Meeting,
Seattle, Washington, February 20-25.
50. UNTHSC Tuesday, April 25, 2006 1:18:20 PM 2006, posting date. Texas Missing
Person Database, University of North Texas Health Science Center. [Online.]
51. Urquhart, A., N. J. Oldroyd, C. P. Kimpton, and P. Gill. 1995. Highly
discriminating heptaplex short tandem repeat PCR system for forensic
identification. Biotechniques 18:116-8, 120-1.
52. Yang, D. Y., B. Eng, J. S. Waye, J. C. Dudar, and S. R. Saunders. 1998.
Technical note: improved DNA extraction from ancient bones using silica-based
spin columns. Am J Phys Anthropol 105:539-43.
98