Embed Size (px)
Citation preview
APPLICATIONS OF PETROLEUM SYSTEMS MODELING IN CCUS
2017 CO2 for EOR as CCUS Conference: Houston, TX
GRAGG, Evan1, VAN WIJK, Jolante1 and BALCH, Robert2
(1) Department of Earth and Environmental Science, New Mexico Tech
(2) Petroleum Recovery Research Center, New Mexico Tech
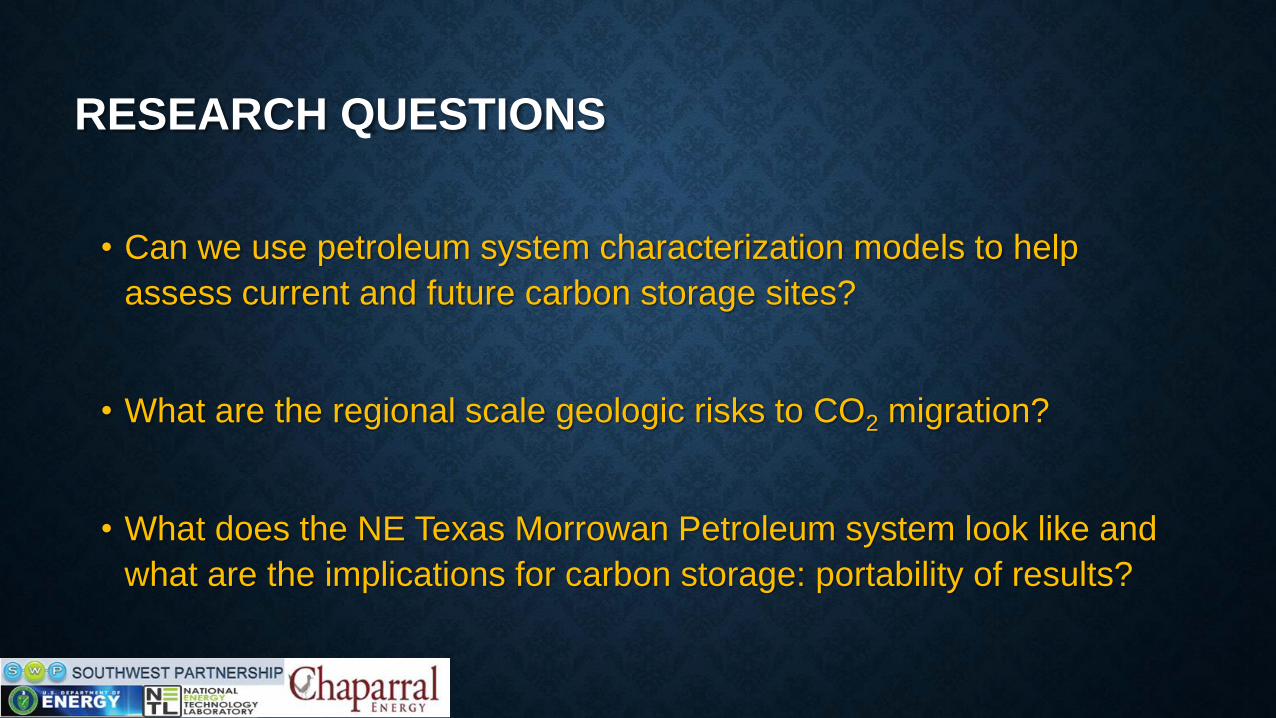
RESEARCH QUESTIONS
• Can we use petroleum system characterization models to help
assess current and future carbon storage sites?
• What are the regional scale geologic risks to CO2 migration?
• What does the NE Texas Morrowan Petroleum system look like and
what are the implications for carbon storage: portability of results?
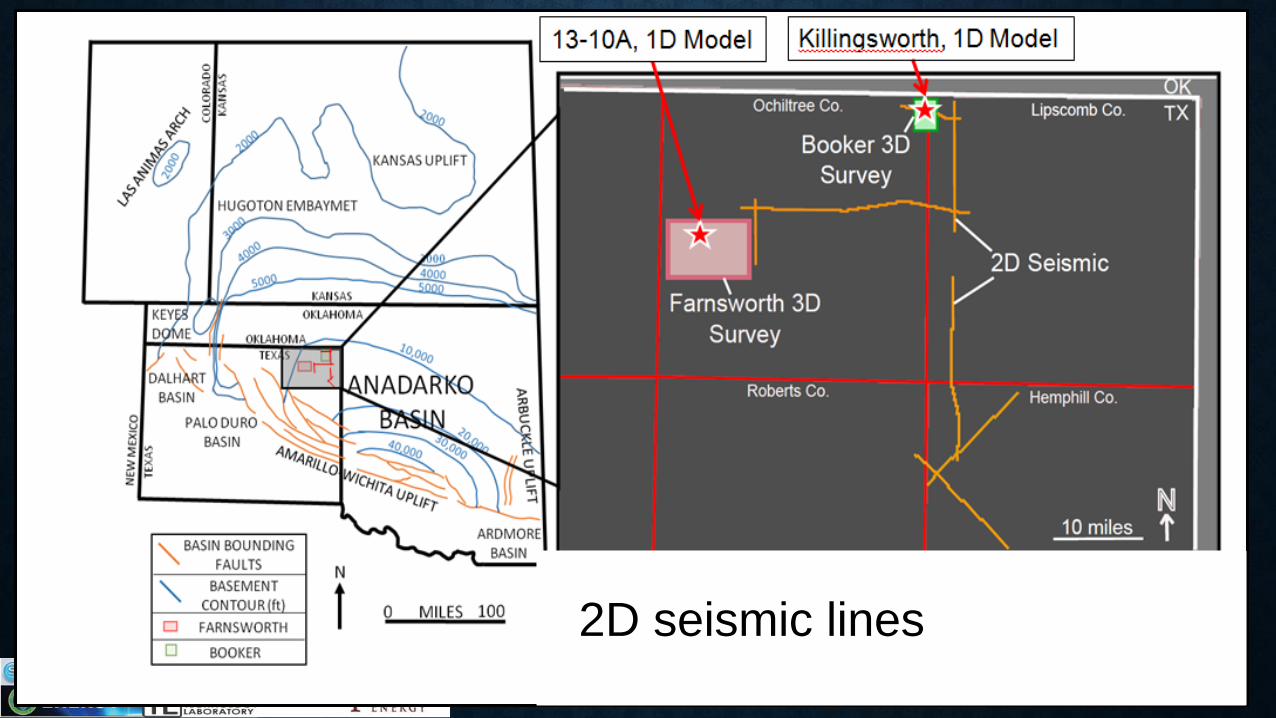
ANADARKO BASIN3D seismic surveys:
Farnsworth and BookerWells: 13-10A and Killingsworth2D seismic lines
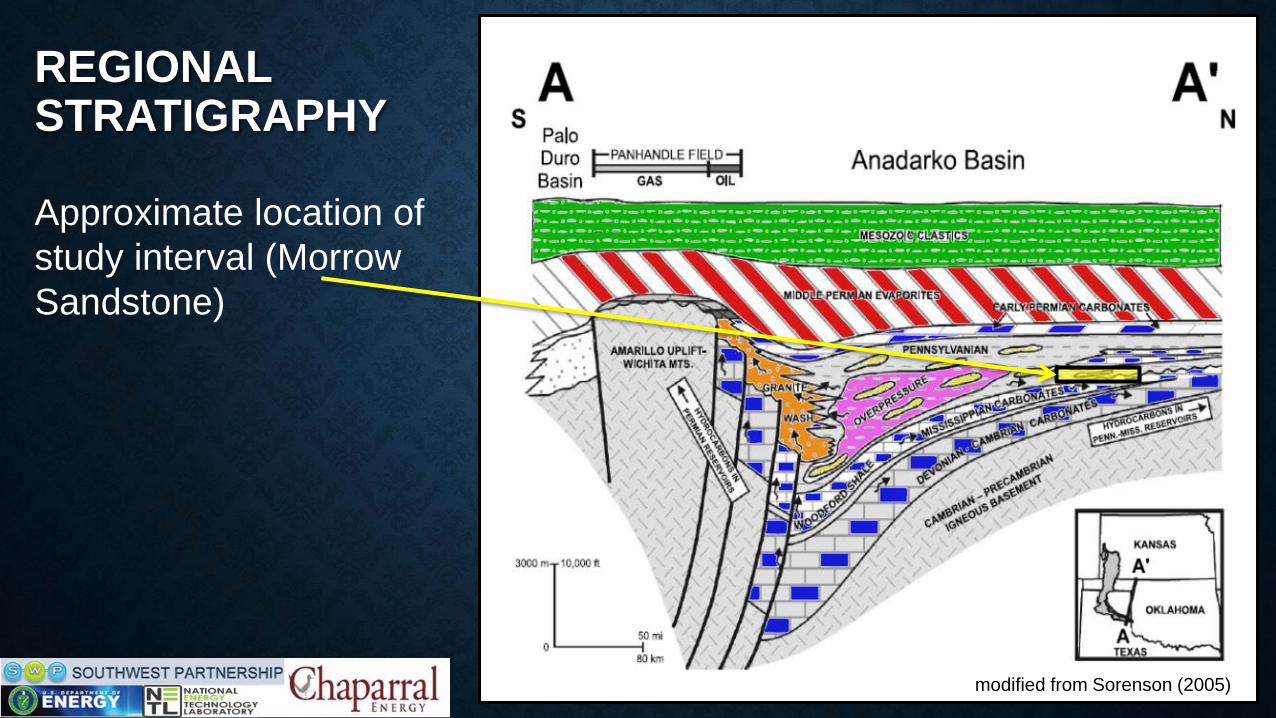
REGIONAL STRATIGRAPHY
Approximate location of
study interval (Morrow
Sandstone)
modified from Sorenson (2005)
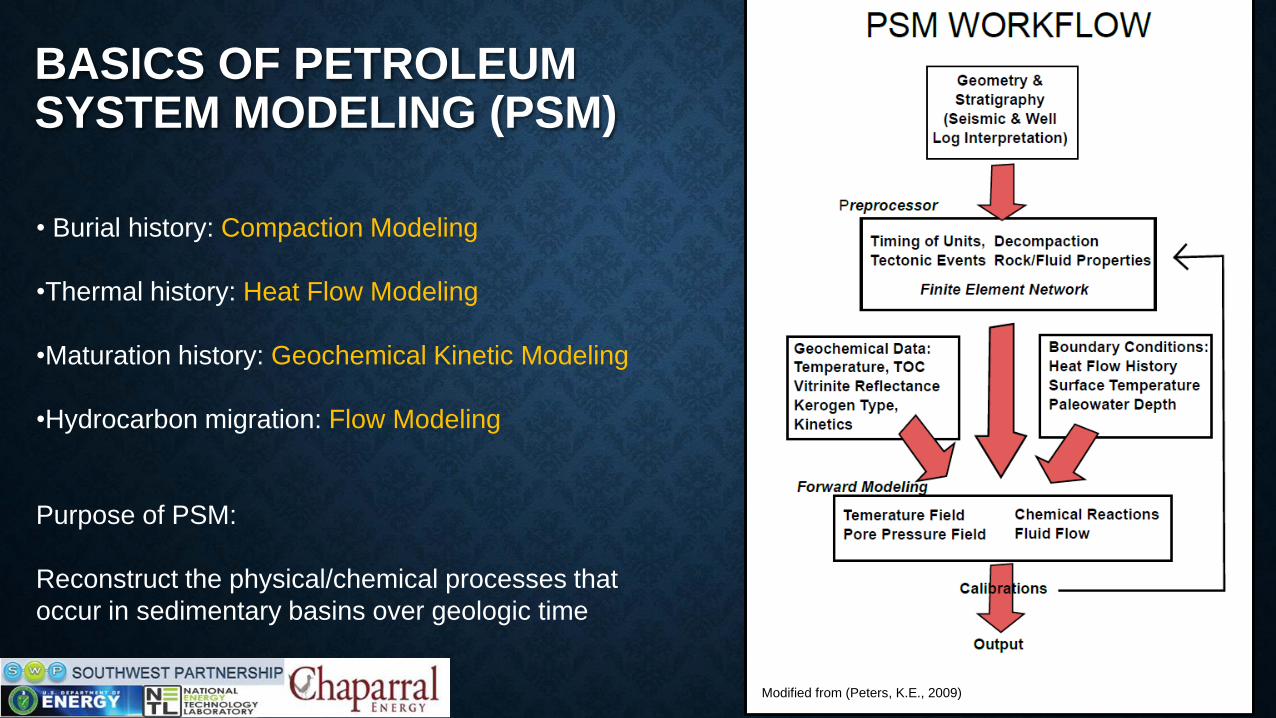
BASICS OF PETROLEUM SYSTEM MODELING (PSM)
Modified from (Peters, K.E., 2009)
• Burial history: Compaction Modeling
•Thermal history: Heat Flow Modeling
•Maturation history: Geochemical Kinetic Modeling
•Hydrocarbon migration: Flow Modeling
Purpose of PSM:
Reconstruct the physical/chemical processes that
occur in sedimentary basins over geologic time
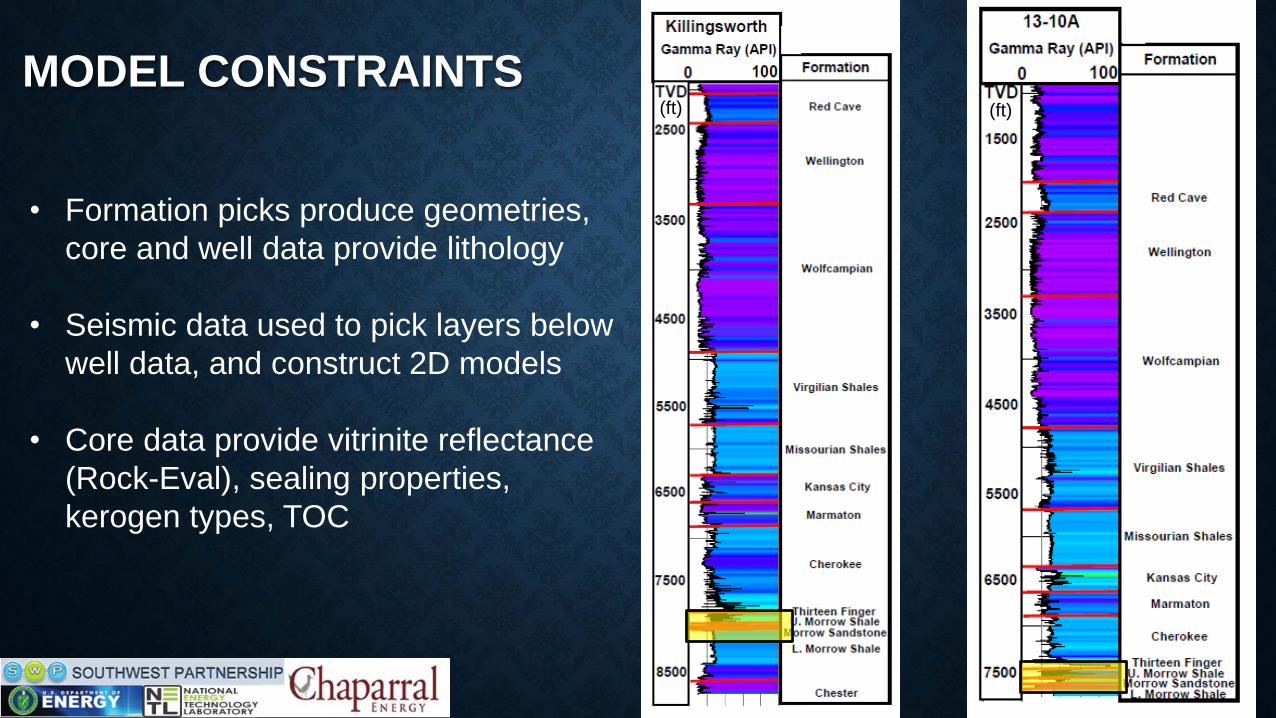
MODEL CONSTRAINTS
• Formation picks produce geometries,
core and well data provide lithology
• Seismic data used to pick layers below
well data, and construct 2D models
• Core data provide vitrinite reflectance
(Rock-Eval), sealing properties,
kerogen types, TOC
(ft)(ft)
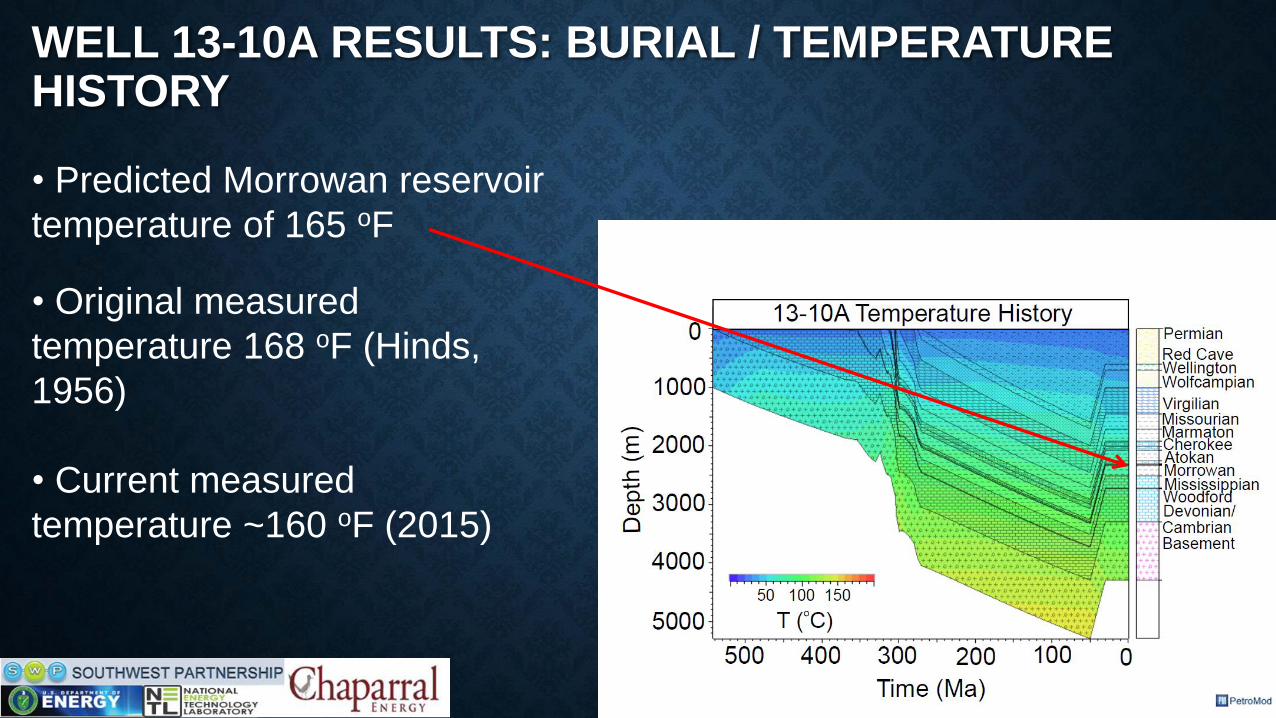
WELL 13-10A RESULTS: BURIAL / TEMPERATURE HISTORY
• Predicted Morrowan reservoir
temperature of 165 oF
• Original measured
temperature 168 oF (Hinds,
1956)
• Current measured
temperature ~160 oF (2015)
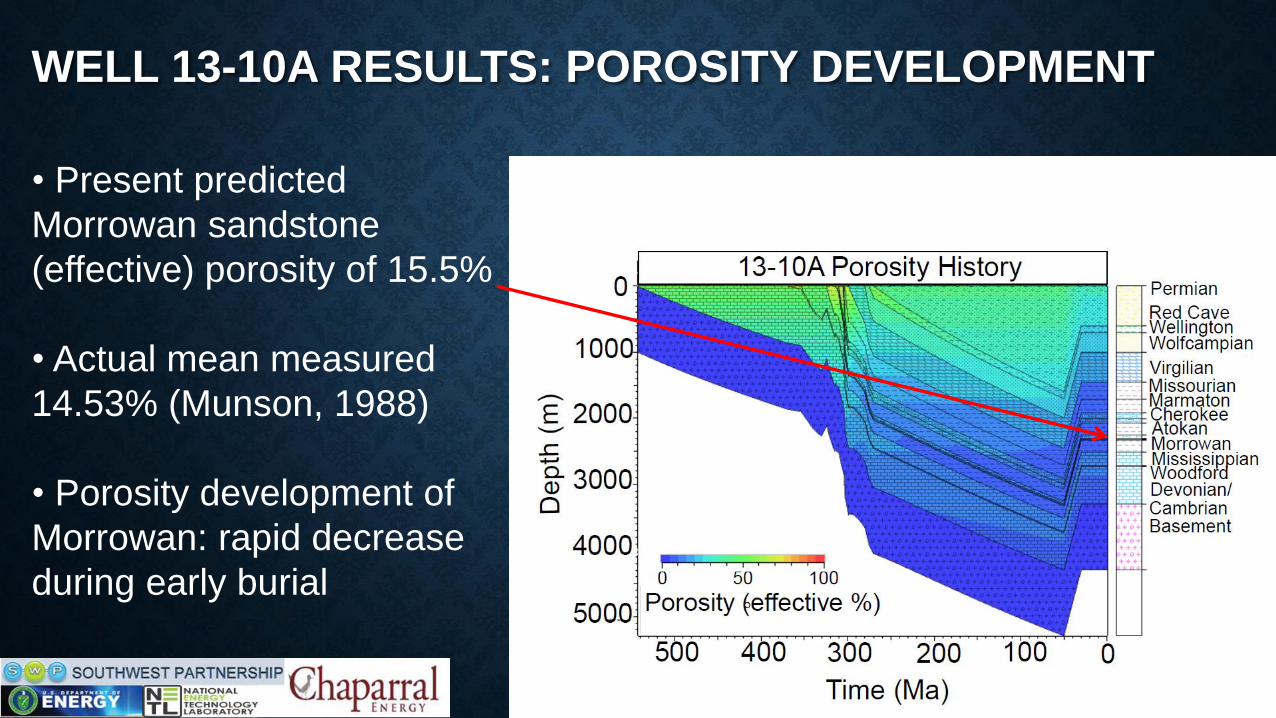
• Present predicted
Morrowan sandstone
(effective) porosity of 15.5%
• Actual mean measured
14.53% (Munson, 1988)
• Porosity development of
Morrowan: rapid decrease
during early burial
WELL 13-10A RESULTS: POROSITY DEVELOPMENT
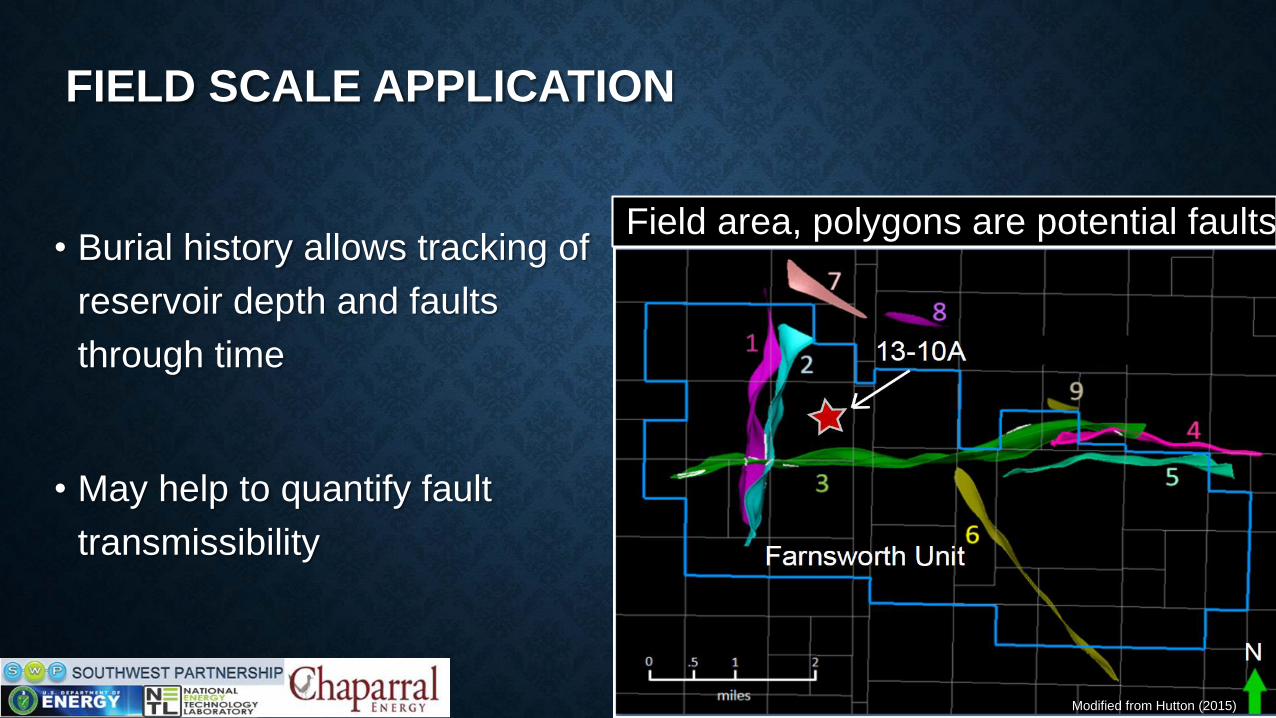
FIELD SCALE APPLICATION
• Burial history allows tracking of
reservoir depth and faults
through time
• May help to quantify fault
transmissibility
Modified from Hutton (2015)
Field area, polygons are potential faults
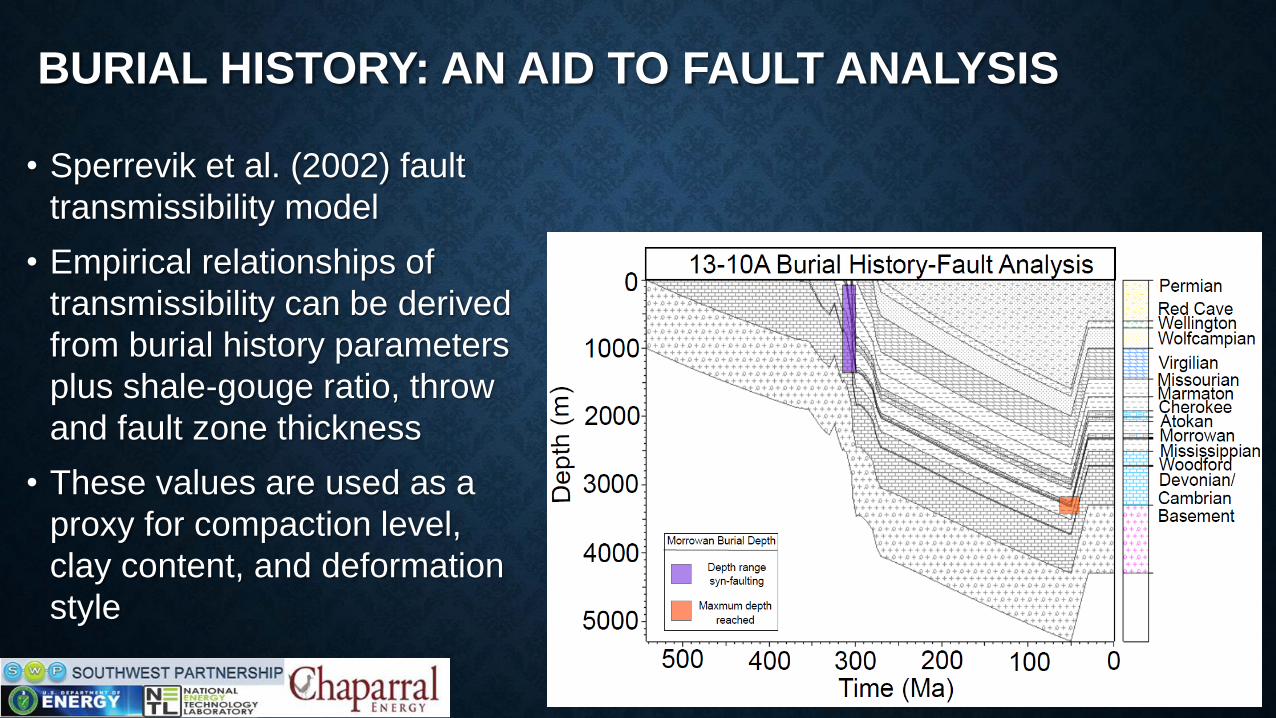
BURIAL HISTORY: AN AID TO FAULT ANALYSIS
• Sperrevik et al. (2002) fault
transmissibility model
• Empirical relationships of
transmissibility can be derived
from burial history parameters
plus shale-gouge ratio, throw
and fault zone thickness
• These values are used as a
proxy for compaction level,
clay content, and deformation
style
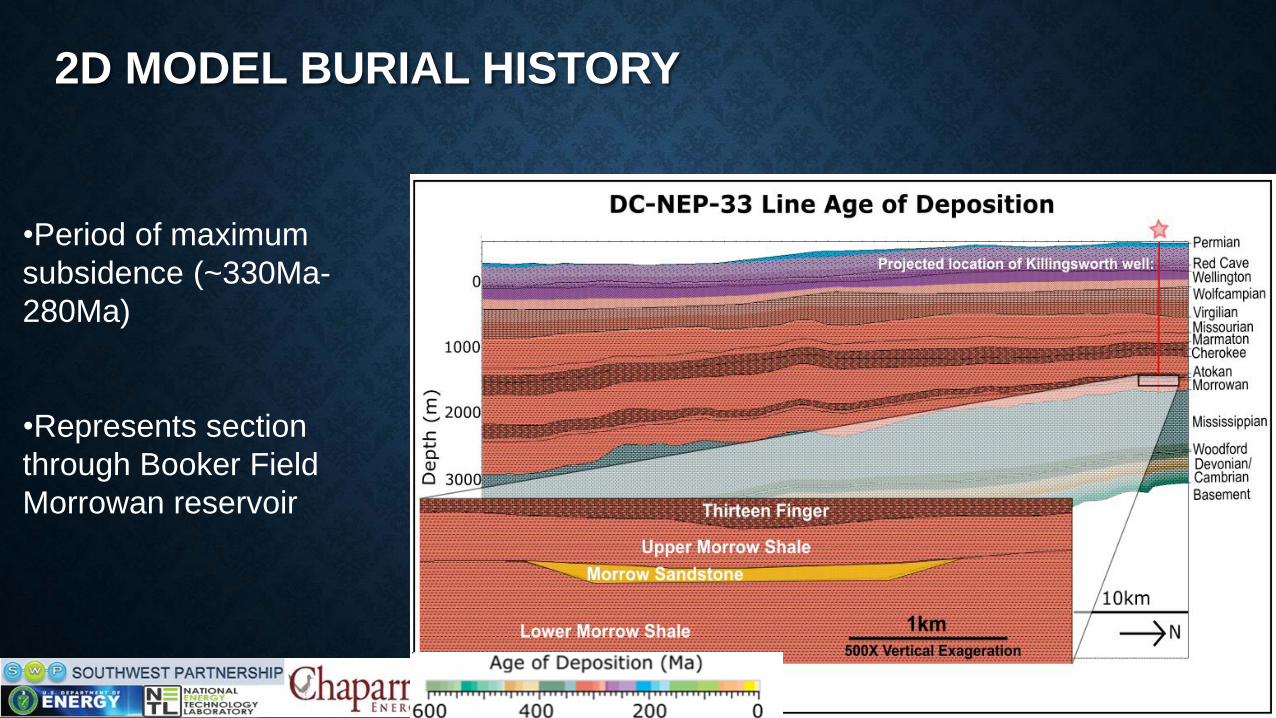
2D MODEL BURIAL HISTORY
Killingworth well location
projected to line:
•Period of maximum
subsidence (~330Ma-
280Ma)
•Represents section
through Booker Field
Morrowan reservoir
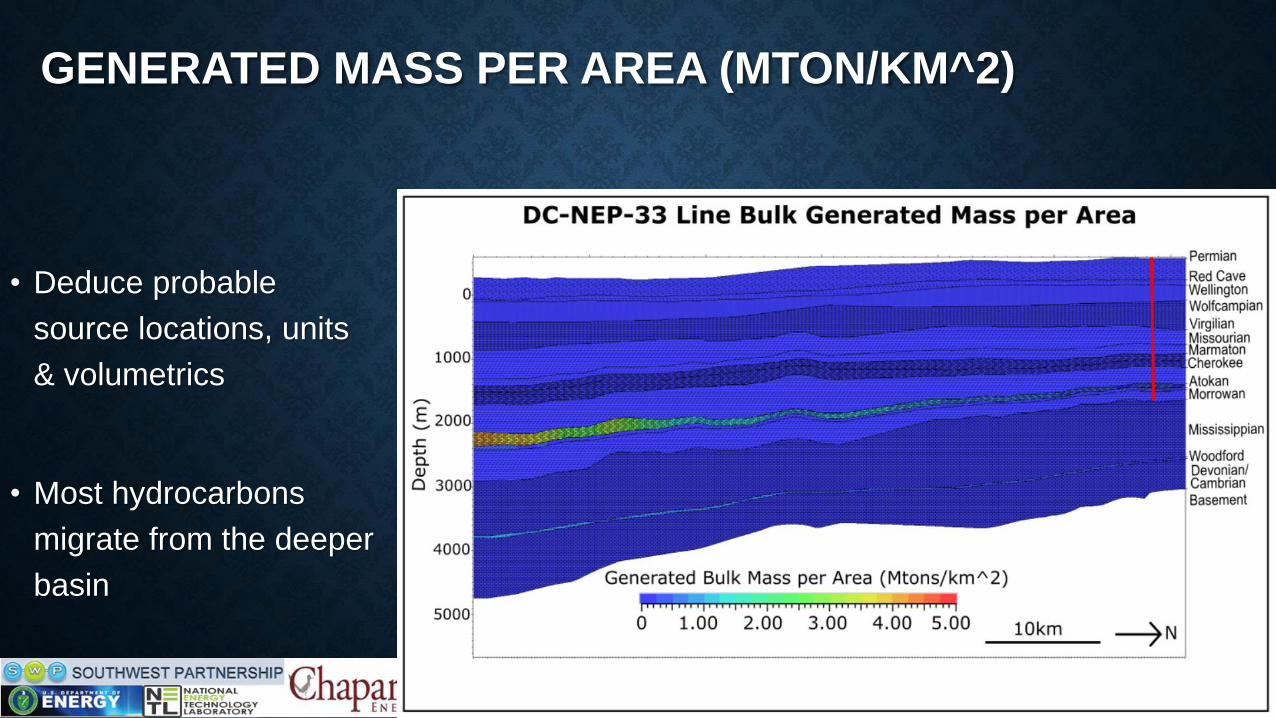
GENERATED MASS PER AREA (MTON/KM^2)
• Deduce probable
source locations, units
& volumetrics
• Most hydrocarbons
migrate from the deeper
basin
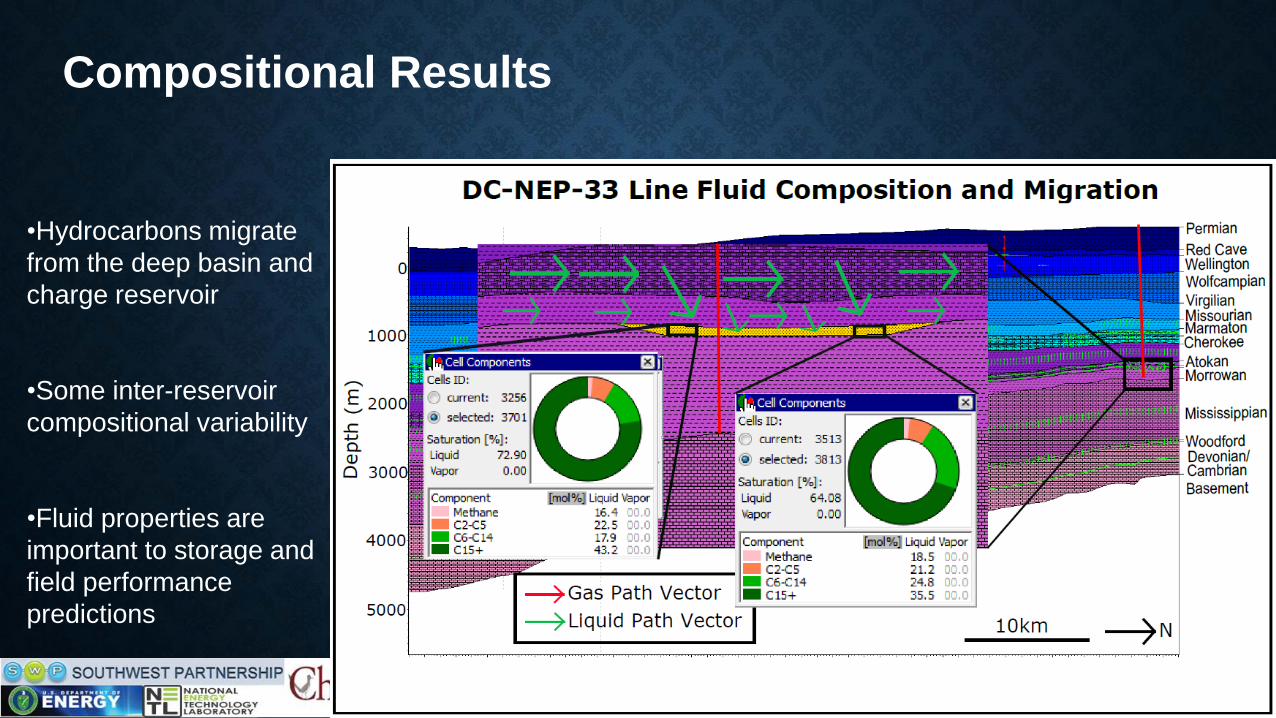
•Hydrocarbons migrate
from the deep basin and
charge reservoir
•Some inter-reservoir
compositional variability
•Fluid properties are
important to storage and
field performance
predictions
Compositional Results
CONCLUSIONS
• 1st order capacity estimation tool for future carbon storage sites, especially when data limited
(porosity, temperature, oil composition etc.)
• Informs subsurface fault transmissibility models
• Regional geologic CO2 plume migration risk is NW-N and appears low
• NE Texas panhandle Morrowan hydrocarbons: Sourced from deeper basin, dominantly Thirteen
Finger and upper Morrowan black shales
• Compositional predictions help inform decision makers about potential field response to CO2-EOR

THANK YOU!
Comments and questions are welcome…
ACKNOWLEDGMENTS
• Dr. Jolante van Wijk
• Dr. Robert Balch
• Dr. Peter Mozley
• Dr. Robert Will
• Schlumberger Support
• Martha Cather
• Dylan Rose-Coss
•William Ampomah
•Ashley Hutton
•Mark Schafer
•Franciszka Stopa
•Lindsey Rasmussen
•Family & Friends
•REACT/SWP TEAM
“Funding for this project is provided by the U.S. Department of Energy's (DOE) National Energy
Technology Laboratory (NETL through the Southwest Regional Partnership on Carbon
Sequestration (SWP) under Award No. DE-FC26-05NT42591. Additional support has been
provided by site operator Chaparral Energy, L.L.C. and Schlumberger Carbon Services.”
Disclaimer:
This report was prepared as an account of work sponsored by an agency of the United States
Government. Neither the United States Government nor any agency thereof, nor any of their
employees, makes any warranty, express or implied, or assumes any legal liability or
responsibility for the accuracy, completeness, or usefulness of any information, apparatus,
product, or process disclosed, or represents that its use would not infringe privately owned
rights. Reference herein to any specific commercial product, process, or service by trade name,
trademark, manufacturer, or otherwise does not necessarily constitute or imply its
endorsement, recommendation, or favoring by the United States Government or any agency
thereof. The views and opinions of authors expressed herein do not necessarily state or reflect
those of the United States Government or any agency thereof
FUTURE WORK
• Mechanism(s) and timing of depressurization?
• Paleo to present stress evolution in the region?
• Use seismic techniques (geomorphic), log and core data to examine
hydraulic properties, distribution, geometry of fractures?
• Does the Booker Survey have similar seismic features?
• Construction of a (DFN) hydro-structural models?
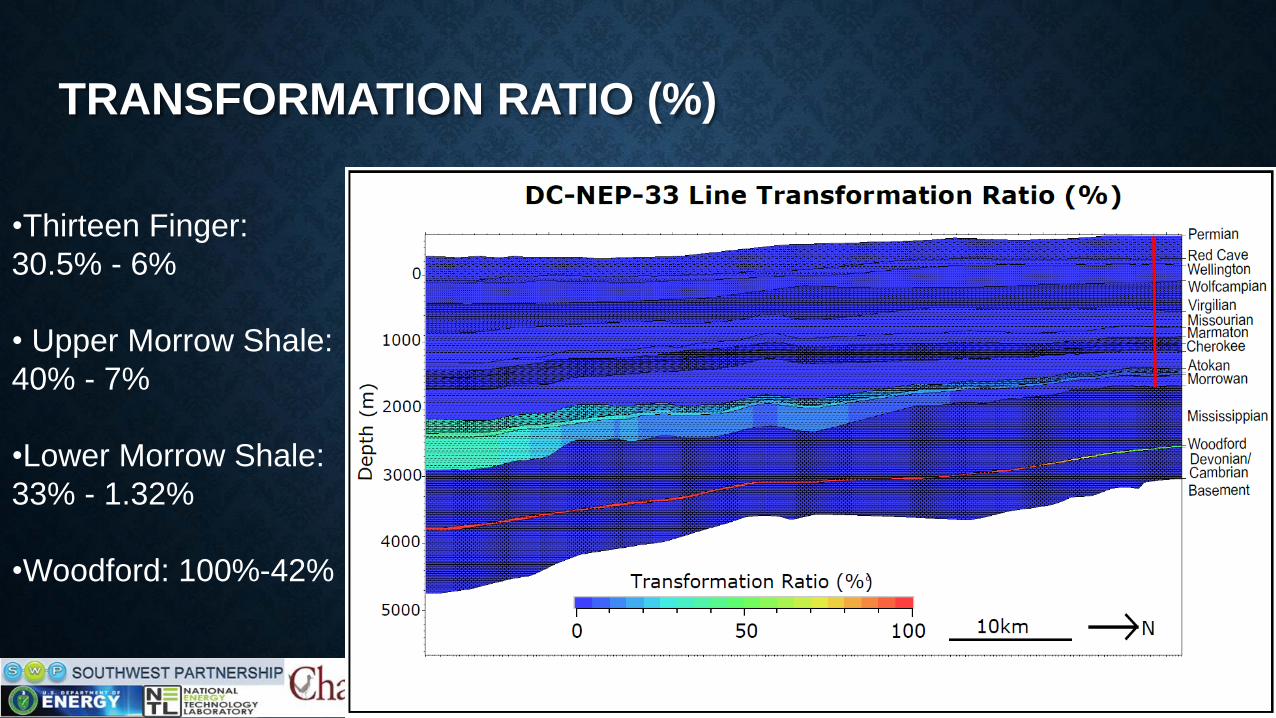
TRANSFORMATION RATIO (%)
•Thirteen Finger:
30.5% - 6%
• Upper Morrow Shale:
40% - 7%
•Lower Morrow Shale:
33% - 1.32%
•Woodford: 100%-42%
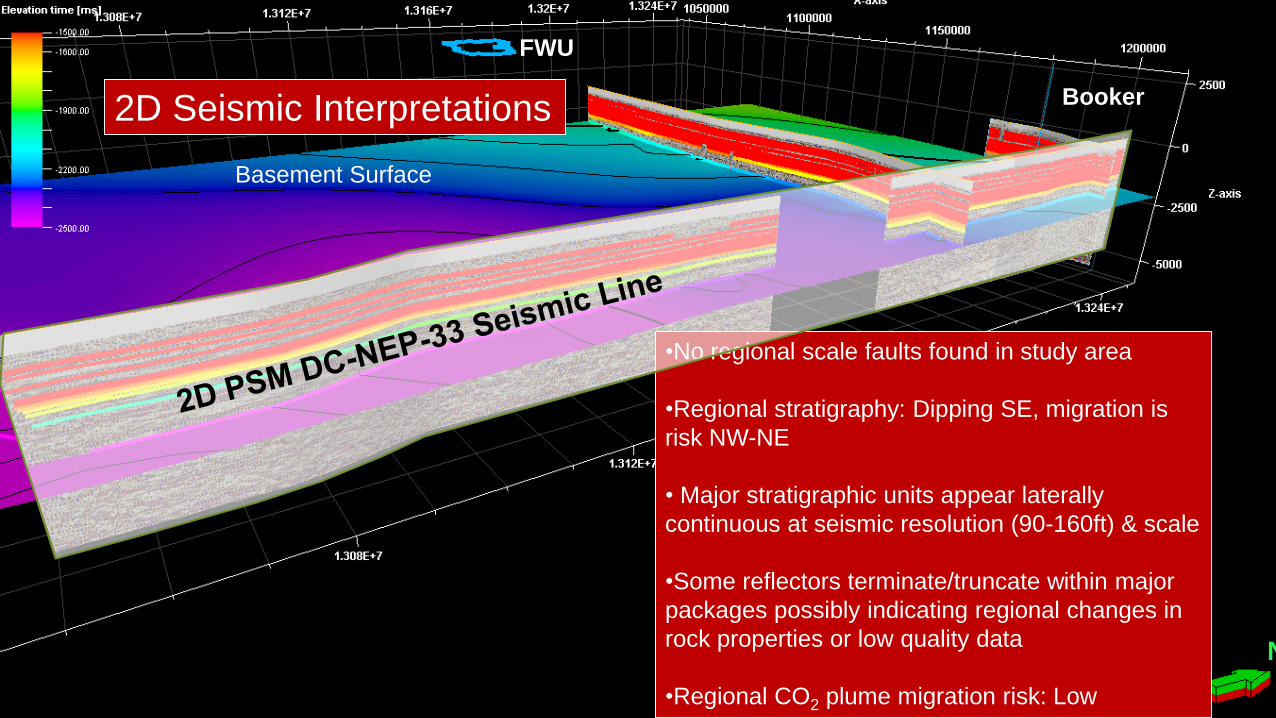
2D Seismic Interpretations
Basement Surface
•No regional scale faults found in study area
•Regional stratigraphy: Dipping SE, migration is
risk NW-NE
• Major stratigraphic units appear laterally
continuous at seismic resolution (90-160ft) & scale
•Some reflectors terminate/truncate within major
packages possibly indicating regional changes in
rock properties or low quality data
•Regional CO2 plume migration risk: Low
FWU
Booker
N
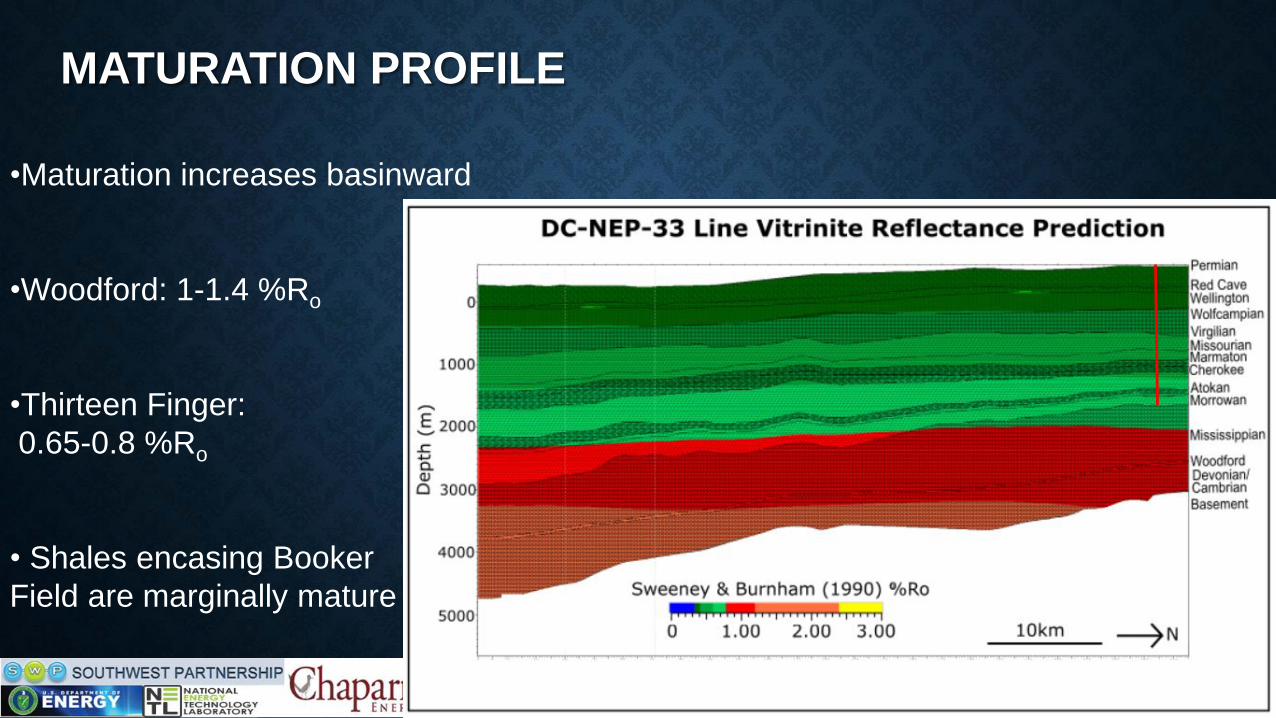
MATURATION PROFILE
•Maturation increases basinward
•Woodford: 1-1.4 %Ro
•Thirteen Finger:
0.65-0.8 %Ro
• Shales encasing Booker
Field are marginally mature
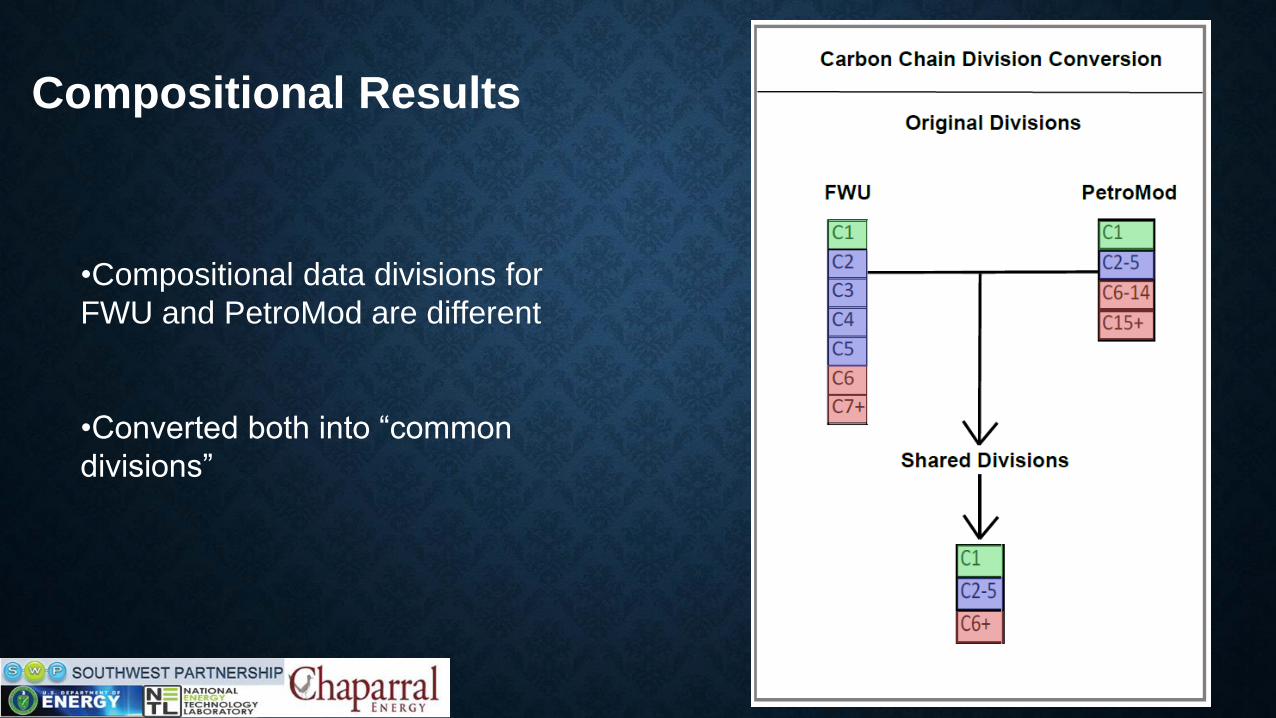
•Compositional data divisions for
FWU and PetroMod are different
•Converted both into “common
divisions”
Compositional Results
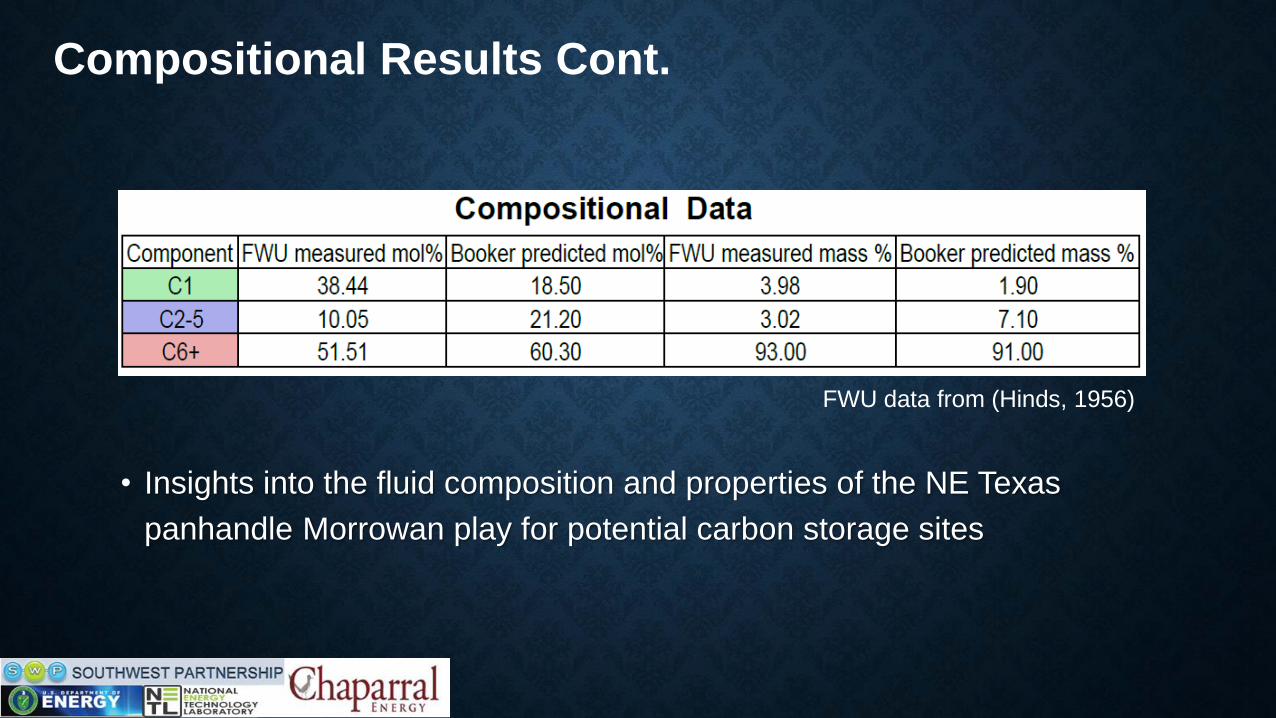
• Insights into the fluid composition and properties of the NE Texas
panhandle Morrowan play for potential carbon storage sites
Compositional Results Cont.
FWU data from (Hinds, 1956)
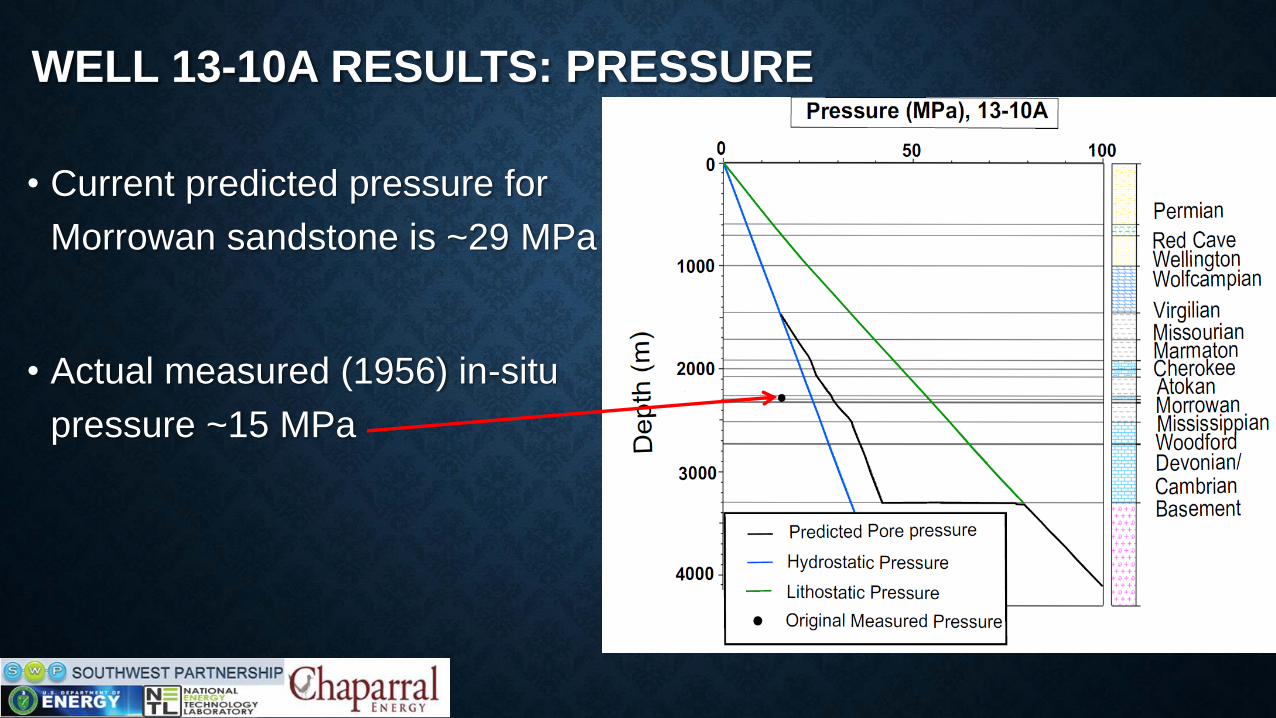
• Current predicted pressure for
Morrowan sandstone is ~29 MPa
• Actual measured (1956) in-situ
pressure ~15 MPa
WELL 13-10A RESULTS: PRESSURE
TR:19%
TR: 4%
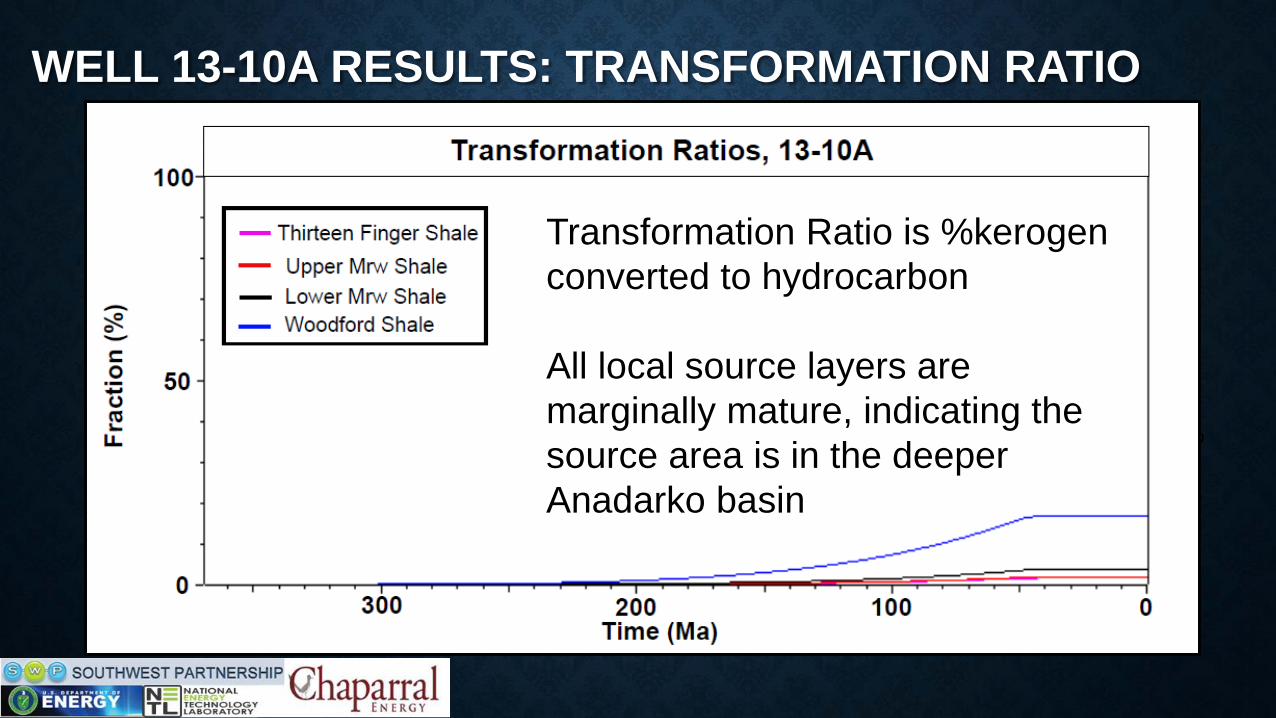
Transformation Ratio is %kerogen
converted to hydrocarbon
All local source layers are
marginally mature, indicating the
source area is in the deeper
Anadarko basin
WELL 13-10A RESULTS: TRANSFORMATION RATIO
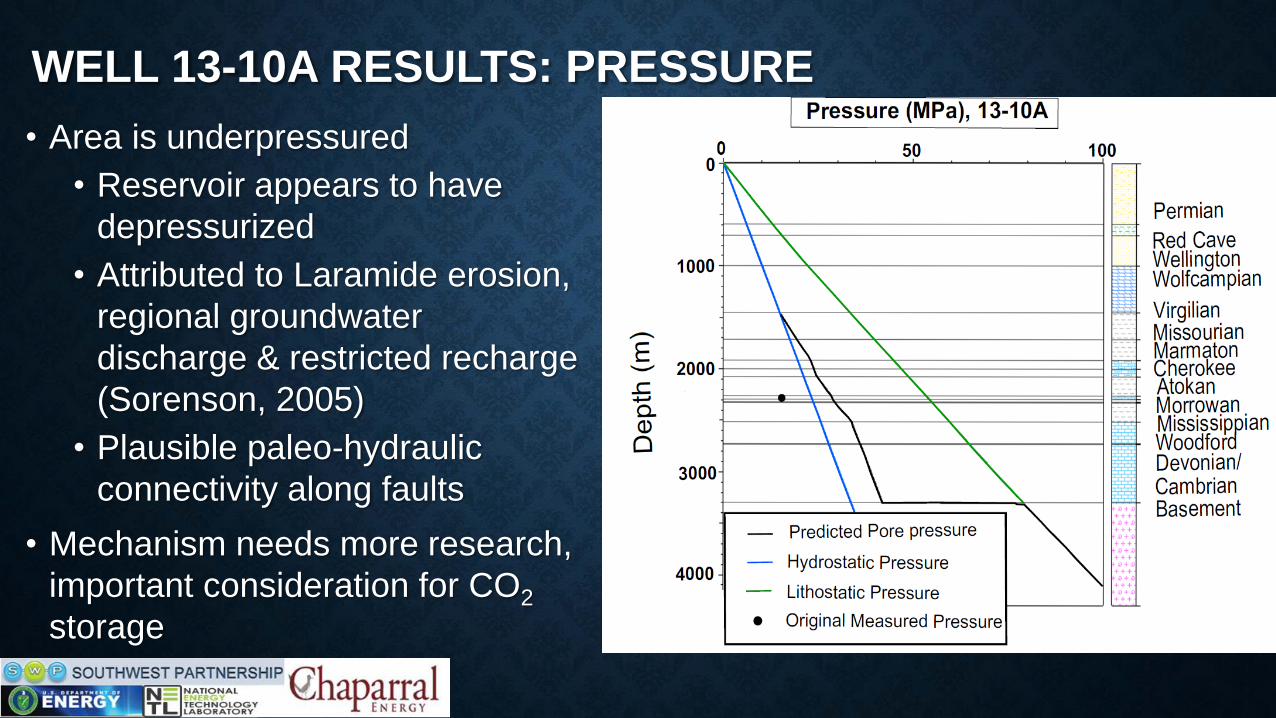
• Area is underpressured
• Reservoir appears to have
depressurized
• Attributed to Laramide erosion,
regional groundwater
discharge & restricted recharge
(Sorenson, 2005)
• Plausible paleo-hydraulic
connectivity along faults
• Mechanism needs more research,
important consideration for CO2
storage
WELL 13-10A RESULTS: PRESSURE
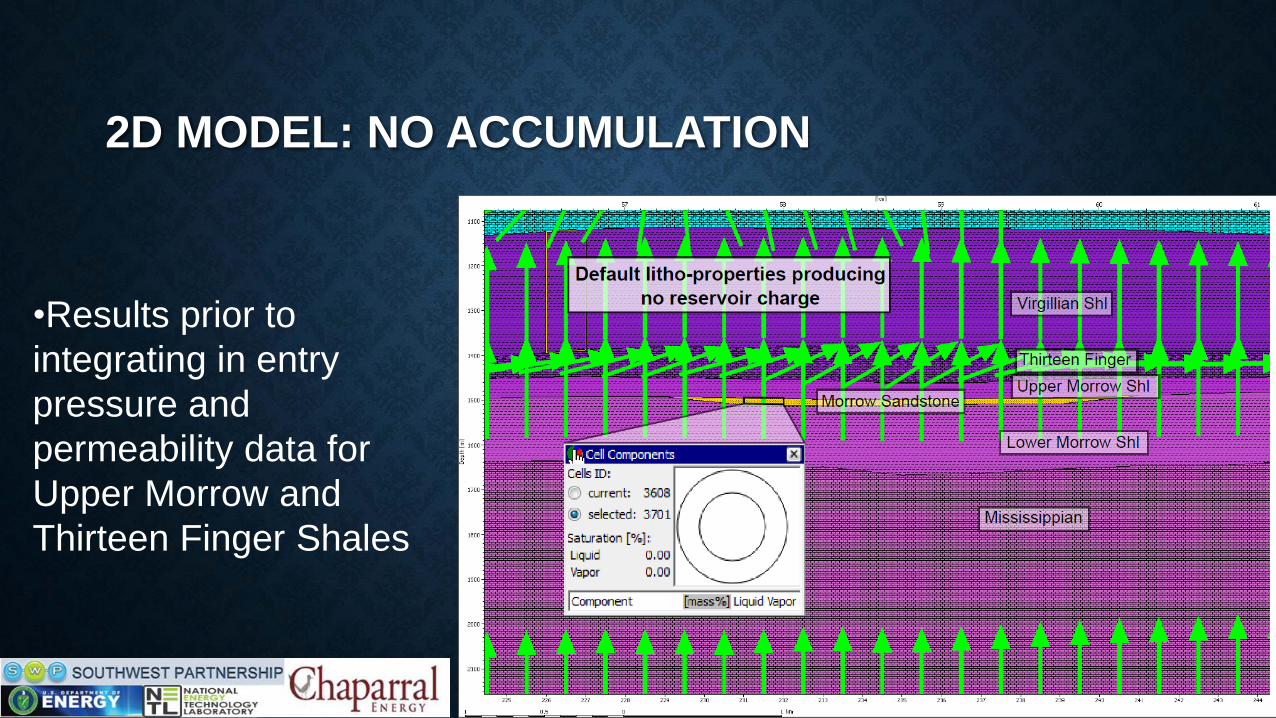
2D MODEL: NO ACCUMULATION
•Results prior to
integrating in entry
pressure and
permeability data for
Upper Morrow and
Thirteen Finger Shales

SEISMIC POLARITY
(Bruce Hart, 2011)
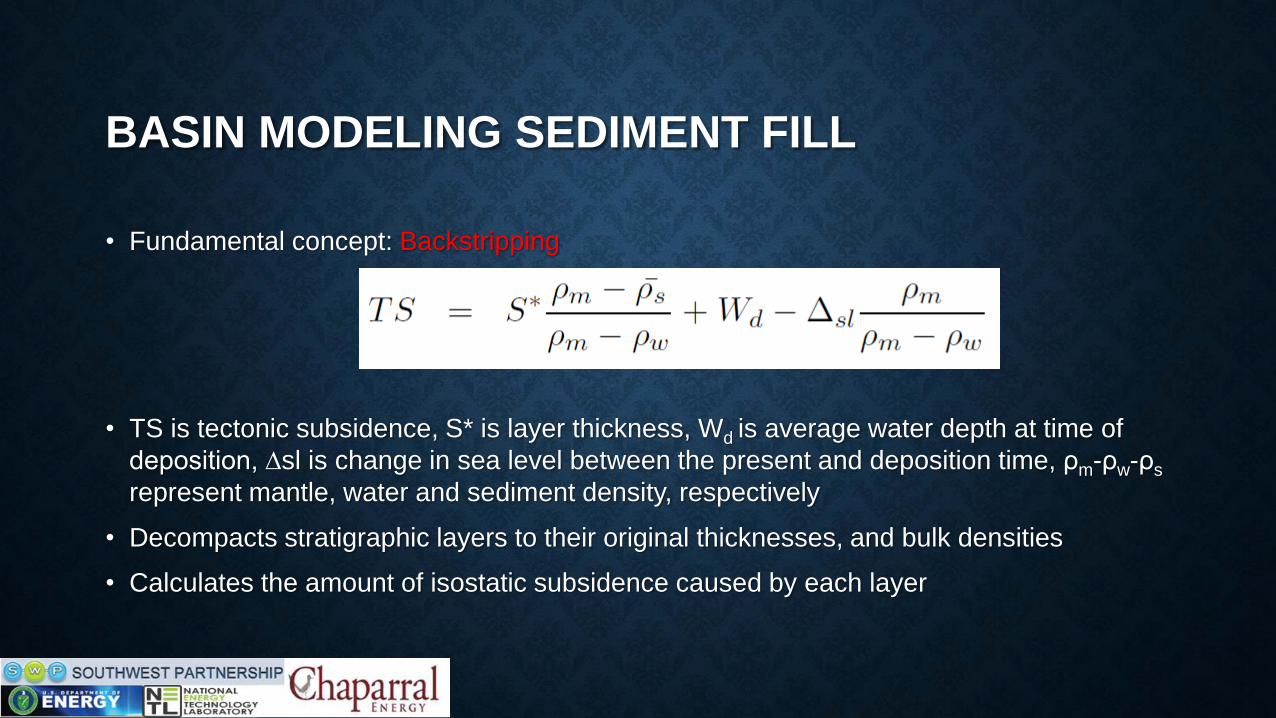
BASIN MODELING SEDIMENT FILL
• Fundamental concept: Backstripping
• TS is tectonic subsidence, S* is layer thickness, Wd is average water depth at time of
deposition, ∆sl is change in sea level between the present and deposition time, ρm-ρw-ρs
represent mantle, water and sediment density, respectively
• Decompacts stratigraphic layers to their original thicknesses, and bulk densities
• Calculates the amount of isostatic subsidence caused by each layer
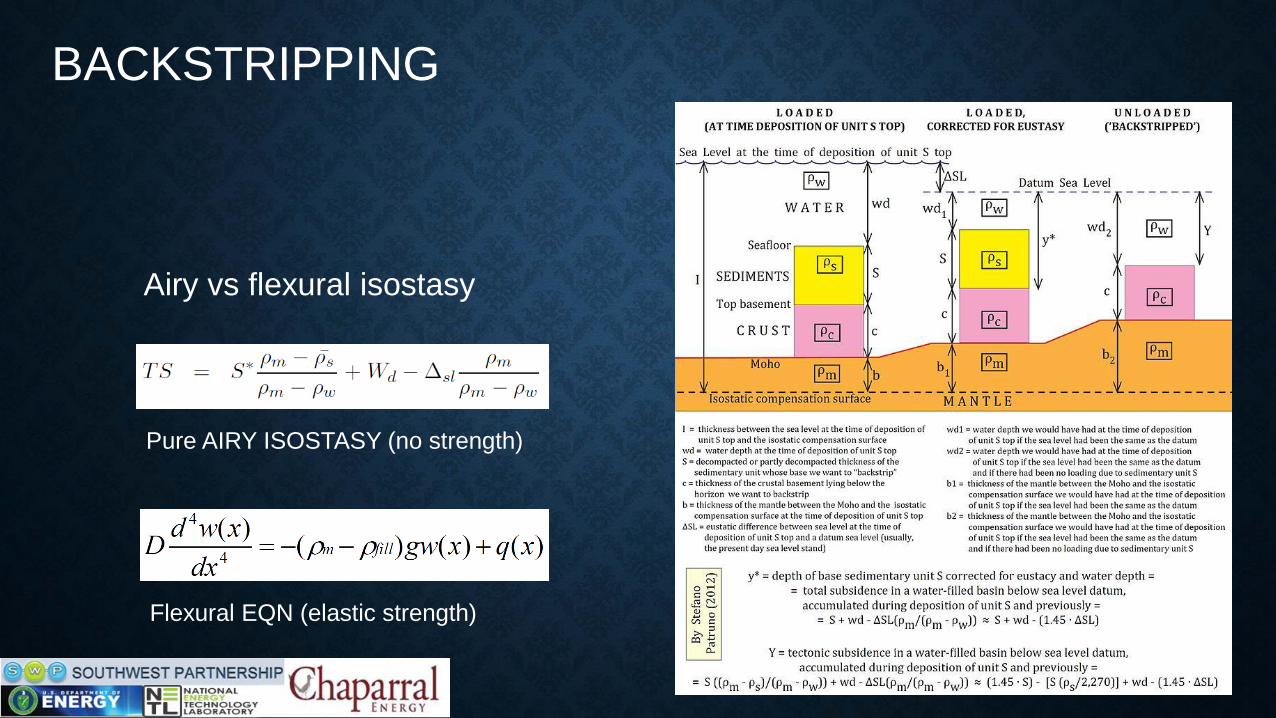
Airy vs flexural isostasy
Pure AIRY ISOSTASY (no strength)
Flexural EQN (elastic strength)
BACKSTRIPPING
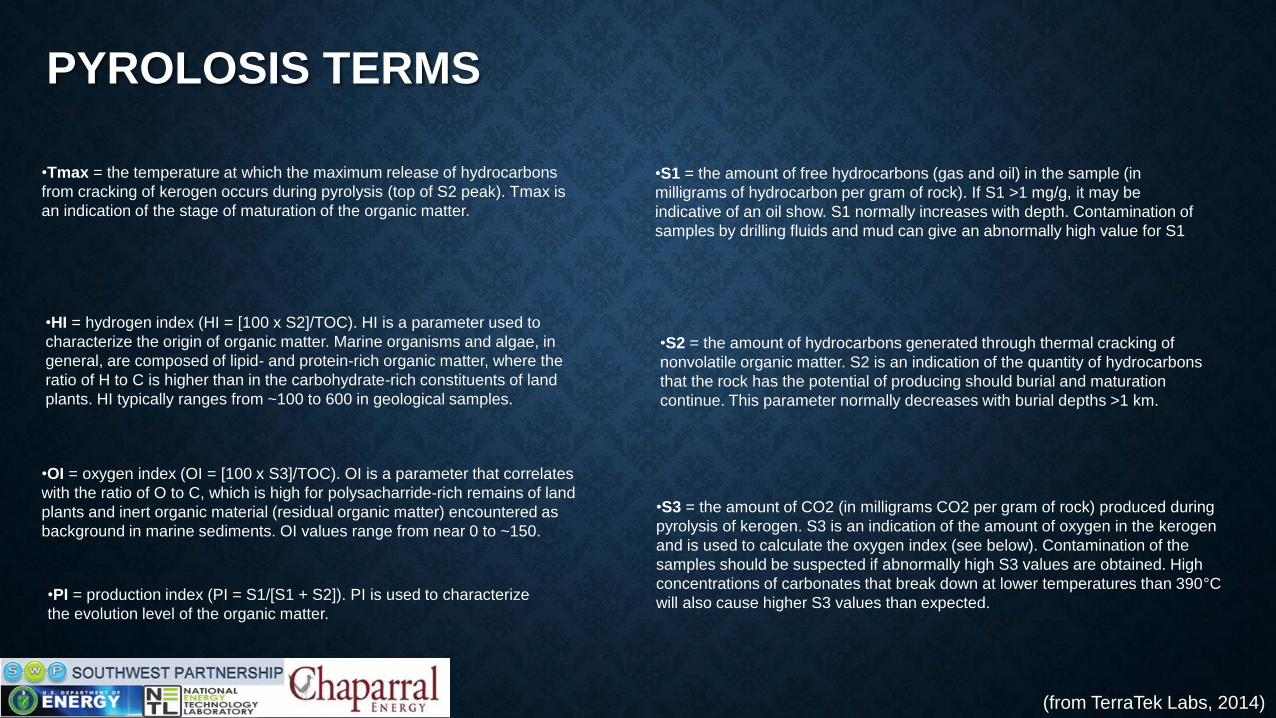
PYROLOSIS TERMS
•S1 = the amount of free hydrocarbons (gas and oil) in the sample (in
milligrams of hydrocarbon per gram of rock). If S1 >1 mg/g, it may be
indicative of an oil show. S1 normally increases with depth. Contamination of
samples by drilling fluids and mud can give an abnormally high value for S1
•S2 = the amount of hydrocarbons generated through thermal cracking of
nonvolatile organic matter. S2 is an indication of the quantity of hydrocarbons
that the rock has the potential of producing should burial and maturation
continue. This parameter normally decreases with burial depths >1 km.
•S3 = the amount of CO2 (in milligrams CO2 per gram of rock) produced during
pyrolysis of kerogen. S3 is an indication of the amount of oxygen in the kerogen
and is used to calculate the oxygen index (see below). Contamination of the
samples should be suspected if abnormally high S3 values are obtained. High
concentrations of carbonates that break down at lower temperatures than 390°C
will also cause higher S3 values than expected.
•Tmax = the temperature at which the maximum release of hydrocarbons
from cracking of kerogen occurs during pyrolysis (top of S2 peak). Tmax is
an indication of the stage of maturation of the organic matter.
•HI = hydrogen index (HI = [100 x S2]/TOC). HI is a parameter used to
characterize the origin of organic matter. Marine organisms and algae, in
general, are composed of lipid- and protein-rich organic matter, where the
ratio of H to C is higher than in the carbohydrate-rich constituents of land
plants. HI typically ranges from ~100 to 600 in geological samples.
•OI = oxygen index (OI = [100 x S3]/TOC). OI is a parameter that correlates
with the ratio of O to C, which is high for polysacharride-rich remains of land
plants and inert organic material (residual organic matter) encountered as
background in marine sediments. OI values range from near 0 to ~150.
•PI = production index (PI = S1/[S1 + S2]). PI is used to characterize
the evolution level of the organic matter.
(from TerraTek Labs, 2014)
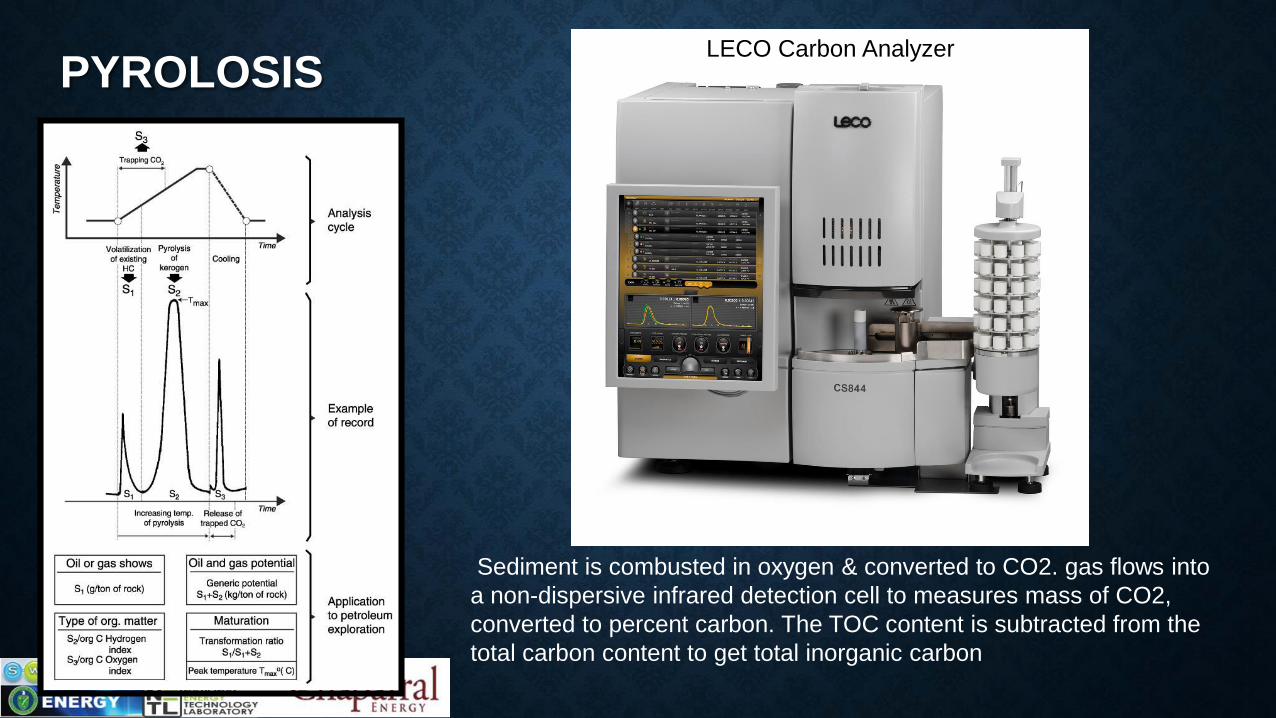
PYROLOSIS
Sediment is combusted in oxygen & converted to CO2. gas flows into
a non-dispersive infrared detection cell to measures mass of CO2,
converted to percent carbon. The TOC content is subtracted from the
total carbon content to get total inorganic carbon
LECO Carbon Analyzer
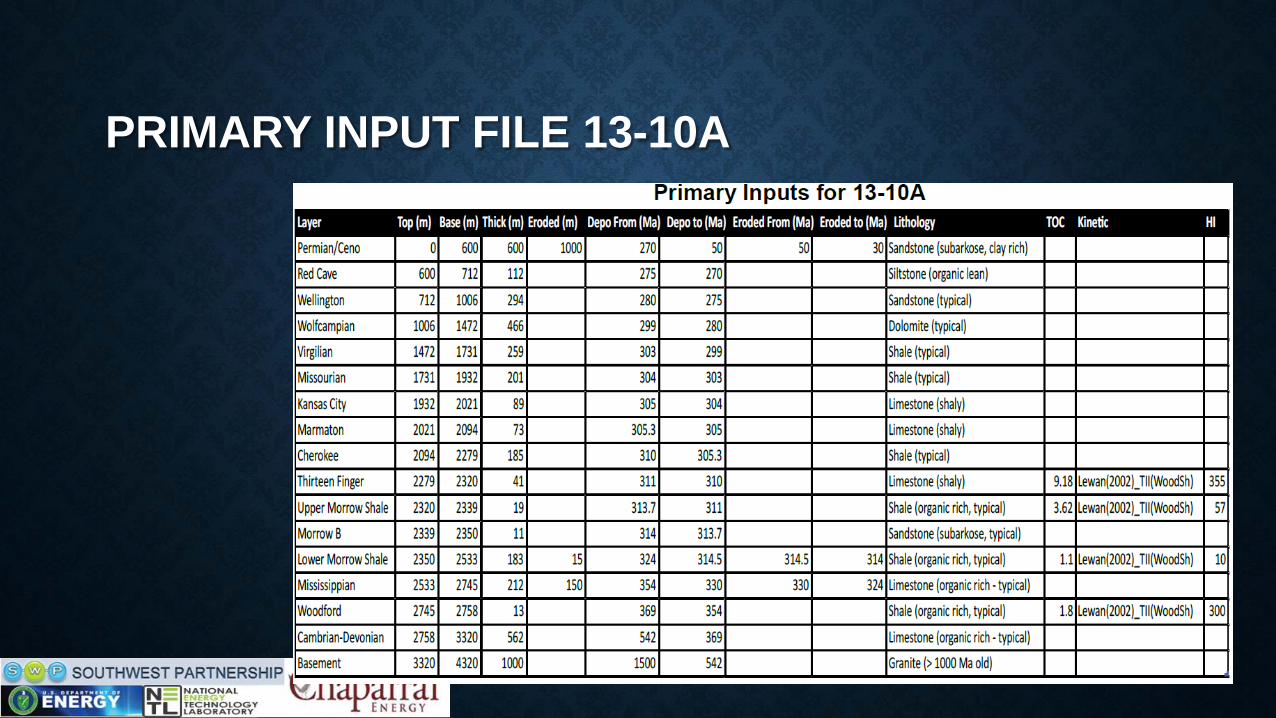
PRIMARY INPUT FILE 13-10A
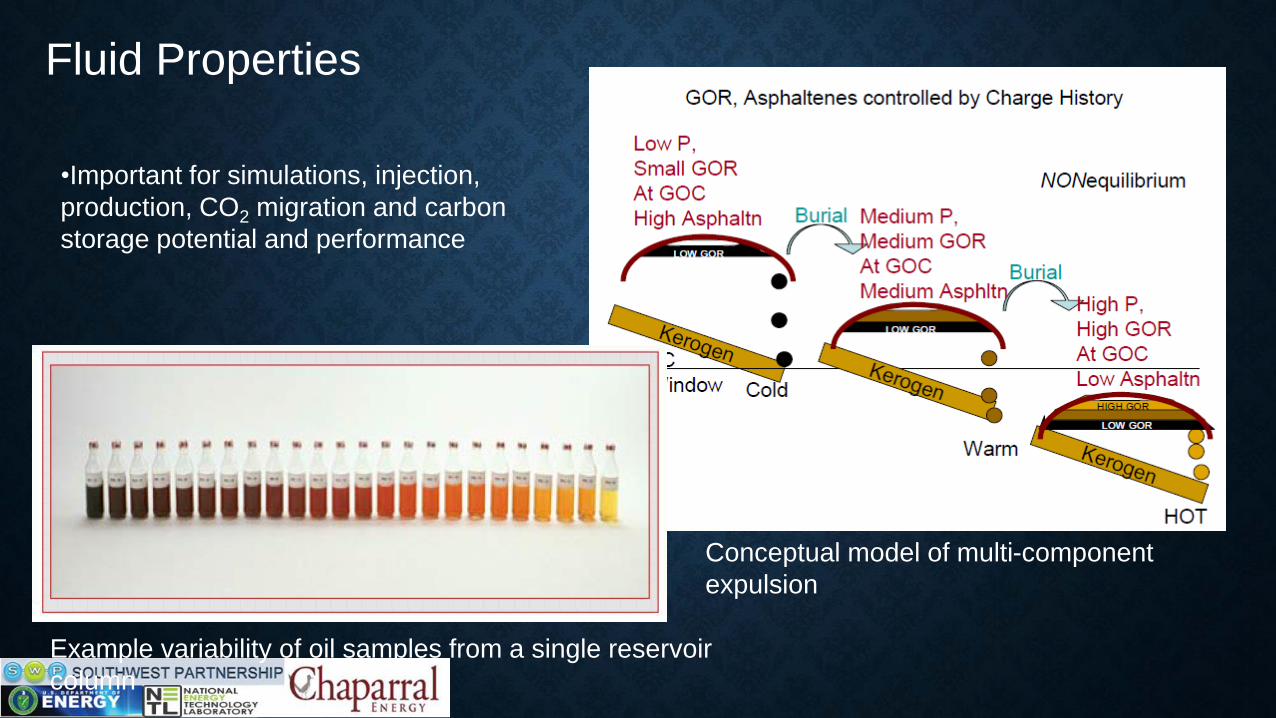
Example variability of oil samples from a single reservoir
column
Conceptual model of multi-component
expulsion
Fluid Properties
•Important for simulations, injection,
production, CO2 migration and carbon
storage potential and performance
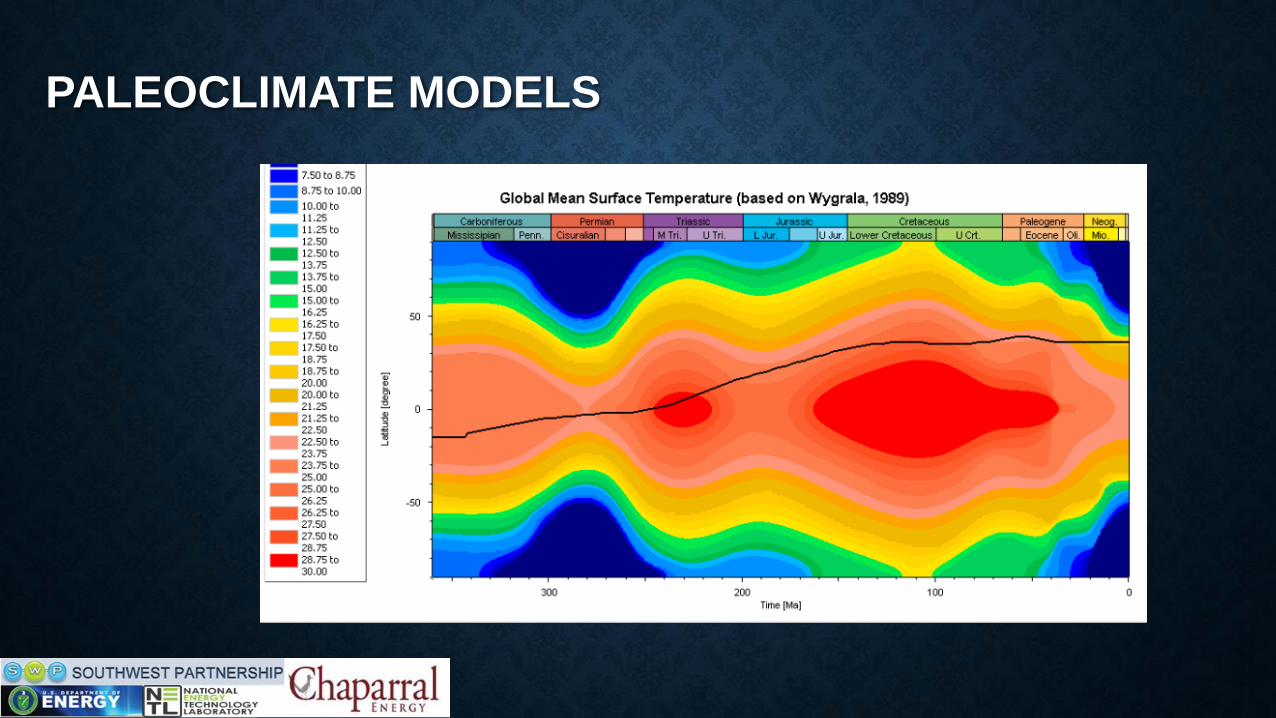
PALEOCLIMATE MODELS
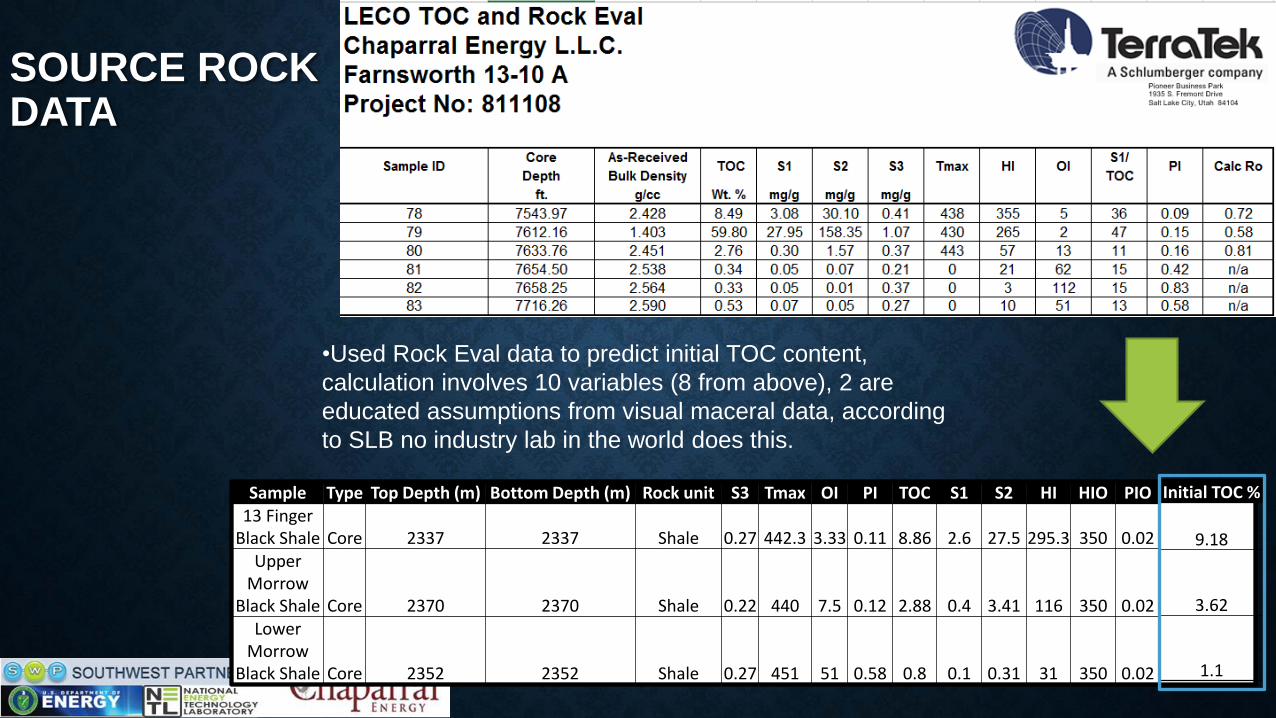
SOURCE ROCK DATA
•Used Rock Eval data to predict initial TOC content,
calculation involves 10 variables (8 from above), 2 are
educated assumptions from visual maceral data, according
to SLB no industry lab in the world does this.
Sample Type Top Depth (m) Bottom Depth (m) Rock unit S3 Tmax OI PI TOC S1 S2 HI HIO PIO13 Finger
Black Shale Core 2337 2337 Shale 0.27 442.3 3.33 0.11 8.86 2.6 27.5 295.3 350 0.02Upper
Morrow Black Shale Core 2370 2370 Shale 0.22 440 7.5 0.12 2.88 0.4 3.41 116 350 0.02
Lower Morrow
Black Shale Core 2352 2352 Shale 0.27 451 51 0.58 0.8 0.1 0.31 31 350 0.02
Initial TOC %
9.18
3.62
1.1
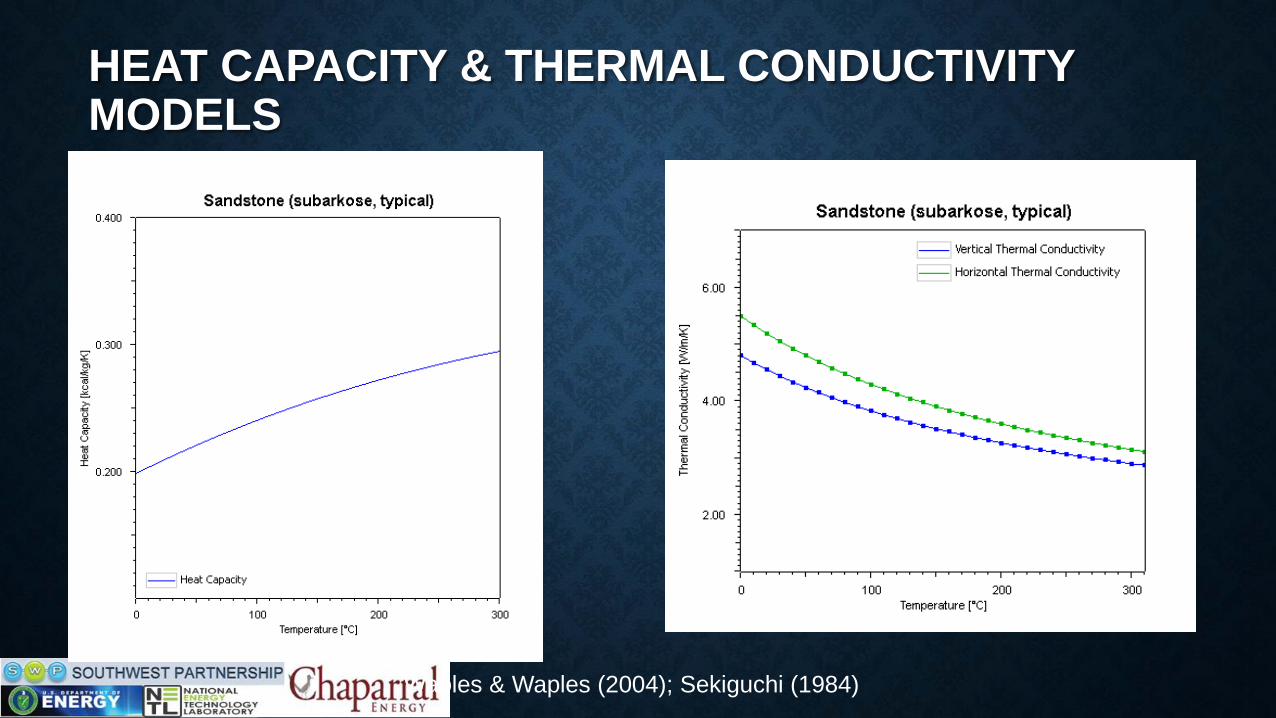
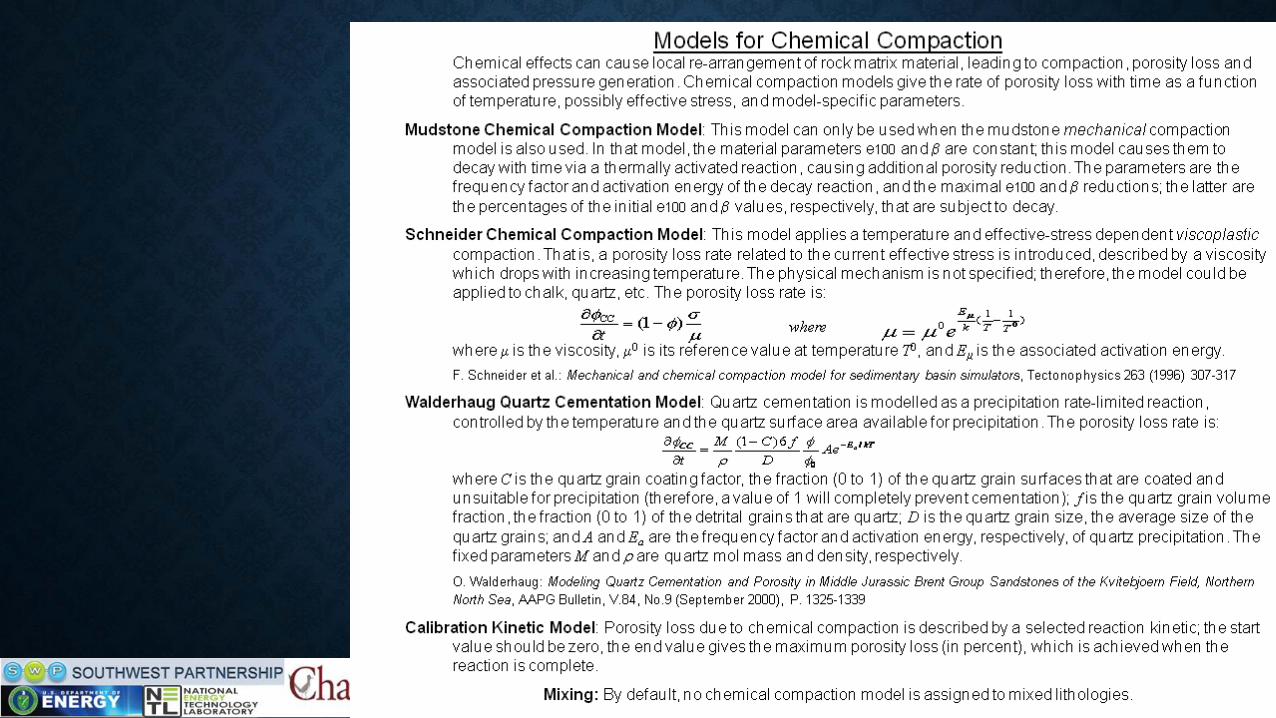
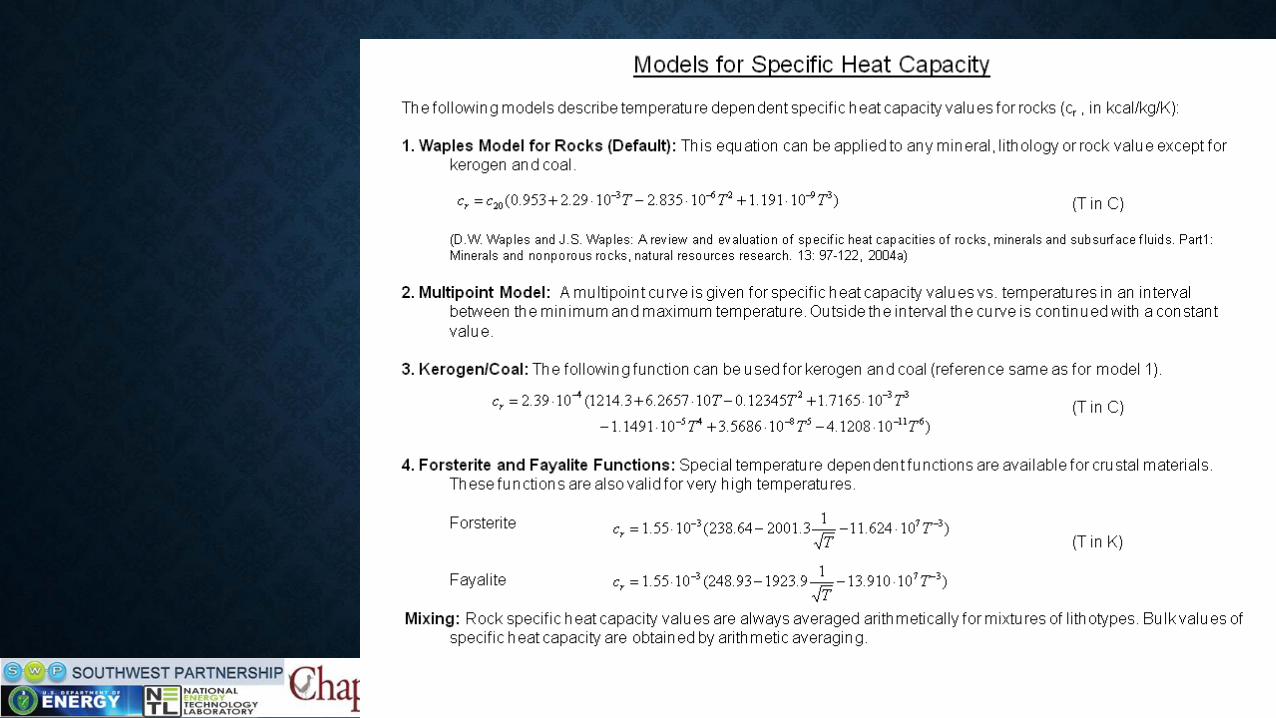
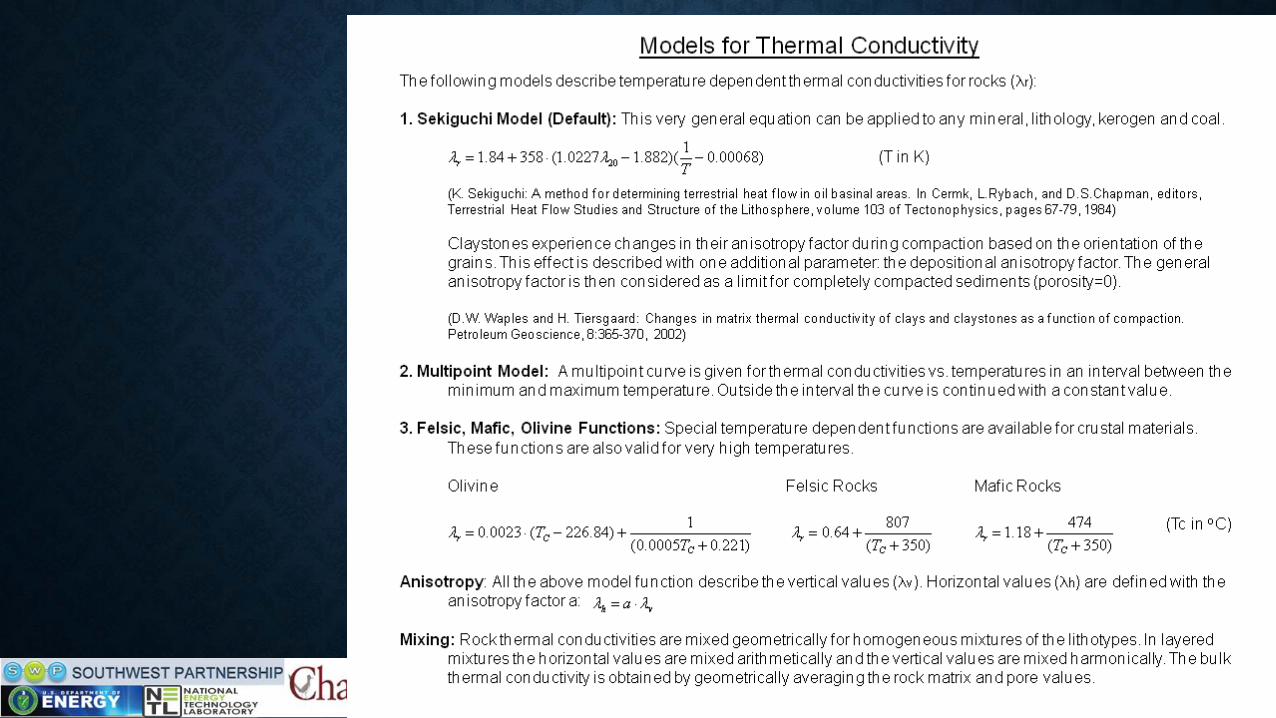
HEAT CAPACITY & THERMAL CONDUCTIVITY MODELS
Waples & Waples (2004); Sekiguchi (1984)
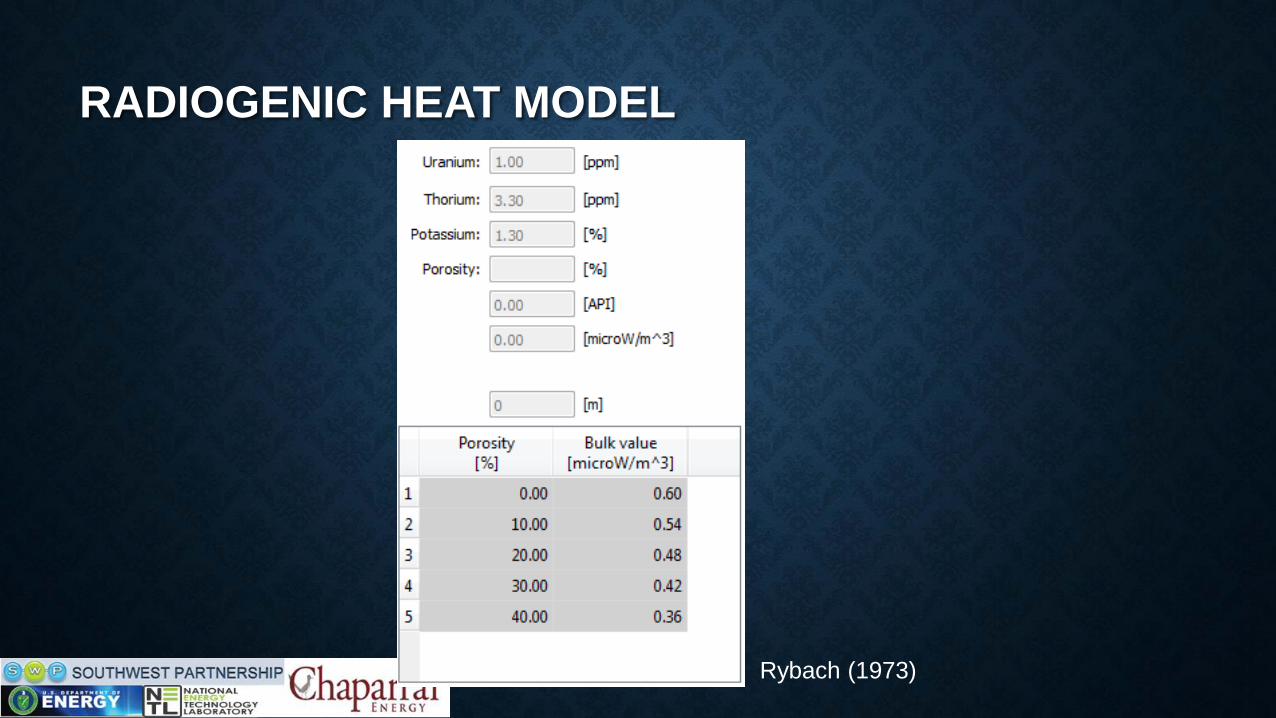
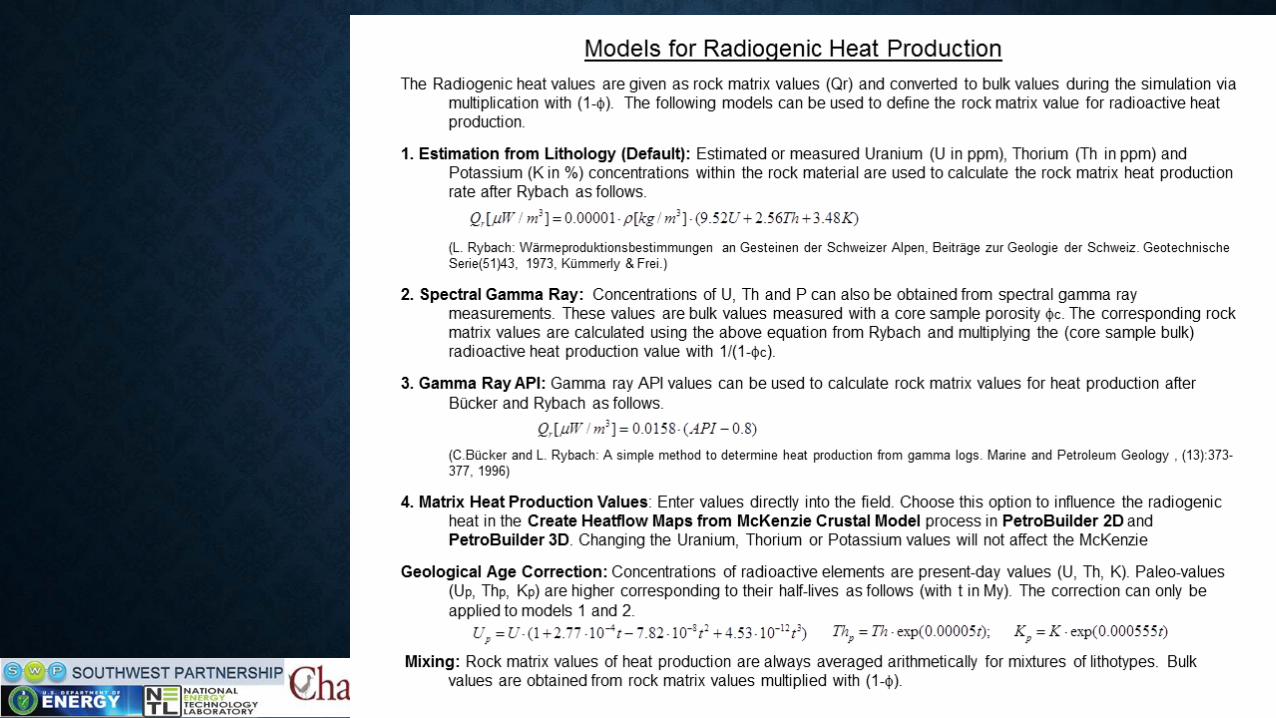
RADIOGENIC HEAT MODEL
Rybach (1973)
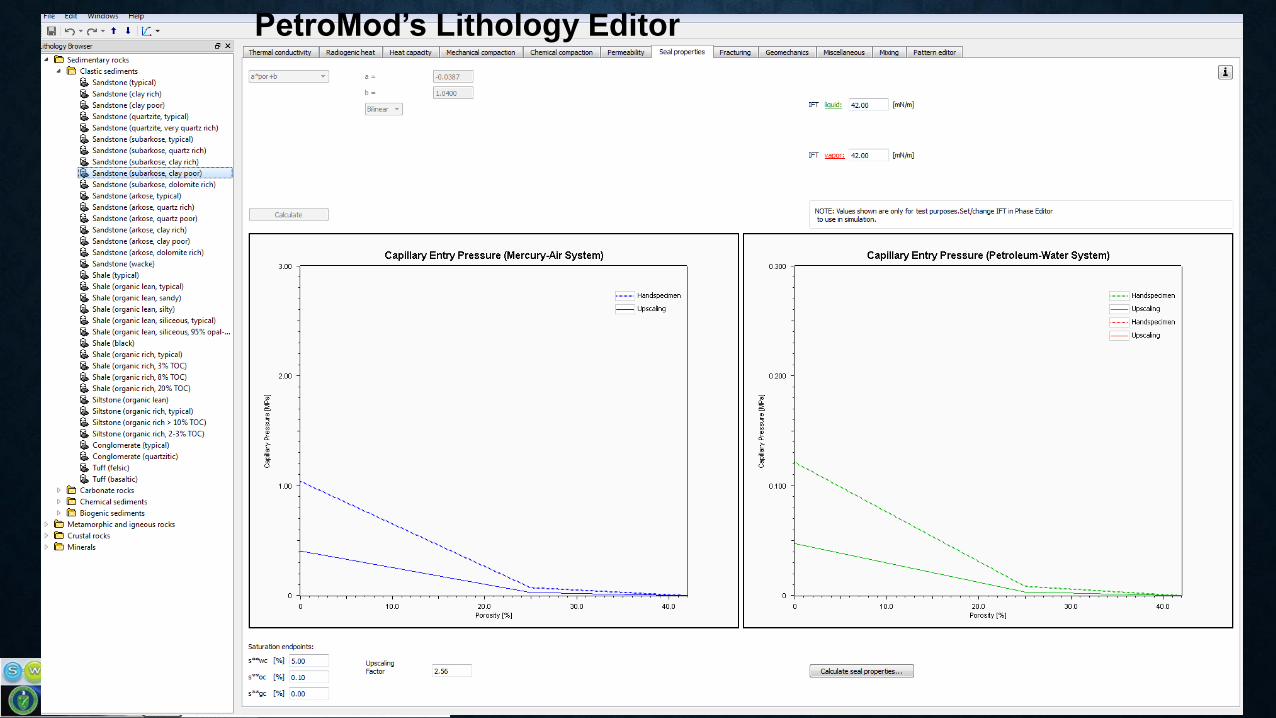
PetroMod’s Lithology Editor
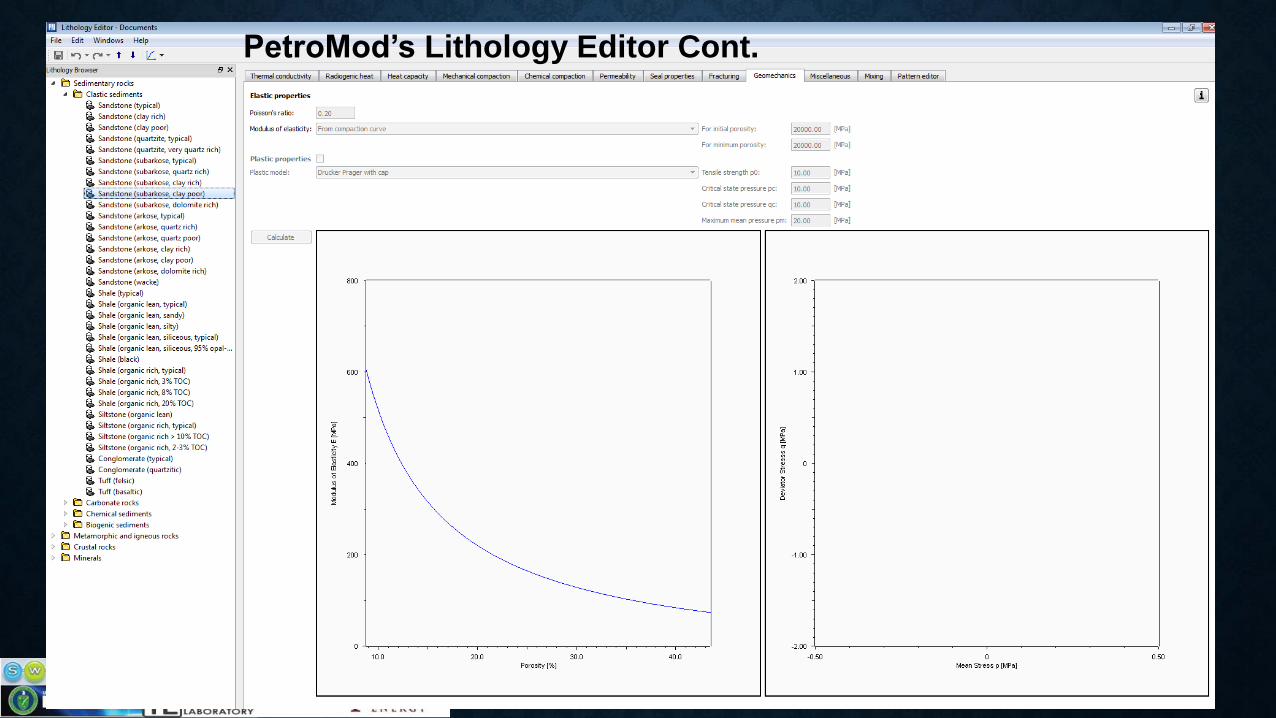
PetroMod’s Lithology Editor Cont.
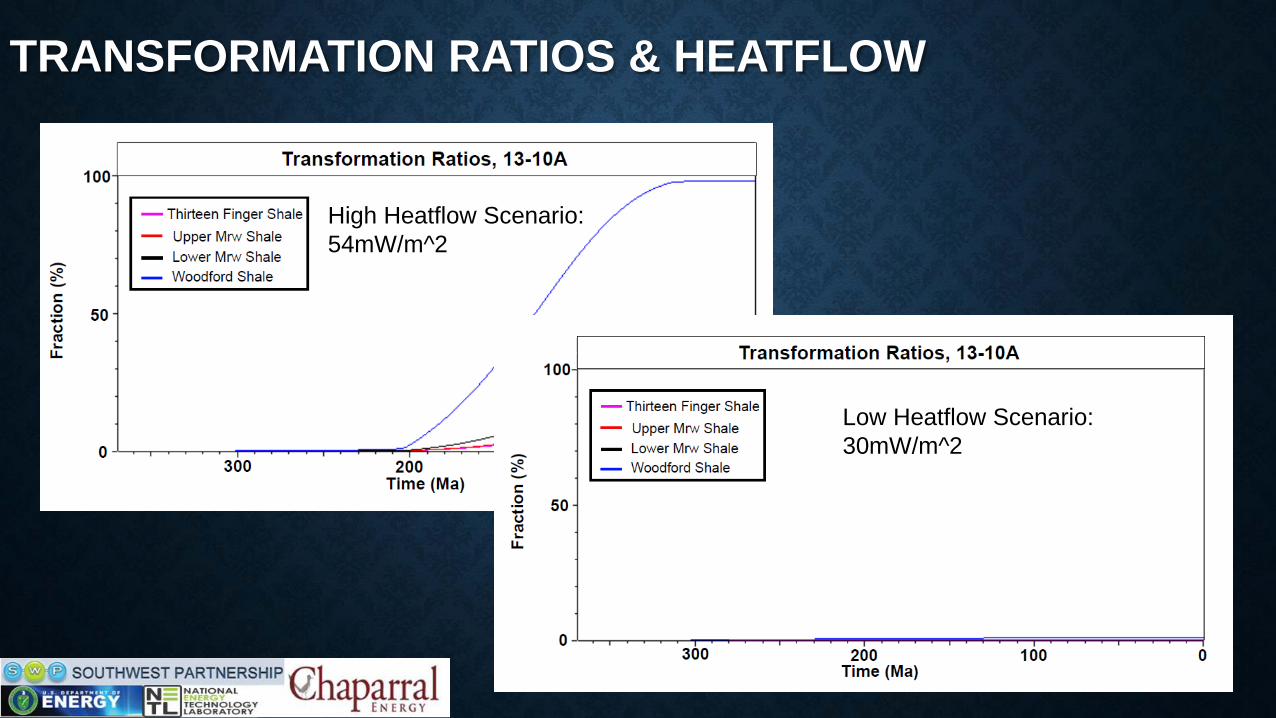
TRANSFORMATION RATIOS & HEATFLOW
High Heatflow Scenario:
54mW/m^2
Low Heatflow Scenario:
30mW/m^2
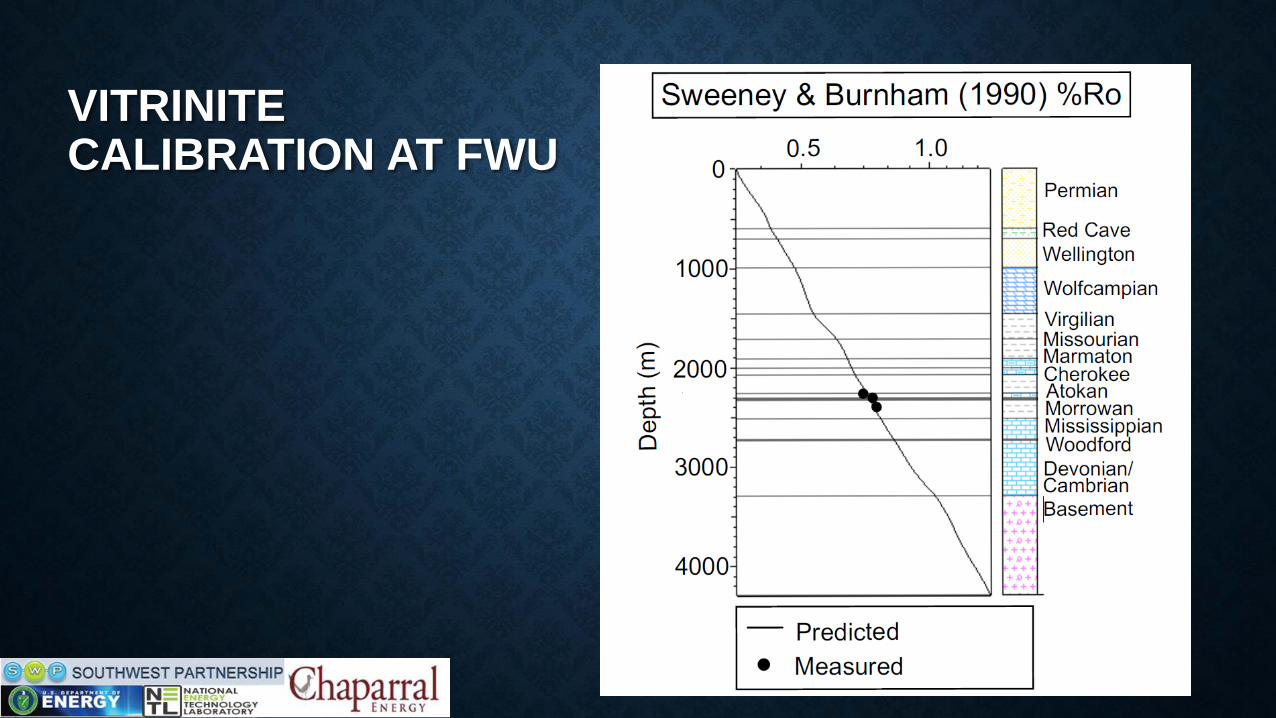
VITRINITECALIBRATION AT FWU
HEATFLOW SENSITIVITY
• Three different basal heatflow scenarios tested against vitrinite data
• Carter et al., 1998: 54mW/m^2 (high)
• Lee and Deming, 1999: 30 mW/m^2 (Low)
• 42mW/m^2 (mid)
• 13-10A vitrinite reflectance values range from 0.60-0.83 %Ro, mean: 0.72 %Ro
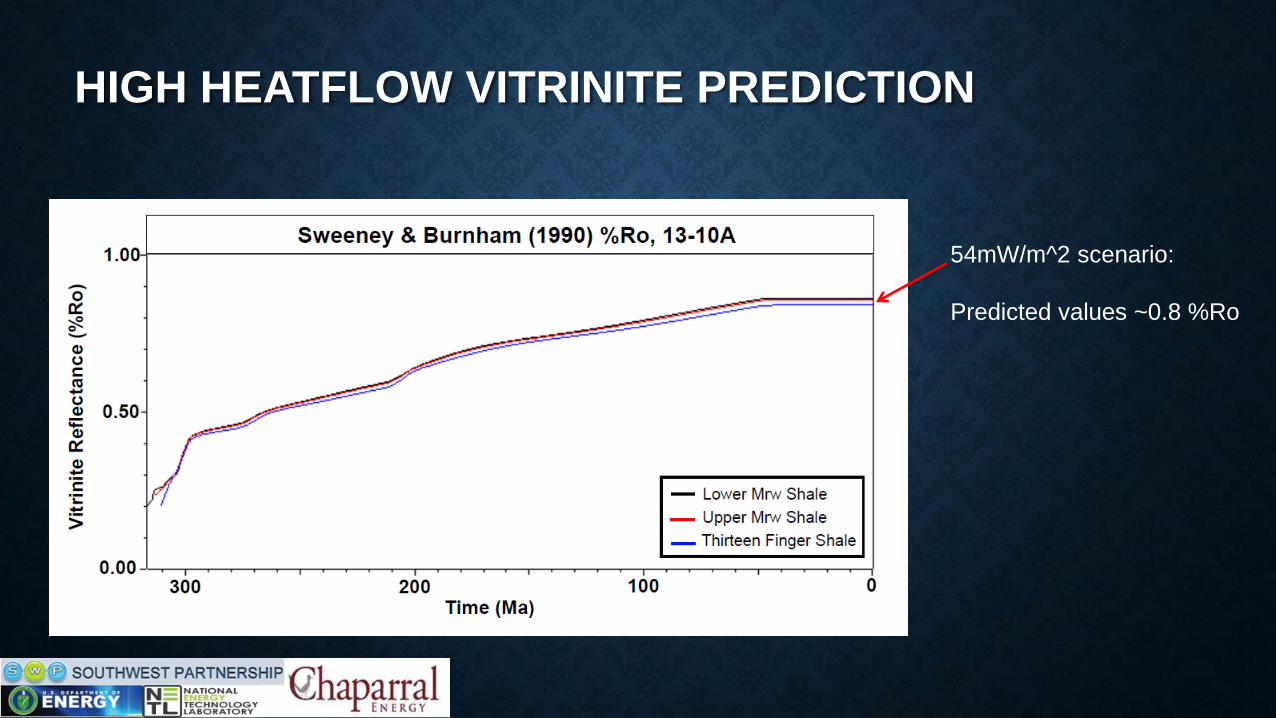
HIGH HEATFLOW VITRINITE PREDICTION
54mW/m^2 scenario:
Predicted values ~0.8 %Ro
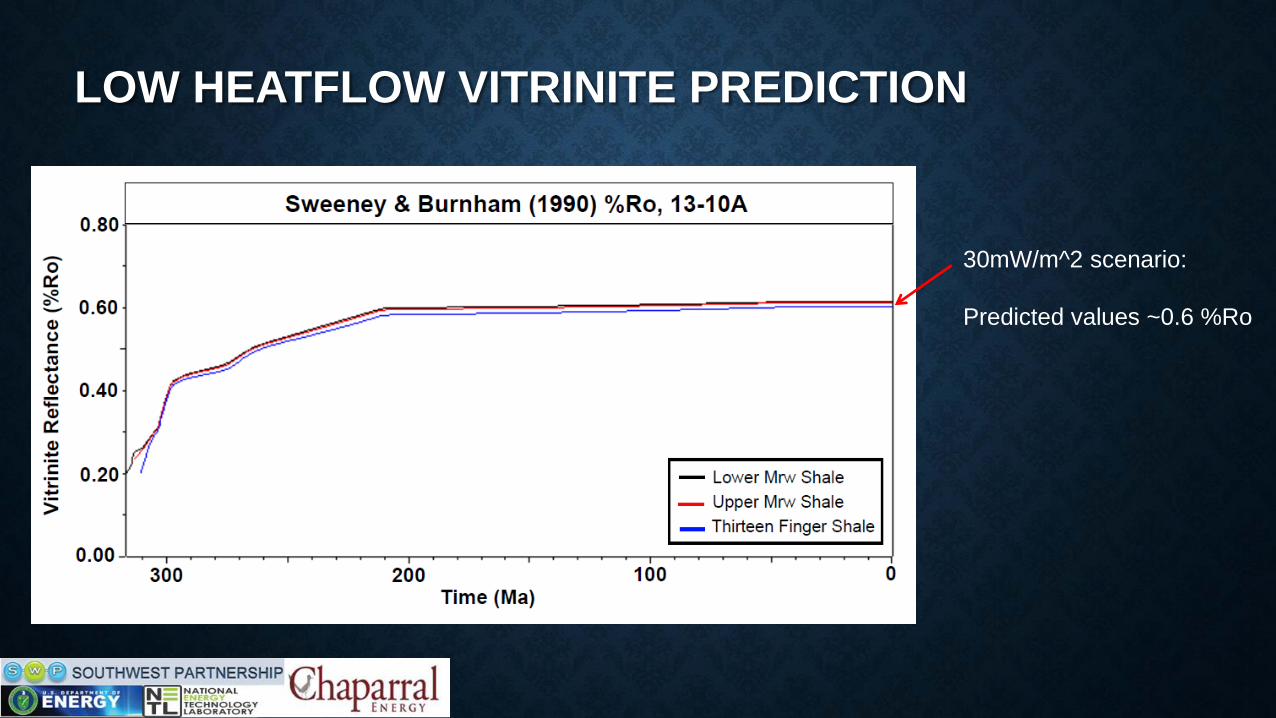
LOW HEATFLOW VITRINITE PREDICTION
30mW/m^2 scenario:
Predicted values ~0.6 %Ro
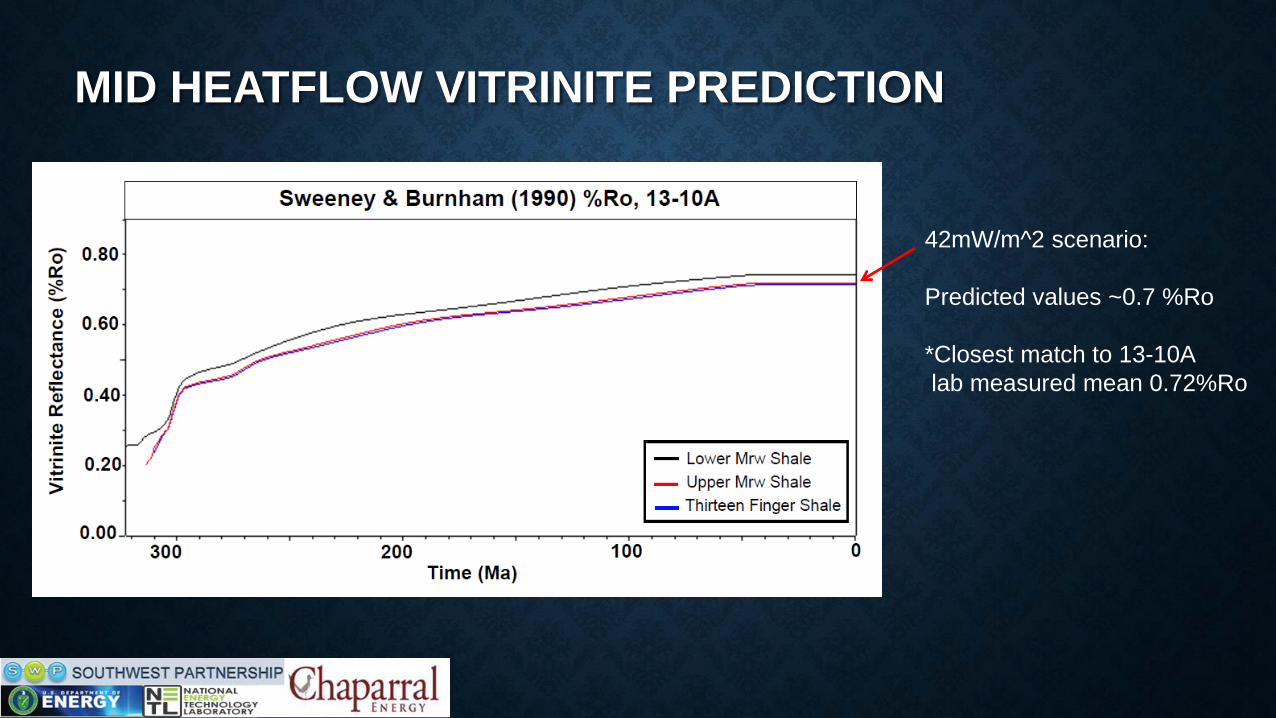
MID HEATFLOW VITRINITE PREDICTION
42mW/m^2 scenario:
Predicted values ~0.7 %Ro
*Closest match to 13-10A
lab measured mean 0.72%Ro
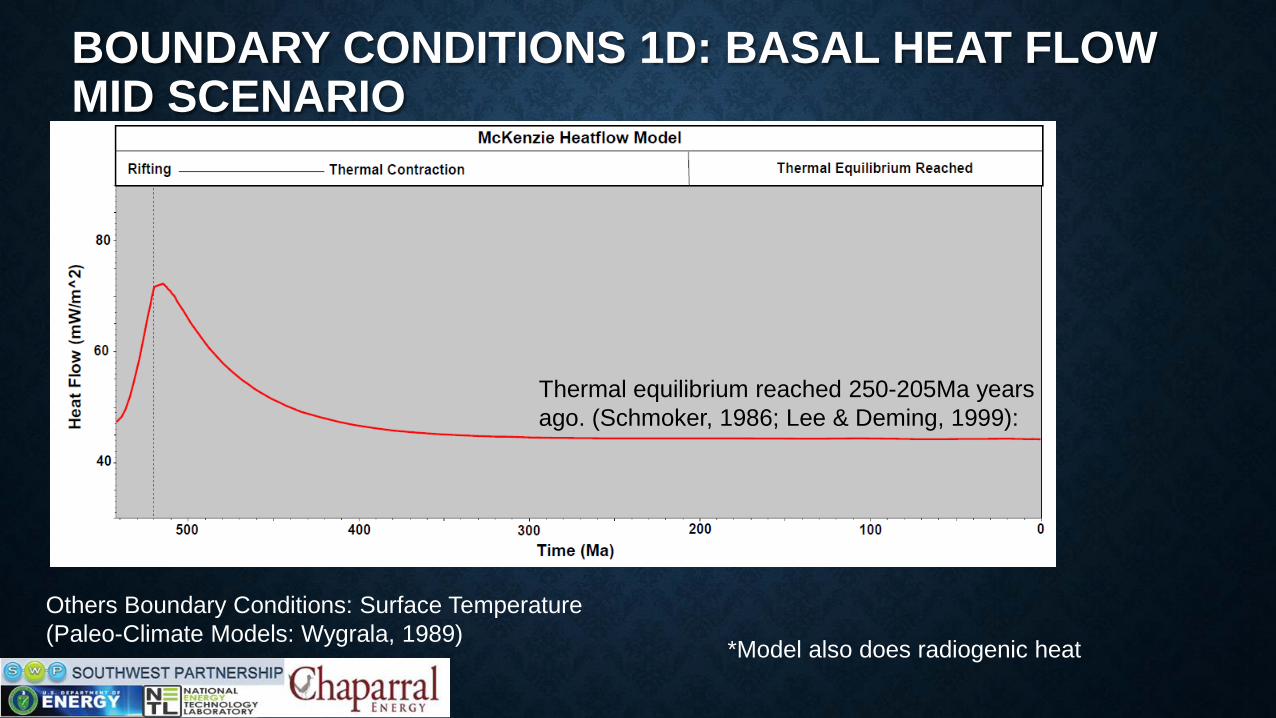
BOUNDARY CONDITIONS 1D: BASAL HEAT FLOW MID SCENARIO
Others Boundary Conditions: Surface Temperature
(Paleo-Climate Models: Wygrala, 1989)*Model also does radiogenic heat
Thermal equilibrium reached 250-205Ma years
ago. (Schmoker, 1986; Lee & Deming, 1999):

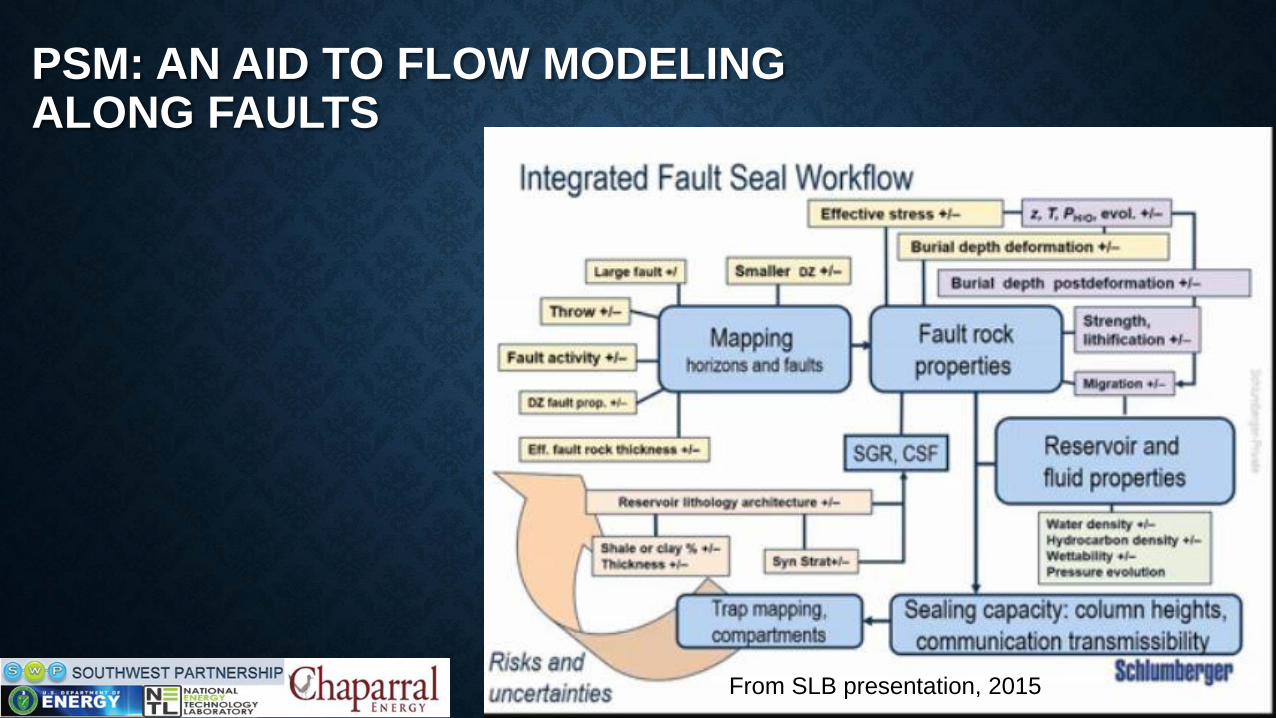
PSM: AN AID TO FLOW MODELING ALONG FAULTS
From SLB presentation, 2015
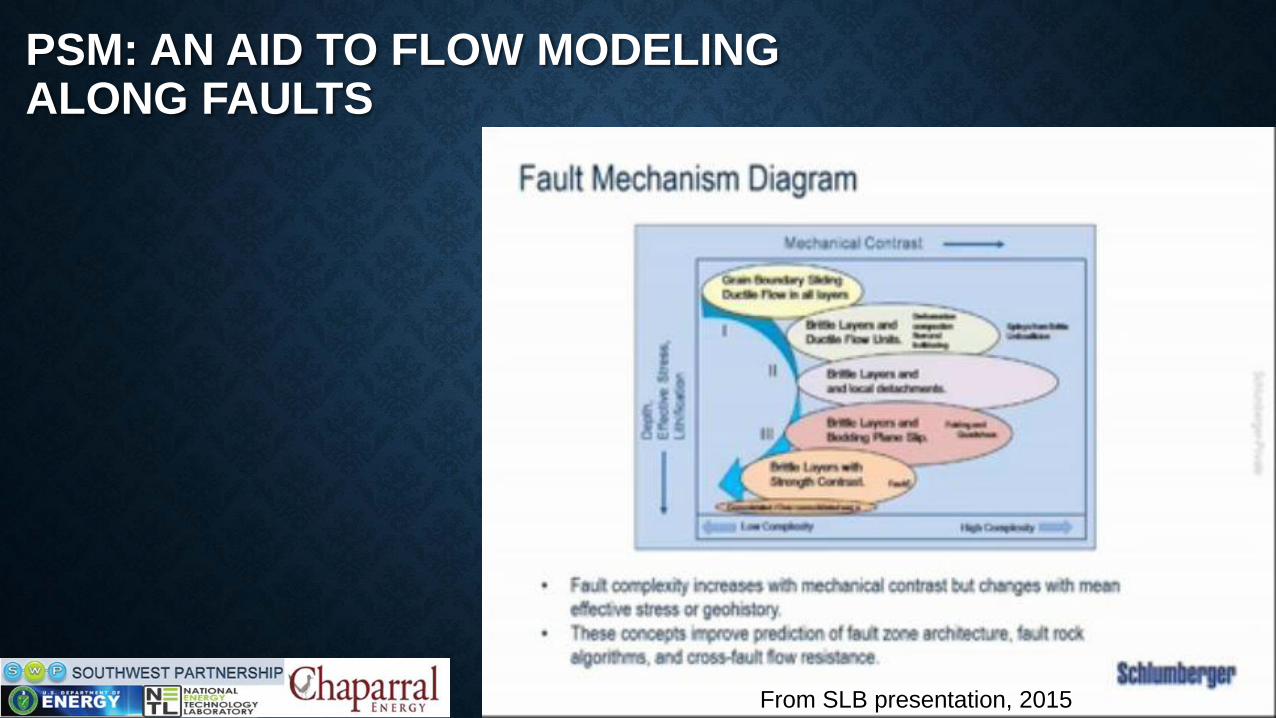
PSM: AN AID TO FLOW MODELING ALONG FAULTS
From SLB presentation, 2015
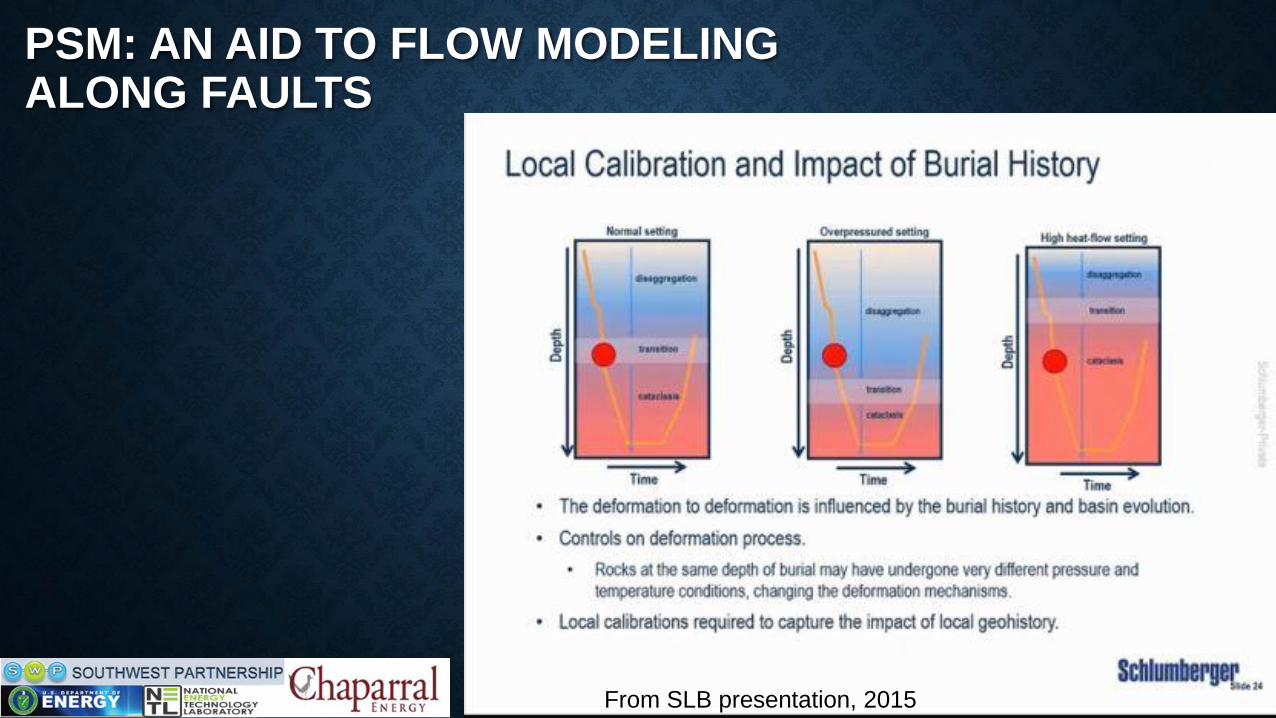
PSM: AN AID TO FLOW MODELING ALONG FAULTS
From SLB presentation, 2015
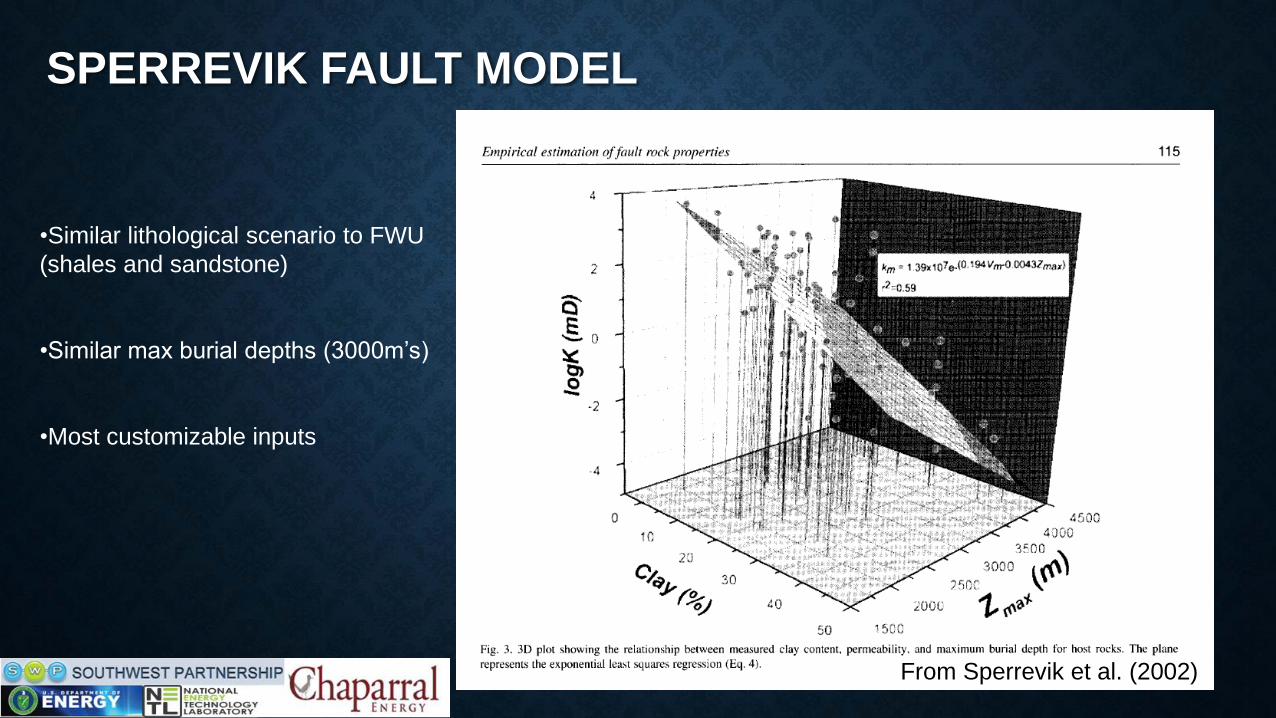
SPERREVIK FAULT MODEL
•Similar lithological scenario to FWU
(shales and sandstone)
•Similar max burial depths (3000m’s)
•Most customizable inputs
From Sperrevik et al. (2002)
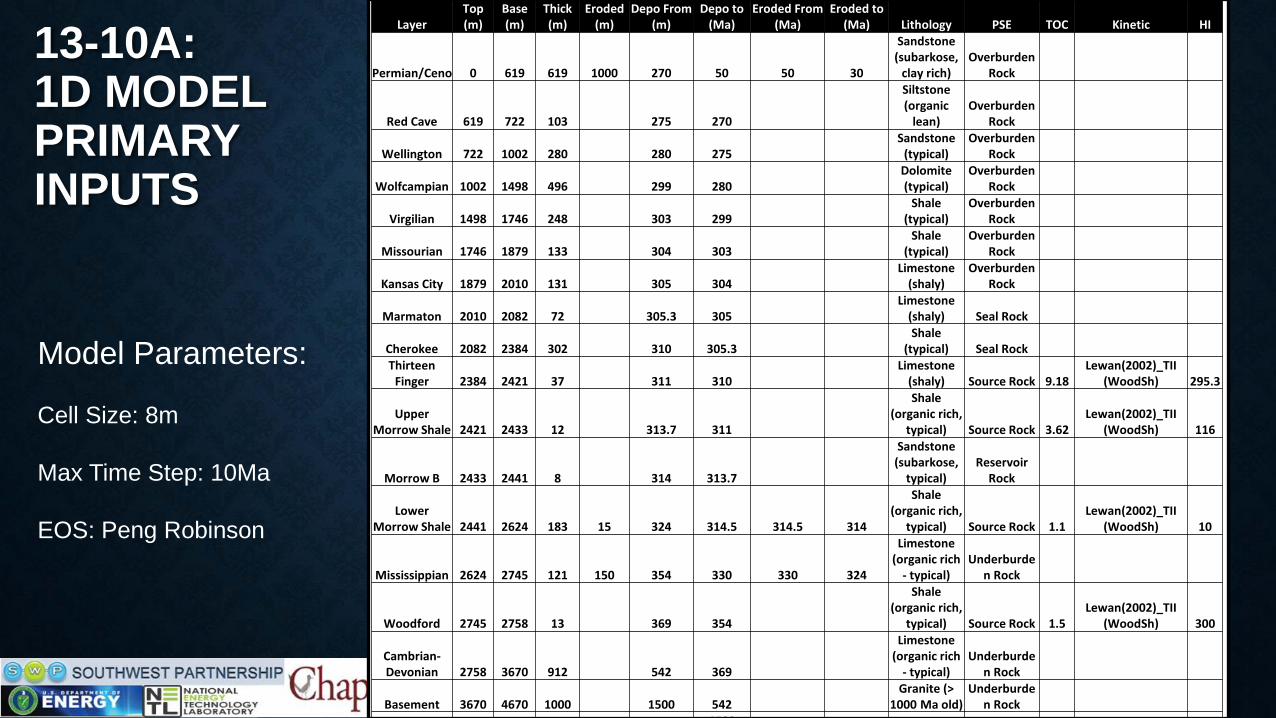
13-10A:1D MODEL PRIMARY INPUTS
LayerTop (m)
Base (m)
Thick (m)
Eroded (m)
Depo From (m)
Depo to (Ma)
Eroded From (Ma)
Eroded to (Ma) Lithology PSE TOC Kinetic HI
Permian/Ceno 0 619 619 1000 270 50 50 30
Sandstone (subarkose,
clay rich)Overburden
Rock
Red Cave 619 722 103 275 270
Siltstone (organic
lean)Overburden
Rock
Wellington 722 1002 280 280 275Sandstone
(typical)Overburden
Rock
Wolfcampian 1002 1498 496 299 280Dolomite (typical)
Overburden Rock
Virgilian 1498 1746 248 303 299Shale
(typical)Overburden
Rock
Missourian 1746 1879 133 304 303Shale
(typical)Overburden
Rock
Kansas City 1879 2010 131 305 304Limestone
(shaly)Overburden
Rock
Marmaton 2010 2082 72 305.3 305Limestone
(shaly) Seal Rock
Cherokee 2082 2384 302 310 305.3Shale
(typical) Seal RockThirteen
Finger 2384 2421 37 311 310Limestone
(shaly) Source Rock 9.18Lewan(2002)_TII
(WoodSh) 295.3
Upper Morrow Shale 2421 2433 12 313.7 311
Shale (organic rich,
typical) Source Rock 3.62Lewan(2002)_TII
(WoodSh) 116
Morrow B 2433 2441 8 314 313.7
Sandstone (subarkose,
typical)Reservoir
Rock
Lower Morrow Shale 2441 2624 183 15 324 314.5 314.5 314
Shale (organic rich,
typical) Source Rock 1.1Lewan(2002)_TII
(WoodSh) 10
Mississippian 2624 2745 121 150 354 330 330 324
Limestone (organic rich
- typical)Underburde
n Rock
Woodford 2745 2758 13 369 354
Shale (organic rich,
typical) Source Rock 1.5Lewan(2002)_TII
(WoodSh) 300
Cambrian-Devonian 2758 3670 912 542 369
Limestone (organic rich
- typical)Underburde
n Rock
Basement 3670 4670 1000 1500 542Granite (>
1000 Ma old)Underburde
n Rock1500
Model Parameters:
Cell Size: 8m
Max Time Step: 10Ma
EOS: Peng Robinson
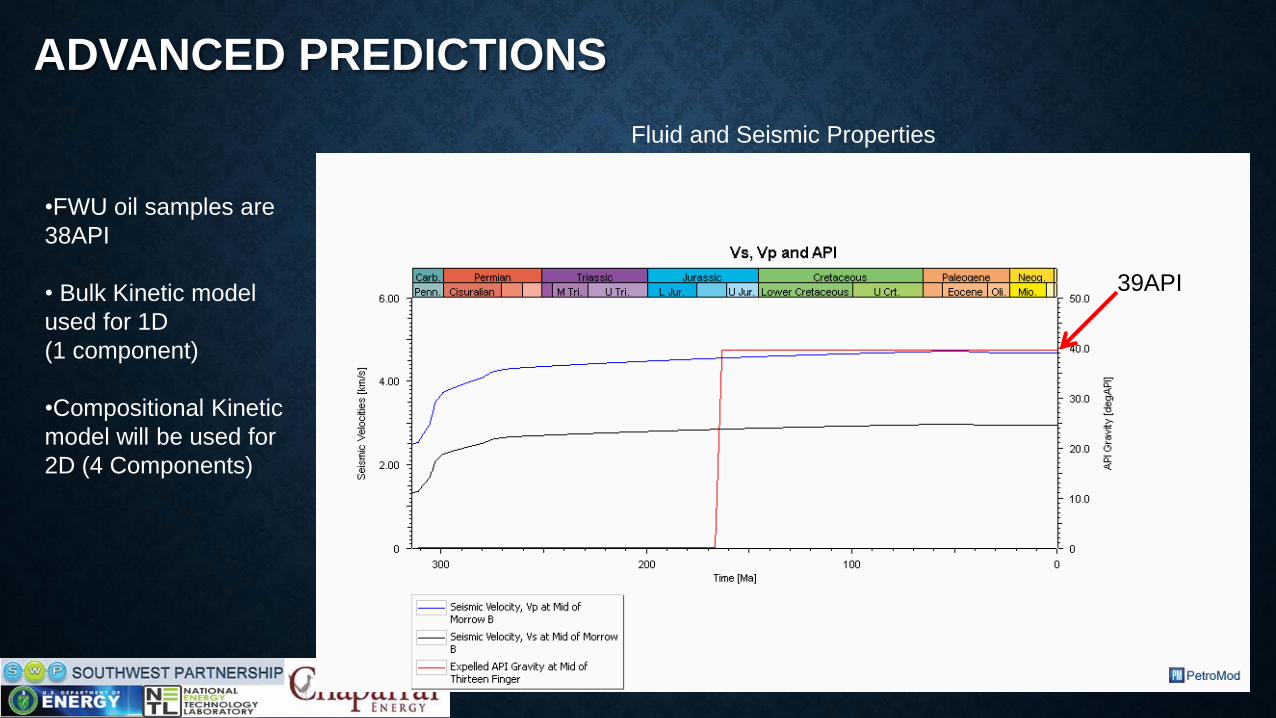
ADVANCED PREDICTIONS
•FWU oil samples are
38API
• Bulk Kinetic model
used for 1D
(1 component)
•Compositional Kinetic
model will be used for
2D (4 Components)
39API
Fluid and Seismic Properties
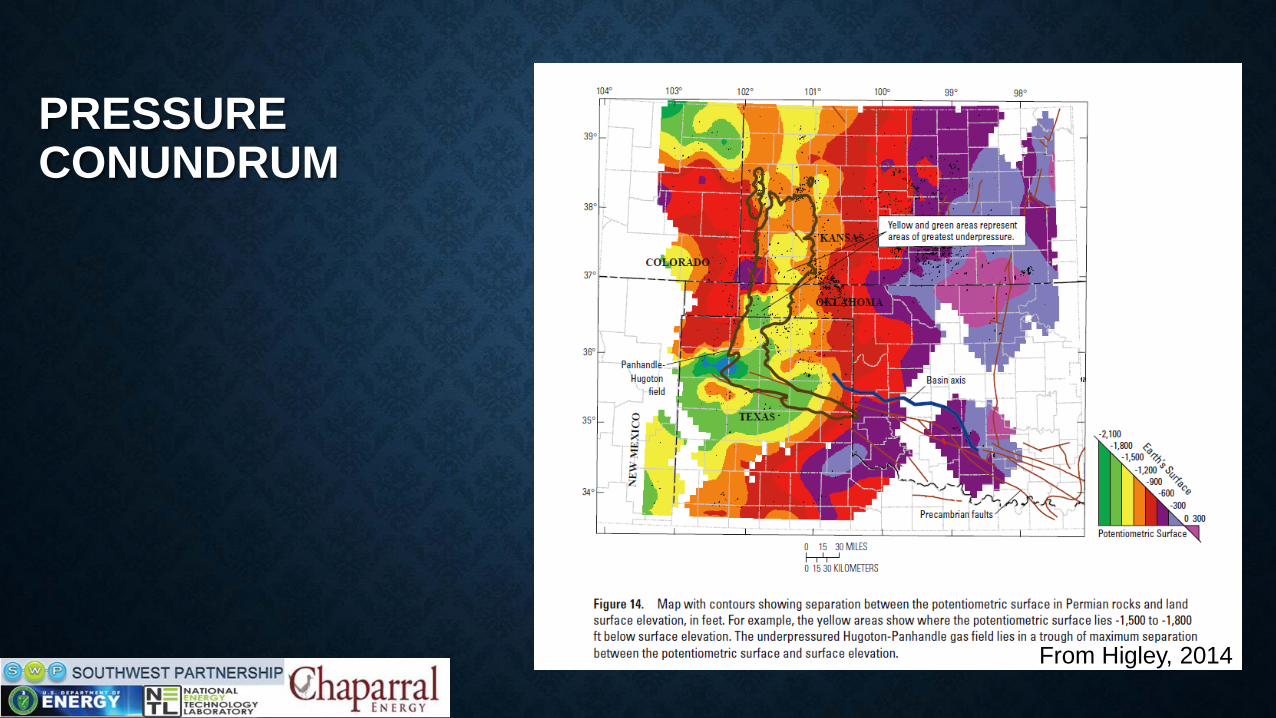
PRESSURE CONUNDRUM
From Higley, 2014
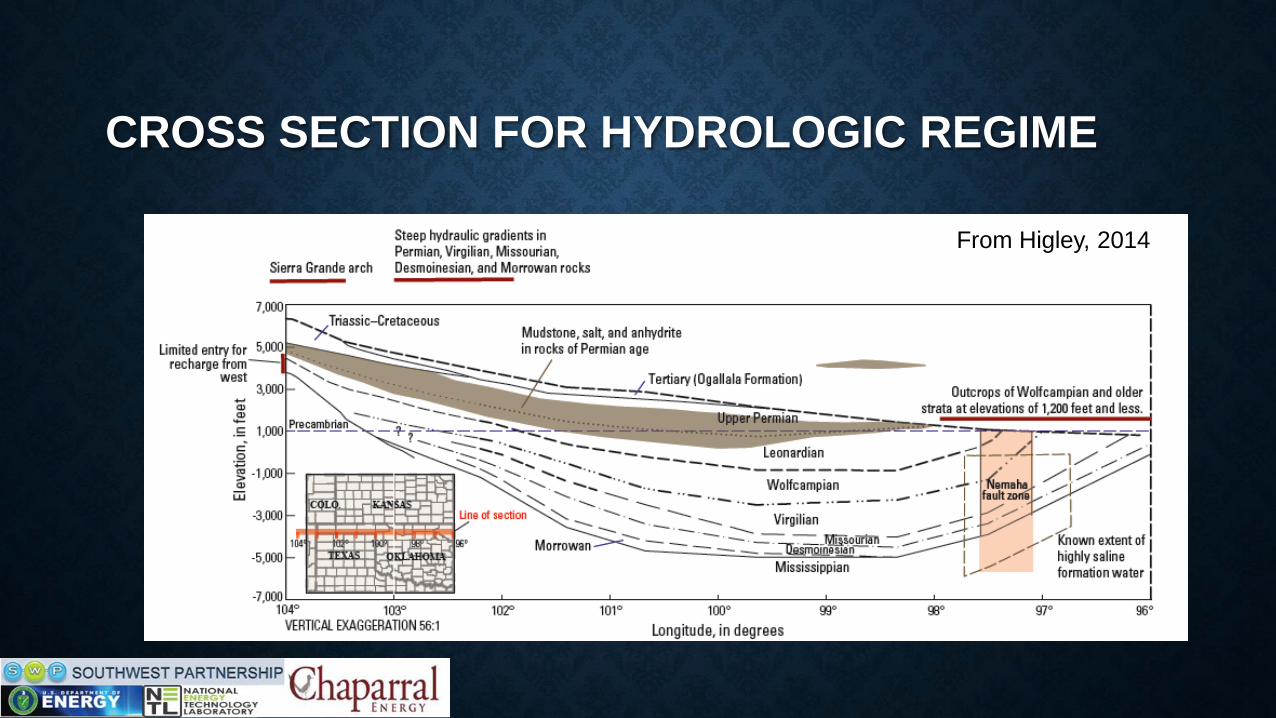
CROSS SECTION FOR HYDROLOGIC REGIME
From Higley, 2014
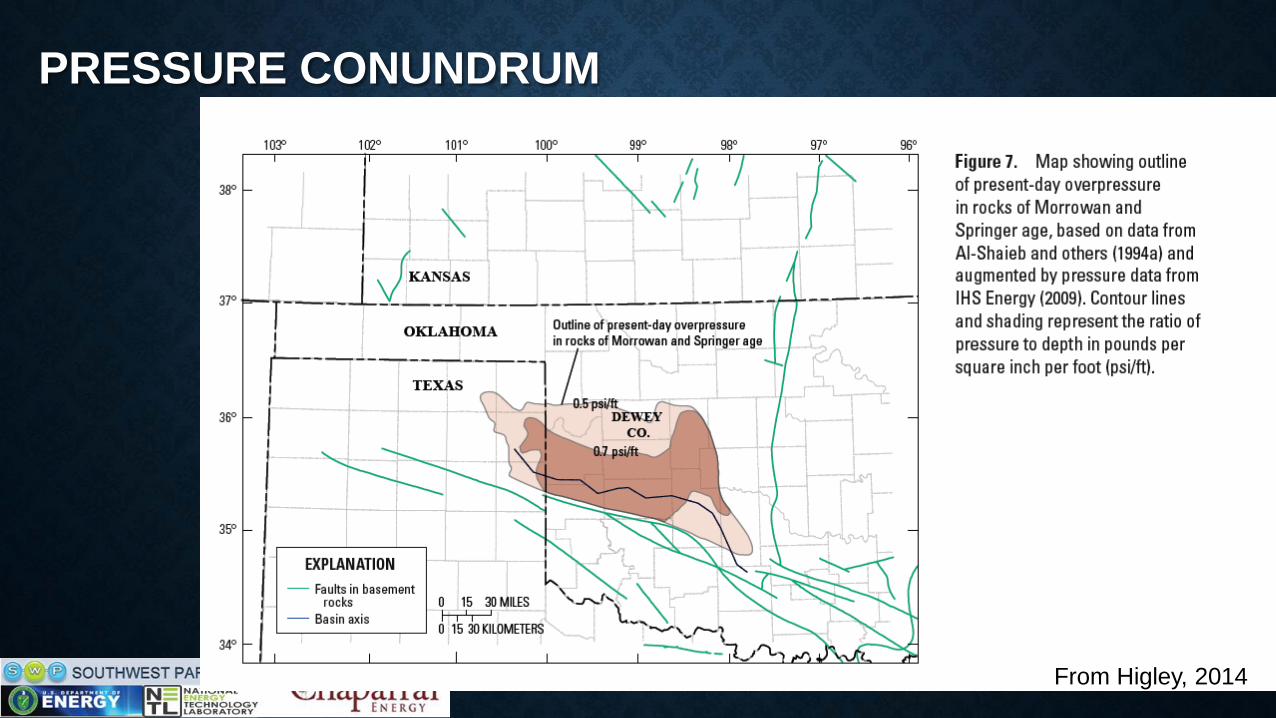
PRESSURE CONUNDRUM
From Higley, 2014From Higley, 2014