Embed Size (px)
Citation preview
Marsland Press Journal of American Science 2009;5(4):157-166
http://www.americanscience.org [email protected]
157
Applications of Remote Sensing in Land Use/Land Cover Change Detection in Puer and Simao Counties, Yunnan Province Yacouba Diallo1, Guangdao Hu1, Xingping Wen2
1. Institute for mathematics geosciences and Remote Sensing, Faculty of Earth Resources, China University of Geosciences, Wuhan, 430074, Hubei, P.R. CHINA
2. Kunming University of Science and Technology, Kunming, 650093, Yunnan, P.R. CHINA [email protected] Abstract Digital change detection is the process that helps in determining the changes associated with land use and land cover properties with reference to geo-registered multi temporal remote sensing data. Puer and Simao, where land use has been greatly affected by recent government policies that aim to balance the need to encourage rural development with ecological stability. These policies include promoting livestock livelihoods, altering grazing practices, the removal of compulsory grain crop quotas and banning commercial logging. The counties remained important in Yunnan Province, Simao is of the six demonstration sites of sustainable forest management.The province harbors a large pool of biodiversity, mostly constrained to a few locations amongst which, Puer and Simao play a major role. For all those reasons, nonetheless, disproportionate Land use/cover change processes are taking place. This paper is an attempt to assess the changes in land use/land cover in this southern part of Yunnan over a nine year period. The study made use of Land Sat imageries of 1990 and 1999. The images were classified using Maximum Likelihood classification method in ENVI 4.3 and mapped using ArcGIS. The results indicated that severe land cover changes have occurred in croplands (+24.90%), forest or shrub land (-18.77%) and building (+16.72%) areas has been knowledgeable and unused area constituted the most extensive type of land use/land cover in the study period. This paper highlights the importance of digital change detection in apprehending the environmental situation in this southern part of Yunnan Province (China). [Journal of American Science 2009;5(4):157-166]. (ISSN: 1545-1003). Key words: Remote sensing, county, change detection, LULC, classification scheme I. INTRODUCTION Digital change detection is the process that helps in determining the changes associated with land use and land cover properties with reference to geo-registered multi temporal remote sensing data. Throughout Southeast Asia, the expansion and intensification of agricultural activities are the principle reasons for land use land cover change (LULC) change particularly in tropical regions (Geist and Lambin 2002). Underlying causes of LULC changes leading to deforestation and land degradation include rapid economic development, population growth and poverty (Giri et al. 2003, Bolland et al., 2007). In China inappropriate institutional and development policies have also been major contributing factors (Xu et al., 1999). More specifically, (Lambin et al., 2003) surmised that it is people’s responses to economic opportunities as mediated by institutional factors that drive land use/ cover change. Puer and Simao, two counties of Yunnan
Province in China, where land use/cover has been greatly affected by recent government policies that aim to balance the need to encourage rural development with ecological stability (Xu and Wilkes 2004; Xu and Ribot 2004). These policies include promoting livestock livelihoods, altering grazing practices, the removal of compulsory grain crop quotas and banning commercial logging. The counties remained important in Yunnan Province; Simao is of the six demonstration sites of sustainable forest management. The province harbors a large pool of biodiversity, mostly constrained to a few locations amongst which, the study area plays major role. Furthermore there is of the most famous Puer Tea Mountains areas in the Province. For all those reasons, nonetheless, disproportionate LULC change processes are taking place. Inventory and monitoring of LULC changes are indispensable aspects for further understanding of change mechanism and
Applications of Remote Sensing in LULC Change Detection in Puer and Simao Counties Diallo, et al
158
modeling the impact of change on the environment and associated ecosystems at different scales (Wilson and Sader, 2002, Willson, 2005). Large scale changes are difficult and expensive to quantify through fieldwork. The collaboration of remotely sensed data and field observations can accomplish land cover classification and change detection, faster and cheaper than either alone. This paper entails classifying the land cover of counties, in two Landsat TM scenes from 1990 and 1999, and assessing the changes that have occurred between them. Successful utilization of remotely sensed data for land use and land cover change detection requires careful selection of appropriate data set and methods. The supervised classification technique is preferred, because the data of the study area is available and the author has a prior knowledge of the study area. LULC changes are investigated by using of Remote Sensing and Geographic Information Systems (GIS) in Rize, a mountainous region in North-East Turkey (Reis, 2008). For this purpose, the supervised classification technique is applied to Landsat images acquired in 1976 and 2000. Image Classification of six reflective bands of two Landsat images is carried out by using maximum likelihood method with the aid of ground truth data obtained from aerial images dated 1973 and 2002. The same methods were applied to classify and to map land cover in Himalayan region with high mountain peaks having elevations up to 4785 m above mean sea level (Saha et al. 2005). All Those methods gave satisfactory results with good classification overall accuracy. Maximum Likelihood algorithm is a common method, but it is appropriate and efficient method in such uneven study area. It is still one of the most widely used supervised classification algorithms (Wu and Shao, 2002; McIver and Friedl, 2002). The results and accuracy using other methods were found to be insufficient. The change detection technique, which was employed in this study, was the post- classification comparison. Most of studies have addressed that post-classification comparison was found to be the most accurate procedure (Mas et al 2004, Yuan et al. 2005). Our objectives were: (1) Determine with accurateness the area LULC classification in two Landsat TM images in 1990
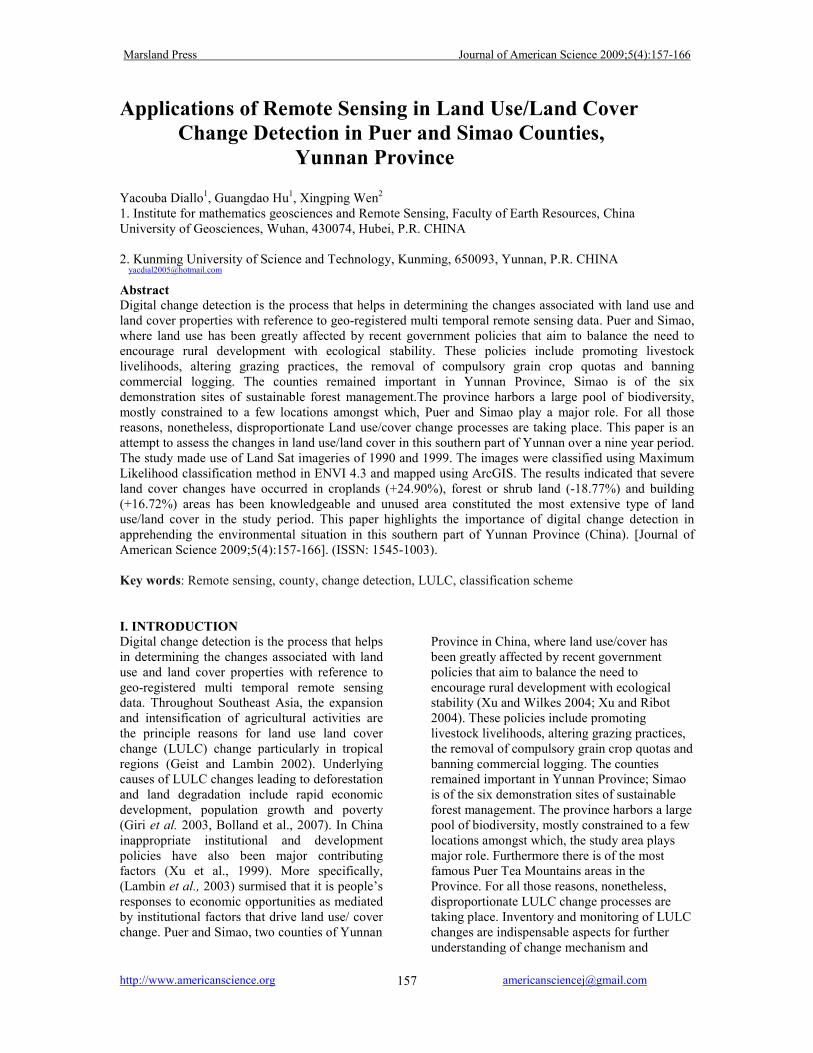
and 1999, (2) Perform post-classification change detection analysis of the classified images and quantify the changes in each land cover class. The rest of the paper is organized as follow: section 2 presents materials and methods used in this study, Section 3, presents our results and discussions and finally section 4, conclusions. II. MATERIALS AND METHODS 2.1 Study area The study was conducted in Puer and Simao, two counties of the southern part of Yunnan Province. The area is situated between Longitudes 100°20′ 07”-101°36′17” E and Latitudes 22°49’32”- 22°52′11” N (Fig.1). Puer, called Simao before January 21, 2007 is a major town with a population of 75 000. Simao Metropolitan County contains four urban townships, two rural townships and two ethnic rural townships. The climate is subtropical monsoon without hot summers or harsh winters. The mean annual rainfall of the area is around 1300 to 1400 mm, while the mean annual temperature is around 15°C to 18°C. It is neither extremely hot in summer nor terribly cold in winter. The topography is extremely irregular. The major landforms are mountains, highlands, small basins and valleys. The vegetative cover is of the type of savanna or tropical arid shrubby steppe. Puer Tea is grown in the mountainous forests of subtropical and tropical areas with an altitude of 1200 to 1400 meters. The shrubs include governorsplum (Flacourtia indica), boxleaf atalantia (Atalantia buxifolia) and the grasses are dominated by tangle head (Heteropogon pers). The soils are part of a series, which belongs to the group of Red Soils with erosion and water loss. According to the classification works (Vogel, Mingzhu and Huang, 1995), the soil is called Ferralic Cambisol or Haplic Phaeozem. It is called Aridic Haplustoll, according to the USDA soil taxonomy, 1992 or Haplic Dry Red Soil after Chinese Soil Classification system-Soil Taxonomic Classification Research Group, 1993. It has been called savanna red soil, red brown soil, red cinnamon soil or purple soil. Without irrigation the soils can be used for planting xerophilous plants like sisal, or produce low yields of traditional crops. With irrigation the soils can be used for rice, sugar-cane, flowering quince, water melon and peanut.
Marsland Press Journal of American Science 2009;5(4):157-166
http://www.americanscience.org [email protected]
159
Figure 1: Location of the Study area in Yunnan Province 2.2 Data sources An area of 6900 km2 was delineated on the LandSat scene covering the study area. The LULC mapping for the area was based on LandSat 5 Thematic Mapper (TM) of July 1990 and December 1999 data. Obtaining images at near anniversary dates is considered important for change detection studies (Jensen, 2007). However, the summer image in 1999 was unavailable. Both time series were from Landsat TM, path 130, row 044 with. The images were
corrected to remove atmospheric effects and then geo-rectified using ground control points collected by GPS. The images were re-sampled to 30m pixel size for all bands using the nearest neighbor method. The resultant root mean squared error was found to be 0.53 pixel (about 16 m on the ground) for the 1990 image, 0.51 pixel (about 15 m on the ground) for the 1999 image. All the data were projected to an Universal Transverse Mercator (UTM) coordinate system, Datum WGS 1984, zone 49 North using 1:50 000 topographic map of the study area.
Applications of Remote Sensing in LULC Change Detection in Puer and Simao Counties Diallo, et al
160
2.3 Image classification and Accuracy assessment statistical criteria In our study, two dated Landsat images were compared supervised classification technique. Once the training sites were determined, a supervised classification was performed on both images using Maximum Likelihood algorithm in ENVI 4.3. The supervised classification technique is preferred, because the data of the study area is available and the author has a prior
knowledge of the study area. The Maximum Likelihood decision rule is still one of the most widely used supervised classification algorithms (Wu and Shao, 2002; McIver and Friedl, 2002). It is considered to give very accurate results (Mengistu, 2007; Reis, 2008). From there the LULC maps were derived with the following six classes: 1. building area, 2. forest or shrub land 3.water, 4. cropland, 5. fallow, 6. unused area (Table 1).
Table1. Land use/land cover classification Scheme.
Land use/cover types Description
Building area Areas that have been populated with residential, commercial, industrial, transportation and facilities. Forest or shrub land Areas covered with mature trees, shrubby plants and other plants growing close together. Water Areas covered with water such as rivers and lakes. Croplands Rain fed cropping, planted and irrigated cropping areas Fallow Areas covered mainly with herbaceous vegetation with shrubs Unused area Mountainous or hilly areas, areas with no vegetation cover or degraded agricultural lands
Three standard criteria were used to assess the accuracy of the classifications: (1) The User accuracy was defined as the
proportion of the correctly classified pixels in a class to the total pixels that were classified in that class. It indicates the probability that a classified pixel actually represents that category in reality.
(2) The Overall accuracy was defined as the total number of correctly classified pixels divided by the total number of reference pixels (total number of sample points) (Rogan et al. 2002)
(3) Kappa coefficient was defined as a statistical measure of accuracy that ranges between 0 and 1, it measures how much better the classification is
compared to randomly assigning class values to each pixel. For example, a Kappa of 0.76 means the classification accuracy is 76% greater than chance (Miller and Yool, 2002).
Marsland Press Journal of American Science 2009;5(4):157-166
http://www.americanscience.org [email protected]
161
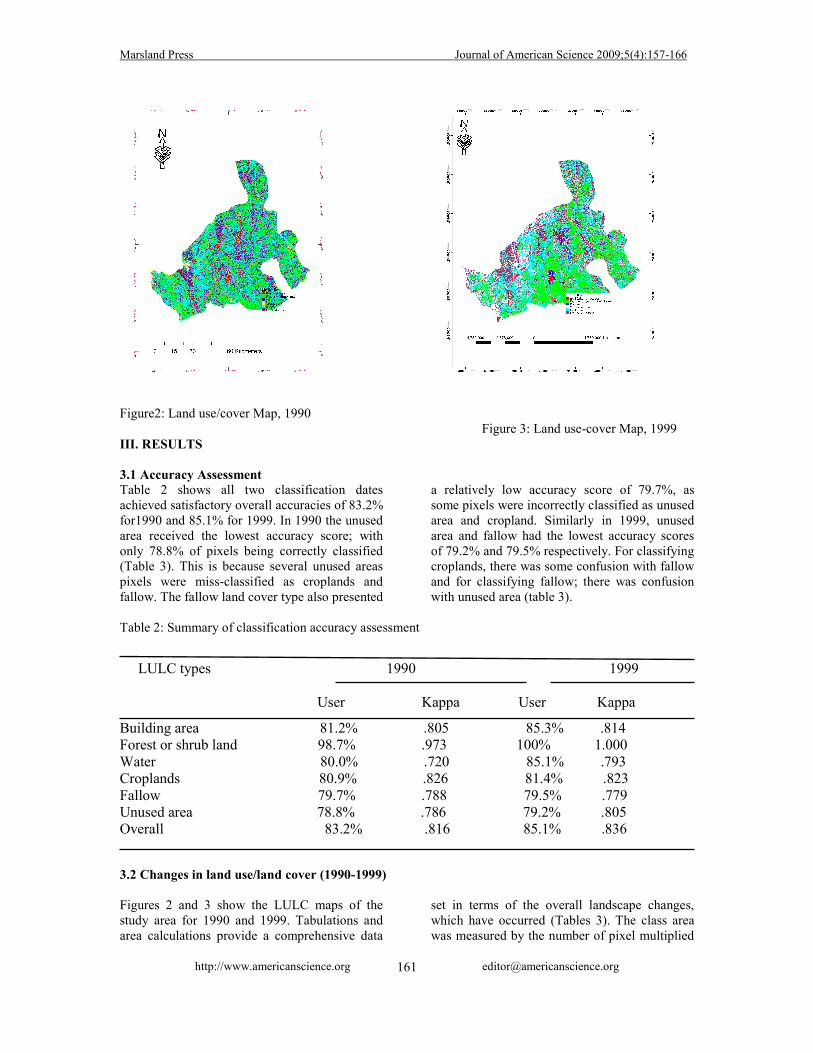
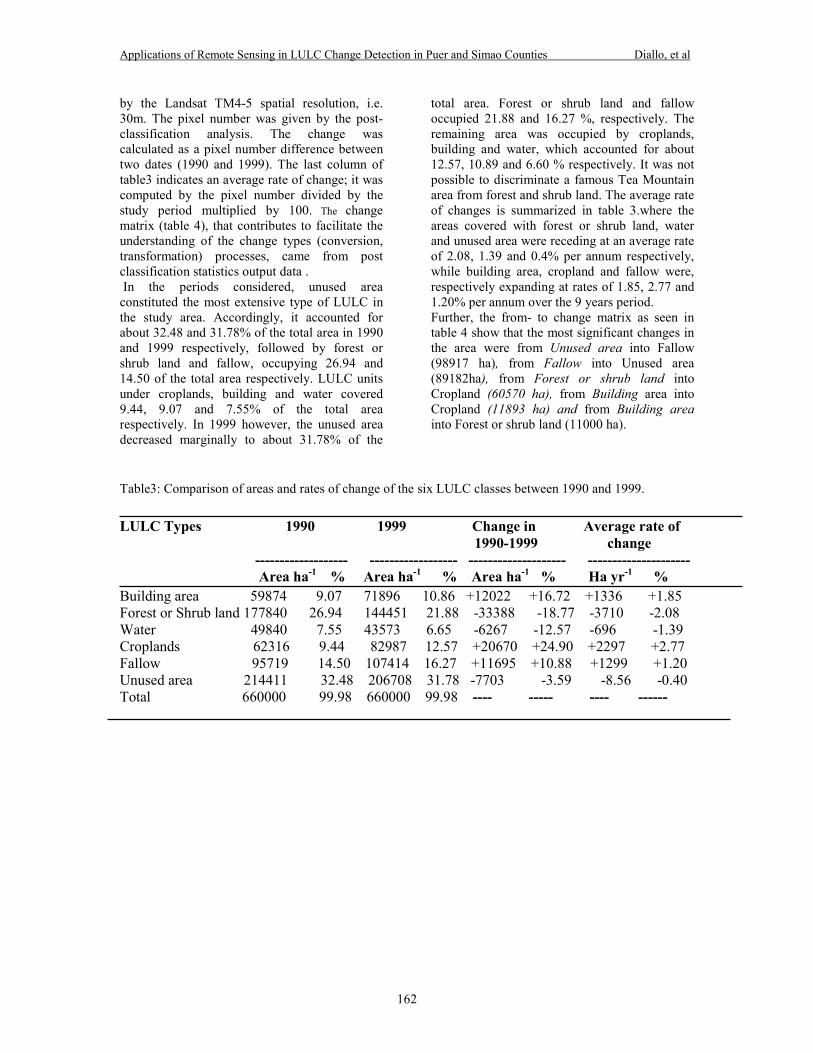
Figure2: Land use/cover Map, 1990 Figure 3: Land use-cover Map, 1999 III. RESULTS 3.1 Accuracy Assessment Table 2 shows all two classification dates achieved satisfactory overall accuracies of 83.2% for1990 and 85.1% for 1999. In 1990 the unused area received the lowest accuracy score; with only 78.8% of pixels being correctly classified (Table 3). This is because several unused areas pixels were miss-classified as croplands and fallow. The fallow land cover type also presented
a relatively low accuracy score of 79.7%, as some pixels were incorrectly classified as unused area and cropland. Similarly in 1999, unused area and fallow had the lowest accuracy scores of 79.2% and 79.5% respectively. For classifying croplands, there was some confusion with fallow and for classifying fallow; there was confusion with unused area (table 3).
Table 2: Summary of classification accuracy assessment
LULC types 1990 1999 User Kappa User Kappa
Building area 81.2% .805 85.3% .814 Forest or shrub land 98.7% .973 100% 1.000 Water 80.0% .720 85.1% .793 Croplands 80.9% .826 81.4% .823 Fallow 79.7% .788 79.5% .779 Unused area 78.8% .786 79.2% .805 Overall 83.2% .816 85.1% .836
3.2 Changes in land use/land cover (1990-1999) Figures 2 and 3 show the LULC maps of the study area for 1990 and 1999. Tabulations and area calculations provide a comprehensive data
set in terms of the overall landscape changes, which have occurred (Tables 3). The class area was measured by the number of pixel multiplied
Applications of Remote Sensing in LULC Change Detection in Puer and Simao Counties Diallo, et al
162
by the Landsat TM4-5 spatial resolution, i.e. 30m. The pixel number was given by the post-classification analysis. The change was calculated as a pixel number difference between two dates (1990 and 1999). The last column of table3 indicates an average rate of change; it was computed by the pixel number divided by the study period multiplied by 100. The change matrix (table 4), that contributes to facilitate the understanding of the change types (conversion, transformation) processes, came from post classification statistics output data . In the periods considered, unused area constituted the most extensive type of LULC in the study area. Accordingly, it accounted for about 32.48 and 31.78% of the total area in 1990 and 1999 respectively, followed by forest or shrub land and fallow, occupying 26.94 and 14.50 of the total area respectively. LULC units under croplands, building and water covered 9.44, 9.07 and 7.55% of the total area respectively. In 1999 however, the unused area decreased marginally to about 31.78% of the
total area. Forest or shrub land and fallow occupied 21.88 and 16.27 %, respectively. The remaining area was occupied by croplands, building and water, which accounted for about 12.57, 10.89 and 6.60 % respectively. It was not possible to discriminate a famous Tea Mountain area from forest and shrub land. The average rate of changes is summarized in table 3.where the areas covered with forest or shrub land, water and unused area were receding at an average rate of 2.08, 1.39 and 0.4% per annum respectively, while building area, cropland and fallow were, respectively expanding at rates of 1.85, 2.77 and 1.20% per annum over the 9 years period. Further, the from- to change matrix as seen in table 4 show that the most significant changes in the area were from Unused area into Fallow (98917 ha), from Fallow into Unused area (89182ha), from Forest or shrub land into Cropland (60570 ha), from Building area into Cropland (11893 ha) and from Building area into Forest or shrub land (11000 ha).
Table3: Comparison of areas and rates of change of the six LULC classes between 1990 and 1999. LULC Types 1990 1999 Change in Average rate of 1990-1999 change ------------------- ------------------ -------------------- --------------------- Area ha-1 % Area ha-1 % Area ha-1 % Ha yr-1 % Building area 59874 9.07 71896 10.86 +12022 +16.72 +1336 +1.85 Forest or Shrub land 177840 26.94 144451 21.88 -33388 -18.77 -3710 -2.08 Water 49840 7.55 43573 6.65 -6267 -12.57 -696 -1.39 Croplands 62316 9.44 82987 12.57 +20670 +24.90 +2297 +2.77 Fallow 95719 14.50 107414 16.27 +11695 +10.88 +1299 +1.20 Unused area 214411 32.48 206708 31.78 -7703 -3.59 -8.56 -0.40 Total 660000 99.98 660000 99.98 ---- ----- ---- ------
Marsland Press Journal of American Science 2009;5(4):157-166
http://www.americanscience.org [email protected]
163
Table 4: Change matrix for the change in land cover types between 1990 and 1999 in hectares.
1990 ------------------------------------------------------------------------------ Total 1999 1 2 3 4 5 6
1. Building area 34530 903 1 35362 60 1040 71896 2. Forest or shrub land 11000 110261 20 1000 0 0 144451 3. Water 560 2100 40459 22 32 400 43573 4. Croplands 11893 60570 10 10514 0 0 82987 5. Fallow 2 2000 50 0 6445 98917 107414 6. Unused area 1889 1006 300 302 89182 114029 206708 Total 59874 177840 49840 62316 95719 214411 657029
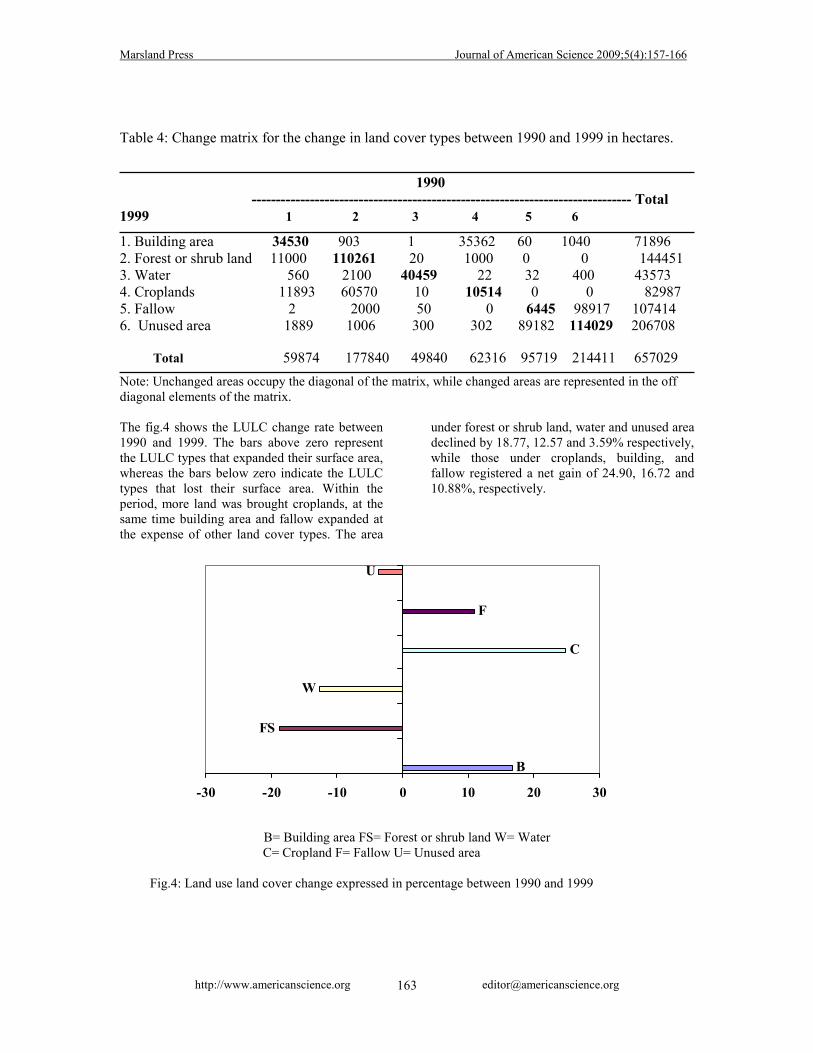
Note: Unchanged areas occupy the diagonal of the matrix, while changed areas are represented in the off diagonal elements of the matrix. The fig.4 shows the LULC change rate between 1990 and 1999. The bars above zero represent the LULC types that expanded their surface area, whereas the bars below zero indicate the LULC types that lost their surface area. Within the period, more land was brought croplands, at the same time building area and fallow expanded at the expense of other land cover types. The area
under forest or shrub land, water and unused area declined by 18.77, 12.57 and 3.59% respectively, while those under croplands, building, and fallow registered a net gain of 24.90, 16.72 and 10.88%, respectively.
B= Building area FS= Forest or shrub land W= Water
C= Cropland F= Fallow U= Unused area Fig.4: Land use land cover change expressed in percentage between 1990 and 1999
B
FS
W
C
F
U
-30 -20 -10 0 10 20 30
Applications of Remote Sensing in LULC Change Detection in Puer and Simao Counties Diallo, et al.,
164
IV. DISCUSSIONS 4.1 AccuracyThe accuracies of classification were turned out to be better than expected. The reasonable overall accuracies of all classification process can be explained by the fact that the total number of correctly classified pixels was high. The LULC types were correctly chosen, the precision of the classification might be another if we tried to classify separately classes (i.e. forest and shrub land, or rain fed cropland and irrigated). The comparatively lower accuracy of unused area and fallow could be explained by the fact that several of fallow pixels were misclassified as unused area or vise-versa. That indicates the probability that a fallow classified pixel in the map represented that category in reality. In other words the spectral signatures of unused area and fallow were very similar. For classifying croplands, there was some confusion with fallow and for classifying fallow; there was confusion with unused area. That was found to be consistent with the range reported elsewhere (Hazeu and De Wit, 2004). But most classes had quite high accuracy scores. That indicates the classification process was done as expected. 4.2 Changes in land use/land cover (1990-1999) The satellite-based analysis reveals some interesting trends as regards the land cover development in the period 1990 to 1999. From our results fig.4 it is clear that the study area had been subjected to intensive use influence and degraded with +24.90 % and -18.77% of change under cropland and forest or shrub land respectively. It is worth mentioning that most of the deforestation took place south and south-east of the study area in 1999. The increase in cropland area and the decrease in forest or shrub land was found as deforestation at the profits of cropland elsewhere (Mengistu and Salami, 2007, Reis, 2008). In line with this, the LULC data of the two years indicated a change. The retreating of areas covered with forest or shrub land, water and unused area and expanding of building area, cropland and fallow is common in the region. This indicates the encroachment of cropland, fallow and buildings towards forest areas, water and unused area; this was established by the field investigation. The phenomenon is found to be a
forest clearing and caused by anthropogenic disturbance (Roy, Chowdhury and Schneider, 2004). In other words the additional people have placed considerable pressure on the land for new housing and for increased food production. In many cases, new building areas were constructed on prime agricultural land with the attendant loss in food production from the best lands. To replace food production lost from converted prime agricultural land, and to provide additional output for the increased population, marginal lands have been cultivated, many of them on steep hillslopes. A better scenario can be foreseen if local social initiatives devoted to the sustainable use of natural resources are enforced (Velazquez et al., 2001). LULC changes reflect the dynamics observed in the socio-economic condition of the study area. As saying up the changes might due to the government policies that aim to balance the need to encourage rural development, the removal of compulsory grain crop quotas, promoting livestock with ecological stability. That is found to be similar to the situation in a neighboring area Xishuangbanna Prefecture (Xu et al., 1999). The driving force for building area (urban) expansion of Puer as Chinese city might be the phenomenon of development zones that are created to host innovative activities and foreign investment. The same reasons are valuable for cropland expansion, where the change was extremely important 24.90%. This indicates that, despite the economic growth, many people are still greatly dependent on the management of soils and the traditional agriculture. It puts pressure on the others land cover types, this in turn leads to the opening up of more natural forests, water and unused area for cultivation. Hence, the expansion of cropland was partially responsible for the disappearance of the forest of the area in the study period, even if the 1999 image was taken in December in winter period. The relationships between the cropland and building areas expansion and the forest decrease were found to be consistent with the range reported elsewhere (Fearnside, 2001, Lambin et al. 2003, Velazquez and al., 2003).
Marsland Press Journal of American Science 2009;5(4):157-166
http://www.americanscience.org [email protected]
165
V. CONCLUSIONS: LULC change detection analysis derived from landsat imagery has provided an accurate account of the situation of the study area during the period 1990-1999. Land use activities were towards more agricultural production. Drivers of land use change are strongly influenced by changes in agricultural practices, which themselves are influenced by institutional and economics factors (public policy, infrastructure growth). This analysis confirmed by the results, indicated that forest or shrub land conversion and modification were intensifying, as the human population was increased and livestock promoting became more common. The results indicated that severe land cover changes have occurred in croplands (+24.90%), forest or shrub land (-18.77%) and building (+16.72%) areas have been knowledgeable and unused area constituted the most extensive type of LULC in the study period. This paper highlights the importance of digital change detection in apprehending the environmental situation in this southern part of Yunnan Province (China). Further research would be important to help us understand more about variations in deforestation rates across counties, as well as the conversion and modification mechanisms of the above classified land use land cover types. ACKNOWLEDGEMENTS The author is grateful to the China Scholarship Council and China University of Geosciences for their financial support. Correspondence to: Diallo Yacouba,, Institute for mathematics geosciences and Remote Sensing, Geosciences Faculty of Earth Resources, China University of
2. Fearnside, M.P., 2001. Saving tropical forests as a global warming countermeasure: an issue that divides the environmental movement.Ecological Economics 39, 167–184. 3. Geist, H., J., Lambin E.F., 2002, Proximate causes and underlying driving forces of tropical deforestation . BioScience 52(2): 143-150 4. Giri, C., Defourny, P., & Shrestha, S. (2003) Land cover characterization and mapping of continental Southeast Asia using multi-resolution satellite sensor data. Int. J. Remote Sensing, 24 (21): 4181-4196. 5. Hazeu G.W. and De wit A.W., 2004, Corine land cover database of the Netherlands: monitoring land cover changes between 1986 and 2000. In the proceedings of EARSel conference pp. 382-387. 6. Jensen,J.R., 2007. Introductory Digital Image Processing: a remote sensing perspective. 3rd Edn., science Press and Pearson Education Asia Ltd: Beijing ISBN:978703018819-9 pp. 467-494 7. Lambin EF, Geist H, Lepers E (2003). Dynamics of land use and cover change in tropical regions. Annual Rev. Environ. Resour. 28: 205–241. 8. Mas, J.F.; Velazquez, A.; Gallegos, J.R.D.; Saucedo, R.M., Alcantare, C.; Bocco, G.; Castro, R.; Fernandez, T.; Vega, A.P., 2004, Assessing land use/cover changes: a nationwide multidate spatial database for Mexico. International Journal of Applied Earth Observation and Geoinformation, 5: 249-2 9. McIver D. K. and M. A. Friedl, 2002, Using prior probabilities in decision-tree classification of remotely sensed data. Remote Sensing of Environment 81: 253-261
Wuhan, 430074, Hubei, P.R. CHINA Telephone: +86-027-67885970 Mobile phone: +86-15827248937, E-mail: [email protected] REFERENCES 1. Bolland L. P., Ellis E.A., Gholz H.L., 2007 Land use dynamics and landscape history in La Montana, Campeche, Mexico, Landscape and Urban Planning, 82: 198-207
10. Mengistu D., A., and Salami A.T., 2007, Application of remote sensing and GIS inland use/land cover mapping and change detection in a part of south western Nigeria, African Journal of Environmental Science and Technology 1(5): 099-109
Applications of Remote Sensing in LULC Change Detection in Puer and Simao Counties Diallo, et al.,
166
11. Miller, J.D. and Pool, S.R., ( 2002). Mapping forest Post-Fire canopy Consumption in several 12. Overstory Types Using Multi-Temporal Landsat TM and ETM data. Remote Sensing of the Environment, 82(2-3): 481-496 13. Reis S. 2008, Analyzing land use/land cover changes using remote sensing and GIS in Rize, North-East Turkey, Sensors, 8: 6188-6202 14. Rogan, J., Franklin, J. & Roberts, D.A. (2002) A comparison of methods for monitoring multitemporal vegetation change using Thematic Mapper imagery. Remote Sens. Environ., 80(1): 143-156. 15. Roy Chowdhury, R., Scheneider, L.C., 2004. land cover and land use classification and change analysis. In Turner II, B.L.,Geoghegan, J., Foster, D.(Eds), Integrated Land change Science and Tropical Deforestation in the Southern Yucatan: Final Frontiers.Clarendon Press/Oxford U.P., Oxford,pp.105-141. 16. Saha A. K., Arora M. K., Csaplovics E., Gupta R. P., 2005, Land Cover Classification Using IRS LISS III Image and DEM in a Rugged Terrain: A Case Study in Himalayas, Geocarto International, 20(2): 33-40 17. Velazquez A,Bocco G,Torres A (2001) Turning scientific approaches into practical conservation actions: The case of Comunidad Indigena de Nuevo San Juan Paranagrocutiro, Mexico. Environmental Management 27: 655- 665. 18. Velazquez, A., Durana E., Ramırez I., Mas J., F., Bocco G., Ramırez G., Palacio J., L., 2003, Land use-cover change processes in highly biodiverse areas: the case of Oaxaca, Mexico, Global Environmental Change 13: 175–184 19. Vogel, A.W., Wang Mingzhu and Huang Xiaoqing, 1995. people’s Republic of China: Red Reference Soils of the subtropical Yunnan Province. Soil Brief China1. Institute of Soil Science-Academica Sinica, Nanjing, and
International Soil Reference and Information Centre, Wageningen. pp. 10-27. 20. Willson A. 2005, Using remote sensing to measure forest conversion and land use changes in Xiaozhongdian Township, Northwest Yunnan Province, China, Center for Biodiversity and Indigenous Knowledge (CBIK) Working Paper, pp. 5-15 http//: www.cbik.ac.cn 21. Wilson, E.H. & Sader, S.A. (2002) Detection of forest harvest type using multiple dates of Landsat TM imagery. Remote Sensing of Environment, 80: 385-396. 22. Wu, W. and Shao, G. 2002; “Optimal Combinations of Data, Classifiers, and sampling methods for Accurate Characterizations of deforestation” Canadian Journal of Remote Sensing, 28(4): 601-609. 23. Xu, J., & Ribot, J.C. (2004) Decentralization and accountability in forest management: a case from Yunnan, Southwest China. European Journal of Development Research, Vol. 16(1): 153-173. 24. Xu, J., & Wilkes, A.. (2004) Biodiversity impact analysis in northwest Yunnan, southwest China. Biodiversity and Conservation, 13: 959-983. 25. Xu, J., Fox, J., Xing, L., Podger, N., Leisz, S., Xihui, A., 1999. Effects of swidden cultivation, state policies, and customary institutions on land cover in a Hani village, Yunnan, China. Mountain Research and Development 19 (2): 123–132. 26. Yuan, F.; Sawaya, K.E.; Loeffelholz, B.C.; Bauer, M.E. 2005, Land cover classification and change analysis of the Twin Cities (Minnesota) metropolitan areas by multitemporal Landsat remote sensing. Remote Sensing of Environment 98, 317-328.


![[REMOTE SENSING] 3-PM Remote Sensing](https://img.pdfslide.net/doc/110x75/61f2bbb282fa78206228d9e2/remote-sensing-3-pm-remote-sensing.jpg)


