Embed Size (px)
Citation preview
Internal Copy - Information Technology Vital Statistics Information Technology Services
Fall 2012 – version 2012-10-22
Page 1 of 27
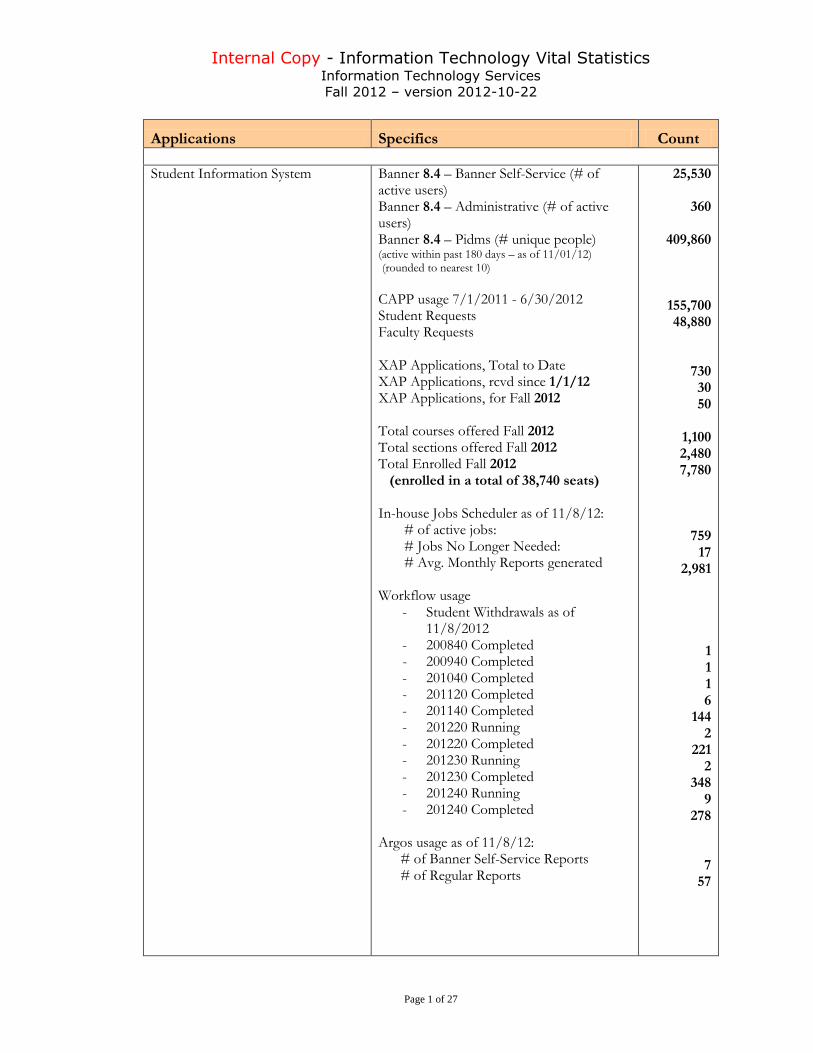
Applications Specifics Count
Student Information System
Banner 8.4 – Banner Self-Service (# of active users) Banner 8.4 – Administrative (# of active users) Banner 8.4 – Pidms (# unique people) (active within past 180 days – as of 11/01/12) (rounded to nearest 10)
CAPP usage 7/1/2011 - 6/30/2012 Student Requests Faculty Requests XAP Applications, Total to Date XAP Applications, rcvd since 1/1/12 XAP Applications, for Fall 2012 Total courses offered Fall 2012 Total sections offered Fall 2012 Total Enrolled Fall 2012 (enrolled in a total of 38,740 seats) In-house Jobs Scheduler as of 11/8/12: # of active jobs: # Jobs No Longer Needed: # Avg. Monthly Reports generated Workflow usage
- Student Withdrawals as of 11/8/2012
- 200840 Completed - 200940 Completed - 201040 Completed - 201120 Completed - 201140 Completed - 201220 Running - 201220 Completed - 201230 Running - 201230 Completed - 201240 Running - 201240 Completed
Argos usage as of 11/8/12: # of Banner Self-Service Reports # of Regular Reports
25,530
360
409,860
155,700 48,880
730 30 50
1,100 2,480 7,780
759 17
2,981
1 1 1 6
144 2
221 2
348 9
278
7 57
Internal Copy - Information Technology Vital Statistics Information Technology Services
Fall 2012 – version 2012-10-22
Page 2 of 27
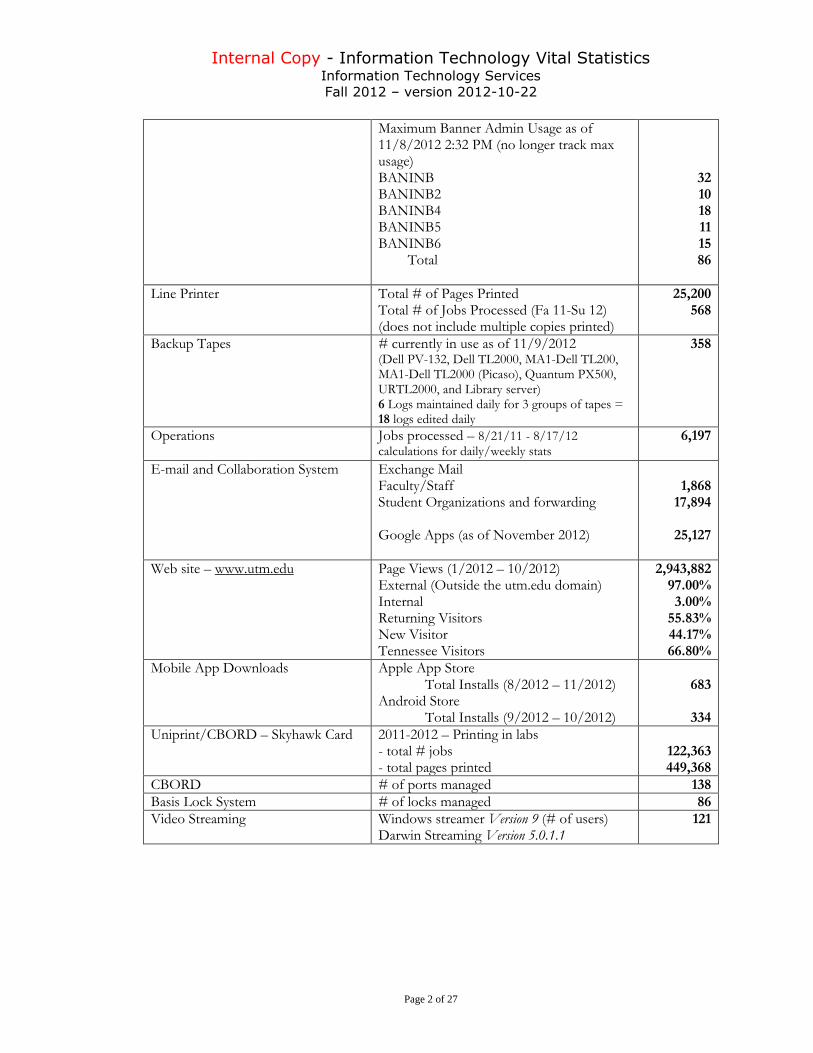
Maximum Banner Admin Usage as of 11/8/2012 2:32 PM (no longer track max usage) BANINB BANINB2 BANINB4 BANINB5 BANINB6 Total
32 10 18 11 15 86
Line Printer Total # of Pages Printed Total # of Jobs Processed (Fa 11-Su 12) (does not include multiple copies printed)
25,200 568
Backup Tapes # currently in use as of 11/9/2012 (Dell PV-132, Dell TL2000, MA1-Dell TL200, MA1-Dell TL2000 (Picaso), Quantum PX500, URTL2000, and Library server) 6 Logs maintained daily for 3 groups of tapes = 18 logs edited daily
358
Operations
Jobs processed – 8/21/11 - 8/17/12 calculations for daily/weekly stats
6,197
E-mail and Collaboration System Exchange Mail Faculty/Staff Student Organizations and forwarding Google Apps (as of November 2012)
1,868
17,894
25,127
Web site – www.utm.edu
Page Views (1/2012 – 10/2012) External (Outside the utm.edu domain) Internal Returning Visitors New Visitor Tennessee Visitors
2,943,882 97.00% 3.00%
55.83% 44.17% 66.80%
Mobile App Downloads Apple App Store Total Installs (8/2012 – 11/2012)
Android Store Total Installs (9/2012 – 10/2012)
683
334
Uniprint/CBORD – Skyhawk Card 2011-2012 – Printing in labs - total # jobs - total pages printed
122,363 449,368
CBORD # of ports managed 138
Basis Lock System # of locks managed 86
Video Streaming Windows streamer Version 9 (# of users) Darwin Streaming Version 5.0.1.1
121
Internal Copy - Information Technology Vital Statistics Information Technology Services
Fall 2012 – version 2012-10-22
Page 3 of 27
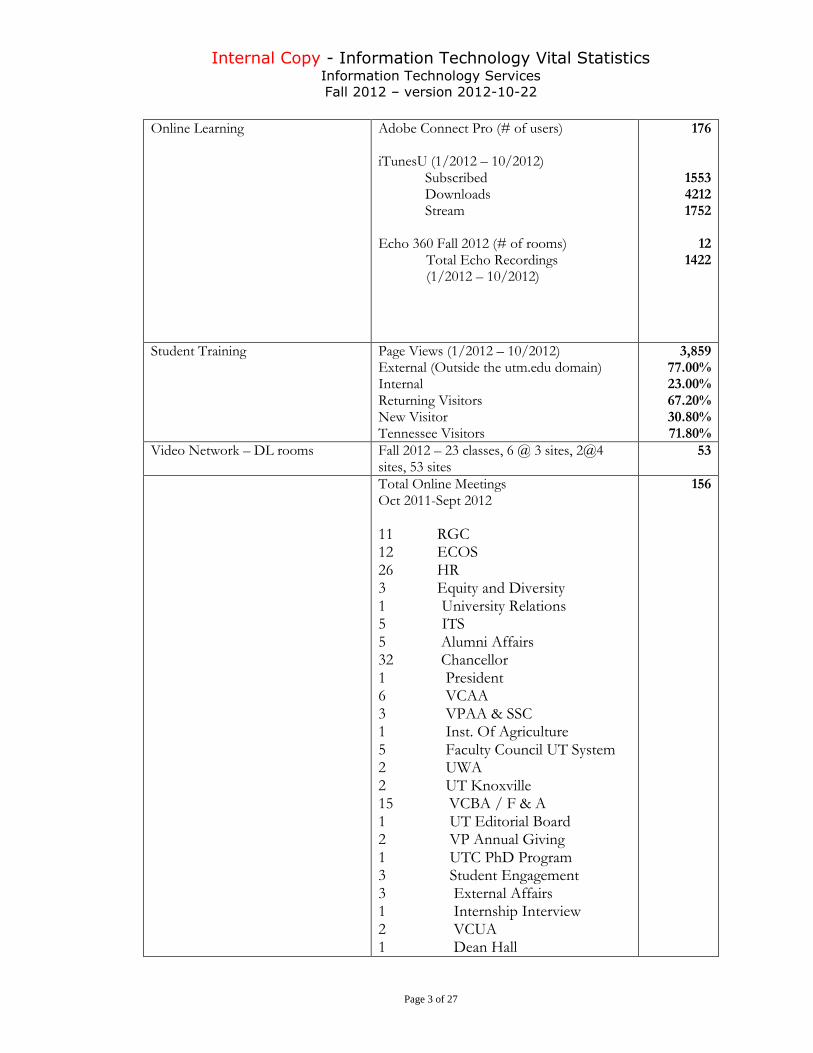
Online Learning Adobe Connect Pro (# of users) iTunesU (1/2012 – 10/2012)
Subscribed Downloads Stream
Echo 360 Fall 2012 (# of rooms)
Total Echo Recordings (1/2012 – 10/2012)
176
1553 4212 1752
12
1422
Student Training
Page Views (1/2012 – 10/2012) External (Outside the utm.edu domain) Internal Returning Visitors New Visitor Tennessee Visitors
3,859 77.00% 23.00% 67.20% 30.80% 71.80%
Video Network – DL rooms Fall 2012 – 23 classes, 6 @ 3 sites, 2@4 sites, 53 sites
53
Total Online Meetings Oct 2011-Sept 2012
11 RGC 12 ECOS 26 HR 3 Equity and Diversity 1 University Relations 5 ITS 5 Alumni Affairs 32 Chancellor 1 President 6 VCAA 3 VPAA & SSC 1 Inst. Of Agriculture 5 Faculty Council UT System 2 UWA 2 UT Knoxville 15 VCBA / F & A 1 UT Editorial Board 2 VP Annual Giving 1 UTC PhD Program 3 Student Engagement 3 External Affairs 1 Internship Interview 2 VCUA 1 Dean Hall
156
Internal Copy - Information Technology Vital Statistics Information Technology Services
Fall 2012 – version 2012-10-22
Page 4 of 27
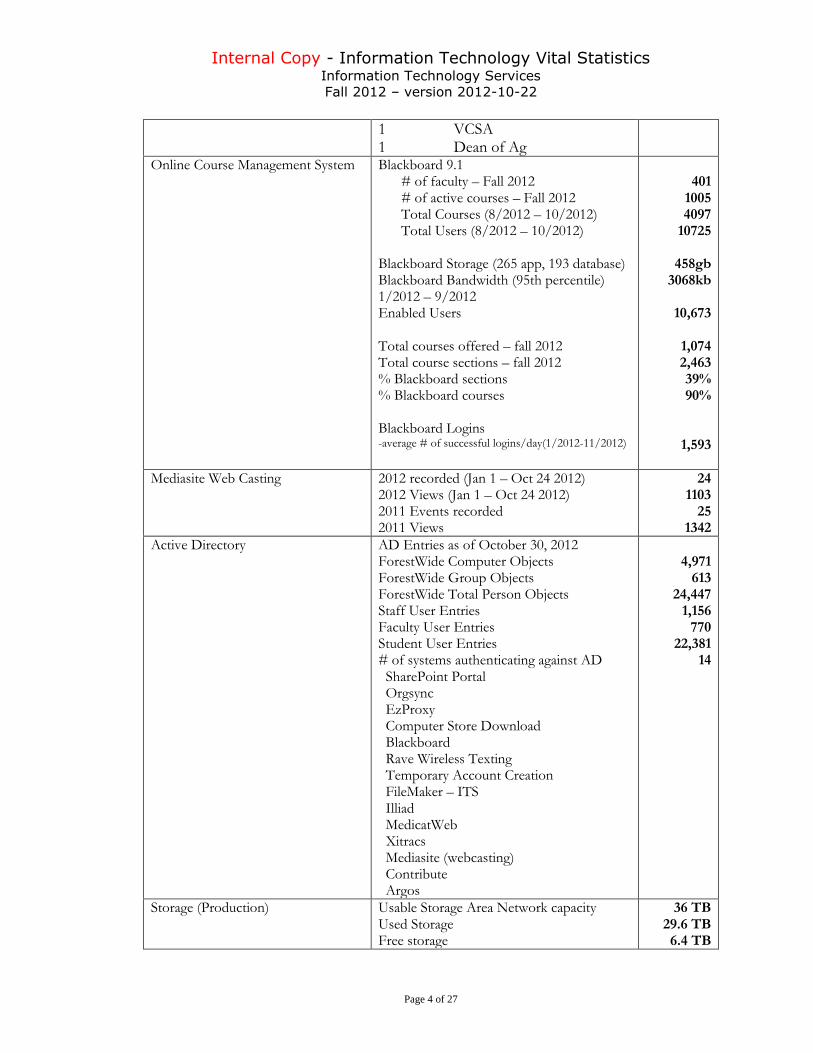
1 VCSA 1 Dean of Ag
Online Course Management System Blackboard 9.1 # of faculty – Fall 2012 # of active courses – Fall 2012 Total Courses (8/2012 – 10/2012) Total Users (8/2012 – 10/2012)
Blackboard Storage (265 app, 193 database) Blackboard Bandwidth (95th percentile) 1/2012 – 9/2012 Enabled Users Total courses offered – fall 2012 Total course sections – fall 2012 % Blackboard sections % Blackboard courses Blackboard Logins -average # of successful logins/day(1/2012-11/2012)
401
1005 4097
10725
458gb 3068kb
10,673
1,074 2,463 39% 90%
1,593
Mediasite Web Casting 2012 recorded (Jan 1 – Oct 24 2012) 2012 Views (Jan 1 – Oct 24 2012) 2011 Events recorded 2011 Views
24 1103
25 1342
Active Directory AD Entries as of October 30, 2012 ForestWide Computer Objects ForestWide Group Objects ForestWide Total Person Objects Staff User Entries Faculty User Entries Student User Entries # of systems authenticating against AD SharePoint Portal Orgsync EzProxy Computer Store Download Blackboard Rave Wireless Texting Temporary Account Creation FileMaker – ITS Illiad MedicatWeb Xitracs Mediasite (webcasting) Contribute Argos
4,971
613 24,447
1,156 770
22,381 14
Storage (Production) Usable Storage Area Network capacity Used Storage Free storage
36 TB 29.6 TB
6.4 TB
Internal Copy - Information Technology Vital Statistics Information Technology Services
Fall 2012 – version 2012-10-22
Page 5 of 27
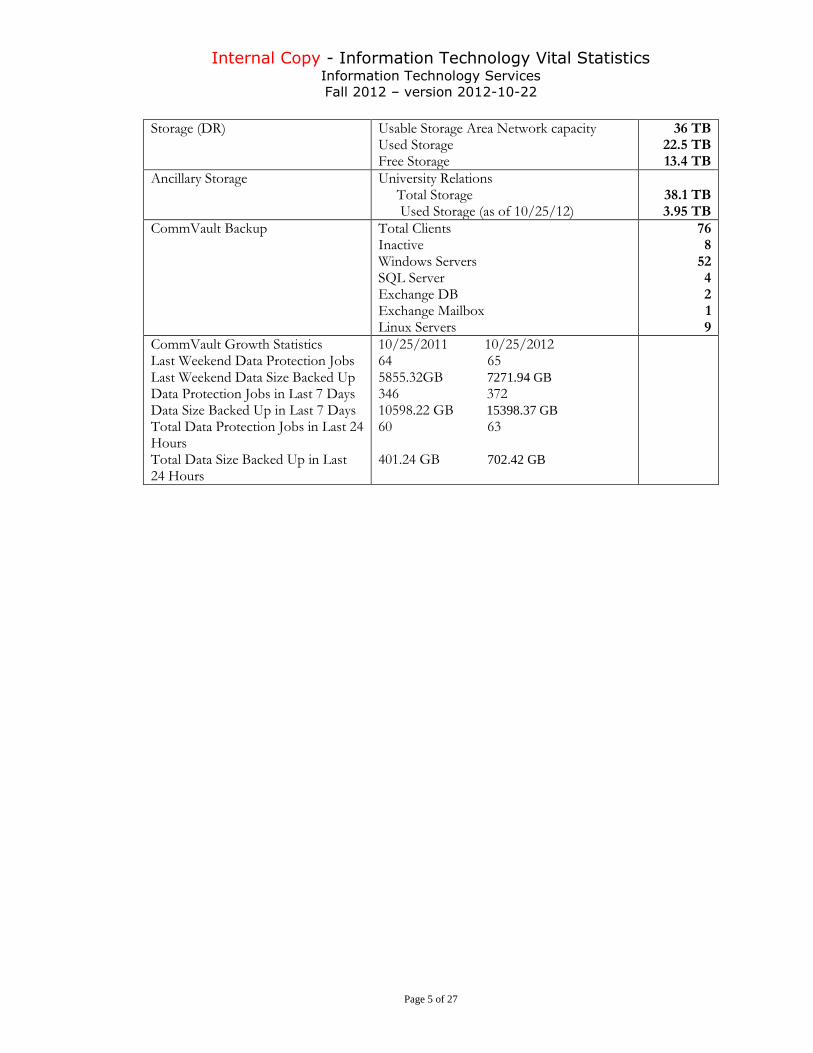
Storage (DR) Usable Storage Area Network capacity Used Storage Free Storage
36 TB 22.5 TB 13.4 TB
Ancillary Storage
University Relations Total Storage Used Storage (as of 10/25/12)
38.1 TB 3.95 TB
CommVault Backup
Total Clients Inactive Windows Servers SQL Server Exchange DB Exchange Mailbox Linux Servers
76 8
52 4 2 1 9
CommVault Growth Statistics Last Weekend Data Protection Jobs Last Weekend Data Size Backed Up Data Protection Jobs in Last 7 Days Data Size Backed Up in Last 7 Days Total Data Protection Jobs in Last 24 Hours Total Data Size Backed Up in Last 24 Hours
10/25/2011 10/25/2012 64 65 5855.32GB 7271.94 GB 346 372 10598.22 GB 15398.37 GB 60 63 401.24 GB 702.42 GB
Internal Copy - Information Technology Vital Statistics Information Technology Services
Fall 2012 – version 2012-10-22
Page 6 of 27
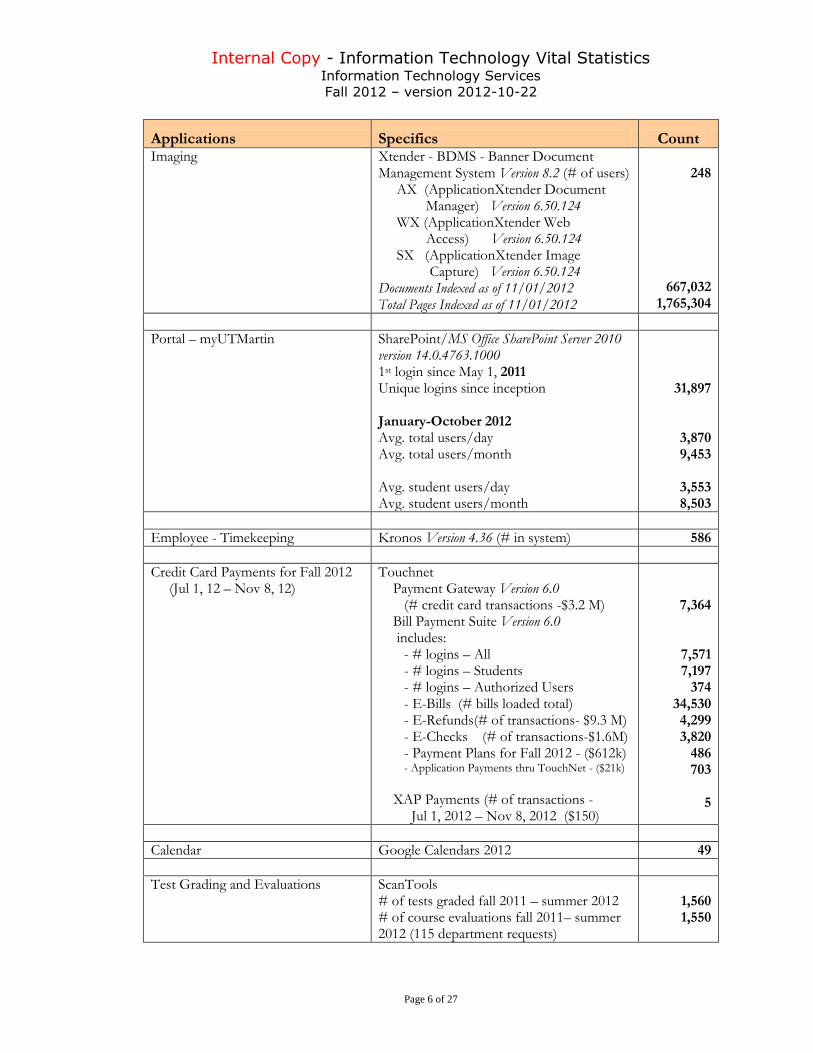
Applications Specifics Count Imaging Xtender - BDMS - Banner Document
Management System Version 8.2 (# of users) AX (ApplicationXtender Document Manager) Version 6.50.124 WX (ApplicationXtender Web Access) Version 6.50.124 SX (ApplicationXtender Image Capture) Version 6.50.124 Documents Indexed as of 11/01/2012 Total Pages Indexed as of 11/01/2012
248
667,032 1,765,304
Portal – myUTMartin SharePoint/MS Office SharePoint Server 2010 version 14.0.4763.1000 1st login since May 1, 2011 Unique logins since inception January-October 2012 Avg. total users/day Avg. total users/month Avg. student users/day Avg. student users/month
31,897
3,870 9,453
3,553 8,503
Employee - Timekeeping Kronos Version 4.36 (# in system) 586
Credit Card Payments for Fall 2012 (Jul 1, 12 – Nov 8, 12)
Touchnet Payment Gateway Version 6.0 (# credit card transactions -$3.2 M) Bill Payment Suite Version 6.0 includes: - # logins – All - # logins – Students - # logins – Authorized Users - E-Bills (# bills loaded total) - E-Refunds(# of transactions- $9.3 M) - E-Checks (# of transactions-$1.6M) - Payment Plans for Fall 2012 - ($612k) - Application Payments thru TouchNet - ($21k)
XAP Payments (# of transactions - Jul 1, 2012 – Nov 8, 2012 ($150)
7,364
7,571 7,197
374 34,530 4,299 3,820
486 703
5
Calendar Google Calendars 2012 49
Test Grading and Evaluations ScanTools # of tests graded fall 2011 – summer 2012 # of course evaluations fall 2011– summer 2012 (115 department requests)
1,560 1,550
Internal Copy - Information Technology Vital Statistics Information Technology Services
Fall 2012 – version 2012-10-22
Page 7 of 27
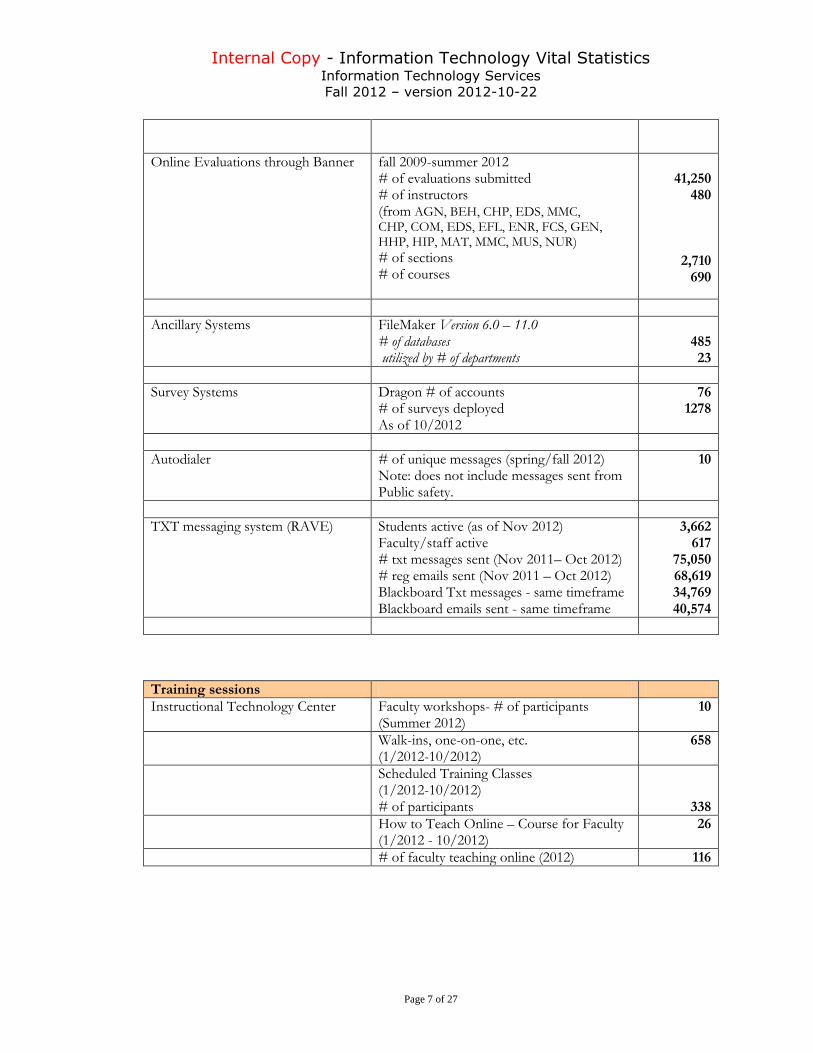
Online Evaluations through Banner fall 2009-summer 2012 # of evaluations submitted # of instructors (from AGN, BEH, CHP, EDS, MMC, CHP, COM, EDS, EFL, ENR, FCS, GEN, HHP, HIP, MAT, MMC, MUS, NUR)
# of sections # of courses
41,250
480
2,710
690
Ancillary Systems FileMaker Version 6.0 – 11.0 # of databases utilized by # of departments
485 23
Survey Systems Dragon # of accounts # of surveys deployed As of 10/2012
76 1278
Autodialer # of unique messages (spring/fall 2012) Note: does not include messages sent from Public safety.
10
TXT messaging system (RAVE) Students active (as of Nov 2012) Faculty/staff active # txt messages sent (Nov 2011– Oct 2012) # reg emails sent (Nov 2011 – Oct 2012) Blackboard Txt messages - same timeframe Blackboard emails sent - same timeframe
3,662 617
75,050 68,619 34,769 40,574
Training sessions
Instructional Technology Center Faculty workshops- # of participants (Summer 2012)
10
Walk-ins, one-on-one, etc. (1/2012-10/2012)
658
Scheduled Training Classes (1/2012-10/2012) # of participants
338
How to Teach Online – Course for Faculty (1/2012 - 10/2012)
26
# of faculty teaching online (2012) 116
Internal Copy - Information Technology Vital Statistics Information Technology Services
Fall 2012 – version 2012-10-22
Page 8 of 27
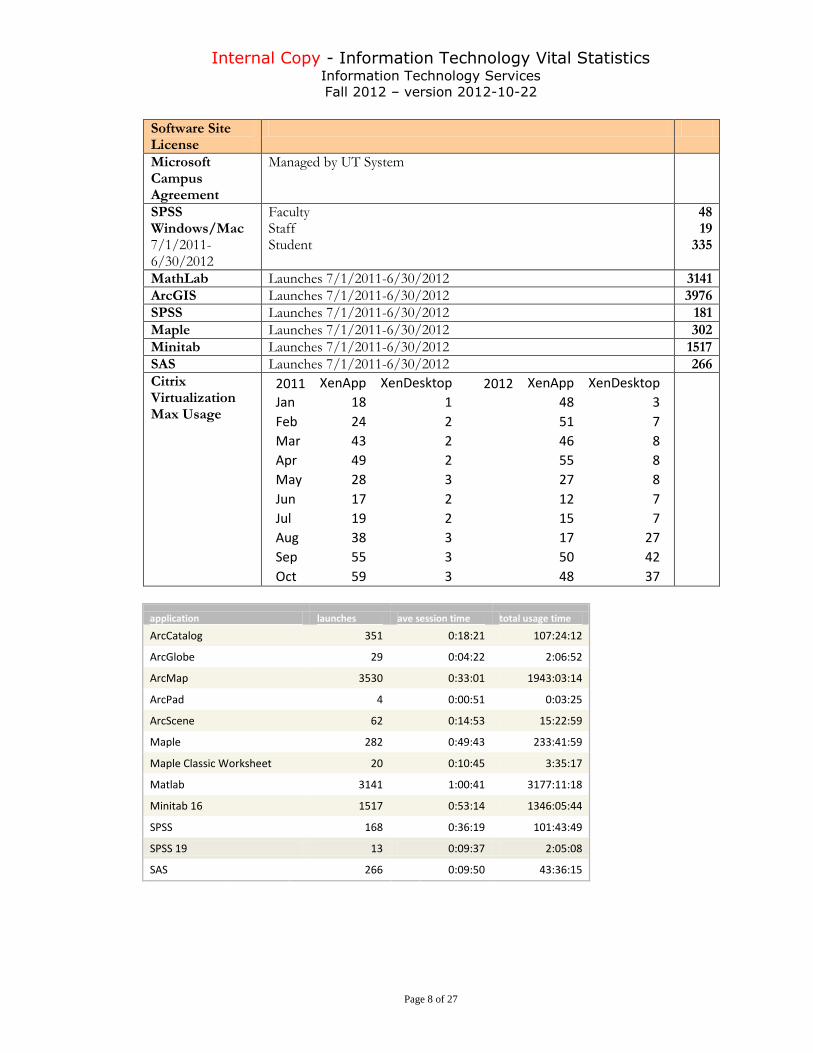
Software Site License
Microsoft Campus Agreement
Managed by UT System
SPSS Windows/Mac 7/1/2011-6/30/2012
Faculty Staff Student
48 19
335
MathLab Launches 7/1/2011-6/30/2012 3141
ArcGIS Launches 7/1/2011-6/30/2012 3976
SPSS Launches 7/1/2011-6/30/2012 181
Maple Launches 7/1/2011-6/30/2012 302
Minitab Launches 7/1/2011-6/30/2012 1517
SAS Launches 7/1/2011-6/30/2012 266
Citrix Virtualization Max Usage
2011 XenApp XenDesktop
2012 XenApp XenDesktop
Jan 18 1
48 3
Feb 24 2
51 7
Mar 43 2
46 8
Apr 49 2
55 8
May 28 3
27 8
Jun 17 2
12 7
Jul 19 2
15 7
Aug 38 3
17 27
Sep 55 3
50 42
Oct 59 3
48 37
application launches ave session time total usage time
ArcCatalog 351 0:18:21 107:24:12
ArcGlobe 29 0:04:22 2:06:52
ArcMap 3530 0:33:01 1943:03:14
ArcPad 4 0:00:51 0:03:25
ArcScene 62 0:14:53 15:22:59
Maple 282 0:49:43 233:41:59
Maple Classic Worksheet 20 0:10:45 3:35:17
Matlab 3141 1:00:41 3177:11:18
Minitab 16 1517 0:53:14 1346:05:44
SPSS 168 0:36:19 101:43:49
SPSS 19 13 0:09:37 2:05:08
SAS 266 0:09:50 43:36:15
Internal Copy - Information Technology Vital Statistics Information Technology Services
Fall 2012 – version 2012-10-22
Page 9 of 27
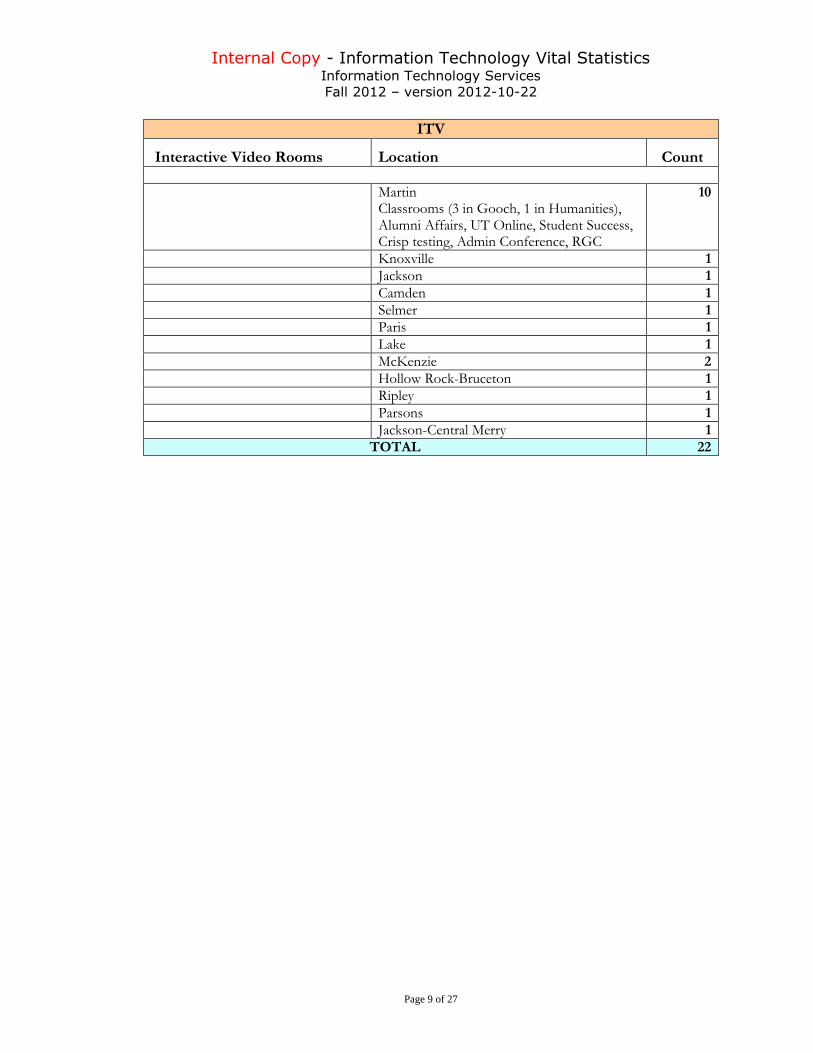
ITV
Interactive Video Rooms Location Count
Martin Classrooms (3 in Gooch, 1 in Humanities), Alumni Affairs, UT Online, Student Success, Crisp testing, Admin Conference, RGC
10
Knoxville 1
Jackson 1
Camden 1
Selmer 1
Paris 1
Lake 1
McKenzie 2
Hollow Rock-Bruceton 1
Ripley 1
Parsons 1
Jackson-Central Merry 1
TOTAL 22
Internal Copy - Information Technology Vital Statistics Information Technology Services
Fall 2012 – version 2012-10-22
Page 10 of 27
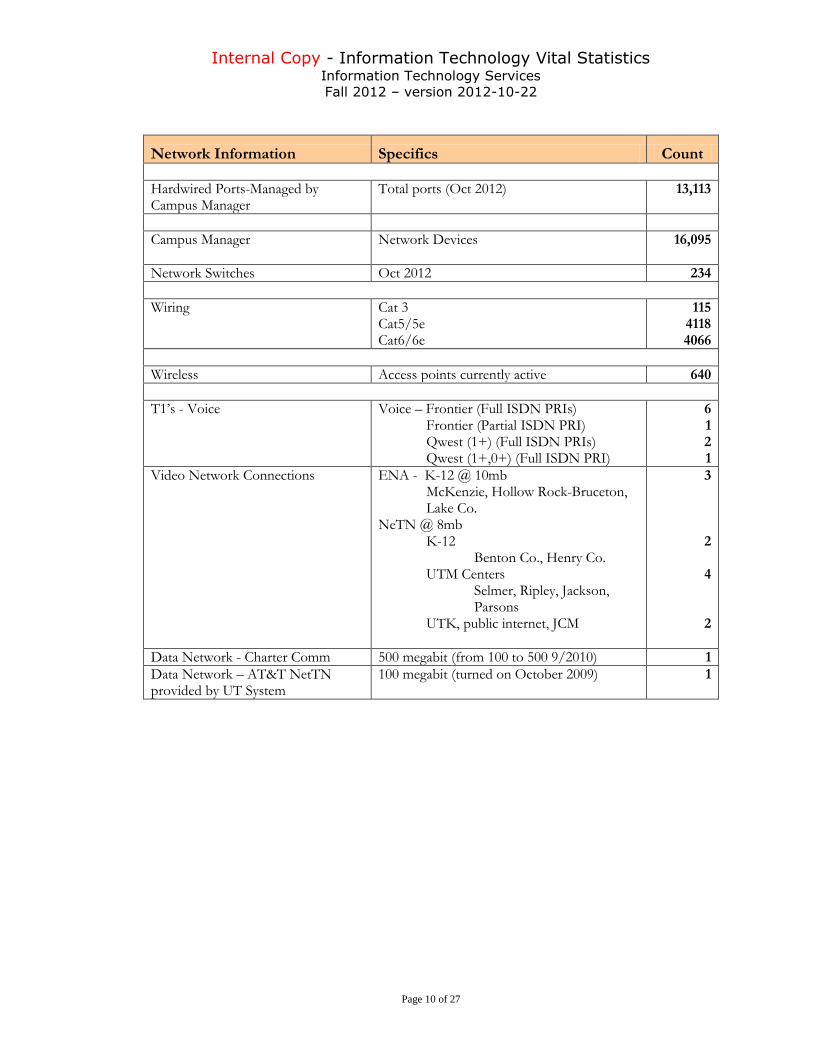
Network Information Specifics Count
Hardwired Ports-Managed by Campus Manager
Total ports (Oct 2012) 13,113
Campus Manager Network Devices
16,095
Network Switches Oct 2012 234
Wiring Cat 3 Cat5/5e Cat6/6e
115 4118 4066
Wireless Access points currently active 640
T1’s - Voice Voice – Frontier (Full ISDN PRIs) Frontier (Partial ISDN PRI) Qwest (1+) (Full ISDN PRIs) Qwest (1+,0+) (Full ISDN PRI)
6 1 2 1
Video Network Connections ENA - K-12 @ 10mb McKenzie, Hollow Rock-Bruceton, Lake Co.
NeTN @ 8mb K-12
Benton Co., Henry Co. UTM Centers
Selmer, Ripley, Jackson, Parsons
UTK, public internet, JCM
3
2
4
2
Data Network - Charter Comm 500 megabit (from 100 to 500 9/2010) 1
Data Network – AT&T NetTN provided by UT System
100 megabit (turned on October 2009) 1
Internal Copy - Information Technology Vital Statistics Information Technology Services
Fall 2012 – version 2012-10-22
Page 11 of 27
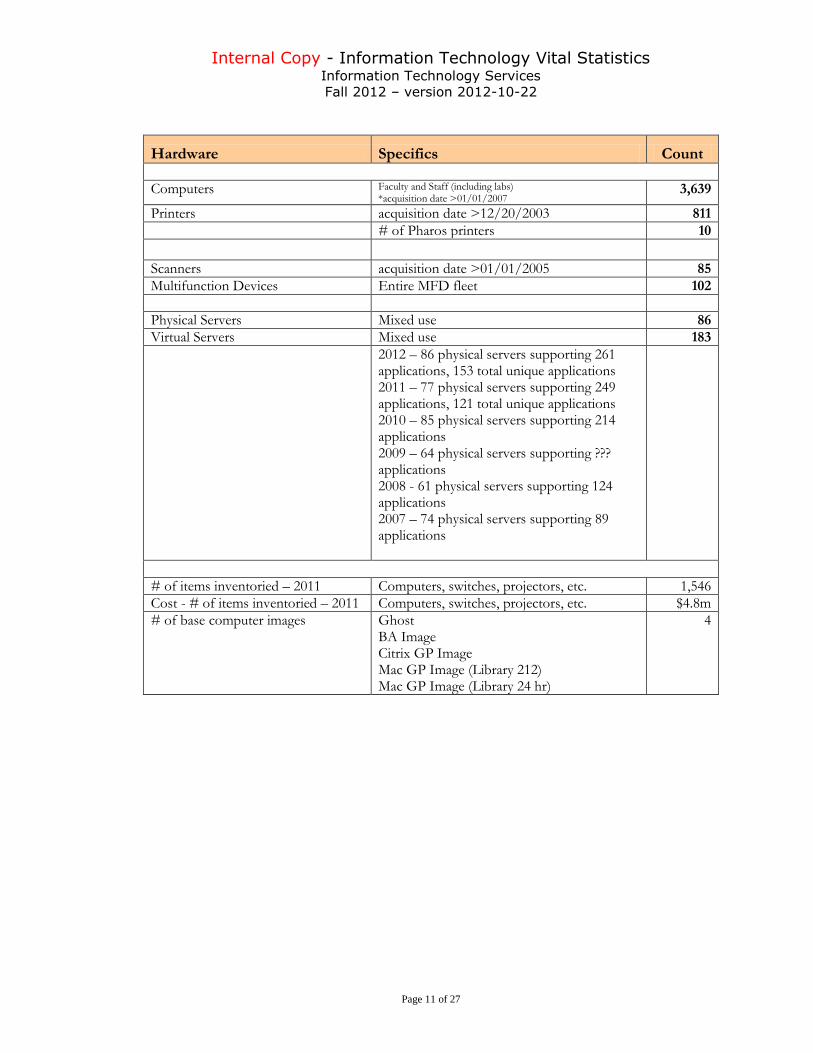
Hardware Specifics Count
Computers Faculty and Staff (including labs) *acquisition date >01/01/2007
3,639
Printers acquisition date >12/20/2003 811
# of Pharos printers 10
Scanners acquisition date >01/01/2005 85
Multifunction Devices Entire MFD fleet 102
Physical Servers Mixed use 86
Virtual Servers Mixed use 183
2012 – 86 physical servers supporting 261 applications, 153 total unique applications 2011 – 77 physical servers supporting 249 applications, 121 total unique applications 2010 – 85 physical servers supporting 214 applications 2009 – 64 physical servers supporting ??? applications 2008 - 61 physical servers supporting 124 applications 2007 – 74 physical servers supporting 89 applications
# of items inventoried – 2011 Computers, switches, projectors, etc. 1,546
Cost - # of items inventoried – 2011 Computers, switches, projectors, etc. $4.8m
# of base computer images Ghost BA Image Citrix GP Image Mac GP Image (Library 212) Mac GP Image (Library 24 hr)
4
Internal Copy - Information Technology Vital Statistics Information Technology Services
Fall 2012 – version 2012-10-22
Page 12 of 27
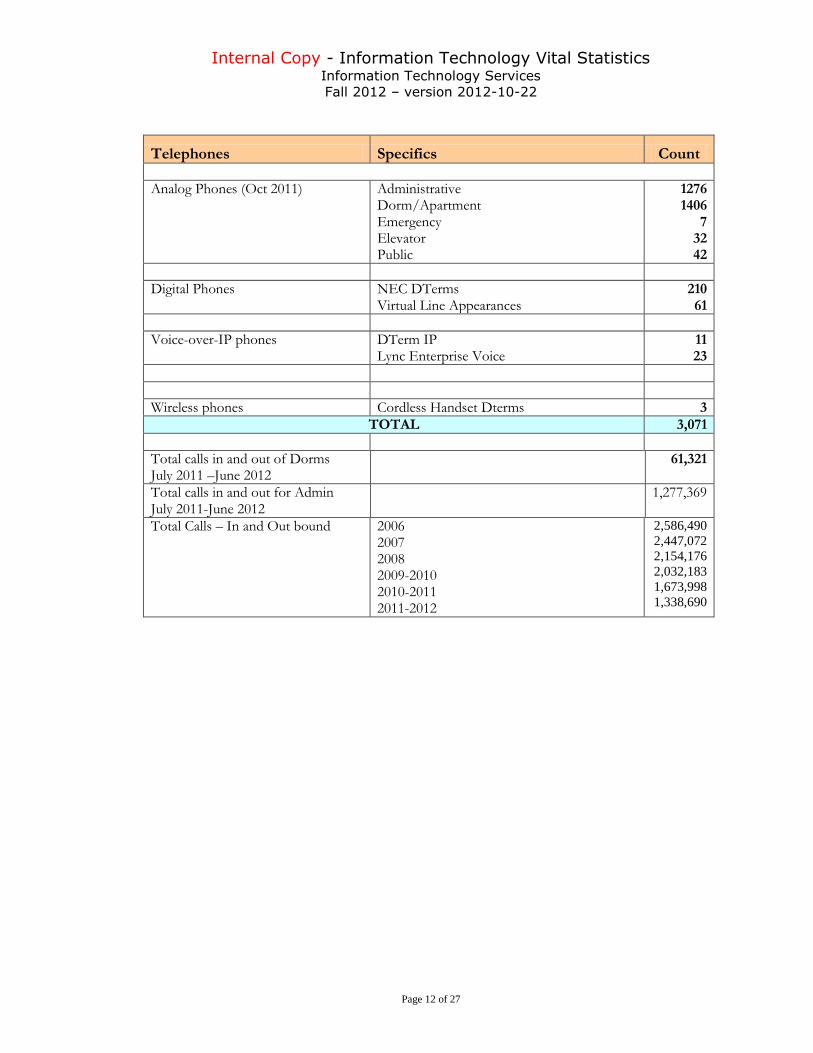
Telephones Specifics Count
Analog Phones (Oct 2011) Administrative Dorm/Apartment Emergency Elevator Public
1276 1406
7 32 42
Digital Phones NEC DTerms Virtual Line Appearances
210 61
Voice-over-IP phones DTerm IP Lync Enterprise Voice
11 23
Wireless phones Cordless Handset Dterms 3
TOTAL 3,071
Total calls in and out of Dorms July 2011 –June 2012
61,321
Total calls in and out for Admin July 2011-June 2012
1,277,369
Total Calls – In and Out bound 2006 2007 2008 2009-2010 2010-2011 2011-2012
2,586,490
2,447,072
2,154,176
2,032,183
1,673,998
1,338,690
Internal Copy - Information Technology Vital Statistics Information Technology Services
Fall 2012 – version 2012-10-22
Page 13 of 27
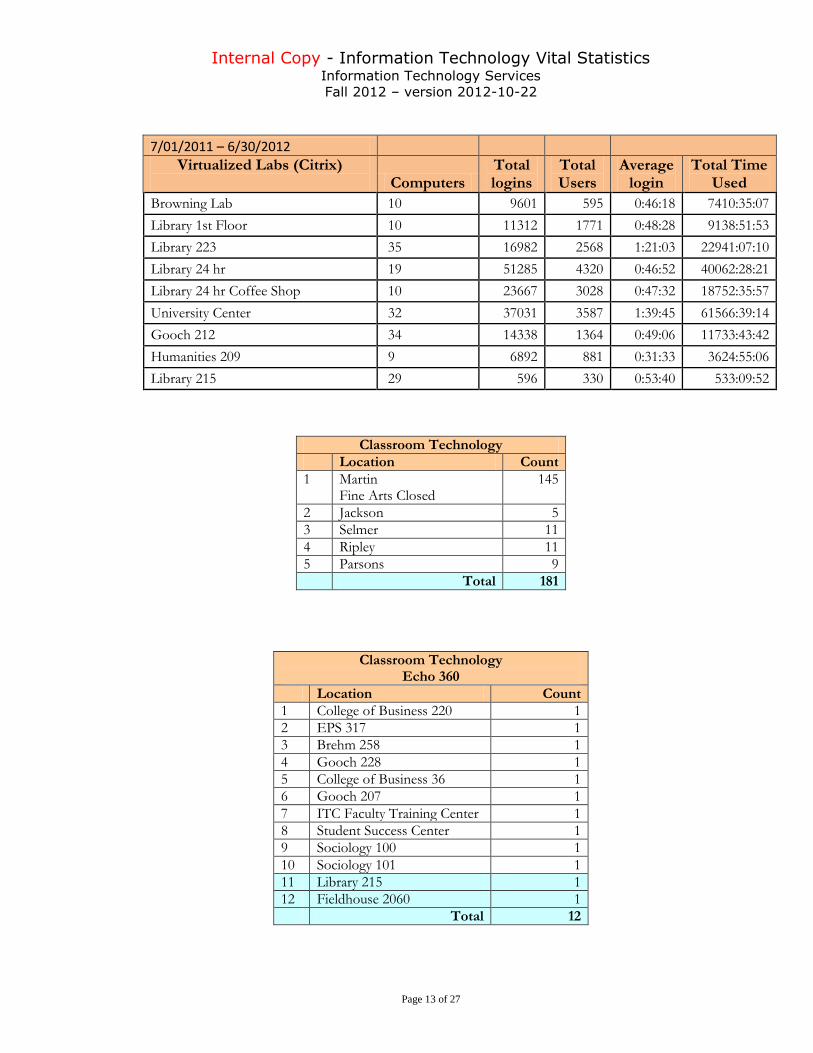
7/01/2011 – 6/30/2012 Virtualized Labs (Citrix)
Computers Total logins
Total Users
Average login
Total Time Used
Browning Lab 10 9601 595 0:46:18 7410:35:07
Library 1st Floor 10 11312 1771 0:48:28 9138:51:53
Library 223 35 16982 2568 1:21:03 22941:07:10
Library 24 hr 19 51285 4320 0:46:52 40062:28:21
Library 24 hr Coffee Shop 10 23667 3028 0:47:32 18752:35:57
University Center 32 37031 3587 1:39:45 61566:39:14
Gooch 212 34 14338 1364 0:49:06 11733:43:42
Humanities 209 9 6892 881 0:31:33 3624:55:06
Library 215 29 596 330 0:53:40 533:09:52
Classroom Technology
Location Count
1 Martin Fine Arts Closed
145
2 Jackson 5
3 Selmer 11
4 Ripley 11
5 Parsons 9
Total 181
Classroom Technology Echo 360
Location Count
1 College of Business 220 1
2 EPS 317 1
3 Brehm 258 1
4 Gooch 228 1
5 College of Business 36 1
6 Gooch 207 1
7 ITC Faculty Training Center 1
8 Student Success Center 1
9 Sociology 100 1
10 Sociology 101 1
11 Library 215 1
12 Fieldhouse 2060 1
Total 12
Internal Copy - Information Technology Vital Statistics Information Technology Services
Fall 2012 – version 2012-10-22
Page 14 of 27
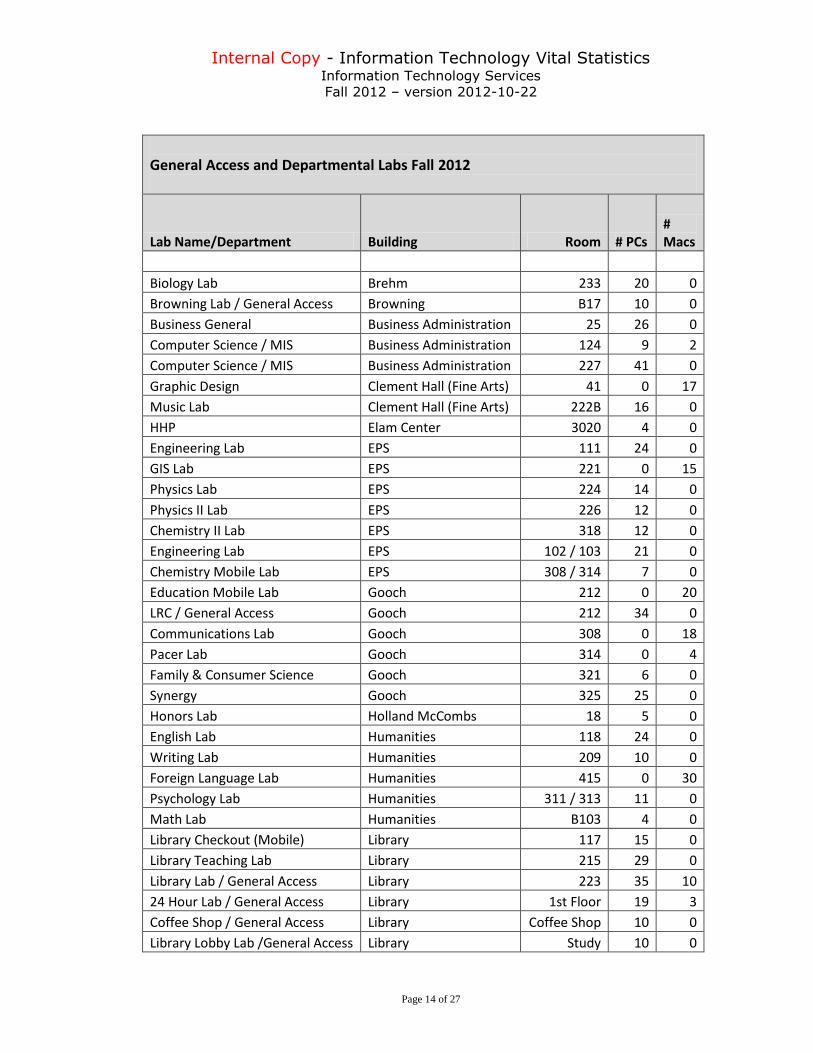
General Access and Departmental Labs Fall 2012
Lab Name/Department Building Room # PCs # Macs
Biology Lab Brehm 233 20 0
Browning Lab / General Access Browning B17 10 0
Business General Business Administration 25 26 0
Computer Science / MIS Business Administration 124 9 2
Computer Science / MIS Business Administration 227 41 0
Graphic Design Clement Hall (Fine Arts) 41 0 17
Music Lab Clement Hall (Fine Arts) 222B 16 0
HHP Elam Center 3020 4 0
Engineering Lab EPS 111 24 0
GIS Lab EPS 221 0 15
Physics Lab EPS 224 14 0
Physics II Lab EPS 226 12 0
Chemistry II Lab EPS 318 12 0
Engineering Lab EPS 102 / 103 21 0
Chemistry Mobile Lab EPS 308 / 314 7 0
Education Mobile Lab Gooch 212 0 20
LRC / General Access Gooch 212 34 0
Communications Lab Gooch 308 0 18
Pacer Lab Gooch 314 0 4
Family & Consumer Science Gooch 321 6 0
Synergy Gooch 325 25 0
Honors Lab Holland McCombs 18 5 0
English Lab Humanities 118 24 0
Writing Lab Humanities 209 10 0
Foreign Language Lab Humanities 415 0 30
Psychology Lab Humanities 311 / 313 11 0
Math Lab Humanities B103 4 0
Library Checkout (Mobile) Library 117 15 0
Library Teaching Lab Library 215 29 0
Library Lab / General Access Library 223 35 10
24 Hour Lab / General Access Library 1st Floor 19 3
Coffee Shop / General Access Library Coffee Shop 10 0
Library Lobby Lab /General Access Library Study 10 0
Internal Copy - Information Technology Vital Statistics Information Technology Services
Fall 2012 – version 2012-10-22
Page 15 of 27
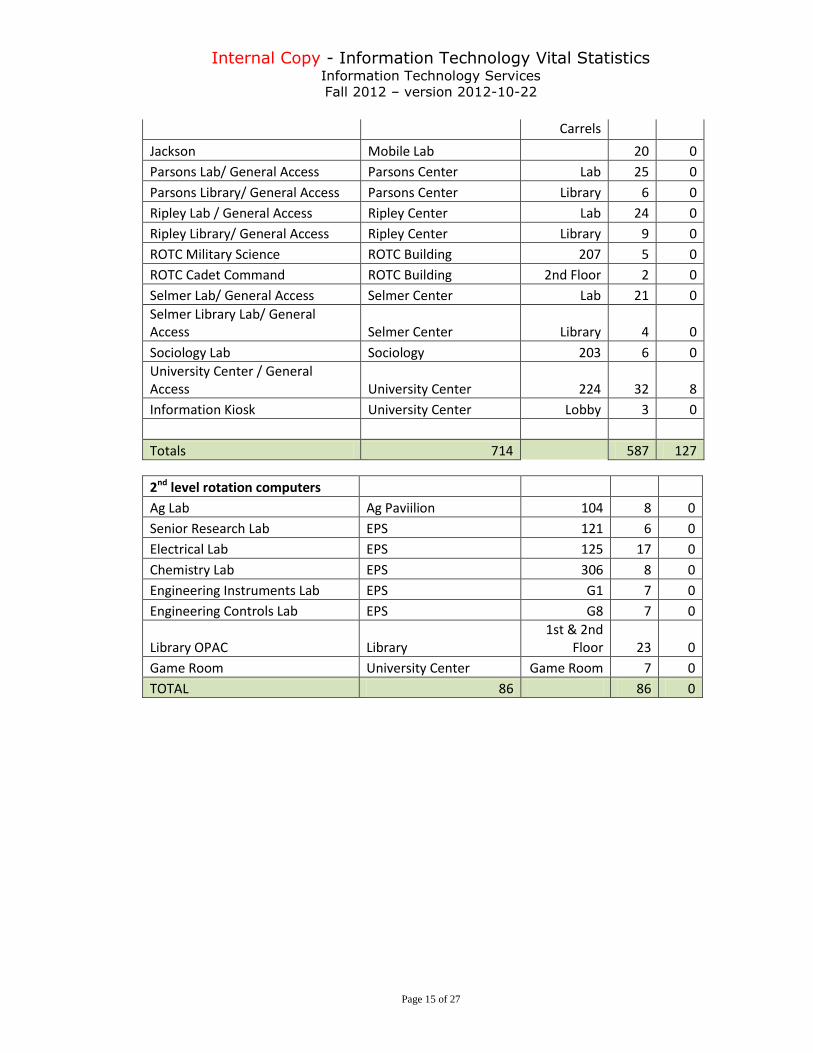
Carrels
Jackson Mobile Lab 20 0
Parsons Lab/ General Access Parsons Center Lab 25 0
Parsons Library/ General Access Parsons Center Library 6 0
Ripley Lab / General Access Ripley Center Lab 24 0
Ripley Library/ General Access Ripley Center Library 9 0
ROTC Military Science ROTC Building 207 5 0
ROTC Cadet Command ROTC Building 2nd Floor 2 0
Selmer Lab/ General Access Selmer Center Lab 21 0
Selmer Library Lab/ General Access Selmer Center Library 4 0
Sociology Lab Sociology 203 6 0
University Center / General Access University Center 224 32 8
Information Kiosk University Center Lobby 3 0
Totals 714
587 127
2nd level rotation computers
Ag Lab Ag Paviilion 104 8 0
Senior Research Lab EPS 121 6 0
Electrical Lab EPS 125 17 0
Chemistry Lab EPS 306 8 0
Engineering Instruments Lab EPS G1 7 0
Engineering Controls Lab EPS G8 7 0
Library OPAC Library 1st & 2nd
Floor 23 0
Game Room University Center Game Room 7 0
TOTAL 86 86 0
Internal Copy - Information Technology Vital Statistics Information Technology Services
Fall 2012 – version 2012-10-22
Page 16 of 27
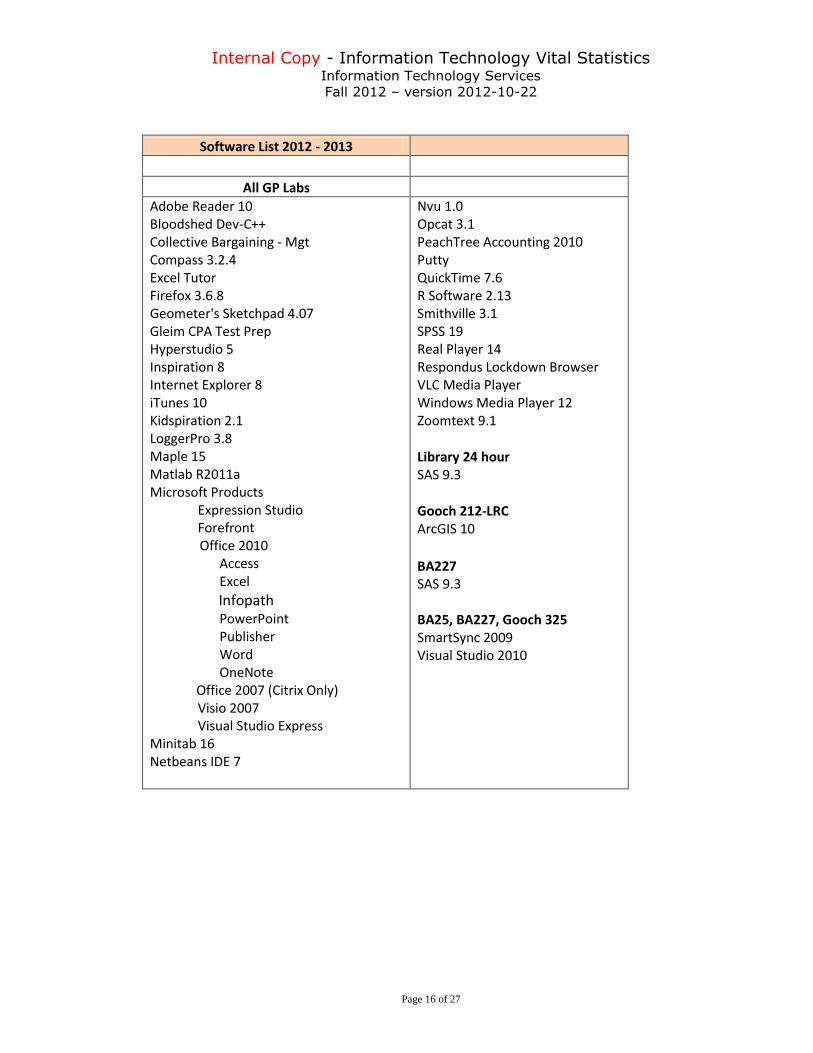
Software List 2012 - 2013
All GP Labs Adobe Reader 10
Bloodshed Dev-C++ Collective Bargaining - Mgt Compass 3.2.4 Excel Tutor Firefox 3.6.8 Geometer's Sketchpad 4.07 Gleim CPA Test Prep Hyperstudio 5 Inspiration 8 Internet Explorer 8 iTunes 10 Kidspiration 2.1 LoggerPro 3.8 Maple 15 Matlab R2011a Microsoft Products
Expression Studio Forefront
Office 2010 Access Excel
Infopath PowerPoint Publisher Word OneNote Office 2007 (Citrix Only)
Visio 2007 Visual Studio Express
Minitab 16 Netbeans IDE 7
Nvu 1.0 Opcat 3.1 PeachTree Accounting 2010 Putty QuickTime 7.6 R Software 2.13 Smithville 3.1 SPSS 19 Real Player 14 Respondus Lockdown Browser VLC Media Player Windows Media Player 12 Zoomtext 9.1 Library 24 hour SAS 9.3
Gooch 212-LRC ArcGIS 10 BA227 SAS 9.3 BA25, BA227, Gooch 325 SmartSync 2009 Visual Studio 2010
Internal Copy - Information Technology Vital Statistics Information Technology Services
Fall 2012 – version 2012-10-22
Page 17 of 27
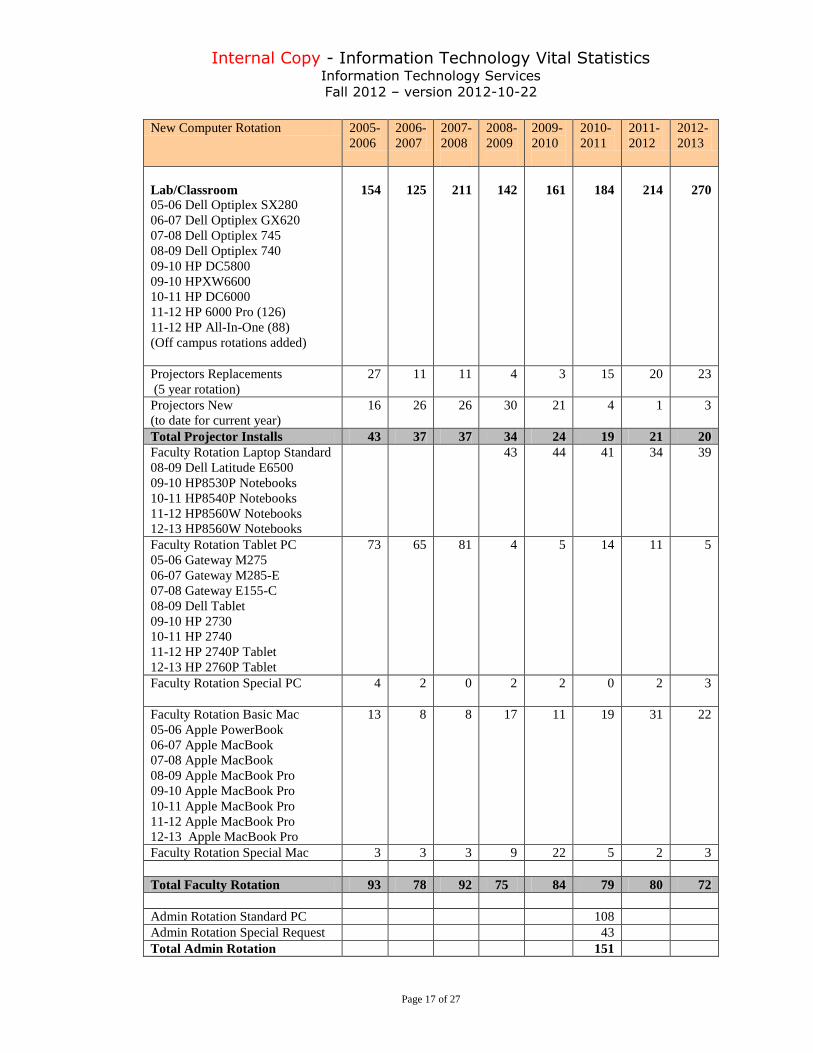
New Computer Rotation 2005-
2006
2006-
2007
2007-
2008
2008-
2009
2009-
2010
2010-
2011
2011-
2012
2012-
2013
Lab/Classroom
05-06 Dell Optiplex SX280
06-07 Dell Optiplex GX620
07-08 Dell Optiplex 745
08-09 Dell Optiplex 740
09-10 HP DC5800
09-10 HPXW6600
10-11 HP DC6000
11-12 HP 6000 Pro (126)
11-12 HP All-In-One (88)
(Off campus rotations added)
154
125
211
142
161
184
214
270
Projectors Replacements
(5 year rotation)
27 11 11 4 3 15 20 23
Projectors New
(to date for current year)
16 26 26 30 21 4 1 3
Total Projector Installs 43 37 37 34 24 19 21 20
Faculty Rotation Laptop Standard
08-09 Dell Latitude E6500
09-10 HP8530P Notebooks
10-11 HP8540P Notebooks
11-12 HP8560W Notebooks
12-13 HP8560W Notebooks
43
44 41 34 39
Faculty Rotation Tablet PC
05-06 Gateway M275
06-07 Gateway M285-E
07-08 Gateway E155-C
08-09 Dell Tablet
09-10 HP 2730
10-11 HP 2740
11-12 HP 2740P Tablet
12-13 HP 2760P Tablet
73 65 81 4 5 14 11 5
Faculty Rotation Special PC 4 2 0
2
2 0 2 3
Faculty Rotation Basic Mac
05-06 Apple PowerBook
06-07 Apple MacBook
07-08 Apple MacBook
08-09 Apple MacBook Pro
09-10 Apple MacBook Pro
10-11 Apple MacBook Pro
11-12 Apple MacBook Pro
12-13 Apple MacBook Pro
13 8 8 17 11 19 31 22
Faculty Rotation Special Mac 3 3 3 9 22 5 2 3
Total Faculty Rotation 93 78 92 75 84 79 80 72
Admin Rotation Standard PC 108
Admin Rotation Special Request 43
Total Admin Rotation 151
Internal Copy - Information Technology Vital Statistics Information Technology Services
Fall 2012 – version 2012-10-22
Page 18 of 27
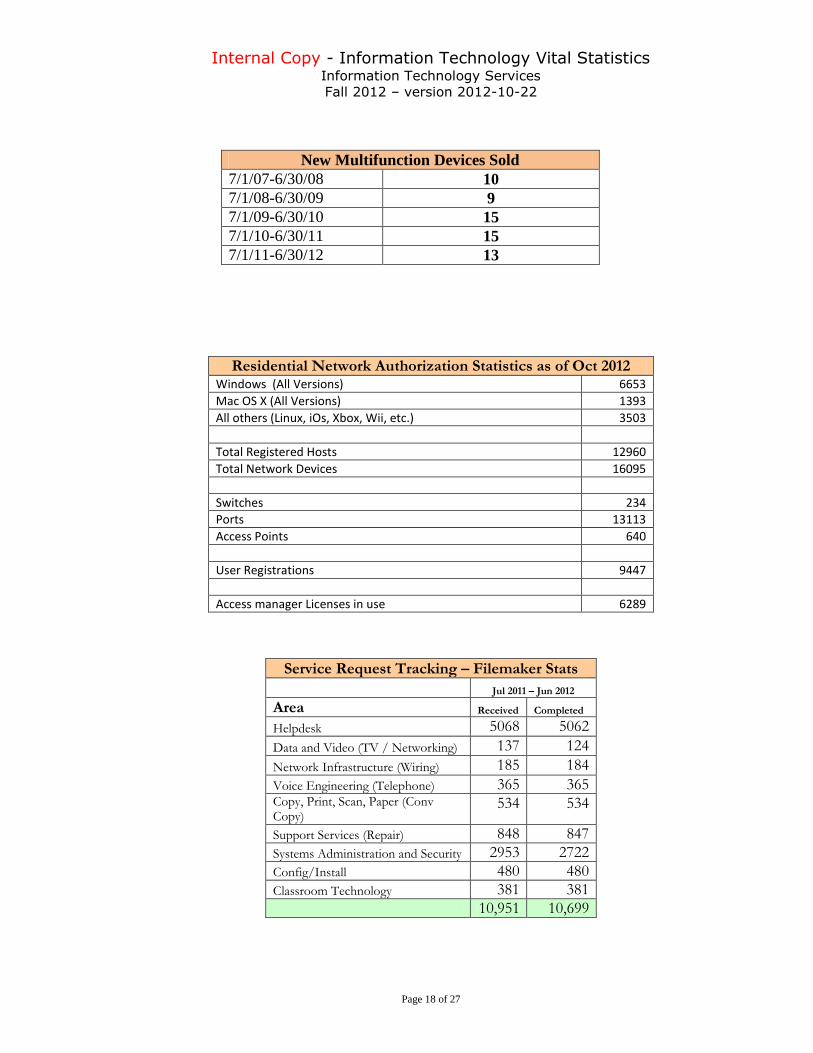
New Multifunction Devices Sold
7/1/07-6/30/08 10
7/1/08-6/30/09 9
7/1/09-6/30/10 15
7/1/10-6/30/11 15
7/1/11-6/30/12 13
Residential Network Authorization Statistics as of Oct 2012 Windows (All Versions) 6653
Mac OS X (All Versions) 1393
All others (Linux, iOs, Xbox, Wii, etc.) 3503
Total Registered Hosts 12960
Total Network Devices 16095
Switches 234
Ports 13113
Access Points 640
User Registrations 9447
Access manager Licenses in use 6289
Service Request Tracking – Filemaker Stats
Jul 2011 – Jun 2012
Area Received Completed
Helpdesk 5068 5062
Data and Video (TV / Networking) 137 124
Network Infrastructure (Wiring) 185 184
Voice Engineering (Telephone) 365 365 Copy, Print, Scan, Paper (Conv Copy)
534 534
Support Services (Repair) 848 847
Systems Administration and Security 2953 2722
Config/Install 480 480
Classroom Technology 381 381
10,951 10,699
Internal Copy - Information Technology Vital Statistics Information Technology Services
Fall 2012 – version 2012-10-22
Page 19 of 27
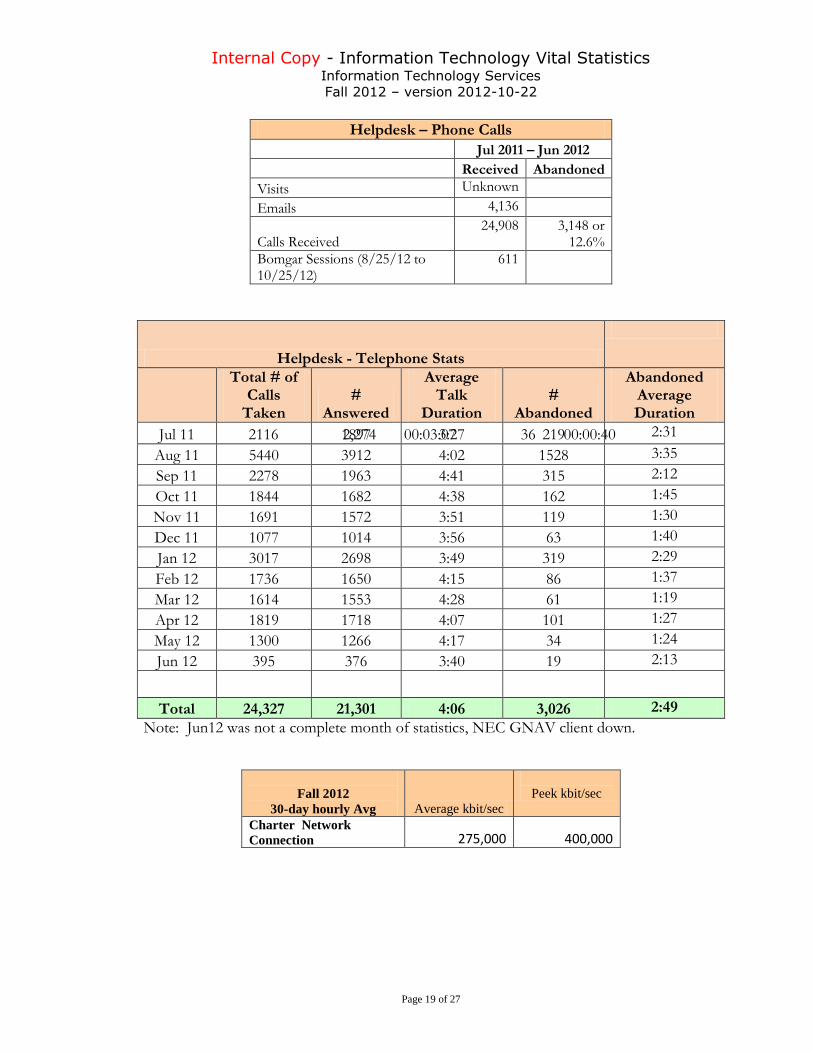
Helpdesk – Phone Calls
Jul 2011 – Jun 2012
Received Abandoned
Visits Unknown
Emails 4,136
Calls Received 24,908 3,148 or
12.6%
Bomgar Sessions (8/25/12 to 10/25/12)
611
Helpdesk - Telephone Stats
Total # of Calls
Taken #
Answered
Average Talk
Duration #
Abandoned
Abandoned Average Duration
Jul 11 2116 2,274 00:03:07 36 00:00:40
1897 3:27 219 2:31
Aug 11 5440 3912 4:02 1528 3:35
Sep 11 2278 1963 4:41 315 2:12
Oct 11 1844 1682 4:38 162 1:45
Nov 11 1691 1572 3:51 119 1:30
Dec 11 1077 1014 3:56 63 1:40
Jan 12 3017 2698 3:49 319 2:29
Feb 12 1736 1650 4:15 86 1:37
Mar 12 1614 1553 4:28 61 1:19
Apr 12 1819 1718 4:07 101 1:27
May 12 1300 1266 4:17 34 1:24
Jun 12 395 376 3:40 19 2:13
Total 24,327 21,301 4:06 3,026 2:49
Note: Jun12 was not a complete month of statistics, NEC GNAV client down.
Fall 2012
30-day hourly Avg Average kbit/sec
Peek kbit/sec
Charter Network
Connection 275,000 400,000
Internal Copy - Information Technology Vital Statistics Information Technology Services
Fall 2012 – version 2012-10-22
Page 20 of 27
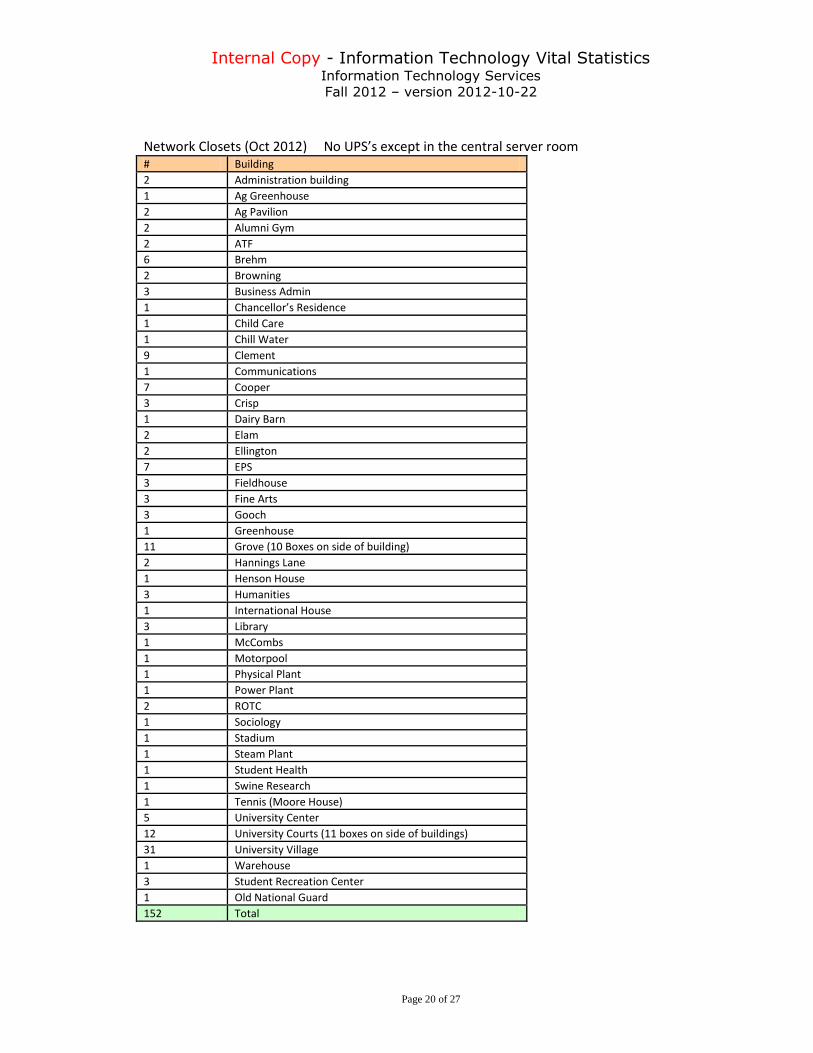
Network Closets (Oct 2012) No UPS’s except in the central server room # Building
2 Administration building
1 Ag Greenhouse
2 Ag Pavilion
2 Alumni Gym
2 ATF
6 Brehm
2 Browning
3 Business Admin
1 Chancellor’s Residence
1 Child Care
1 Chill Water
9 Clement
1 Communications
7 Cooper
3 Crisp
1 Dairy Barn
2 Elam
2 Ellington
7 EPS
3 Fieldhouse
3 Fine Arts
3 Gooch
1 Greenhouse
11 Grove (10 Boxes on side of building)
2 Hannings Lane
1 Henson House
3 Humanities
1 International House
3 Library
1 McCombs
1 Motorpool
1 Physical Plant
1 Power Plant
2 ROTC
1 Sociology
1 Stadium
1 Steam Plant
1 Student Health
1 Swine Research
1 Tennis (Moore House)
5 University Center
12 University Courts (11 boxes on side of buildings)
31 University Village
1 Warehouse
3 Student Recreation Center
1 Old National Guard
152 Total
Internal Copy - Information Technology Vital Statistics Information Technology Services
Fall 2012 – version 2012-10-22
Page 21 of 27
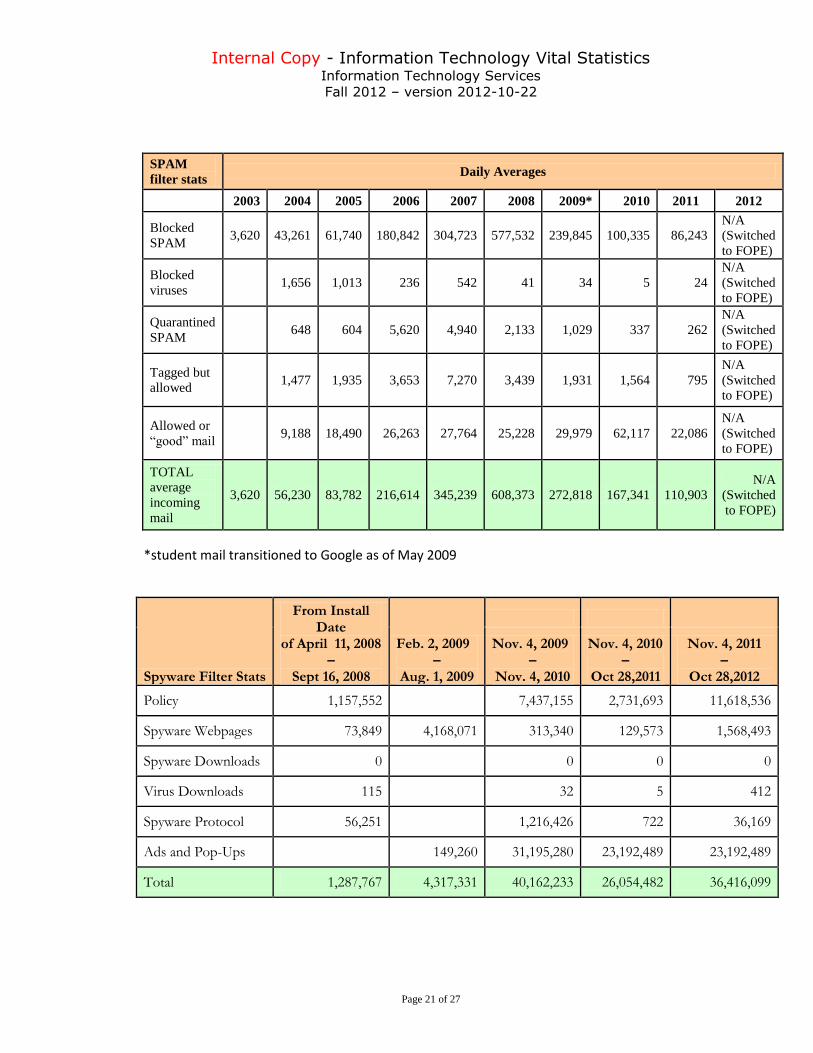
SPAM
filter stats Daily Averages
2003 2004 2005 2006 2007 2008 2009* 2010 2011 2012
Blocked
SPAM 3,620 43,261 61,740 180,842 304,723 577,532 239,845 100,335 86,243
N/A
(Switched
to FOPE)
Blocked
viruses 1,656 1,013 236 542 41 34 5 24
N/A
(Switched
to FOPE)
Quarantined
SPAM 648 604 5,620 4,940 2,133 1,029 337 262
N/A
(Switched
to FOPE)
Tagged but
allowed 1,477 1,935 3,653 7,270 3,439 1,931 1,564 795
N/A
(Switched
to FOPE)
Allowed or
“good” mail 9,188 18,490 26,263 27,764 25,228 29,979 62,117 22,086
N/A
(Switched
to FOPE)
TOTAL
average
incoming
3,620 56,230 83,782 216,614 345,239 608,373 272,818 167,341 110,903
N/A
(Switched
to FOPE)
*student mail transitioned to Google as of May 2009
Spyware Filter Stats
From Install Date
of April 11, 2008 –
Sept 16, 2008
Feb. 2, 2009 –
Aug. 1, 2009
Nov. 4, 2009 –
Nov. 4, 2010
Nov. 4, 2010 –
Oct 28,2011
Nov. 4, 2011 –
Oct 28,2012
Policy 1,157,552 7,437,155 2,731,693 11,618,536
Spyware Webpages 73,849 4,168,071 313,340 129,573 1,568,493
Spyware Downloads 0 0 0 0
Virus Downloads 115 32 5 412
Spyware Protocol 56,251 1,216,426 722 36,169
Ads and Pop-Ups
149,260 31,195,280 23,192,489 23,192,489
Total 1,287,767 4,317,331 40,162,233 26,054,482 36,416,099
Internal Copy - Information Technology Vital Statistics Information Technology Services
Fall 2012 – version 2012-10-22
Page 22 of 27
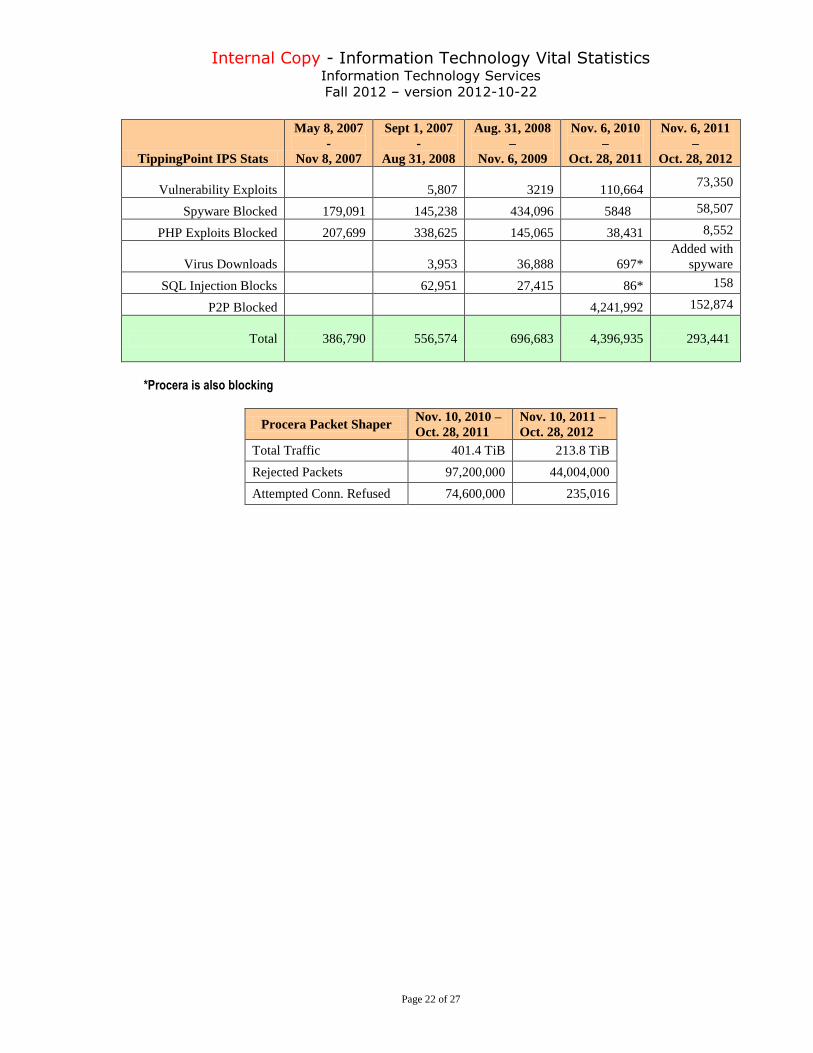
TippingPoint IPS Stats
May 8, 2007
-
Nov 8, 2007
Sept 1, 2007
-
Aug 31, 2008
Aug. 31, 2008
–
Nov. 6, 2009
Nov. 6, 2010
–
Oct. 28, 2011
Nov. 6, 2011
–
Oct. 28, 2012
Vulnerability Exploits 5,807 3219
110,664 73,350
Spyware Blocked 179,091 145,238 434,096 5848 58,507
PHP Exploits Blocked 207,699 338,625 145,065 38,431 8,552
Virus Downloads 3,953 36,888 697*
Added with
spyware
SQL Injection Blocks 62,951 27,415 86* 158
P2P Blocked 4,241,992 152,874
Total 386,790 556,574 696,683
4,396,935
293,441
*Procera is also blocking
Procera Packet Shaper Nov. 10, 2010 –
Oct. 28, 2011
Nov. 10, 2011 –
Oct. 28, 2012
Total Traffic 401.4 TiB 213.8 TiB
Rejected Packets 97,200,000 44,004,000
Attempted Conn. Refused 74,600,000 235,016
Internal Copy - Information Technology Vital Statistics Information Technology Services
Fall 2012 – version 2012-10-22
Page 23 of 27
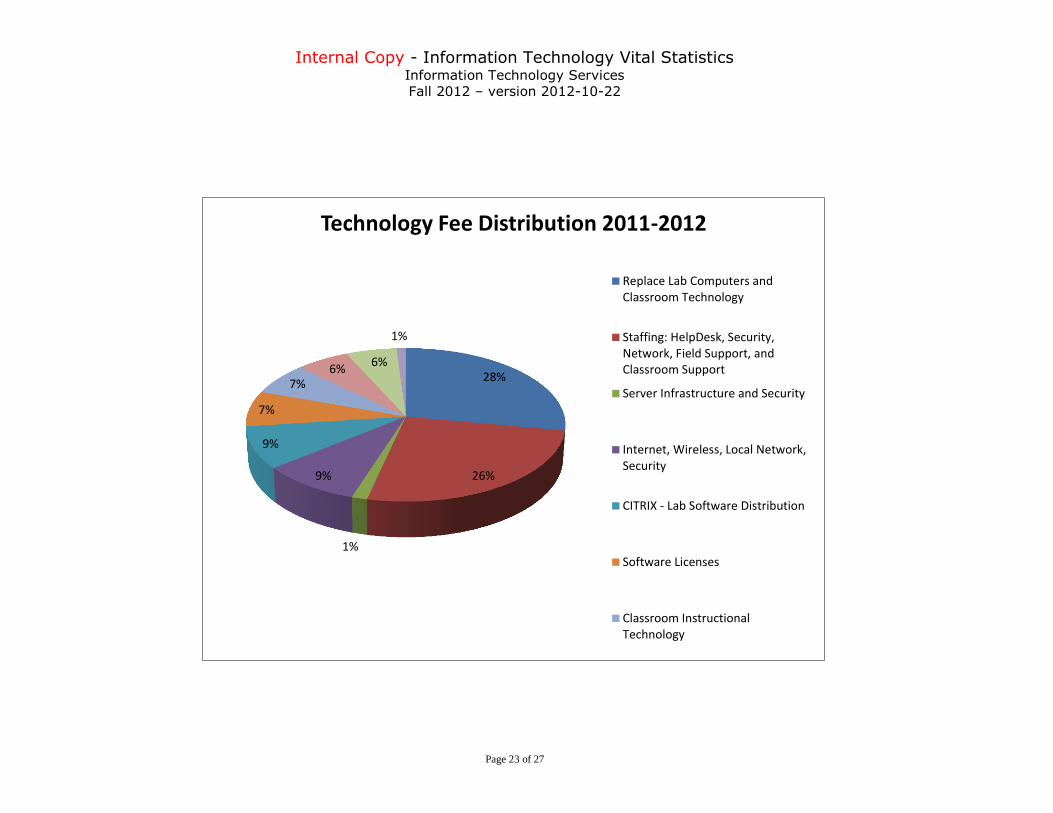
28%
26%
1%
9%
9%
7%
7% 6%
6%
1%
Technology Fee Distribution 2011-2012
Replace Lab Computers andClassroom Technology
Staffing: HelpDesk, Security,Network, Field Support, andClassroom Support
Server Infrastructure and Security
Internet, Wireless, Local Network,Security
CITRIX - Lab Software Distribution
Software Licenses
Classroom InstructionalTechnology
Internal Copy - Information Technology Vital Statistics Information Technology Services
Fall 2012 – version 2012-10-22
Page 24 of 27
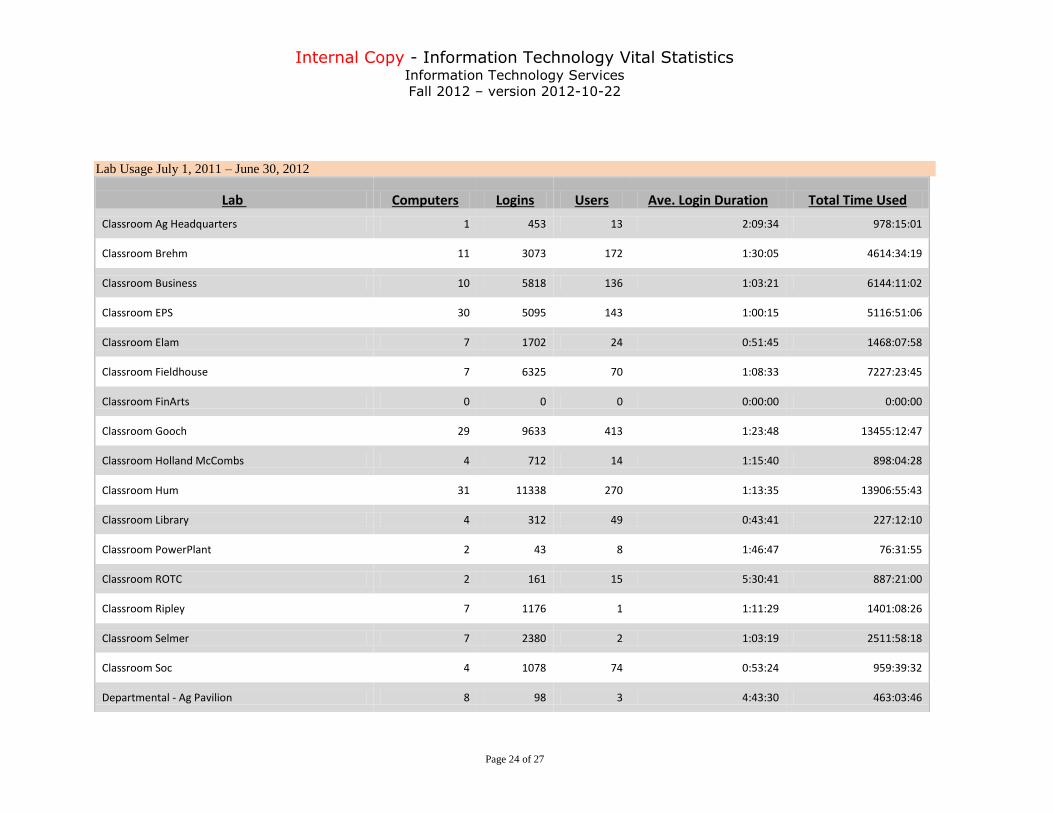
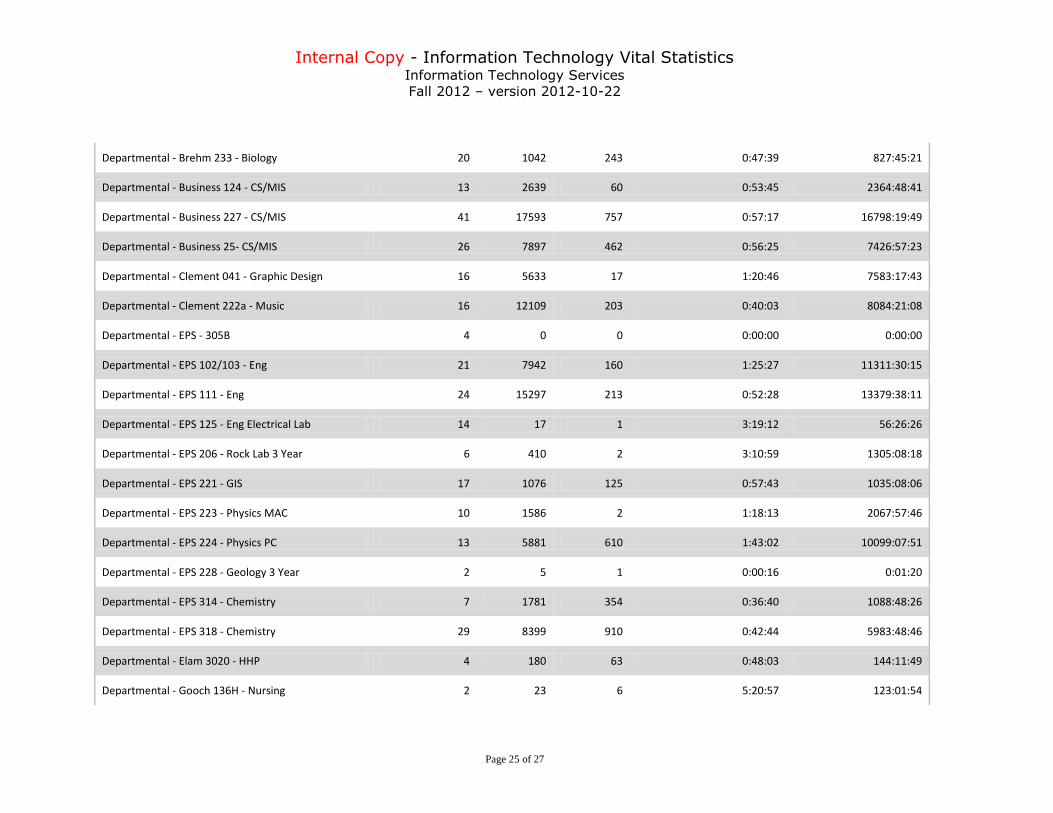
Lab Usage July 1, 2011 – June 30, 2012
Lab Computers Logins Users Ave. Login Duration Total Time Used
Classroom Ag Headquarters 1 453 13 2:09:34 978:15:01
Classroom Brehm 11 3073 172 1:30:05 4614:34:19
Classroom Business 10 5818 136 1:03:21 6144:11:02
Classroom EPS 30 5095 143 1:00:15 5116:51:06
Classroom Elam 7 1702 24 0:51:45 1468:07:58
Classroom Fieldhouse 7 6325 70 1:08:33 7227:23:45
Classroom FinArts 0 0 0 0:00:00 0:00:00
Classroom Gooch 29 9633 413 1:23:48 13455:12:47
Classroom Holland McCombs 4 712 14 1:15:40 898:04:28
Classroom Hum 31 11338 270 1:13:35 13906:55:43
Classroom Library 4 312 49 0:43:41 227:12:10
Classroom PowerPlant 2 43 8 1:46:47 76:31:55
Classroom ROTC 2 161 15 5:30:41 887:21:00
Classroom Ripley 7 1176 1 1:11:29 1401:08:26
Classroom Selmer 7 2380 2 1:03:19 2511:58:18
Classroom Soc 4 1078 74 0:53:24 959:39:32
Departmental - Ag Pavilion 8 98 3 4:43:30 463:03:46
Internal Copy - Information Technology Vital Statistics Information Technology Services
Fall 2012 – version 2012-10-22
Page 25 of 27
Departmental - Brehm 233 - Biology 20 1042 243 0:47:39 827:45:21
Departmental - Business 124 - CS/MIS 13 2639 60 0:53:45 2364:48:41
Departmental - Business 227 - CS/MIS 41 17593 757 0:57:17 16798:19:49
Departmental - Business 25- CS/MIS 26 7897 462 0:56:25 7426:57:23
Departmental - Clement 041 - Graphic Design 16 5633 17 1:20:46 7583:17:43
Departmental - Clement 222a - Music 16 12109 203 0:40:03 8084:21:08
Departmental - EPS - 305B 4 0 0 0:00:00 0:00:00
Departmental - EPS 102/103 - Eng 21 7942 160 1:25:27 11311:30:15
Departmental - EPS 111 - Eng 24 15297 213 0:52:28 13379:38:11
Departmental - EPS 125 - Eng Electrical Lab 14 17 1 3:19:12 56:26:26
Departmental - EPS 206 - Rock Lab 3 Year 6 410 2 3:10:59 1305:08:18
Departmental - EPS 221 - GIS 17 1076 125 0:57:43 1035:08:06
Departmental - EPS 223 - Physics MAC 10 1586 2 1:18:13 2067:57:46
Departmental - EPS 224 - Physics PC 13 5881 610 1:43:02 10099:07:51
Departmental - EPS 228 - Geology 3 Year 2 5 1 0:00:16 0:01:20
Departmental - EPS 314 - Chemistry 7 1781 354 0:36:40 1088:48:26
Departmental - EPS 318 - Chemistry 29 8399 910 0:42:44 5983:48:46
Departmental - Elam 3020 - HHP 4 180 63 0:48:03 144:11:49
Departmental - Gooch 136H - Nursing 2 23 6 5:20:57 123:01:54
Internal Copy - Information Technology Vital Statistics Information Technology Services
Fall 2012 – version 2012-10-22
Page 26 of 27
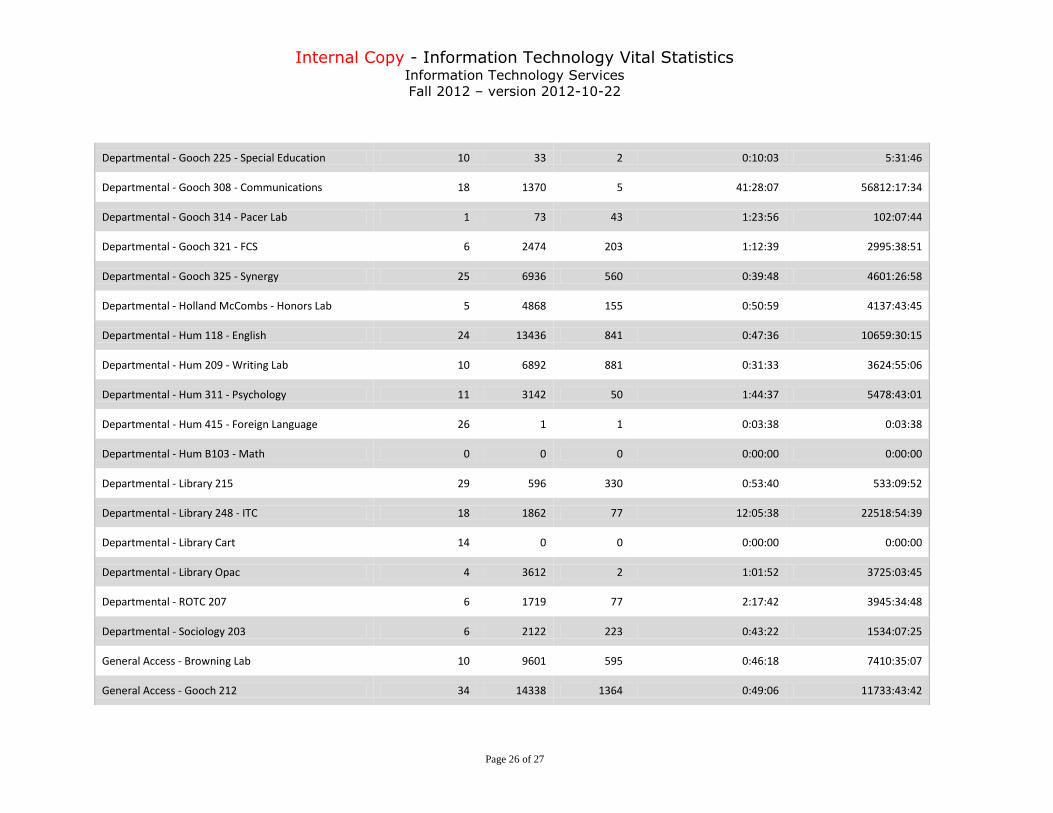
Departmental - Gooch 225 - Special Education 10 33 2 0:10:03 5:31:46
Departmental - Gooch 308 - Communications 18 1370 5 41:28:07 56812:17:34
Departmental - Gooch 314 - Pacer Lab 1 73 43 1:23:56 102:07:44
Departmental - Gooch 321 - FCS 6 2474 203 1:12:39 2995:38:51
Departmental - Gooch 325 - Synergy 25 6936 560 0:39:48 4601:26:58
Departmental - Holland McCombs - Honors Lab 5 4868 155 0:50:59 4137:43:45
Departmental - Hum 118 - English 24 13436 841 0:47:36 10659:30:15
Departmental - Hum 209 - Writing Lab 10 6892 881 0:31:33 3624:55:06
Departmental - Hum 311 - Psychology 11 3142 50 1:44:37 5478:43:01
Departmental - Hum 415 - Foreign Language 26 1 1 0:03:38 0:03:38
Departmental - Hum B103 - Math 0 0 0 0:00:00 0:00:00
Departmental - Library 215 29 596 330 0:53:40 533:09:52
Departmental - Library 248 - ITC 18 1862 77 12:05:38 22518:54:39
Departmental - Library Cart 14 0 0 0:00:00 0:00:00
Departmental - Library Opac 4 3612 2 1:01:52 3725:03:45
Departmental - ROTC 207 6 1719 77 2:17:42 3945:34:48
Departmental - Sociology 203 6 2122 223 0:43:22 1534:07:25
General Access - Browning Lab 10 9601 595 0:46:18 7410:35:07
General Access - Gooch 212 34 14338 1364 0:49:06 11733:43:42
Internal Copy - Information Technology Vital Statistics Information Technology Services
Fall 2012 – version 2012-10-22
Page 27 of 27
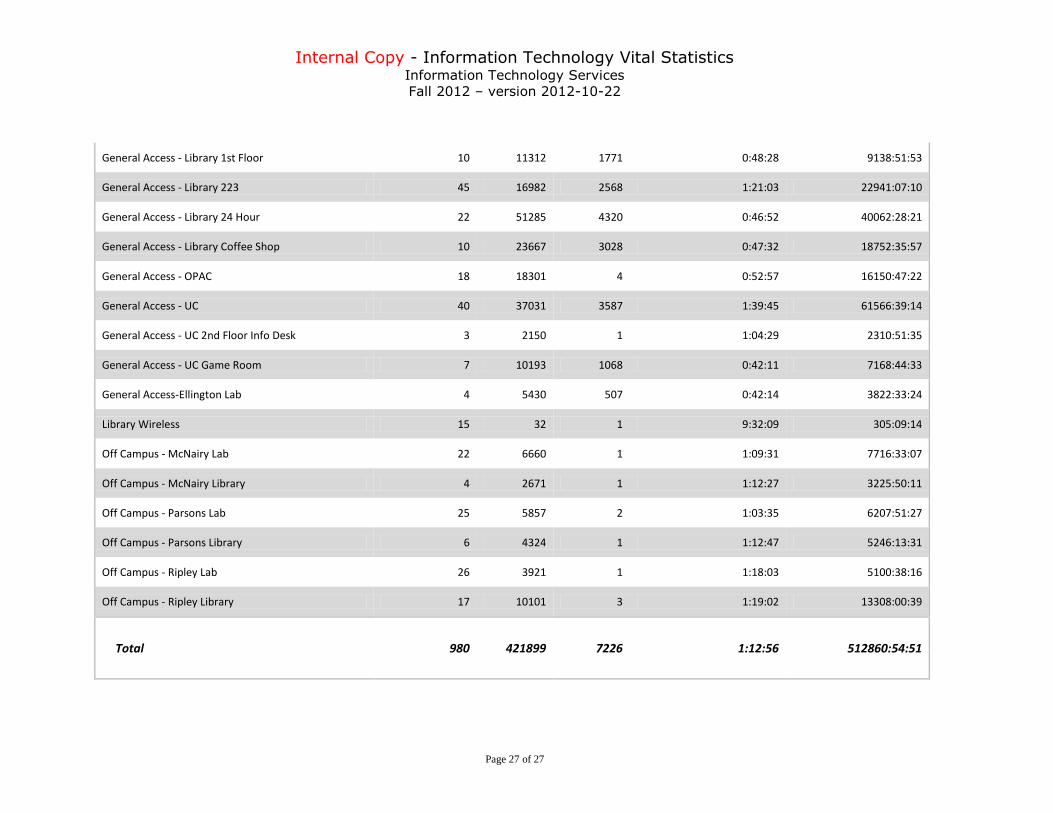
General Access - Library 1st Floor 10 11312 1771 0:48:28 9138:51:53
General Access - Library 223 45 16982 2568 1:21:03 22941:07:10
General Access - Library 24 Hour 22 51285 4320 0:46:52 40062:28:21
General Access - Library Coffee Shop 10 23667 3028 0:47:32 18752:35:57
General Access - OPAC 18 18301 4 0:52:57 16150:47:22
General Access - UC 40 37031 3587 1:39:45 61566:39:14
General Access - UC 2nd Floor Info Desk 3 2150 1 1:04:29 2310:51:35
General Access - UC Game Room 7 10193 1068 0:42:11 7168:44:33
General Access-Ellington Lab 4 5430 507 0:42:14 3822:33:24
Library Wireless 15 32 1 9:32:09 305:09:14
Off Campus - McNairy Lab 22 6660 1 1:09:31 7716:33:07
Off Campus - McNairy Library 4 2671 1 1:12:27 3225:50:11
Off Campus - Parsons Lab 25 5857 2 1:03:35 6207:51:27
Off Campus - Parsons Library 6 4324 1 1:12:47 5246:13:31
Off Campus - Ripley Lab 26 3921 1 1:18:03 5100:38:16
Off Campus - Ripley Library 17 10101 3 1:19:02 13308:00:39
Total 980 421899 7226 1:12:56 512860:54:51