Embed Size (px)
Citation preview
Mc
HD
a
ARRAA
KINBNN
1
lafttttitwc
tbAraca
h0
Applied Catalysis B: Environmental 163 (2015) 198–204
Contents lists available at ScienceDirect
Applied Catalysis B: Environmental
j ourna l h omepa ge: www.elsev ier .com/ locate /apcatb
icrowave-assisted optimization of platinum-nickel nanoalloys foratalytic water treatment
anyu Ma, Haitao Wang, Chongzheng Na ∗
epartment of Civil and Environmental Engineering and Earth Sciences, University of Notre Dame, 156 Fitzpatrick Hall, Notre Dame, IN 46556, United States
r t i c l e i n f o
rticle history:eceived 12 May 2014eceived in revised form 3 July 2014ccepted 29 July 2014vailable online 7 August 2014
eywords:
a b s t r a c t
Blending noble metal catalysts with inexpensive transition metals can reduce material cost in catalyticwater treatment by improving the catalytic reactivity. An important challenge is, however, to synthe-size a series of alloy nanoparticles with varied compositions so that the screening of catalytic reactivitycan be performed rapidly for a contaminant of interest. Here, we report a facile approach for the rapidsynthesis of bimetallic nanoalloys using cycle-controlled microwave-assisted polyol reduction, with anoption of fixing the nanoalloys directly on graphene supports in a one-pot operation. Using Pt and Ni as
ndustrial wastewater treatmentitroaromatic reductionimetallic alloyano catalystoble metal catalyst
the model noble and promoter metals, we show that Pt/Ni nanoparticles with diameters ranging from2.8 to 4 nm can be readily synthesized within minutes. The surface Ni percentage of the nanoparticles arevaried from 0 to 100%, which serves as a model system for nanoalloy screening. Using the model contam-inant p-nitrophenol, we further show that the reactivity-composition relationship has a classic volcanoshape as the Sabatier principle predicts. The highest reactivity is found with a surface Ni percentage ofapproximately 50%.
. Introduction
Nanoparticles made of noble metals such as platinum (Pt), pal-adium (Pd), and gold (Au) have attracted increasing attentions catalysts for degrading organic and inorganic contaminantsound in water and wastewater [1–7]. Compared to conven-ional treatment techniques, the use of catalysts can shortenreatment time, target recalcitrant compounds, and selectivelyransform wastes into valuable products. These attributes are par-icularly attractive as water reuse and resource recovery becomencreasingly incorporated into treatment practices [8,9]. An impor-ant challenge is, however, to reduce the high cost associatedith the initial investment and subsequent replenishment of
atalysts.An effective strategy for reducing the cost of catalytic water
reatment is to improve the reactivity of noble metal catalysts bylending them with promoter metals, forming bimetallic alloys.ccording to the classical Sabatier principle [10], an improved
eactivity can be obtained by optimizing the reactant-catalyst inter-ction. For example, platinum is one of the best noble metals foratalyzing the degradation of environmental contaminants suchs the reduction of p-nitrophenol (PNP) [1,11]. The reactivity of∗ Corresponding author. Tel.: +1 574 631 5164.E-mail address: [email protected] (C. Na).
ttp://dx.doi.org/10.1016/j.apcatb.2014.07.062926-3373/© 2014 Elsevier B.V. All rights reserved.
© 2014 Elsevier B.V. All rights reserved.
Pt can be further improved by blending with 3d transition metalssuch as copper (Cu) and nickel (Ni) [12–14], which are ineffec-tive catalysts themselves. The improved reactivity after blendingis attributable to the reduction of reactant-catalyst affinity throughelectronic (lowering the d-band center) and geometric (reducingbond distances) effects [15].
An important parameter that controls the reactivity of a bimetal-lic alloy catalyst is the blending ratio between the noble andtransition metals, with the highest reactivity often found at anintermediate blending ratio (not necessarily 1:1). The relationshipbetween reactivity and blending ratio is often revealed as a volcanocurve with an apex indicating an optimized energy for reactantadsorption [16–20]. The compositional dependence of reactivityhas been the basis of selecting effective catalysts for important reac-tions such as the oxygen reduction reaction [21,22], the methanoloxidation reaction [23,24], and the hydrolysis of ammonia borane[25,26]. In comparison, only limited efforts have been given toenvironmentally relevant reactions such as the PNP reduction.Stevenson, Henkelman, and colleagues investigated the reactiv-ity of Pt/Cu alloy nanoparticles (aka. nanoalloys) at a 1:1 molarratio; however, the ratio between Pt and Cu was not varied [14].
Pal and colleagues studied the reactivity of Pt/Ni nanoalloys withPt:Ni ratios of 36:64, 20:80, and 4:96 [12,27]. However, the highestreactivity was found at the extreme ratio of 4:96 in their systems,inconsistent with the optimal intermediate blending ratios foundfor other reactions (Pt:Ni = 1:1 to 3:1) [24,28,29].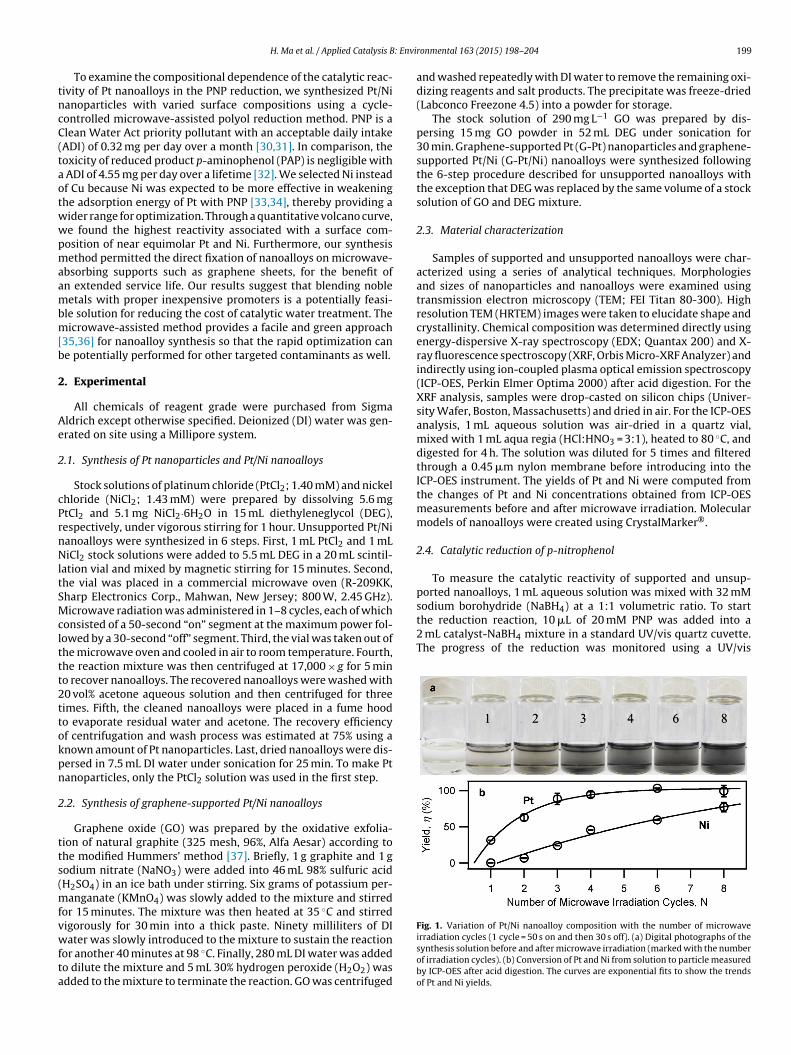
: Envi
tncC(taotwwpmaambm[b
2
Ae
2
cPrnNltSMclttt2ttokpn
2
tts(mfvwfta
ported nanoalloys, 1 mL aqueous solution was mixed with 32 mMsodium borohydride (NaBH4) at a 1:1 volumetric ratio. To startthe reduction reaction, 10 �L of 20 mM PNP was added into a2 mL catalyst-NaBH4 mixture in a standard UV/vis quartz cuvette.The progress of the reduction was monitored using a UV/vis
H. Ma et al. / Applied Catalysis B
To examine the compositional dependence of the catalytic reac-ivity of Pt nanoalloys in the PNP reduction, we synthesized Pt/Nianoparticles with varied surface compositions using a cycle-ontrolled microwave-assisted polyol reduction method. PNP is alean Water Act priority pollutant with an acceptable daily intakeADI) of 0.32 mg per day over a month [30,31]. In comparison, theoxicity of reduced product p-aminophenol (PAP) is negligible with
ADI of 4.55 mg per day over a lifetime [32]. We selected Ni insteadf Cu because Ni was expected to be more effective in weakeninghe adsorption energy of Pt with PNP [33,34], thereby providing aider range for optimization. Through a quantitative volcano curve,e found the highest reactivity associated with a surface com-osition of near equimolar Pt and Ni. Furthermore, our synthesisethod permitted the direct fixation of nanoalloys on microwave-
bsorbing supports such as graphene sheets, for the benefit ofn extended service life. Our results suggest that blending nobleetals with proper inexpensive promoters is a potentially feasi-
le solution for reducing the cost of catalytic water treatment. Theicrowave-assisted method provides a facile and green approach
35,36] for nanoalloy synthesis so that the rapid optimization cane potentially performed for other targeted contaminants as well.
. Experimental
All chemicals of reagent grade were purchased from Sigmaldrich except otherwise specified. Deionized (DI) water was gen-rated on site using a Millipore system.
.1. Synthesis of Pt nanoparticles and Pt/Ni nanoalloys
Stock solutions of platinum chloride (PtCl2; 1.40 mM) and nickelhloride (NiCl2; 1.43 mM) were prepared by dissolving 5.6 mgtCl2 and 5.1 mg NiCl2·6H2O in 15 mL diethyleneglycol (DEG),espectively, under vigorous stirring for 1 hour. Unsupported Pt/Nianoalloys were synthesized in 6 steps. First, 1 mL PtCl2 and 1 mLiCl2 stock solutions were added to 5.5 mL DEG in a 20 mL scintil-
ation vial and mixed by magnetic stirring for 15 minutes. Second,he vial was placed in a commercial microwave oven (R-209KK,harp Electronics Corp., Mahwan, New Jersey; 800 W, 2.45 GHz).icrowave radiation was administered in 1–8 cycles, each of which
onsisted of a 50-second “on” segment at the maximum power fol-owed by a 30-second “off” segment. Third, the vial was taken out ofhe microwave oven and cooled in air to room temperature. Fourth,he reaction mixture was then centrifuged at 17,000 × g for 5 mino recover nanoalloys. The recovered nanoalloys were washed with0 vol% acetone aqueous solution and then centrifuged for threeimes. Fifth, the cleaned nanoalloys were placed in a fume hoodo evaporate residual water and acetone. The recovery efficiencyf centrifugation and wash process was estimated at 75% using anown amount of Pt nanoparticles. Last, dried nanoalloys were dis-ersed in 7.5 mL DI water under sonication for 25 min. To make Ptanoparticles, only the PtCl2 solution was used in the first step.
.2. Synthesis of graphene-supported Pt/Ni nanoalloys
Graphene oxide (GO) was prepared by the oxidative exfolia-ion of natural graphite (325 mesh, 96%, Alfa Aesar) according tohe modified Hummers’ method [37]. Briefly, 1 g graphite and 1 godium nitrate (NaNO3) were added into 46 mL 98% sulfuric acidH2SO4) in an ice bath under stirring. Six grams of potassium per-
anganate (KMnO4) was slowly added to the mixture and stirredor 15 minutes. The mixture was then heated at 35 ◦C and stirred
igorously for 30 min into a thick paste. Ninety milliliters of DIater was slowly introduced to the mixture to sustain the reactionor another 40 minutes at 98 ◦C. Finally, 280 mL DI water was addedo dilute the mixture and 5 mL 30% hydrogen peroxide (H2O2) wasdded to the mixture to terminate the reaction. GO was centrifuged
ronmental 163 (2015) 198–204 199
and washed repeatedly with DI water to remove the remaining oxi-dizing reagents and salt products. The precipitate was freeze-dried(Labconco Freezone 4.5) into a powder for storage.
The stock solution of 290 mg L−1 GO was prepared by dis-persing 15 mg GO powder in 52 mL DEG under sonication for30 min. Graphene-supported Pt (G-Pt) nanoparticles and graphene-supported Pt/Ni (G-Pt/Ni) nanoalloys were synthesized followingthe 6-step procedure described for unsupported nanoalloys withthe exception that DEG was replaced by the same volume of a stocksolution of GO and DEG mixture.
2.3. Material characterization
Samples of supported and unsupported nanoalloys were char-acterized using a series of analytical techniques. Morphologiesand sizes of nanoparticles and nanoalloys were examined usingtransmission electron microscopy (TEM; FEI Titan 80-300). Highresolution TEM (HRTEM) images were taken to elucidate shape andcrystallinity. Chemical composition was determined directly usingenergy-dispersive X-ray spectroscopy (EDX; Quantax 200) and X-ray fluorescence spectroscopy (XRF, Orbis Micro-XRF Analyzer) andindirectly using ion-coupled plasma optical emission spectroscopy(ICP-OES, Perkin Elmer Optima 2000) after acid digestion. For theXRF analysis, samples were drop-casted on silicon chips (Univer-sity Wafer, Boston, Massachusetts) and dried in air. For the ICP-OESanalysis, 1 mL aqueous solution was air-dried in a quartz vial,mixed with 1 mL aqua regia (HCl:HNO3 = 3:1), heated to 80 ◦C, anddigested for 4 h. The solution was diluted for 5 times and filteredthrough a 0.45 �m nylon membrane before introducing into theICP-OES instrument. The yields of Pt and Ni were computed fromthe changes of Pt and Ni concentrations obtained from ICP-OESmeasurements before and after microwave irradiation. Molecularmodels of nanoalloys were created using CrystalMarker®.
2.4. Catalytic reduction of p-nitrophenol
To measure the catalytic reactivity of supported and unsup-
Fig. 1. Variation of Pt/Ni nanoalloy composition with the number of microwaveirradiation cycles (1 cycle = 50 s on and then 30 s off). (a) Digital photographs of thesynthesis solution before and after microwave irradiation (marked with the numberof irradiation cycles). (b) Conversion of Pt and Ni from solution to particle measuredby ICP-OES after acid digestion. The curves are exponential fits to show the trendsof Pt and Ni yields.
2 : Envi
ssfeusstftifit
3
c
FoosS
00 H. Ma et al. / Applied Catalysis B
pectrophotometer (Agilent Cary 300). The reactive solution wastirred the whole time using a glass rod. The absorption of lightrom 220 to 520 nm by the reactive solution was recorded oncevery minute. Before each experiment, the baseline was measuredsing a solution consisting of 1 mL of the corresponding materialolution and 1 mL of 32 mM NaBH4 without PNP. The baseline wasubtracted from the absorption spectra of the reactive solution forhe quantification of PNP. The PNP concentration was convertedrom absorbance using a calibration curve obtained with PNP solu-ions of known concentrations. To test the reactivity of the catalystsn repeated use, the reaction solution was centrifuged at 17,000 × gor 5 min to recover the catalysts. The catalysts were re-dispersedn 1 mL water by 5 min sonication and the catalytic activity wasested as described above.
. Results
Metal nanoparticles formed by irradiating a synthesis solutionontaining Pt2+, Ni2+, and diethylene glycol with microwaves are
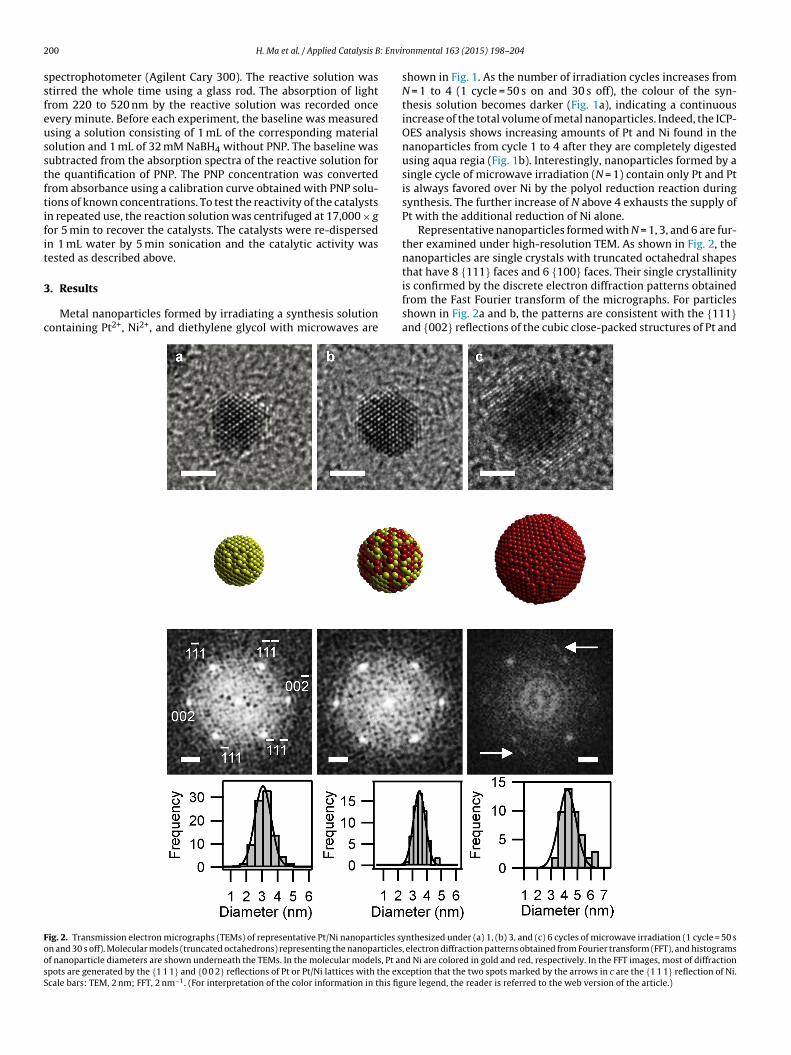
ig. 2. Transmission electron micrographs (TEMs) of representative Pt/Ni nanoparticles syn and 30 s off). Molecular models (truncated octahedrons) representing the nanoparticlesf nanoparticle diameters are shown underneath the TEMs. In the molecular models, Pt anpots are generated by the {1 1 1} and {0 0 2} reflections of Pt or Pt/Ni lattices with the exccale bars: TEM, 2 nm; FFT, 2 nm−1. (For interpretation of the color information in this fig
ronmental 163 (2015) 198–204
shown in Fig. 1. As the number of irradiation cycles increases fromN = 1 to 4 (1 cycle = 50 s on and 30 s off), the colour of the syn-thesis solution becomes darker (Fig. 1a), indicating a continuousincrease of the total volume of metal nanoparticles. Indeed, the ICP-OES analysis shows increasing amounts of Pt and Ni found in thenanoparticles from cycle 1 to 4 after they are completely digestedusing aqua regia (Fig. 1b). Interestingly, nanoparticles formed by asingle cycle of microwave irradiation (N = 1) contain only Pt and Ptis always favored over Ni by the polyol reduction reaction duringsynthesis. The further increase of N above 4 exhausts the supply ofPt with the additional reduction of Ni alone.
Representative nanoparticles formed with N = 1, 3, and 6 are fur-ther examined under high-resolution TEM. As shown in Fig. 2, thenanoparticles are single crystals with truncated octahedral shapes
that have 8 {111} faces and 6 {100} faces. Their single crystallinityis confirmed by the discrete electron diffraction patterns obtainedfrom the Fast Fourier transform of the micrographs. For particlesshown in Fig. 2a and b, the patterns are consistent with the {111}and {002} reflections of the cubic close-packed structures of Pt andnthesized under (a) 1, (b) 3, and (c) 6 cycles of microwave irradiation (1 cycle = 50 s, electron diffraction patterns obtained from Fourier transform (FFT), and histogramsd Ni are colored in gold and red, respectively. In the FFT images, most of diffractioneption that the two spots marked by the arrows in c are the {1 1 1} reflection of Ni.
ure legend, the reader is referred to the web version of the article.)
H. Ma et al. / Applied Catalysis B: Environmental 163 (2015) 198–204 201
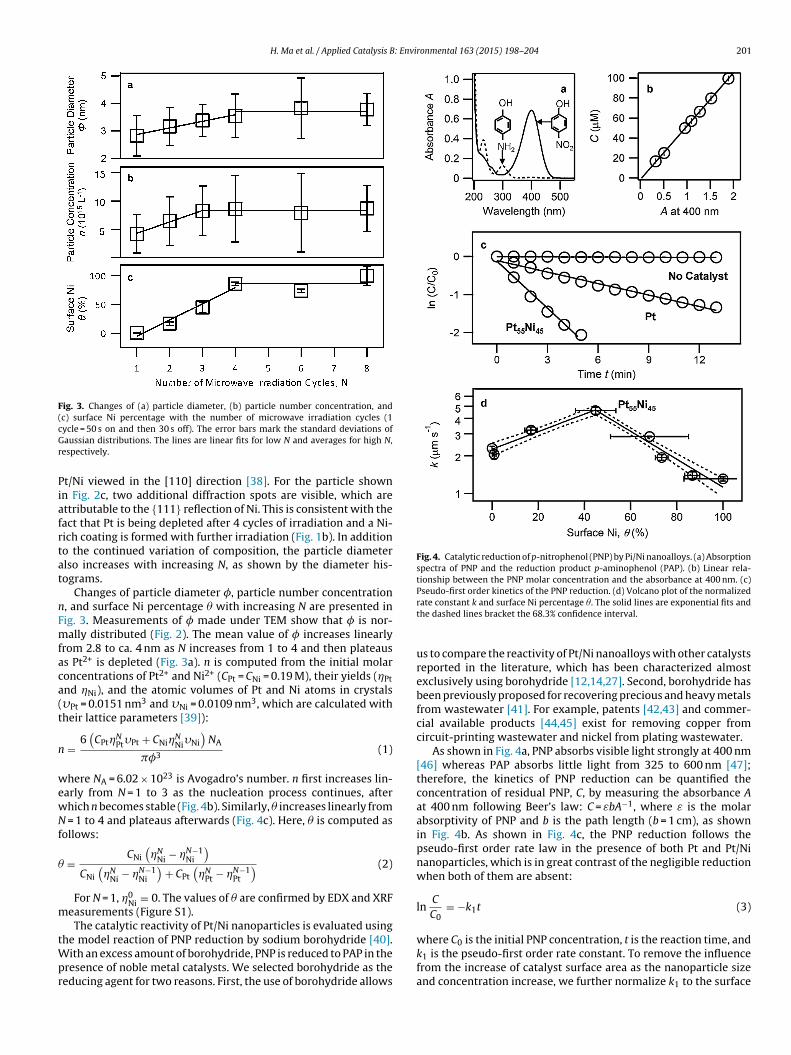
Fig. 3. Changes of (a) particle diameter, (b) particle number concentration, and(cGr
Piafrtat
nFmfaca(t
n
wewNf
�
m
tWpr
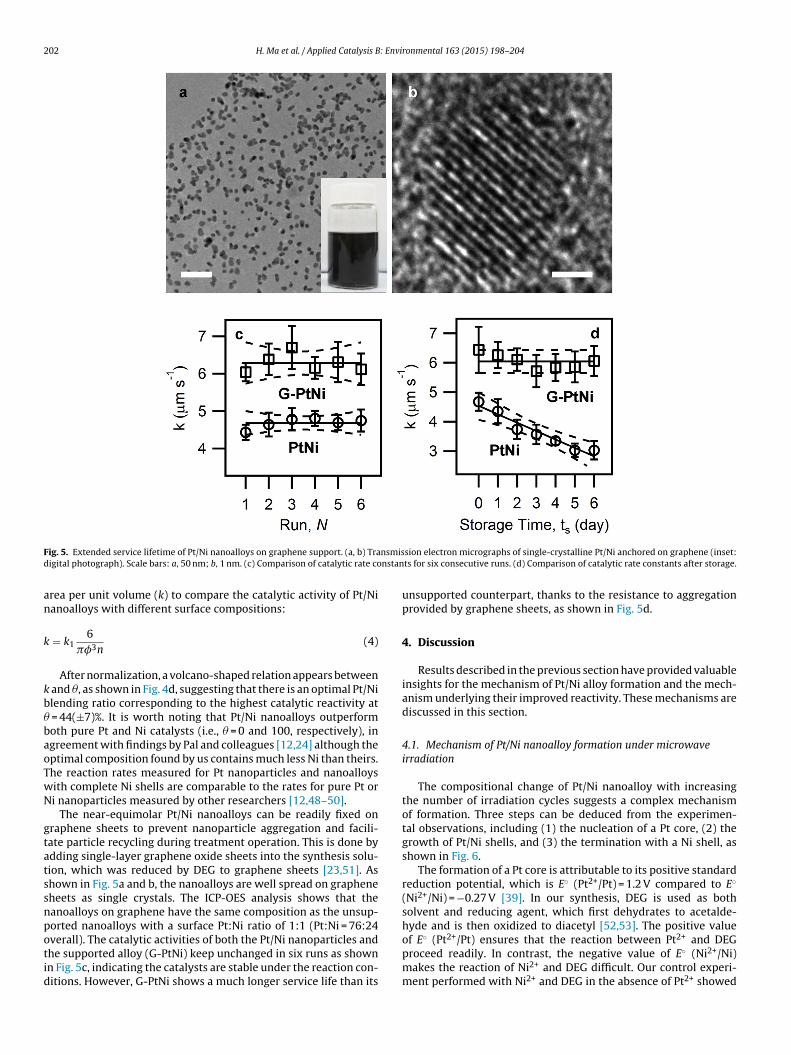
Fig. 4. Catalytic reduction of p-nitrophenol (PNP) by Pi/Ni nanoalloys. (a) Absorptionspectra of PNP and the reduction product p-aminophenol (PAP). (b) Linear rela-tionship between the PNP molar concentration and the absorbance at 400 nm. (c)
c) surface Ni percentage with the number of microwave irradiation cycles (1ycle = 50 s on and then 30 s off). The error bars mark the standard deviations ofaussian distributions. The lines are linear fits for low N and averages for high N,
espectively.
t/Ni viewed in the [110] direction [38]. For the particle shownn Fig. 2c, two additional diffraction spots are visible, which arettributable to the {111} reflection of Ni. This is consistent with theact that Pt is being depleted after 4 cycles of irradiation and a Ni-ich coating is formed with further irradiation (Fig. 1b). In additiono the continued variation of composition, the particle diameterlso increases with increasing N, as shown by the diameter his-ograms.
Changes of particle diameter �, particle number concentration, and surface Ni percentage � with increasing N are presented inig. 3. Measurements of � made under TEM show that � is nor-ally distributed (Fig. 2). The mean value of � increases linearly
rom 2.8 to ca. 4 nm as N increases from 1 to 4 and then plateauss Pt2+ is depleted (Fig. 3a). n is computed from the initial molaroncentrations of Pt2+ and Ni2+ (CPt = CNi = 0.19 M), their yields (�Ptnd �Ni), and the atomic volumes of Pt and Ni atoms in crystals�Pt = 0.0151 nm3 and �Ni = 0.0109 nm3, which are calculated withheir lattice parameters [39]):
=6(
CPt�NPt�Pt + CNi�
NNi�Ni
)NA
��3(1)
here NA = 6.02 × 10²³ is Avogadro’s number. n first increases lin-arly from N = 1 to 3 as the nucleation process continues, afterhich n becomes stable (Fig. 4b). Similarly, � increases linearly from
= 1 to 4 and plateaus afterwards (Fig. 4c). Here, � is computed asollows:
=CNi
(�N
Ni − �N−1Ni
)
CNi
(�N
Ni − �N−1Ni
)+ CPt
(�N
Pt − �N−1Pt
) (2)
For N = 1, �0Ni = 0. The values of � are confirmed by EDX and XRF
easurements (Figure S1).
The catalytic reactivity of Pt/Ni nanoparticles is evaluated usinghe model reaction of PNP reduction by sodium borohydride [40].ith an excess amount of borohydride, PNP is reduced to PAP in the
resence of noble metal catalysts. We selected borohydride as theeducing agent for two reasons. First, the use of borohydride allows
Pseudo-first order kinetics of the PNP reduction. (d) Volcano plot of the normalizedrate constant k and surface Ni percentage �. The solid lines are exponential fits andthe dashed lines bracket the 68.3% confidence interval.
us to compare the reactivity of Pt/Ni nanoalloys with other catalystsreported in the literature, which has been characterized almostexclusively using borohydride [12,14,27]. Second, borohydride hasbeen previously proposed for recovering precious and heavy metalsfrom wastewater [41]. For example, patents [42,43] and commer-cial available products [44,45] exist for removing copper fromcircuit-printing wastewater and nickel from plating wastewater.
As shown in Fig. 4a, PNP absorbs visible light strongly at 400 nm[46] whereas PAP absorbs little light from 325 to 600 nm [47];therefore, the kinetics of PNP reduction can be quantified theconcentration of residual PNP, C, by measuring the absorbance Aat 400 nm following Beer’s law: C = εbA−1, where ε is the molarabsorptivity of PNP and b is the path length (b = 1 cm), as shownin Fig. 4b. As shown in Fig. 4c, the PNP reduction follows thepseudo-first order rate law in the presence of both Pt and Pt/Ninanoparticles, which is in great contrast of the negligible reductionwhen both of them are absent:
lnC
C0= −k1t (3)
where C0 is the initial PNP concentration, t is the reaction time, andk1 is the pseudo-first order rate constant. To remove the influencefrom the increase of catalyst surface area as the nanoparticle sizeand concentration increase, we further normalize k1 to the surface
202 H. Ma et al. / Applied Catalysis B: Environmental 163 (2015) 198–204
F nsmisd nstan
an
k
kb�baoTwN
gtatssnpotid
ig. 5. Extended service lifetime of Pt/Ni nanoalloys on graphene support. (a, b) Traigital photograph). Scale bars: a, 50 nm; b, 1 nm. (c) Comparison of catalytic rate co
rea per unit volume (k) to compare the catalytic activity of Pt/Nianoalloys with different surface compositions:
= k16
��3n(4)
After normalization, a volcano-shaped relation appears between and �, as shown in Fig. 4d, suggesting that there is an optimal Pt/Nilending ratio corresponding to the highest catalytic reactivity at
= 44(±7)%. It is worth noting that Pt/Ni nanoalloys outperformoth pure Pt and Ni catalysts (i.e., � = 0 and 100, respectively), ingreement with findings by Pal and colleagues [12,24] although theptimal composition found by us contains much less Ni than theirs.he reaction rates measured for Pt nanoparticles and nanoalloysith complete Ni shells are comparable to the rates for pure Pt ori nanoparticles measured by other researchers [12,48–50].
The near-equimolar Pt/Ni nanoalloys can be readily fixed onraphene sheets to prevent nanoparticle aggregation and facili-ate particle recycling during treatment operation. This is done bydding single-layer graphene oxide sheets into the synthesis solu-ion, which was reduced by DEG to graphene sheets [23,51]. Ashown in Fig. 5a and b, the nanoalloys are well spread on grapheneheets as single crystals. The ICP-OES analysis shows that theanoalloys on graphene have the same composition as the unsup-
orted nanoalloys with a surface Pt:Ni ratio of 1:1 (Pt:Ni = 76:24verall). The catalytic activities of both the Pt/Ni nanoparticles andhe supported alloy (G-PtNi) keep unchanged in six runs as shownn Fig. 5c, indicating the catalysts are stable under the reaction con-itions. However, G-PtNi shows a much longer service life than itssion electron micrographs of single-crystalline Pt/Ni anchored on graphene (inset:ts for six consecutive runs. (d) Comparison of catalytic rate constants after storage.
unsupported counterpart, thanks to the resistance to aggregationprovided by graphene sheets, as shown in Fig. 5d.
4. Discussion
Results described in the previous section have provided valuableinsights for the mechanism of Pt/Ni alloy formation and the mech-anism underlying their improved reactivity. These mechanisms arediscussed in this section.
4.1. Mechanism of Pt/Ni nanoalloy formation under microwaveirradiation
The compositional change of Pt/Ni nanoalloy with increasingthe number of irradiation cycles suggests a complex mechanismof formation. Three steps can be deduced from the experimen-tal observations, including (1) the nucleation of a Pt core, (2) thegrowth of Pt/Ni shells, and (3) the termination with a Ni shell, asshown in Fig. 6.
The formation of a Pt core is attributable to its positive standardreduction potential, which is E◦ (Pt2+/Pt) = 1.2 V compared to E◦
(Ni2+/Ni) = −0.27 V [39]. In our synthesis, DEG is used as bothsolvent and reducing agent, which first dehydrates to acetalde-
hyde and is then oxidized to diacetyl [52,53]. The positive valueof E◦ (Pt2+/Pt) ensures that the reaction between Pt2+ and DEGproceed readily. In contrast, the negative value of E◦ (Ni2+/Ni)makes the reaction of Ni2+ and DEG difficult. Our control experi-ment performed with Ni2+ and DEG in the absence of Pt2+ showed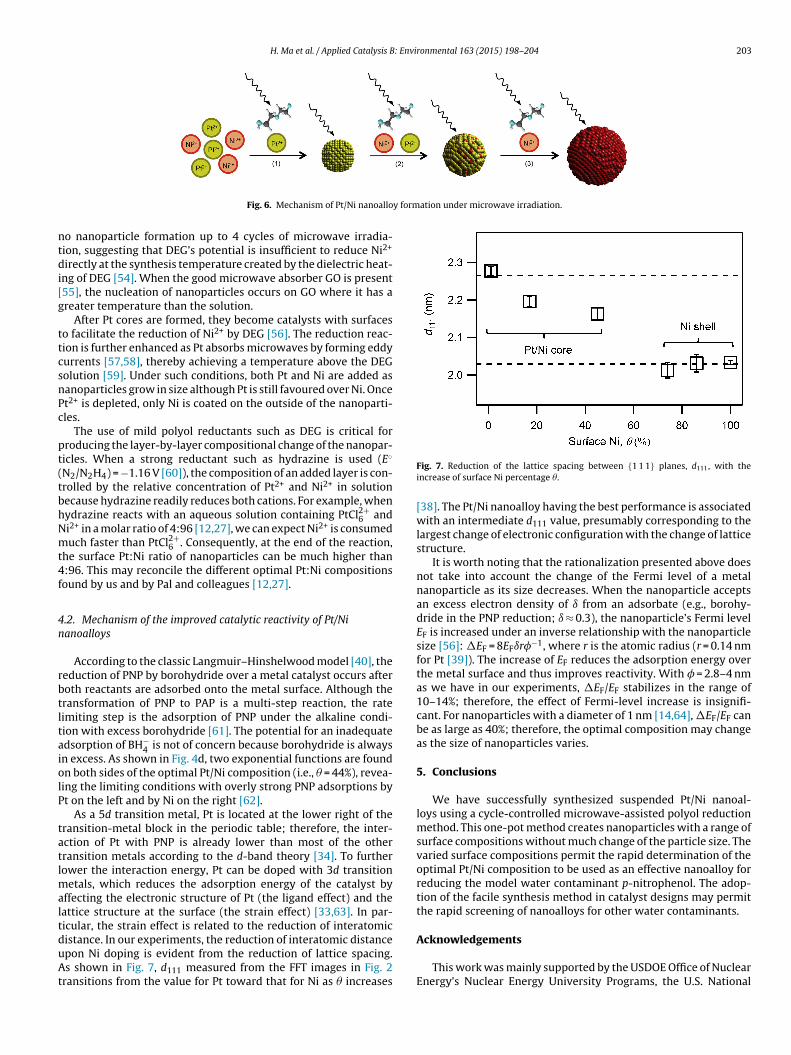
H. Ma et al. / Applied Catalysis B: Environmental 163 (2015) 198–204 203
y formation under microwave irradiation.
ntdi[g
ttcsnPc
pt(tbhNmt4f
4n
rbtltaiolP
tatlmaltduAt
Fig. 6. Mechanism of Pt/Ni nanoallo
o nanoparticle formation up to 4 cycles of microwave irradia-ion, suggesting that DEG’s potential is insufficient to reduce Ni2+
irectly at the synthesis temperature created by the dielectric heat-ng of DEG [54]. When the good microwave absorber GO is present55], the nucleation of nanoparticles occurs on GO where it has areater temperature than the solution.
After Pt cores are formed, they become catalysts with surfaceso facilitate the reduction of Ni2+ by DEG [56]. The reduction reac-ion is further enhanced as Pt absorbs microwaves by forming eddyurrents [57,58], thereby achieving a temperature above the DEGolution [59]. Under such conditions, both Pt and Ni are added asanoparticles grow in size although Pt is still favoured over Ni. Oncet2+ is depleted, only Ni is coated on the outside of the nanoparti-les.
The use of mild polyol reductants such as DEG is critical forroducing the layer-by-layer compositional change of the nanopar-icles. When a strong reductant such as hydrazine is used (E◦
N2/N2H4) = −1.16 V [60]), the composition of an added layer is con-rolled by the relative concentration of Pt2+ and Ni2+ in solutionecause hydrazine readily reduces both cations. For example, whenydrazine reacts with an aqueous solution containing PtCl2+
6 andi2+ in a molar ratio of 4:96 [12,27], we can expect Ni2+ is consumeduch faster than PtCl2+
6 . Consequently, at the end of the reaction,he surface Pt:Ni ratio of nanoparticles can be much higher than:96. This may reconcile the different optimal Pt:Ni compositionsound by us and by Pal and colleagues [12,27].
.2. Mechanism of the improved catalytic reactivity of Pt/Nianoalloys
According to the classic Langmuir–Hinshelwood model [40], theeduction of PNP by borohydride over a metal catalyst occurs afteroth reactants are adsorbed onto the metal surface. Although theransformation of PNP to PAP is a multi-step reaction, the rateimiting step is the adsorption of PNP under the alkaline condi-ion with excess borohydride [61]. The potential for an inadequatedsorption of BH−
4 is not of concern because borohydride is alwaysn excess. As shown in Fig. 4d, two exponential functions are foundn both sides of the optimal Pt/Ni composition (i.e., � = 44%), revea-ing the limiting conditions with overly strong PNP adsorptions byt on the left and by Ni on the right [62].
As a 5d transition metal, Pt is located at the lower right of theransition-metal block in the periodic table; therefore, the inter-ction of Pt with PNP is already lower than most of the otherransition metals according to the d-band theory [34]. To furtherower the interaction energy, Pt can be doped with 3d transition
etals, which reduces the adsorption energy of the catalyst byffecting the electronic structure of Pt (the ligand effect) and theattice structure at the surface (the strain effect) [33,63]. In par-
icular, the strain effect is related to the reduction of interatomicistance. In our experiments, the reduction of interatomic distancepon Ni doping is evident from the reduction of lattice spacing.s shown in Fig. 7, d111 measured from the FFT images in Fig. 2ransitions from the value for Pt toward that for Ni as � increases
Fig. 7. Reduction of the lattice spacing between {1 1 1} planes, d111, with theincrease of surface Ni percentage �.
[38]. The Pt/Ni nanoalloy having the best performance is associatedwith an intermediate d111 value, presumably corresponding to thelargest change of electronic configuration with the change of latticestructure.
It is worth noting that the rationalization presented above doesnot take into account the change of the Fermi level of a metalnanoparticle as its size decreases. When the nanoparticle acceptsan excess electron density of ı from an adsorbate (e.g., borohy-dride in the PNP reduction; ı ≈ 0.3), the nanoparticle’s Fermi levelEF is increased under an inverse relationship with the nanoparticlesize [56]: �EF = 8EFır�−1, where r is the atomic radius (r = 0.14 nmfor Pt [39]). The increase of EF reduces the adsorption energy overthe metal surface and thus improves reactivity. With � = 2.8–4 nmas we have in our experiments, �EF/EF stabilizes in the range of10–14%; therefore, the effect of Fermi-level increase is insignifi-cant. For nanoparticles with a diameter of 1 nm [14,64], �EF/EF canbe as large as 40%; therefore, the optimal composition may changeas the size of nanoparticles varies.
5. Conclusions
We have successfully synthesized suspended Pt/Ni nanoal-loys using a cycle-controlled microwave-assisted polyol reductionmethod. This one-pot method creates nanoparticles with a range ofsurface compositions without much change of the particle size. Thevaried surface compositions permit the rapid determination of theoptimal Pt/Ni composition to be used as an effective nanoalloy forreducing the model water contaminant p-nitrophenol. The adop-tion of the facile synthesis method in catalyst designs may permitthe rapid screening of nanoalloys for other water contaminants.
Acknowledgements
This work was mainly supported by the USDOE Office of NuclearEnergy’s Nuclear Energy University Programs, the U.S. National
2 : Envi
SUsbo
A
f2
R
[
[
[
[[
[
[
[
[
[
[
[
[[
[[[
[
[
[
[
[
[
[
[
[[
[[
[[
[
[
[
[[
[
[
[[[[
[
[
[[
[[[[
[
04 H. Ma et al. / Applied Catalysis B
cience Foundation’s Environmental Engineering Program, and theniversity of Notre Dame Sustainable Energy Initiative. H.M. thanks
upport from the Bayer Predoctoral Research Fellowship providedy the Notre Dame Center for Environmental Science and Technol-gy.
ppendix A. Supplementary data
Supplementary data associated with this article can beound, in the online version, at http://dx.doi.org/10.1016/j.apcatb.014.07.062.
eferences
[1] S. Wunder, F. Polzer, Y. Lu, Y. Mei, M. Ballauff, J. Phys. Chem. C 114 (2010)8814–8820.
[2] T. Pradeep, Anshup, Thin Solid Films 517 (2009) 6441–6478.[3] J. Liu, J.K. Choe, Z. Sasnow, C.J. Werth, T.J. Strathmann, Water Res. 47 (2013)
91–101.[4] H. Wang, Z. Dong, C. Na, ACS Sustainable Chem. Eng. 1 (2013) 746–752.[5] S. De Corte, T. Sabbe, T. Hennebel, L. Vanhaecke, B. De Gusseme, W. Verstraete,
N. Boon, Water Res. 46 (2012) 2718–2726.[6] H. Wang, H. Ma, W. Zheng, D. An, C. Na, ACS Appl. Mater. Interf. 6 (2014)
9426–9434.[7] B.P. Chaplin, M. Reinhard, W.F. Schneider, C. Schüth, J.R. Shapley, T.J. Strath-
mann, C.J. Werth, Environ. Sci. Technol. 46 (2012) 3655–3670.[8] N. Wigginton, J. Yeston, D. Malakoff, Science 337 (2012) 662–663.[9] J.G. Hering, T.D. Waite, R.G. Luthy, J.E. Drewes, D.L. Sedlak, Environ. Sci. Technol.
47 (2013) 10721–10726.10] P. Sabatier, Berichte der deutschen chemischen Gesellschaft 44 (1911)
1984–2001.11] J. Kaiser, L. Leppert, H. Welz, F. Polzer, S. Wunder, N. Wanderka, M. Albrecht, T.
Lunkenbein, J. Breu, S. Kummel, Y. Lu, M. Ballauff, Phys. Chem. Chem. Phys. 14(2012) 6487–6495.
12] S.K. Ghosh, M. Mandal, S. Kundu, S. Nath, T. Pal, Appl. Catal., A 268 (2004) 61–66.
13] R. Liu, Q. Zhao, Y. Li, G. Zhang, F. Zhang, X. Fan, J. Nanomater. 2013 (2013) 7.14] Z.D. Pozun, S.E. Rodenbusch, E. Keller, K. Tran, W. Tang, K.J. Stevenson, G.
Henkelman, J. Phys. Chem. C 117 (2013) 7598–7604.15] K. Jayasayee, J.A.R.V. Veen, T.G. Manivasagam, S. Celebi, E.J.M. Hensen, F.A. de
Bruijn, Appl. Catal., B 111–112 (2012) 515–526.16] H. Toulhoat, P. Raybaud, S. Kasztelan, G. Kresse, J. Hafner, Catal. Today 50 (1999)
629–636.17] R.R. Chianelli, G. Berhault, P. Raybaud, S. Kasztelan, J. Hafner, H. Toulhoat, Appl.
Catal., A 227 (2002) 83–96.18] K. Tedsree, C.W.A. Chan, S. Jones, Q.A. Cuan, W.K. Li, X.Q. Gong, S.C.E. Tsang,
Science 332 (2011) 224–228.19] R.I. Masel, Chemical Kinetics and Catalysis, John Wiley & Sons, New York, NY,
2001.20] V.R. Stamenkovic, B. Fowler, B.S. Mun, G. Wang, P.N. Ross, C.A. Lucas, N.M.
Markovic, Science 315 (2007) 493–497.21] T. Toda, H. Igarashi, H. Uchida, M. Watanabe, J. Electrochem. Soc. 146 (1999)
3750–3756.22] M.H. Shao, K. Sasaki, R.R. Adzic, J. Am. Chem. Soc. 128 (2006) 3526–3527.
23] Y. Liu, M.F. Chi, V. Mazumder, K.L. More, S. Soled, J.D. Henao, S.H. Sun, Chem.Mater. 23 (2011) 4199–4203.24] Y. Hu, P. Wu, Y. Yin, H. Zhang, C. Cai, Appl. Catal., B 111 (2012) 208–217.25] D.H. Sun, V. Mazumder, O. Metin, S.H. Sun, ACS Nano 5 (2011) 6458–6464.26] J.M. Yan, X.B. Zhang, S. Han, H. Shioyama, Q. Xu, J. Power Sources 194 (2009)
478–481.
[[
[[
ronmental 163 (2015) 198–204
27] M. Mandal, S. Kundu, S.K. Ghosh, T.K. Sau, S.M. Yusuf, T. Pal, J. Colloid InterfaceSci. 265 (2003) 23–28.
28] H. Yang, W. Vogel, C. Lamy, N. Alonso-Vante, J. Phys. Chem. B 108 (2004)11024–11034.
29] S.I. Choi, S.U. Lee, W.Y. Kim, R. Choi, K. Hong, K.M. Nam, S.W. Han, J.T. Park, ACSAppl. Mater. Interfaces 4 (2012) 6228–6234.
30] United States Environmental Protection Agency, Clean Water Act Priority Pol-lutant List, 1982, pp. Code of Federal Regulations 40 CFR 423 Appendix A.
31] United States Public Health Service, Toxicological profile for nitrophenols: 2-nitrophenol 4-nitrophenol, 1992.
32] United States Environmental Protection Agency, Health and EnvironmentalEffects Profile for Aminophenols, 1985.
33] J.R. Kitchin, J.K. Norskov, M.A. Barteau, J.G. Chen, J. Chem. Phys. 120 (2004)10240–10246.
34] B. Hammer, J.K. Norskov, Theoretical surface science and catalysis - Calculationsand concepts, in: B.C. Gates, H. Knozinger (Eds.), Advances in Catalysis, Vol 45:Impact of Surface Science on Catalysis, Elsevier Academic Press Inc, San Diego,2000, pp. 71–129.
35] M. Nuchter, B. Ondruschka, W. Bonrath, A. Gum, Green Chem. 6 (2004) 128–141.36] J. Kou, C. Bennett-Stamper, R.S. Varma, ACS Sustainable Chem Eng. 1 (2013)
810–816.37] W.S. Hummers, R.E. Offeman, J. Am. Chem. Soc. 80 (1958), 1339-1339.38] R.W.G. Wyckoff, Crystal Structures, second ed., Interscience Publishers, New
York, 1963.39] D.R. Lide, CRC Handbook of Chemistry and Physics, CRC Press, New York, 2006.40] P. Hervés, M. Pérez-Lorenzo, L.M. Liz-Marzán, J. Dzubiella, Y. Lu, M. Ballauff,
Chem. Soc. Rev. 41 (2012) 5577–5587.41] C. Gómez-Lahoz, F. García-Herruzo, J.M. Rodríguez-Maroto, J.J. Rodríguez,
Water Res. 27 (1993) 985–992.42] J.A. Ulman, W. Verstraeten, M.A. Cook, W. Verleye, L.J. Guilbault, Separating
metals from waste water, US Patent: 5354478 A (1994).43] C.L. Alexander, A.M. Mariniello, B.A. McBride, M.M. Cook, D.A. Dunn, Waste
treatment of metal plating solutions, US Patent: USH1852 H (2000).44] The Dow Chemical Company, VenMetTM Borohydride Solution, 2013.45] Kemira Oyj, Sodium borohydride products, http://www.kemira.com/en/
industries-applications/Pages/sodium-borohydride.aspx, June 29, 2014.46] J. Liu, G. Qin, P. Raveendran, Y. Ikushima, Y. Ikushima, Chem. Eur. J. 12 (2006)
2131–2138.47] D.M. Dotzauer, S. Bhattacharjee, Y. Wen, M.L. Bruening, Langmuir 25 (2009)
1865–1871.48] Z. Jiang, J. Xie, D. Jiang, X. Wei, M. Chen, CrystEngComm 15 (2013) 560–569.49] K. Esumi, R. Isono, T. Yoshimura, Langmuir 20 (2004) 237–243.50] N. Sahiner, H. Ozay, O. Ozay, N. Aktas, Appl. Catal., A 385 (2010) 201–207.51] P. Kundu, C. Nethravathi, P.A. Deshpande, M. Rajamathi, G. Madras, N. Ravis-
hankar, Chem. Mater. 23 (2011) 2772–2780.52] F. Fievet, J.P. Lagier, B. Blin, B. Beaudoin, M. Figlarz, Solid State Ionics 32–3 (1989)
198–205.53] S.E. Skrabalak, B.J. Wiley, M. Kim, E.V. Formo, Y. Xia, Nano Lett. 8 (2008)
2077–2081.54] Z.G. Wang, Y. Hu, W.L. Yang, M.J. Zhou, X. Hu, Sensors 12 (2012) 4860–4869.55] A.V. Murugan, T. Muraliganth, A. Manthiram, Chem. Mater. 21 (2009)
5004–5006.56] D.S. Li, S. Komarneni, J. Am. Ceram. Soc. 89 (2006) 1510–1517.57] R. Roy, D. Agarwal, J.P. Chen, S. Gedevanishvili, Nature 399 (1999) 668–670.58] N. Yoshikawa, J. Microwave Power 44 (2010) 4–13.59] J. Obrzut, J.F. Douglas, O. Kirillov, F. Sharifi, J.A. Liddle, Langmuir (2013)
9010–9015.60] K.N. Yu, D.J. Kim, H.S. Chung, H.Z. Liang, Mater. Lett. 57 (2003) 3992–3997.
61] A. Agrawal, P.G. Tratnyek, Environ. Sci. Technol. 30 (1995) 153–160.62] J. Cheng, P. Hu, P. Ellis, S. French, G. Kelly, C.M. Lok, J. Phys. Chem. C 112 (2008)1308–1311.63] Y. Xu, A.V. Ruban, M. Mavrikakis, J. Am. Chem. Soc. 126 (2004) 4717–4725.64] J.A. Johnson, J.J. Makis, K.A. Marvin, S.E. Rodenbusch, K.J. Stevenson, J. Phys.
Chem. C 117 (2013) 22644–22651.

![Applied Catalysis A: General - Unive Cat... · Applied Catalysis A: General 472 (2014) 167–177 Contents ... synthesis [5]. Acetaminophen production is in continuous growth and its](https://img.pdfslide.net/doc/110x75/5a78794e7f8b9a87198bd194/applied-catalysis-a-general-unive-cat-applied-catalysis-a-general-472.jpg)


![Applied Catalysis B: Environmental · Zouzelka, J. Rathousky / Applied Catalysis B: Environmental 217 (2017) 466–476 467 and less than 0.2% heavy-duty trucks [6]. Kurtenbach et](https://img.pdfslide.net/doc/110x75/5e6f607b14be311c03767ea3/applied-catalysis-b-environmental-zouzelka-j-rathousky-applied-catalysis-b.jpg)