Embed Size (px)
Citation preview
This article was downloaded by: [University of Connecticut]On: 04 October 2014, At: 16:08Publisher: Taylor & FrancisInforma Ltd Registered in England and Wales Registered Number: 1072954 Registered office: MortimerHouse, 37-41 Mortimer Street, London W1T 3JH, UK
Journal of MapsPublication details, including instructions for authors and subscription information:http://www.tandfonline.com/loi/tjom20
Applied geomorphological map of the PortofinoMunicipal Territory (Italy)Francesco Faccini a , Mauro Piccazzo b , Andrea Robbiano c & Anna Roccati ba University of Genoa, DISAM , via Balbi 2, 16126 , Genova , Italy E-mail:b University of Genoa, DIP.TE.RIS. , corso Europa 32, 16132 , Genova , Italyc Consultant geologist , via Capolungo 46, 16167 , Genova , ItalyPublished online: 23 Jan 2012.
To cite this article: Francesco Faccini , Mauro Piccazzo , Andrea Robbiano & Anna Roccati (2008) Appliedgeomorphological map of the Portofino Municipal Territory (Italy), Journal of Maps, 4:1, 451-462, DOI: 10.4113/jom.2008.1023
To link to this article: http://dx.doi.org/10.4113/jom.2008.1023
PLEASE SCROLL DOWN FOR ARTICLE
Taylor & Francis makes every effort to ensure the accuracy of all the information (the “Content”) containedin the publications on our platform. However, Taylor & Francis, our agents, and our licensors make norepresentations or warranties whatsoever as to the accuracy, completeness, or suitability for any purpose ofthe Content. Any opinions and views expressed in this publication are the opinions and views of the authors,and are not the views of or endorsed by Taylor & Francis. The accuracy of the Content should not be reliedupon and should be independently verified with primary sources of information. Taylor and Francis shallnot be liable for any losses, actions, claims, proceedings, demands, costs, expenses, damages, and otherliabilities whatsoever or howsoever caused arising directly or indirectly in connection with, in relation to orarising out of the use of the Content.
This article may be used for research, teaching, and private study purposes. Any substantial or systematicreproduction, redistribution, reselling, loan, sub-licensing, systematic supply, or distribution in anyform to anyone is expressly forbidden. Terms & Conditions of access and use can be found at http://www.tandfonline.com/page/terms-and-conditions
Journal of Maps, 2008, 451-462
Applied geomorphological map of the
Portofino Municipal Territory (Italy)
FRANCESCO FACCINI1, MAURO PICCAZZO2, ANDREA ROBBIANO3
and ANNA ROCCATI2
1University of Genoa, DISAM, via Balbi 2, 16126 Genova, Italy; [email protected]
2University of Genoa, DIP.TE.RIS., corso Europa 32, 16132 Genova, Italy.
3Consultant geologist, via Capolungo 46, 16167 Genova, Italy.
(Received 21st April 2008; Revised 12th September 2008; Accepted 16th September 2008)
Abstract: Here we present an applied geomorphological map at a scale of 1:5,000 of thePortofino territory (Italy). The map was compiled by combining available geological andhydrogeological information with a new geomorphological field survey and data derivedfrom geotechnical studies carried out for town planning and building purposes. Portofinois one of the most well known old town centres; its territory is entirely included in thePark of the same name created in 1935. This charming village is located at the mouth ofFondaco Stream. Although the catchment has a limited size - its highest altitude is justover 200 m a.s.l. - the watercourse drainage culverts built in the late 19th century causehazards caused by gravity, flowing water and wave action. We used the followingmethods: a) bibliographic and map research of scientific papers; b) a geological fieldsurvey, preceded by photo interpretation; c) stratigraphic and geotechnical datacollection where building sites are located; and d) laboratory tests to determine rockstrength. This paper presents an example of geocartography that could be applied toland planning in areas with high landscape value but threatened by geomorphologicalhazards.
ISSN 1744-5647http://www.journalofmaps.com
451
Dow
nloa
ded
by [
Uni
vers
ity o
f C
onne
ctic
ut]
at 1
6:08
04
Oct
ober
201
4
Journal of Maps, 2008, 451-462 Faccini, F., Piccazzo, M. et al.
1. Introduction
Applied geomorphological maps have been recognized as one of the maintools for land management planning and works scheduling from theperspective of both town planning-building and environmental and soilprotection. Such thematic maps, showing the geological, geomorphological,hydrogeological and geo-engineering territory features, providecomprehensive and integrated representations of relief landforms,hydrographic networks and shallow materials and their dynamics (Bell,1998). They also provide useful information concerning the mostappropriate studies and choices for monitoring and avoiding hazardoussituations.
This paper presents a case-study of an engineering geomorphological mapfor the Portofino municipal territory, an international tourist attraction onthe Riviera Ligure. It is a relatively small area at 2.55 km2 and is locatedat the south-eastern end of the Portofino Promontory. It is characterized bylandforms and deposits created by gravity, flowing water and wave action,which represent the causes of relief evolution in this area.
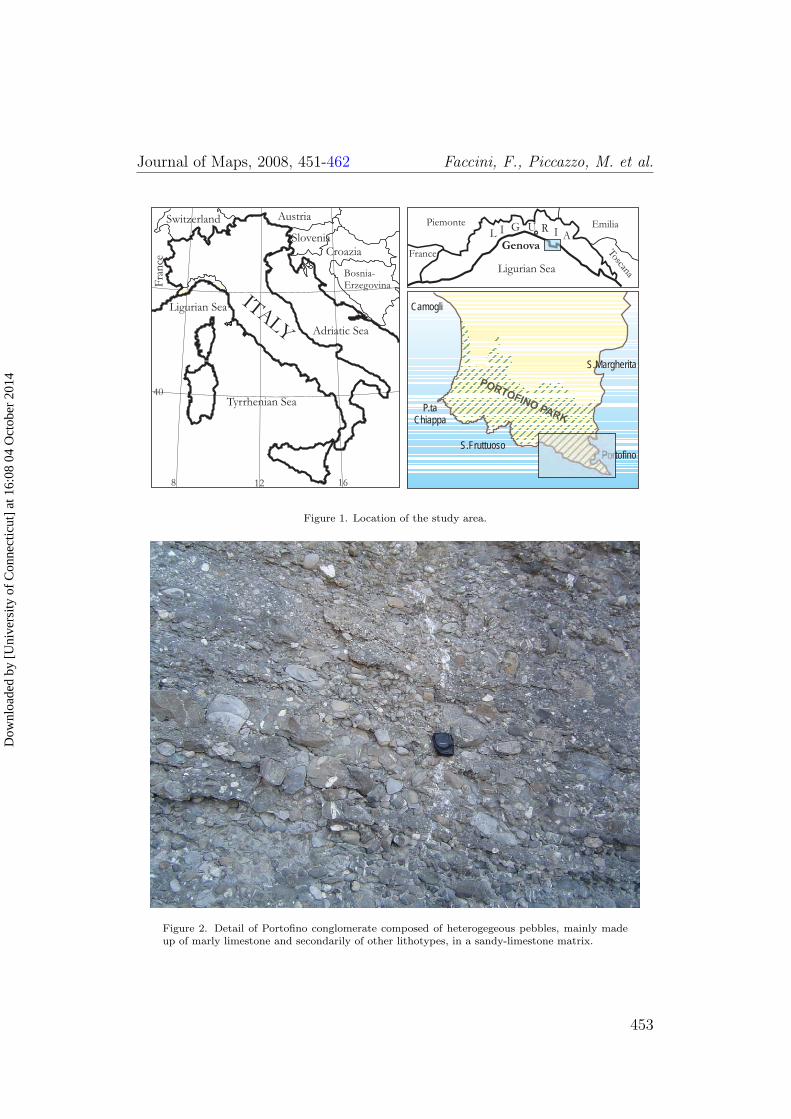
The studied area is entirely included in the Regional Natural Park ofPortofino, which was declared a protected area in 1935. Its boundaries werenewly defined in 2001 (Figure 1).
2. Geological and Climatic Settings
The Portofino territory bedrock is represented by the Portofinoconglomerate, composed of heterogeneous pebbles, mainly of marlylimestone and secondarily of other lithotypes, in a sandy-limestone matrix(Figure 2). The general setting is monoclinal, with a dip direction towardthe S-SE and dips ranging from 10 to 30◦ (Giammarino et al., 1969;De Stefanis et al., 1984). The conglomerate features fragile deformationtectonics shown by some faults and lineation systems, generally orthogonalto one another, which strongly control geomorphological landforms andprocesses (Cevasco et al., 2004).
The climate is typical of the Mediterranean, with hot summers and mild
452
Dow
nloa
ded
by [
Uni
vers
ity o
f C
onne
ctic
ut]
at 1
6:08
04
Oct
ober
201
4
Journal of Maps, 2008, 451-462 Faccini, F., Piccazzo, M. et al.
Portofino
PORTOFINOPARK
Camogli
P.taChiappa
S.Fruttuoso
S.Margherita
Genova
Ligurian Sea
Toscana
EmiliaPiemonte
France
L I G U R I A
16
40
128
ITALYLigurian Sea
Tyrrhenian Sea
Adriatic Sea
CroaziaSlovenia
AustriaSwitzerland
Fra
nce
Bosnia-Erzegovina
Figure 1. Location of the study area.
Figure 2. Detail of Portofino conglomerate composed of heterogegeous pebbles, mainly madeup of marly limestone and secondarily of other lithotypes, in a sandy-limestone matrix.
453
Dow
nloa
ded
by [
Uni
vers
ity o
f C
onne
ctic
ut]
at 1
6:08
04
Oct
ober
201
4
Journal of Maps, 2008, 451-462 Faccini, F., Piccazzo, M. et al.
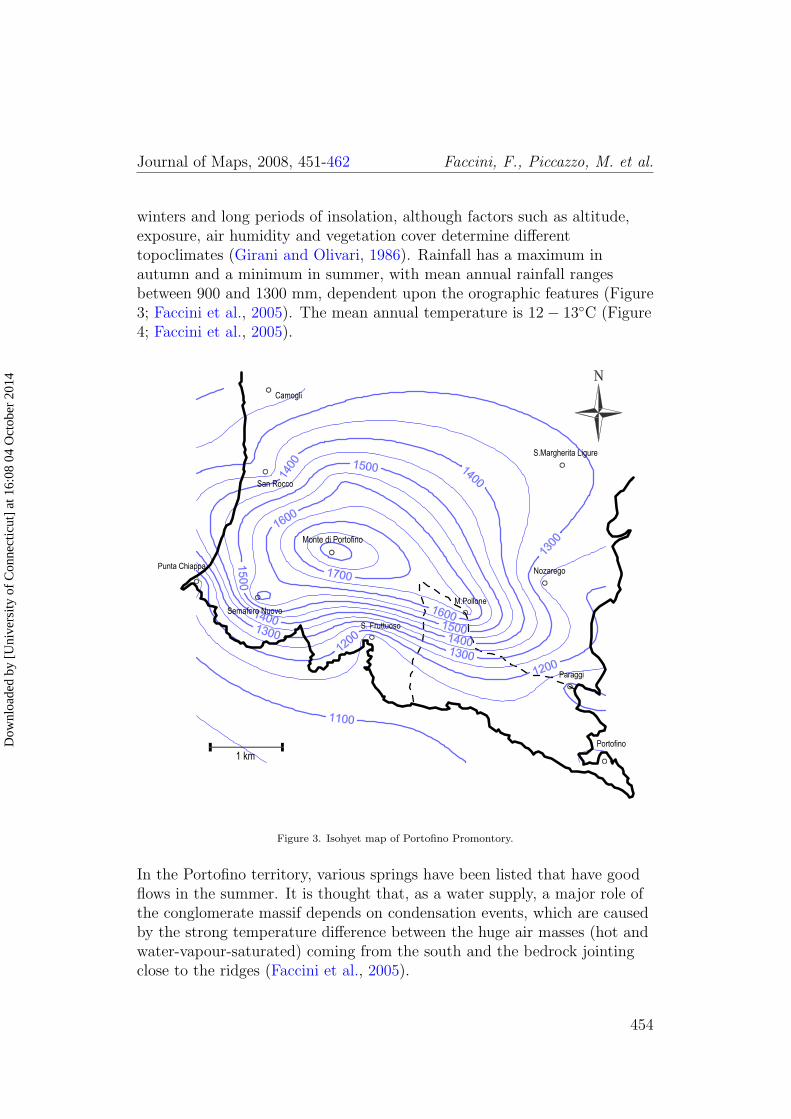
winters and long periods of insolation, although factors such as altitude,exposure, air humidity and vegetation cover determine differenttopoclimates (Girani and Olivari, 1986). Rainfall has a maximum inautumn and a minimum in summer, with mean annual rainfall rangesbetween 900 and 1300 mm, dependent upon the orographic features (Figure3; Faccini et al., 2005). The mean annual temperature is 12− 13◦C (Figure4; Faccini et al., 2005).
Camogli
San Rocco
Semaforo Nuovo
S.Margherita Ligure
Nozarego
Portofino
1 km
M.Pollone
Punta Chiappa
Monte di Portofino
S. Fruttuoso
Paraggi
Figure 3. Isohyet map of Portofino Promontory.
In the Portofino territory, various springs have been listed that have goodflows in the summer. It is thought that, as a water supply, a major role ofthe conglomerate massif depends on condensation events, which are causedby the strong temperature difference between the huge air masses (hot andwater-vapour-saturated) coming from the south and the bedrock jointingclose to the ridges (Faccini et al., 2005).
454
Dow
nloa
ded
by [
Uni
vers
ity o
f C
onne
ctic
ut]
at 1
6:08
04
Oct
ober
201
4

Journal of Maps, 2008, 451-462 Faccini, F., Piccazzo, M. et al.
Camogli
San Rocco
Semaforo Nuovo
S.Margherita Ligure
Nozarego
Portofino
1 km
M.Pollone
Punta Chiappa
Monte di Portofino
S. Fruttuoso
Paraggi
Figure 4. Isotherm map of Portofino Promontory.
3. Methods
The construction of the map involved a preliminary bibliographic and mapresearch of applied geomorphological scientific notes and land planningtools, with later geotechnical studies undertaken for building andenvironmental protection purposes in the municipality.
Bibliographic information was integrated with an accurate geological fieldsurvey, preceded by the interpretation of aerial photos from the LigurianRegion at a scale of 1:13,000. The results are shown on the Portofinoapplied geomorphological map, at a scale 1:5,000 which shows thegeological, geomorphological, hydrogeological and geo-engineering featuresof the municipality territory. In order to compile the map, we utilised two
455
Dow
nloa
ded
by [
Uni
vers
ity o
f C
onne
ctic
ut]
at 1
6:08
04
Oct
ober
201
4

Journal of Maps, 2008, 451-462 Faccini, F., Piccazzo, M. et al.
standard legend systems that have been employed for geological (ServizioGeologico Italiano, 1994) and geomorphological (Gruppo Nazionale diGeografia Fisica e Geomorfologia, 1993) mapping in Italy, highlighting thelandforms, processes and deposits involved in geomorphological dynamicsand distinguishing them according to their origin, activity and possibleevolution.
Hydrogeological lineaments were highlighted by adapting the nationalguidelines to local needs (Servizio Geologico Italiano, 1995); the methodfollowed for defining geomaterial lithotechnical features is based upon theUnified Soil Classification System and British Soil Classification Systemclassifications, with a primary division between coarse and cohesive soils(Bell, 1998; Agili et al., 2005). Bedrock characterization was developed byfollowing the Geological Strength Index (Marinos and Hoek, 2000), which isbased upon the Rock Mass Rating (Bieniawski, 1989). The structural datacollected at measurement stations were integrated by test assessments so asto evaluate the Joint Wall Compressive Strength (JCS).
Assessments were carried out using the Schmidt Hammer and the UniaxialCompressive Strength (C0); the latter was determined through a number oftests following the Point Load Test.
4. Results and Discussion
The map shows geological and structural elements, hydrography andmeteomarine items, hillslope landforms due to gravity, fluvial and hillslopelandforms due to flowing water, marine landforms and anthropogeniclandforms with stratigraphic and geotechnical prospecting points. A sketchmap summarizes the lithotechnical and hydrogeological profiles, with anoutline of the geological-tectonic regional setting completing the thematicmap.
Geological-tectonic elements of areas with outcropping conglomerate, suchas along ridges and cliffs, were distinguished from those where major eluvialcover is observed; furthermore, areas where the bedrock appears to bestrongly fractured were distinguished.
The observed tectonic lineations can be grouped into several main
456
Dow
nloa
ded
by [
Uni
vers
ity o
f C
onne
ctic
ut]
at 1
6:08
04
Oct
ober
201
4
Journal of Maps, 2008, 451-462 Faccini, F., Piccazzo, M. et al.
directions: roughly WNW-ESE, NNE-SSW, N-S and E-W.
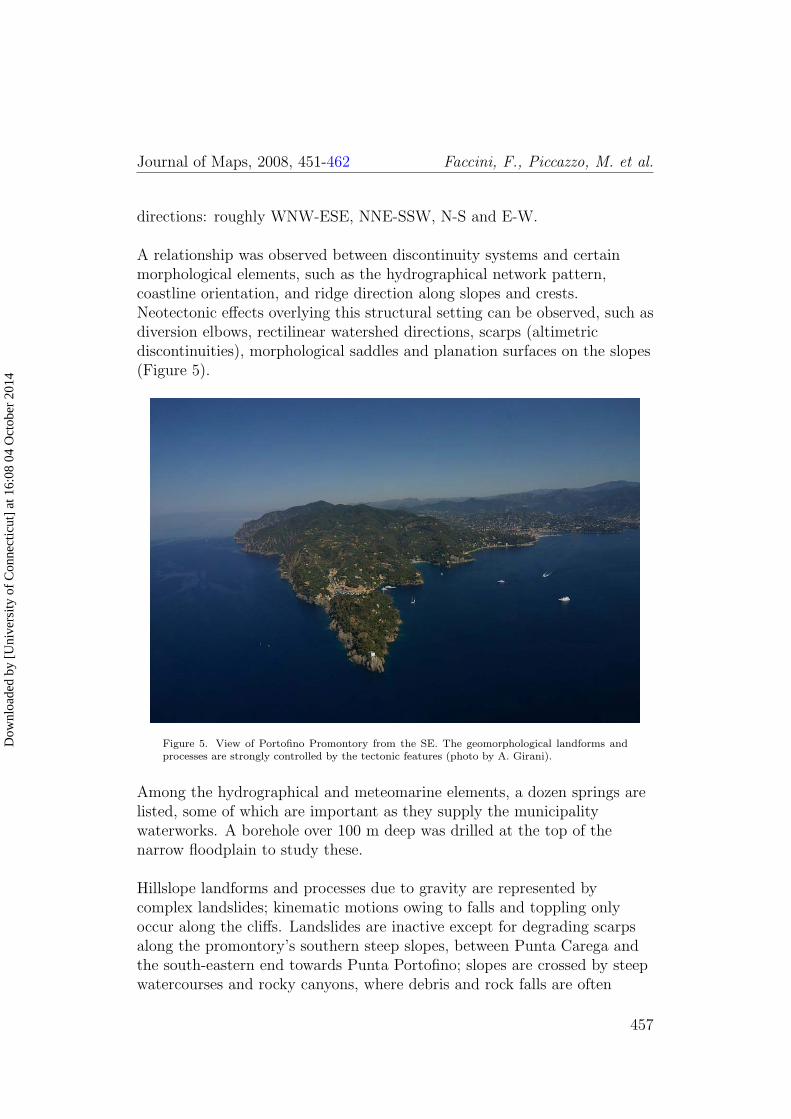
A relationship was observed between discontinuity systems and certainmorphological elements, such as the hydrographical network pattern,coastline orientation, and ridge direction along slopes and crests.Neotectonic effects overlying this structural setting can be observed, such asdiversion elbows, rectilinear watershed directions, scarps (altimetricdiscontinuities), morphological saddles and planation surfaces on the slopes(Figure 5).
Figure 5. View of Portofino Promontory from the SE. The geomorphological landforms andprocesses are strongly controlled by the tectonic features (photo by A. Girani).
Among the hydrographical and meteomarine elements, a dozen springs arelisted, some of which are important as they supply the municipalitywaterworks. A borehole over 100 m deep was drilled at the top of thenarrow floodplain to study these.
Hillslope landforms and processes due to gravity are represented bycomplex landslides; kinematic motions owing to falls and toppling onlyoccur along the cliffs. Landslides are inactive except for degrading scarpsalong the promontory’s southern steep slopes, between Punta Carega andthe south-eastern end towards Punta Portofino; slopes are crossed by steepwatercourses and rocky canyons, where debris and rock falls are often
457
Dow
nloa
ded
by [
Uni
vers
ity o
f C
onne
ctic
ut]
at 1
6:08
04
Oct
ober
201
4
Journal of Maps, 2008, 451-462 Faccini, F., Piccazzo, M. et al.
located (Vallone Ruffinale and Vescini).
Among fluvial landforms and processes due to outwashing, colluvialdeposits are observed along the secondary valley slopes, often subtended bydenudation scarps.
The hydrographic network is formed by short and linear torrentialwatercourses along tectonic lineations; these carry large solid debris and,owing to their steepness, often gather debris flows.
Alluvial deposits are limited to a narrow strip, now entirely covered by thebuilt-up area.
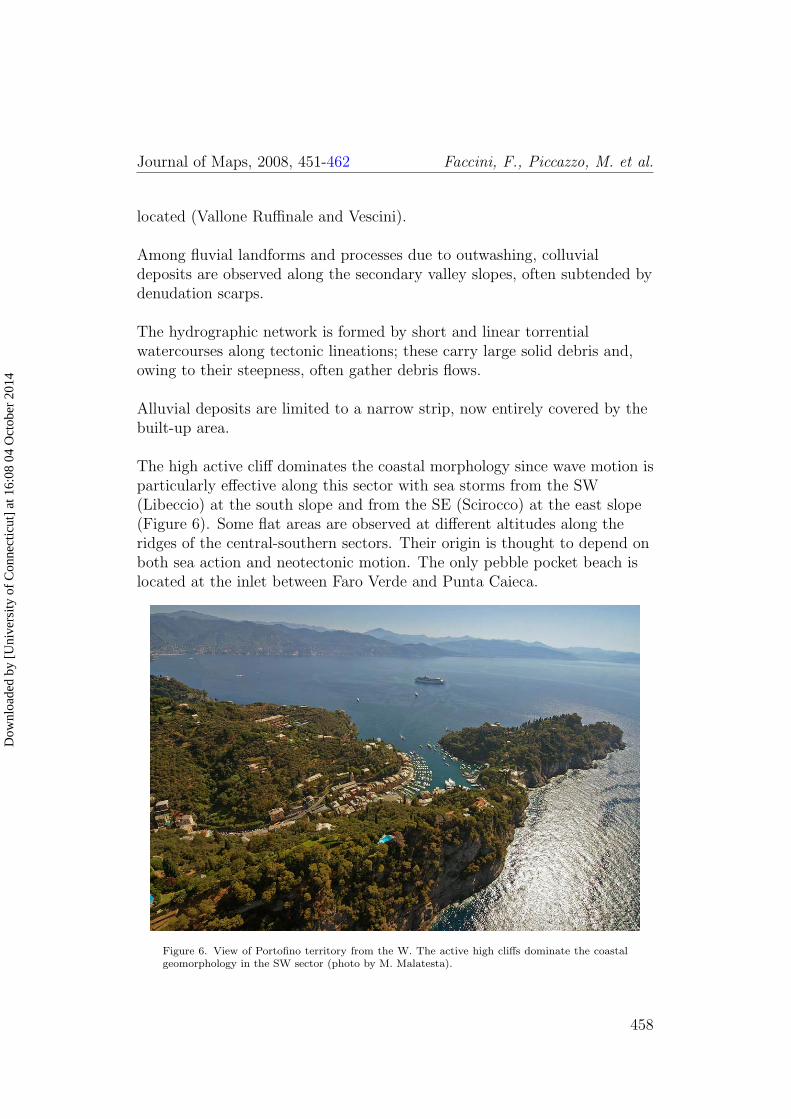
The high active cliff dominates the coastal morphology since wave motion isparticularly effective along this sector with sea storms from the SW(Libeccio) at the south slope and from the SE (Scirocco) at the east slope(Figure 6). Some flat areas are observed at different altitudes along theridges of the central-southern sectors. Their origin is thought to depend onboth sea action and neotectonic motion. The only pebble pocket beach islocated at the inlet between Faro Verde and Punta Caieca.
Figure 6. View of Portofino territory from the W. The active high cliffs dominate the coastalgeomorphology in the SW sector (photo by M. Malatesta).
458
Dow
nloa
ded
by [
Uni
vers
ity o
f C
onne
ctic
ut]
at 1
6:08
04
Oct
ober
201
4
Journal of Maps, 2008, 451-462 Faccini, F., Piccazzo, M. et al.
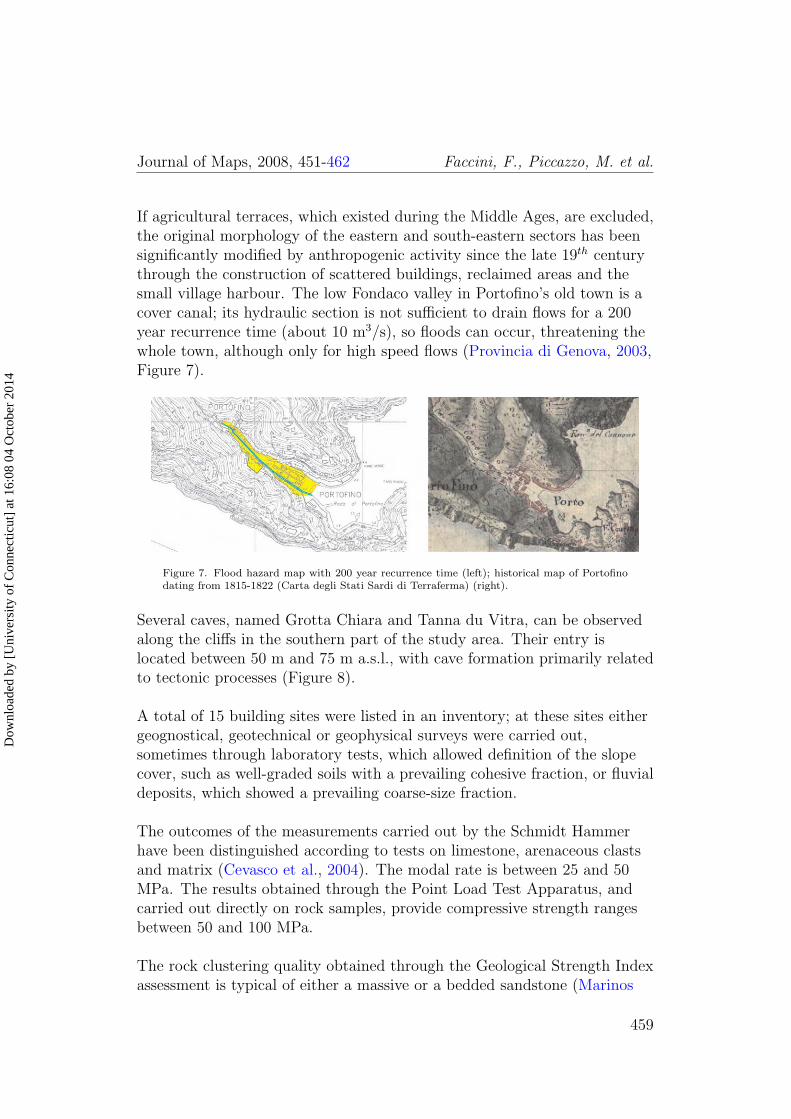
If agricultural terraces, which existed during the Middle Ages, are excluded,the original morphology of the eastern and south-eastern sectors has beensignificantly modified by anthropogenic activity since the late 19th centurythrough the construction of scattered buildings, reclaimed areas and thesmall village harbour. The low Fondaco valley in Portofino’s old town is acover canal; its hydraulic section is not sufficient to drain flows for a 200year recurrence time (about 10 m3/s), so floods can occur, threatening thewhole town, although only for high speed flows (Provincia di Genova, 2003,Figure 7).
Figure 7. Flood hazard map with 200 year recurrence time (left); historical map of Portofinodating from 1815-1822 (Carta degli Stati Sardi di Terraferma) (right).
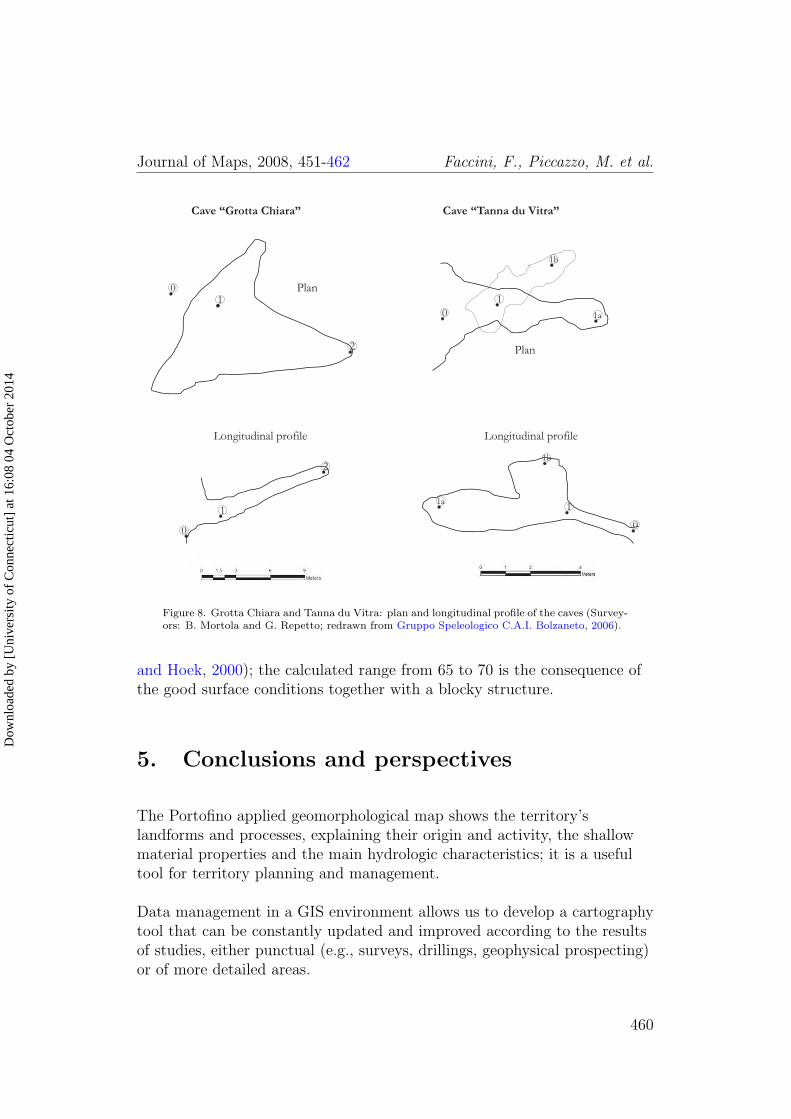
Several caves, named Grotta Chiara and Tanna du Vitra, can be observedalong the cliffs in the southern part of the study area. Their entry islocated between 50 m and 75 m a.s.l., with cave formation primarily relatedto tectonic processes (Figure 8).
A total of 15 building sites were listed in an inventory; at these sites eithergeognostical, geotechnical or geophysical surveys were carried out,sometimes through laboratory tests, which allowed definition of the slopecover, such as well-graded soils with a prevailing cohesive fraction, or fluvialdeposits, which showed a prevailing coarse-size fraction.
The outcomes of the measurements carried out by the Schmidt Hammerhave been distinguished according to tests on limestone, arenaceous clastsand matrix (Cevasco et al., 2004). The modal rate is between 25 and 50MPa. The results obtained through the Point Load Test Apparatus, andcarried out directly on rock samples, provide compressive strength rangesbetween 50 and 100 MPa.
The rock clustering quality obtained through the Geological Strength Indexassessment is typical of either a massive or a bedded sandstone (Marinos
459
Dow
nloa
ded
by [
Uni
vers
ity o
f C
onne
ctic
ut]
at 1
6:08
04
Oct
ober
201
4
Journal of Maps, 2008, 451-462 Faccini, F., Piccazzo, M. et al.
0
1a
1b
1
0
1
1b
1a
Cave “Tanna du Vitra”
Longitudinal profile
Plan
01
2
0
1
2
Cave “Grotta Chiara”
Longitudinal profile
Plan
Figure 8. Grotta Chiara and Tanna du Vitra: plan and longitudinal profile of the caves (Survey-ors: B. Mortola and G. Repetto; redrawn from Gruppo Speleologico C.A.I. Bolzaneto, 2006).
and Hoek, 2000); the calculated range from 65 to 70 is the consequence ofthe good surface conditions together with a blocky structure.
5. Conclusions and perspectives
The Portofino applied geomorphological map shows the territory’slandforms and processes, explaining their origin and activity, the shallowmaterial properties and the main hydrologic characteristics; it is a usefultool for territory planning and management.
Data management in a GIS environment allows us to develop a cartographytool that can be constantly updated and improved according to the resultsof studies, either punctual (e.g., surveys, drillings, geophysical prospecting)or of more detailed areas.
460
Dow
nloa
ded
by [
Uni
vers
ity o
f C
onne
ctic
ut]
at 1
6:08
04
Oct
ober
201
4

Journal of Maps, 2008, 451-462 Faccini, F., Piccazzo, M. et al.
Software
Corel Draw 13 was used for compiling the engineering geomorphologicalmap. Microsoft Excel 2002 was used for the rock mass characterizationhistograms. The DTM was produced from contour lines drawn on thetechnical regional map, processed by Golden Software’s Surfer 8.
Acknowledgements
The authors are indebted to the President of Portofino Park, FrancescoOlivari, to the Park Director, Alberto Girani, and to the entiretechnical-administration staff for their help and the information theyprovided.
References
AGILI, F., CECCHI, M., COLI, M., PINI, G. and RUBELLINI, P.(2005) Firenze - Carta litotecnica, Edizione S.EL.CA, Firenze.
BELL, F. G. (1998) Environmental Geology Principles and Practice,Blackwell Science Ltd, 594 pp.
BIENIAWSKI, Z. T. (1989) Engineering rock mass classifications, Wiley,New York, 251 pp.
CEVASCO, A., FACCINI, F., NOSENGO, S., OLIVARI, F. andROBBIANO, A. (2004) Valutazioni sull’uso delle classificazionigeomeccaniche nell’analisi della stabilita dei versanti rocciosi: il caso delPromontorio di Portofino (Provincia di Genova), GEAM, 11, 31–38.
DE STEFANIS, A., MARINI, M. and TERRANOVA, R. (1984)Geomorfologia di aree campione della Liguria, Edizione S.EL.CA.,Firenze.
FACCINI, F., BONINO, E., BRANDOLINI, P., PICCAZZO, M.,OLIVARI, F. and ROBBIANO, A. (2005) Phenomenes decondensation et sources perennes dans le Promontoire de Portofino
461
Dow
nloa
ded
by [
Uni
vers
ity o
f C
onne
ctic
ut]
at 1
6:08
04
Oct
ober
201
4
Journal of Maps, 2008, 451-462 Faccini, F., Piccazzo, M. et al.
(Italie), In Actes du colloque Climat Urbain, Ville et Architecture, Genes7-11 September 2005, 205-208.
GIAMMARINO, S., NOSENGO, S. and VANNUCCI, G. (1969)Risultanze geologiche-paleontologiche sul Conglomerato di Portofino(Liguria Orientale), Atti Istituto di Geologia Universita di Genova, 7,305–363.
GIRANI, A. and OLIVARI, S. (1986) Guida al Monte di Portofino,Sagep Ed., Recco, 160 pp.
GRUPPO NAZIONALE DI GEOGRAFIA FISICA EGEOMORFOLOGIA (1993) Proposta di legenda geomorfologica adindirizzo applicativo, Geografia Fisica e Dinamica Quaternaria, 129–152.
GRUPPO SPELEOLOGICO C.A.I. BOLZANETO (2006)Rilevamento e studio delle cavita naturali del Monte di Portofino -Relazione conclusiva sull’attivita svolta, Rapporto tecnico preparato perEnte Parco di Portofino.
MARINOS, P. and HOEK, E. (2000) GSI: a geologically friendly toolfor rock mass strength estimation, GeoEng 200, Melbourne.
PROVINCIA DI GENOVA (2003) Piano Stralcio di Bacino per ilRischio Idrogeologico - Ambito 15, Area 06 difesa del suolo, opereambientali e piani di bacino.
SERVIZIO GEOLOGICO ITALIANO (1994) Carta geomorfologicad’Italia 1:50000 Guida al rilevamento, A cura del Gruppo di Lavoro perla cartografia geomorfologica, Progetto CARG. Quaderni serie III, vol. 4,Istituto Poligrafico e Zecca dello Stato, Roma.
SERVIZIO GEOLOGICO ITALIANO (1995) Carta idrogeologicad’Italia 1:50000 Guida al rilevamento ed alla rappresentazione, ProgettoCARG Quaderni serie III, vol. 5, Istituto Poligrafico e Zecca dello Stato,Roma.
462
Dow
nloa
ded
by [
Uni
vers
ity o
f C
onne
ctic
ut]
at 1
6:08
04
Oct
ober
201
4