Embed Size (px)
DESCRIPTION
APPLYING LESSONS LEARNED ON MEGA PROJECTS Roger Mapp Bantrel Co. April 26, 2007. AGENDA. COST CONTROL IN VOLATILE TIMES MEETING PROJECT SCHEDULES. AGENDA. COST CONTROL IN VOLATILE TIMES MEETING PROJECT SCHEDULES. Controlling Costs – What’s New. Project size is up - PowerPoint PPT Presentation
Citation preview
APPLYING LESSONS LEARNED
ON MEGA PROJECTS
Roger Mapp
Bantrel Co.
April 26, 2007
AGENDA
COST CONTROL IN VOLATILE TIMES
MEETING PROJECT SCHEDULES
AGENDA
COST CONTROL IN VOLATILE TIMES
MEETING PROJECT SCHEDULES
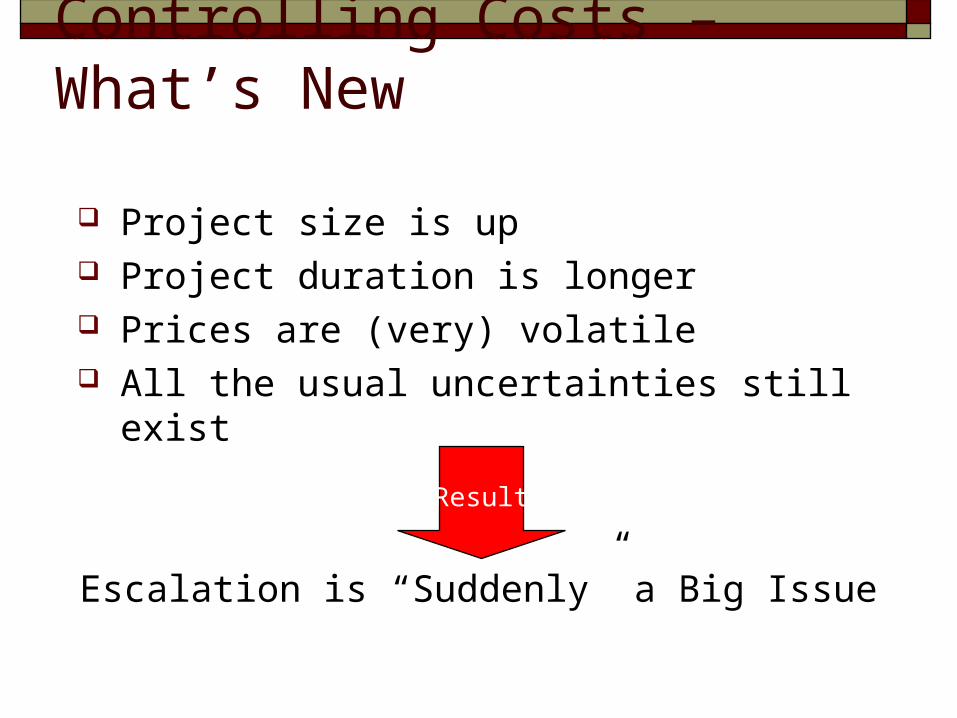
Controlling Costs – What’s New
Project size is up Project duration is longer Prices are (very) volatile All the usual uncertainties still exist
Escalation is “Suddenly” a Big Issue
Result
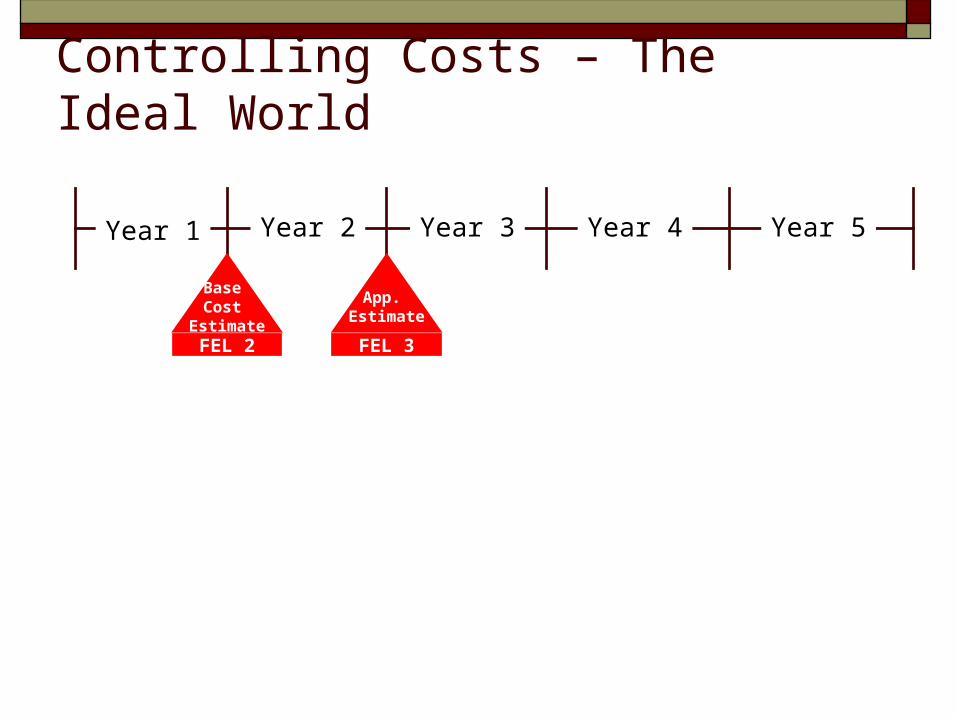
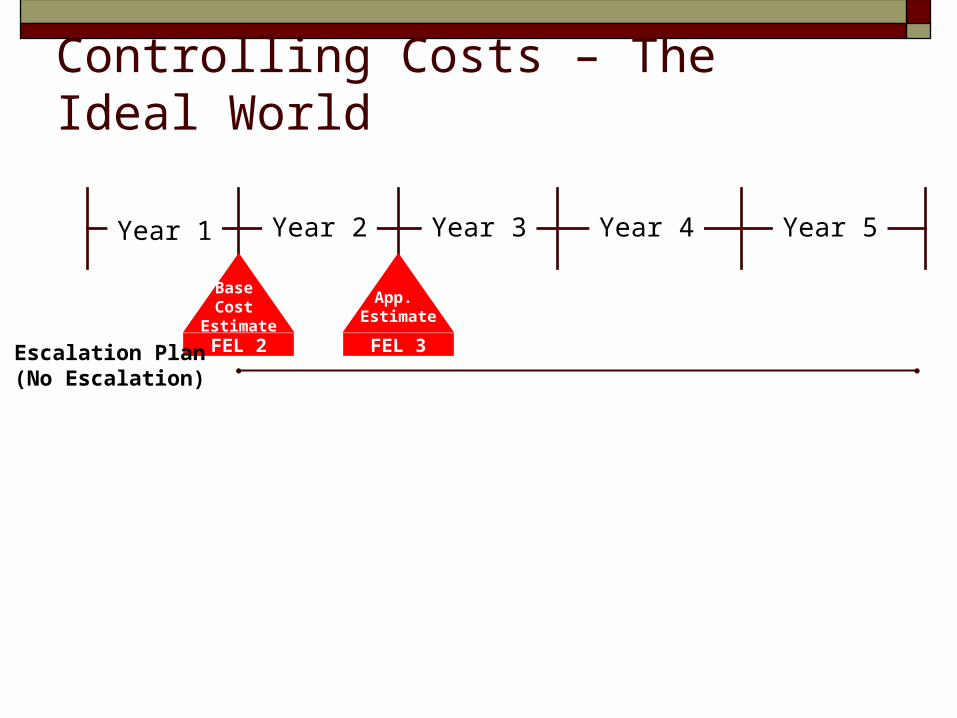
Controlling Costs – The Ideal World
Year 1 Year 2 Year 3 Year 4 Year 5
FEL 2
Base Cost
EstimateFEL 3
App. Estimate
Controlling Costs – The Ideal World
Year 1 Year 2 Year 3 Year 4 Year 5
FEL 2
Base Cost
EstimateFEL 3
App. Estimate
Escalation Plan(No Escalation)
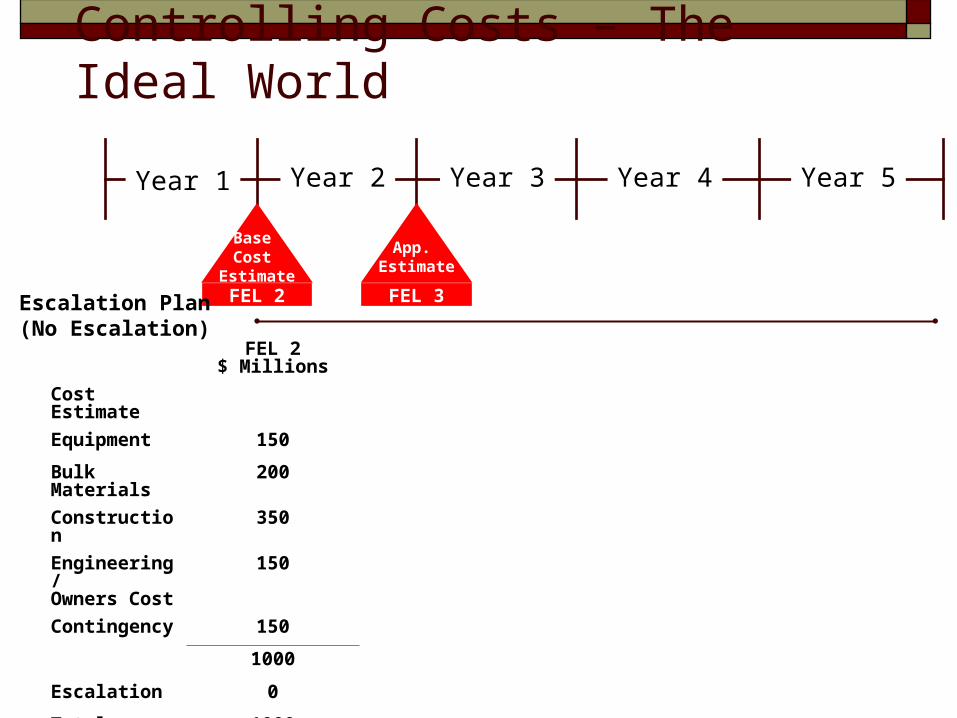
Controlling Costs – The Ideal World
Year 1 Year 2 Year 3 Year 4 Year 5
FEL 2
Base Cost
EstimateFEL 3
App. Estimate
Escalation Plan(No Escalation)
FEL 2$ Millions
Cost Estimate
Equipment 150
Bulk Materials
200
Construction 350
Engineering/Owners Cost
150
Contingency 150
1000
Escalation 0
Total Project 1000
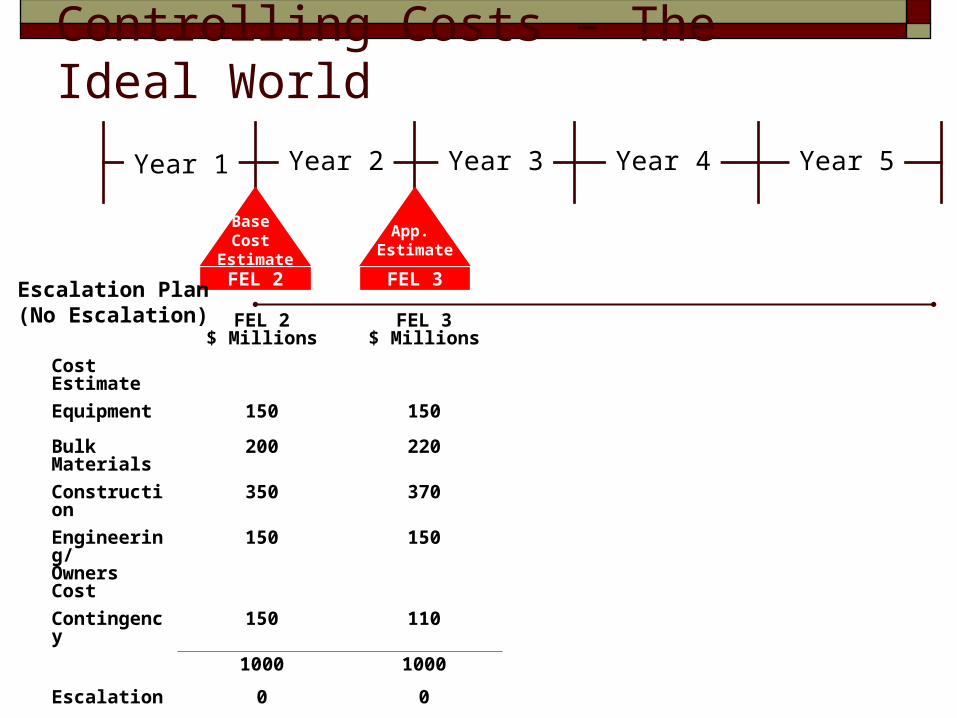
Controlling Costs – The Ideal World
Year 1 Year 2 Year 3 Year 4 Year 5
FEL 2
Base Cost
EstimateFEL 3
App. Estimate
Escalation Plan(No Escalation) FEL 2
$ MillionsFEL 3
$ Millions
Cost Estimate
Equipment 150 150
Bulk Materials
200 220
Construction 350 370
Engineering/Owners Cost
150 150
Contingency 150 110
1000 1000
Escalation 0 0
Total Project 1000 1000
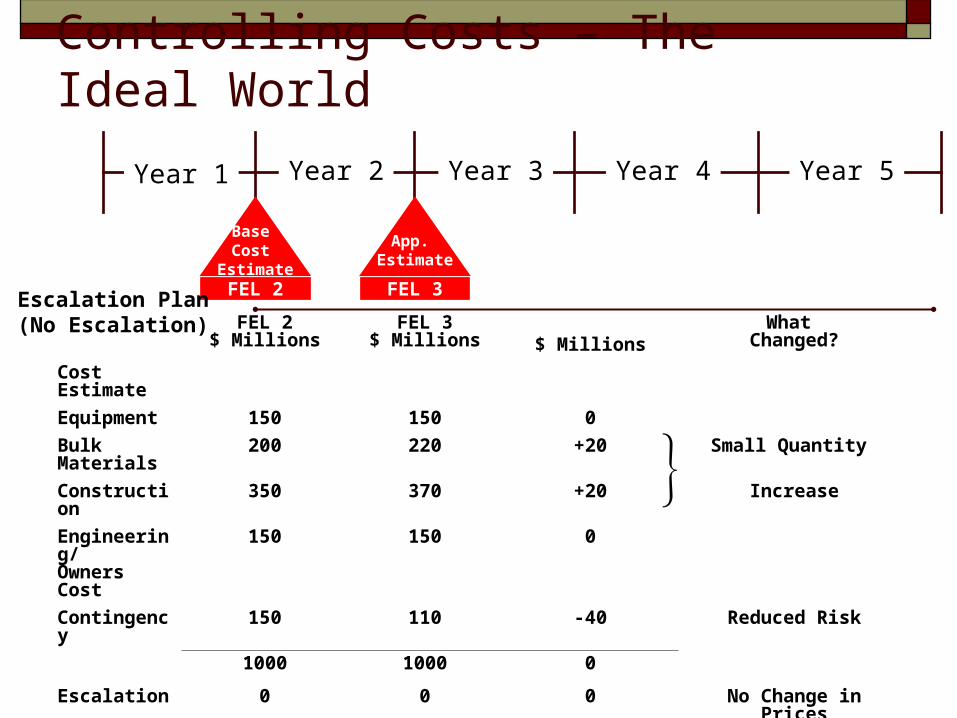
Controlling Costs – The Ideal World
Year 1 Year 2 Year 3 Year 4 Year 5
FEL 2
Base Cost
EstimateFEL 3
App. Estimate
Escalation Plan(No Escalation) FEL 2
$ MillionsFEL 3
$ Millions $ MillionsWhat
Changed?
Cost Estimate
Equipment 150 150 0
Bulk Materials
200 220 +20 Small Quantity
Construction
350 370 +20 Increase
Engineering/Owners Cost
150 150 0
Contingency 150 110 -40 Reduced Risk
1000 1000 0
Escalation 0 0 0 No Change in Prices
Total Project 1000 1000 0
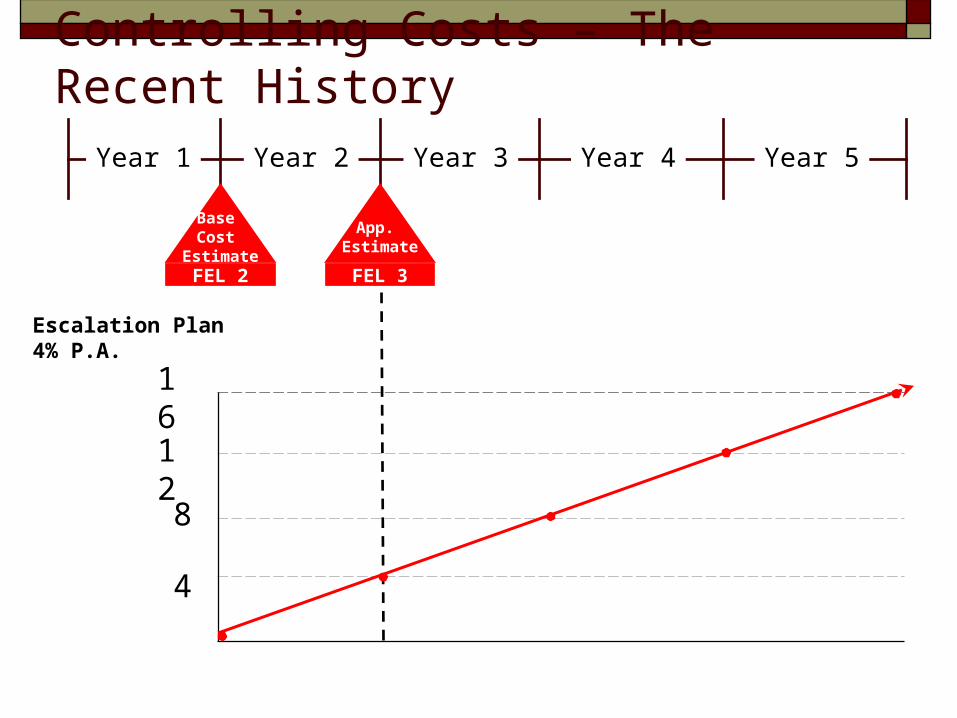
Controlling Costs – The Recent HistoryYear 1 Year 2 Year 3 Year 4 Year 5
FEL 2
Base Cost
EstimateFEL 3
App. Estimate
Escalation Plan4% P.A.
4
8
12
16
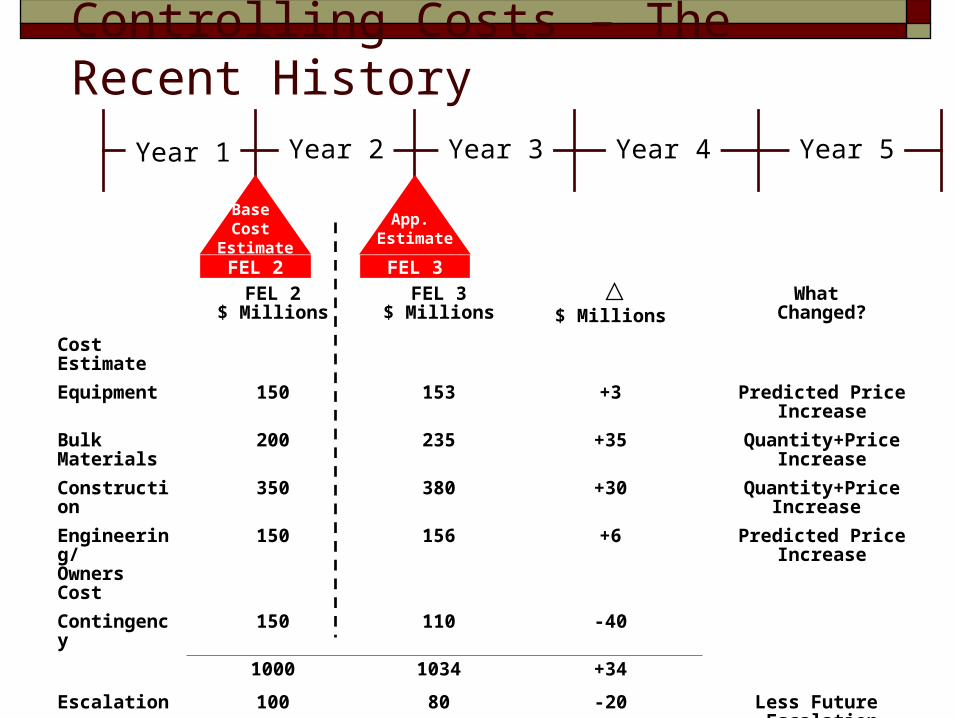
Controlling Costs – The Recent History
Year 1 Year 2 Year 3 Year 4 Year 5
FEL 2
Base Cost
EstimateFEL 3
App. Estimate
FEL 2$ Millions
FEL 3$ Millions $ Millions
What Changed?
Cost Estimate
Equipment 150 153 +3 Predicted Price Increase
Bulk Materials
200 235 +35 Quantity+Price Increase
Construction 350 380 +30 Quantity+Price Increase
Engineering/Owners Cost
150 156 +6 Predicted Price Increase
Contingency 150 110 -40
1000 1034 +34
Escalation 100 80 -20 Less Future Escalation
Total Project 1100 1114 +14
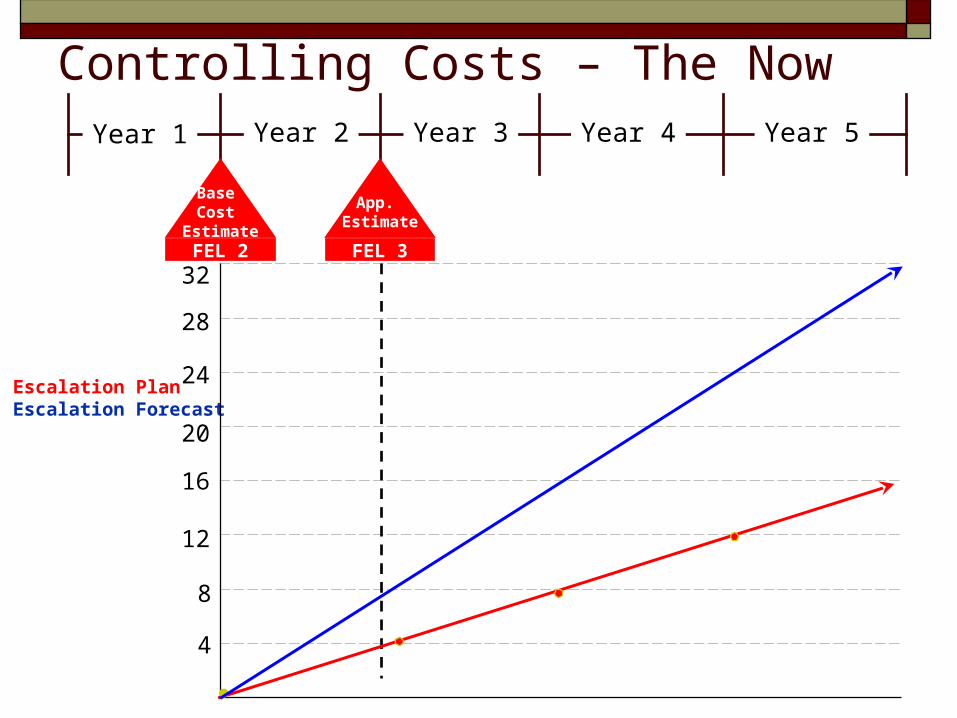
Controlling Costs – The NowYear 1 Year 2 Year 3 Year 4 Year 5
FEL 2
Base Cost
EstimateFEL 3
App. Estimate
Escalation PlanEscalation Forecast
4
8
16
20
24
28
32
12
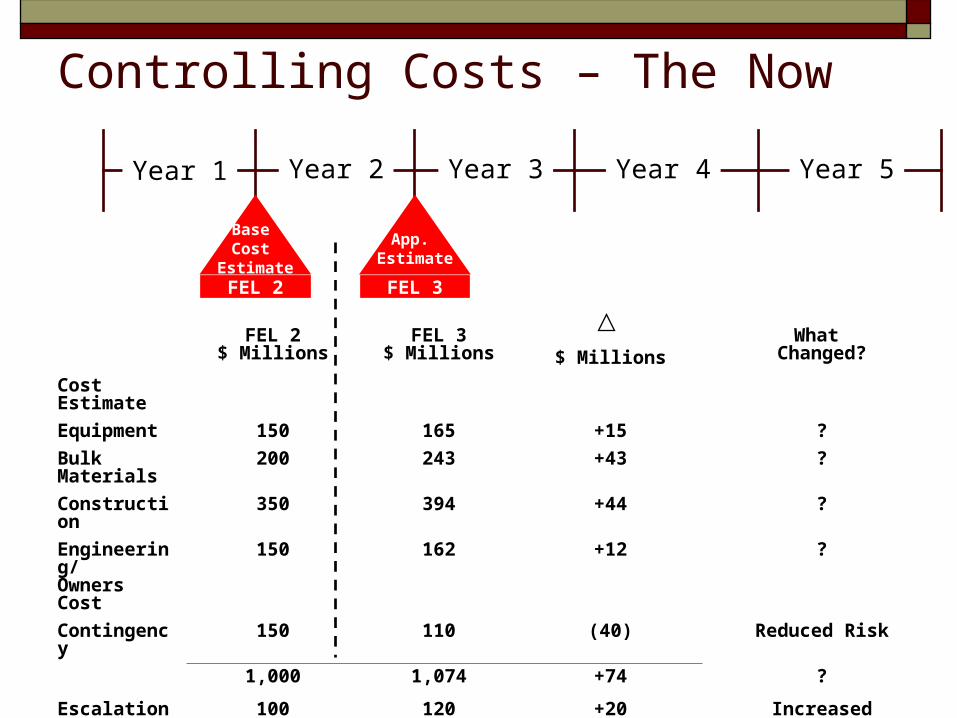
Controlling Costs – The Now
Year 1 Year 2 Year 3 Year 4 Year 5
FEL 2
Base Cost
EstimateFEL 3
App. Estimate
FEL 2$ Millions
FEL 3$ Millions $ Millions
What Changed?
Cost Estimate
Equipment 150 165 +15 ?
Bulk Materials
200 243 +43 ?
Construction 350 394 +44 ?
Engineering/Owners Cost
150 162 +12 ?
Contingency 150 110 (40) Reduced Risk
1,000 1,074 +74 ?
Escalation 100 120 +20 Increased Escalation
Total Project 1,100 1,194 +94 ?
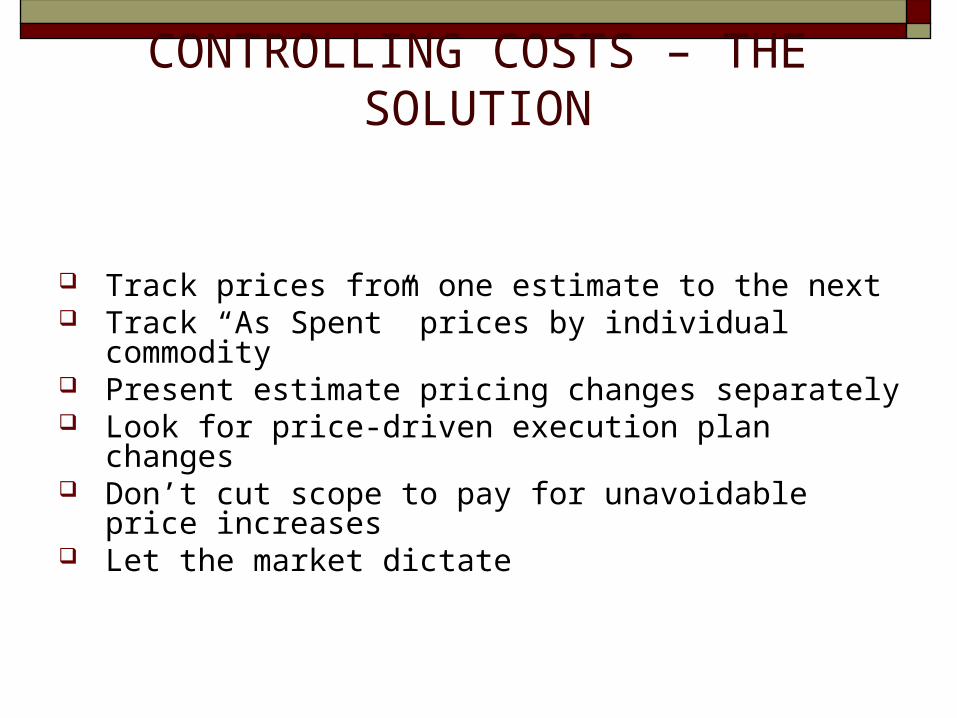
CONTROLLING COSTS – THE SOLUTION
Track prices from one estimate to the next Track “As Spent” prices by individual commodity Present estimate pricing changes separately Look for price-driven execution plan changes Don’t cut scope to pay for unavoidable price
increases Let the market dictate
AGENDA
COST CONTROL IN VOLATILE MARKET
MEETING PROJECT SCHEDULES
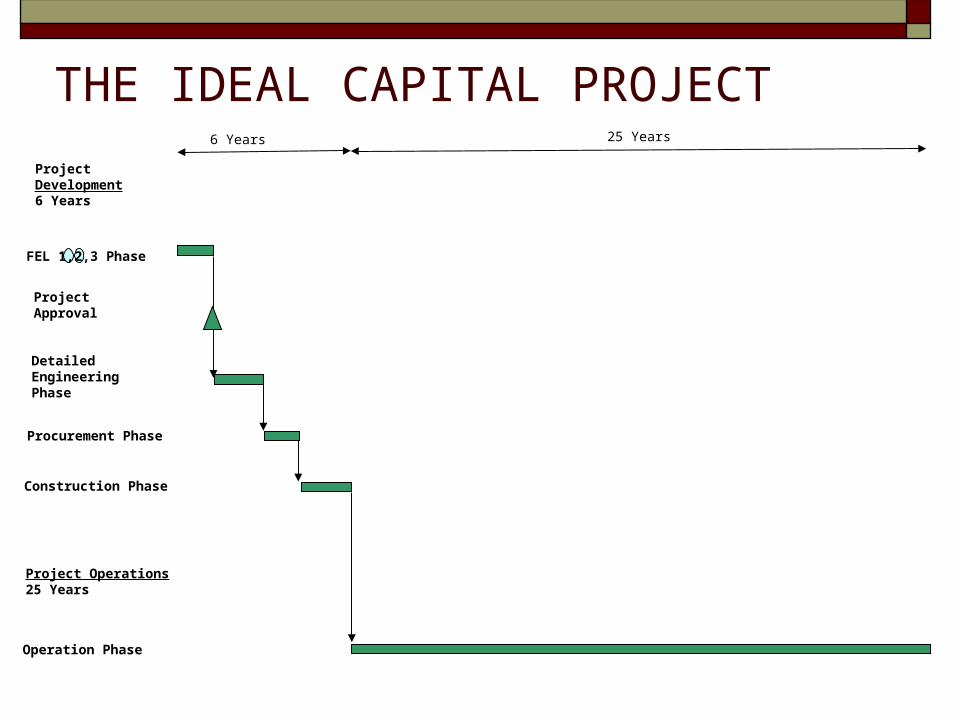
THE IDEAL CAPITAL PROJECT
Project Development6 Years
FEL 1,2,3 Phase
ProjectApproval
DetailedEngineeringPhase
Procurement Phase
Construction Phase
Project Operations25 Years
Operation Phase
6 Years 25 Years
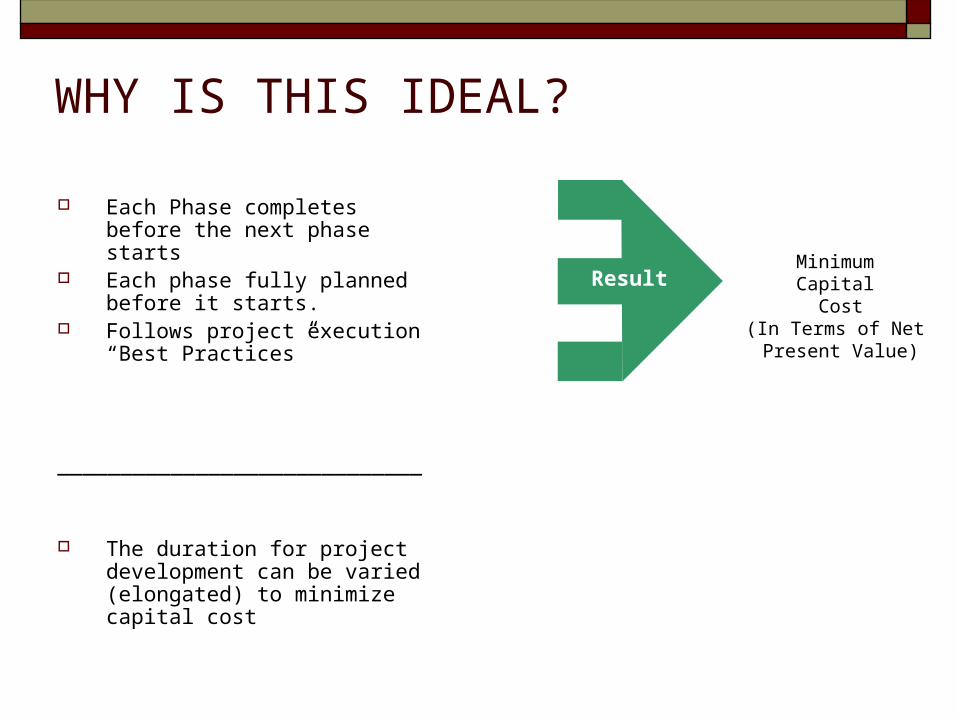
WHY IS THIS IDEAL?
Each Phase completes before the next phase starts
Each phase fully planned before it starts.
Follows project execution “Best Practices”
_____________________________
The duration for project development can be varied (elongated) to minimize capital cost
ResultMinimum Capital
Cost(In Terms of Net Present Value)
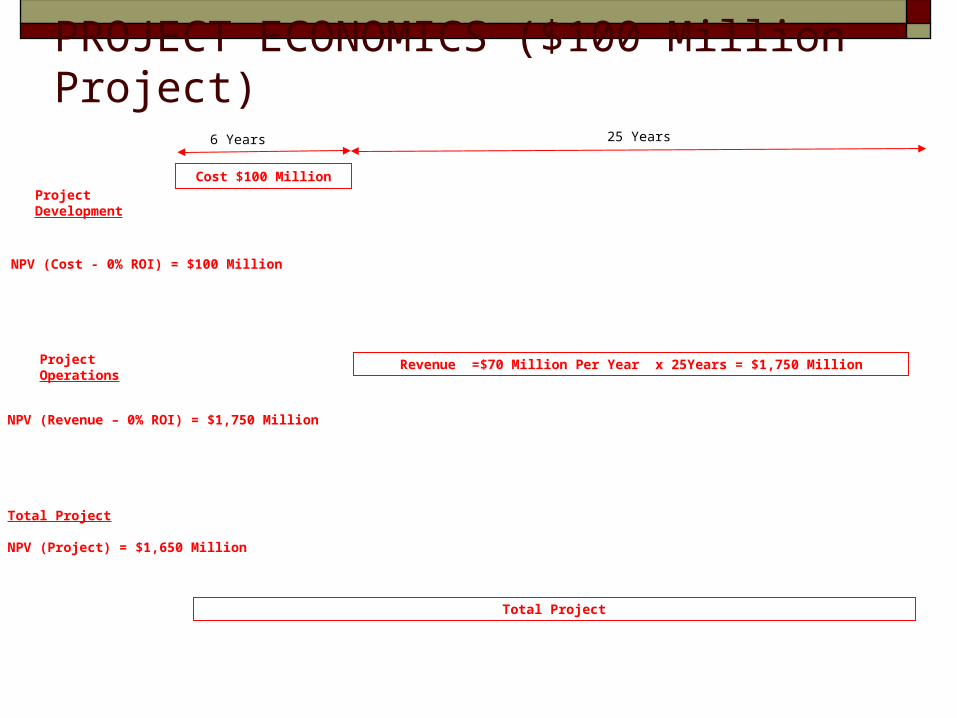
PROJECT ECONOMICS ($100 Million Project)
Project Development
NPV (Cost - 0% ROI) = $100 Million
6 Years 25 Years
Cost $100 Million
Project Operations
NPV (Revenue – 0% ROI) = $1,750 Million
Total Project
NPV (Project) = $1,650 Million
Revenue =$70 Million Per Year x 25Years = $1,750 Million
Total Project
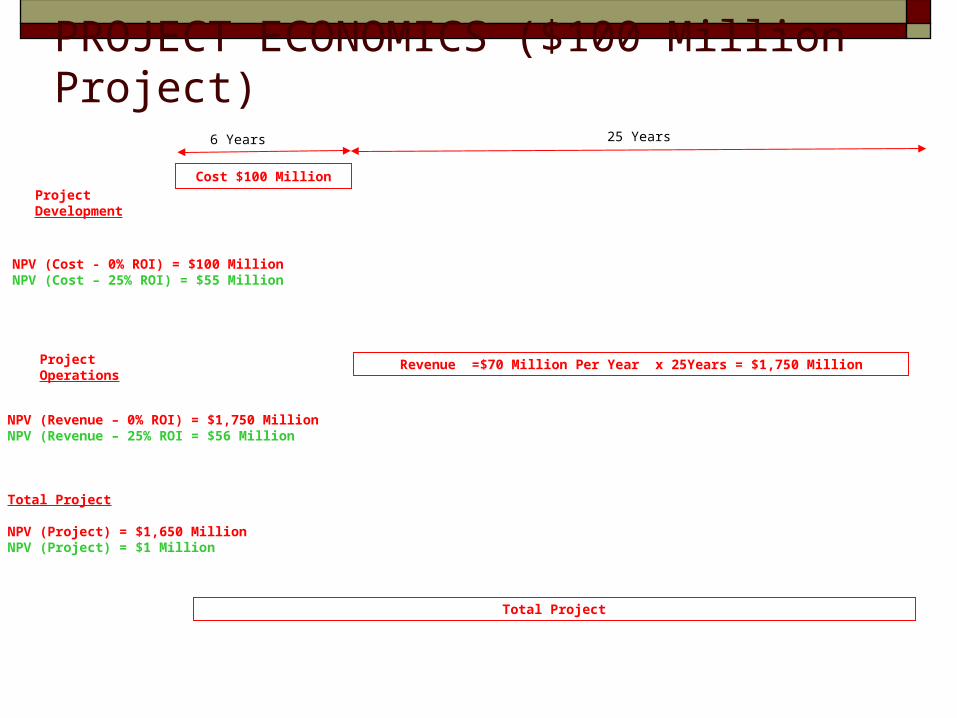
PROJECT ECONOMICS ($100 Million Project)
Project Development
NPV (Cost - 0% ROI) = $100 MillionNPV (Cost – 25% ROI) = $55 Million
6 Years 25 Years
Cost $100 Million
Project Operations
NPV (Revenue – 0% ROI) = $1,750 Million NPV (Revenue – 25% ROI = $56 Million
Total Project
NPV (Project) = $1,650 MillionNPV (Project) = $1 Million
Revenue =$70 Million Per Year x 25Years = $1,750 Million
Total Project
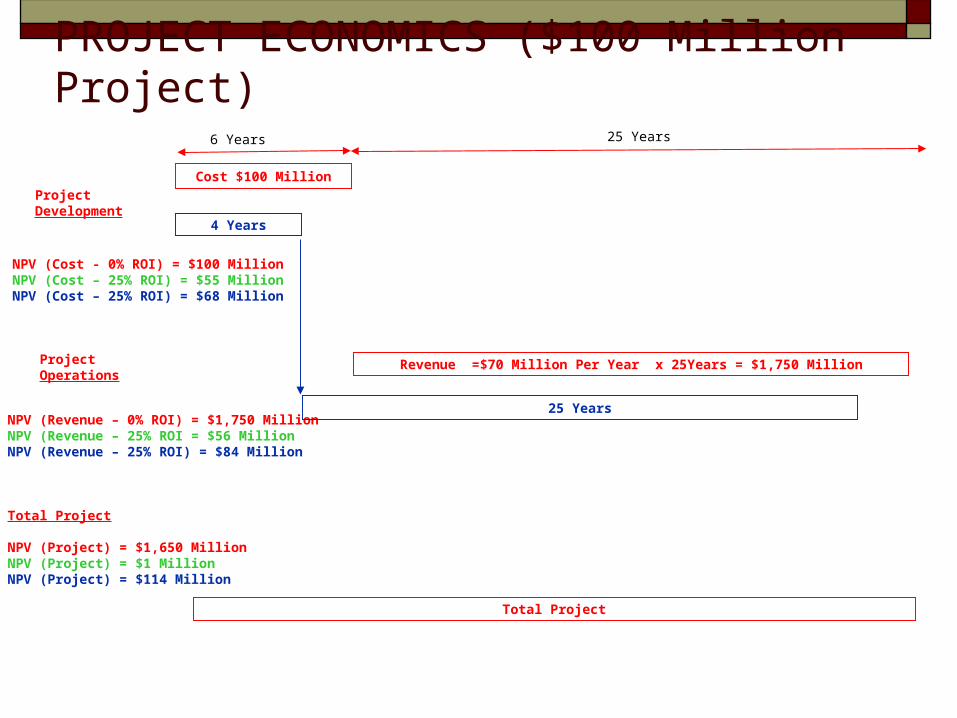
PROJECT ECONOMICS ($100 Million Project)
Project Development
NPV (Cost - 0% ROI) = $100 MillionNPV (Cost – 25% ROI) = $55 MillionNPV (Cost – 25% ROI) = $68 Million
6 Years 25 Years
Cost $100 Million
Project Operations
NPV (Revenue – 0% ROI) = $1,750 Million NPV (Revenue – 25% ROI = $56 MillionNPV (Revenue – 25% ROI) = $84 Million
Total Project
NPV (Project) = $1,650 MillionNPV (Project) = $1 MillionNPV (Project) = $114 Million
4 Years
25 Years
Revenue =$70 Million Per Year x 25Years = $1,750 Million
Total Project
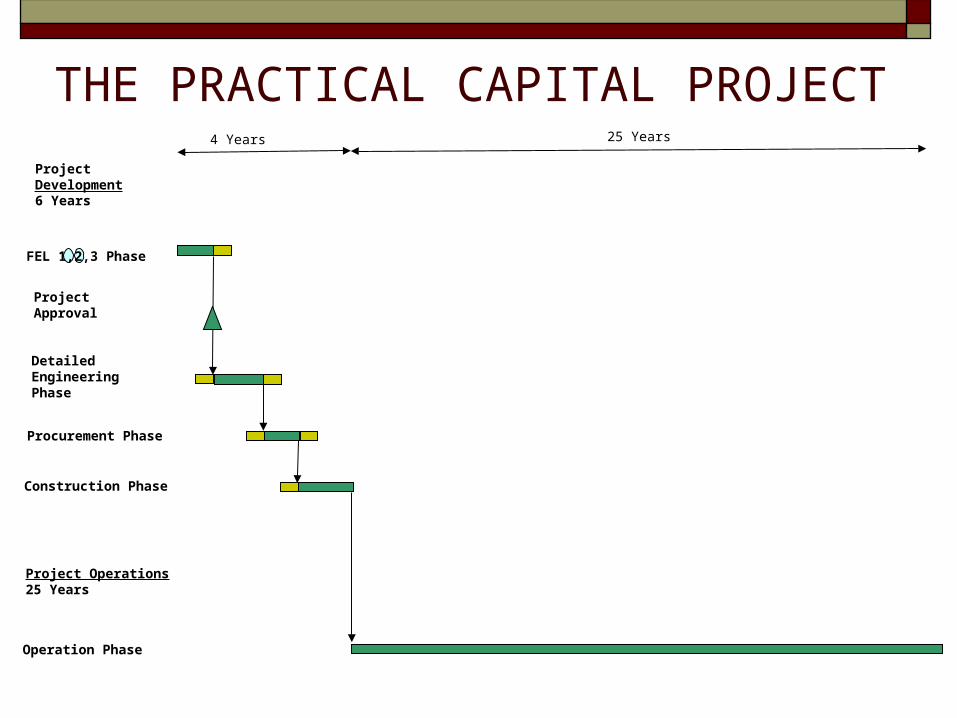
THE PRACTICAL CAPITAL PROJECT
Project Development6 Years
FEL 1,2,3 Phase
ProjectApproval
DetailedEngineeringPhase
Procurement Phase
Construction Phase
Project Operations25 Years
Operation Phase
4 Years 25 Years
EXAMPLE OF THE “PRACTICALITY”
Compression of FEL activities Applied to a $100 Million project Applied to a $ Mega Project
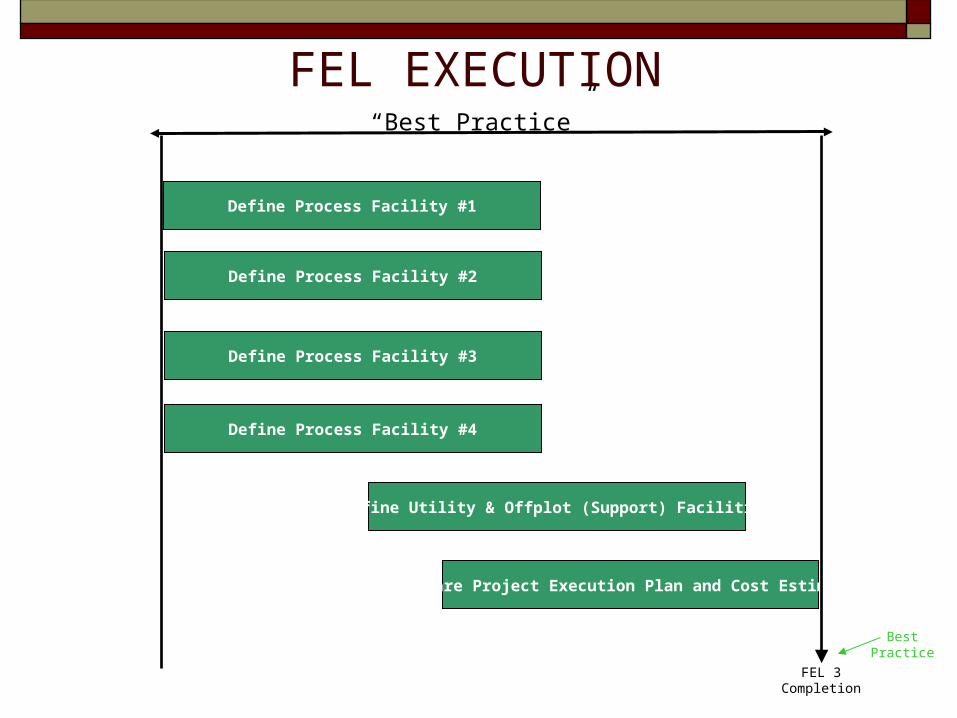
FEL EXECUTION
Define Process Facility #1
Define Process Facility #2
Define Process Facility #3
Define Process Facility #4
Define Utility & Offplot (Support) Facilities
Prepare Project Execution Plan and Cost Estimate
BestPractice
FEL 3Completion
“Best Practice”
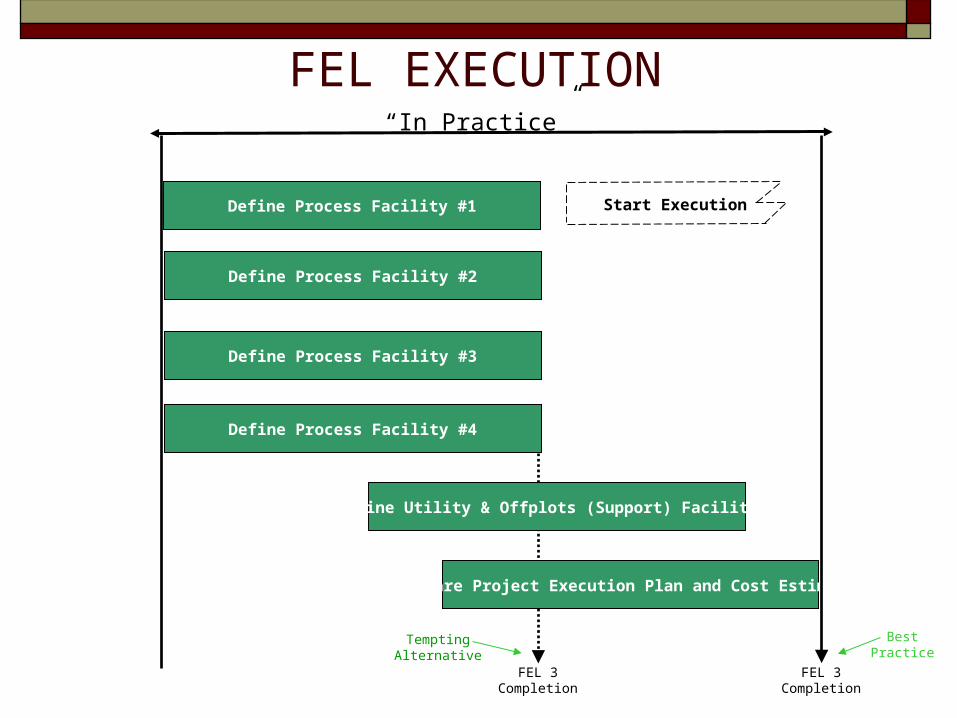
FEL EXECUTION
Define Process Facility #1
Define Process Facility #2
Define Process Facility #3
Define Process Facility #4
Define Utility & Offplots (Support) Facilities
Prepare Project Execution Plan and Cost Estimate
TemptingAlternative
BestPractice
FEL 3Completion
FEL 3Completion
“In Practice”
Start Execution
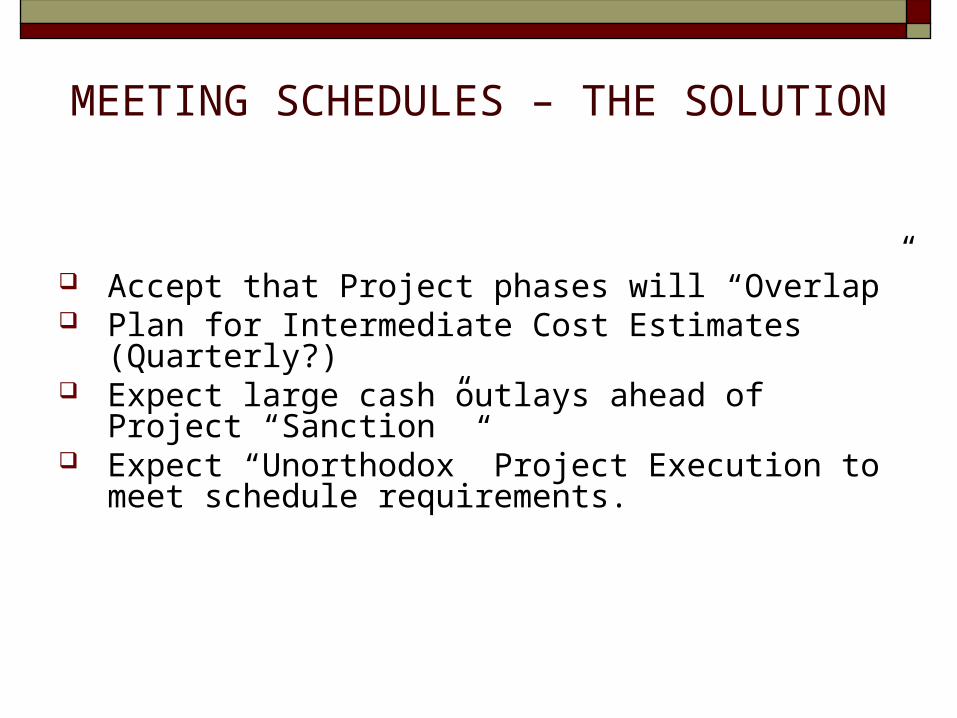
MEETING SCHEDULES – THE SOLUTION
Accept that Project phases will “Overlap” Plan for Intermediate Cost Estimates
(Quarterly?) Expect large cash outlays ahead of Project
“Sanction” Expect “Unorthodox” Project Execution to meet
schedule requirements.