Embed Size (px)
Citation preview
1
Applying Q-methodology to select and define attributes for non-market valuation: A case
study from northwest Wyoming, United States
Authors: Christopher A. Armatas (Corresponding author)a
aCollege of Forestry and Conservation, The University of Montana
32 Campus Dr.
Missoula, MT 59812
1 (406) 243-6856
Tyron J. Vennb
bCollege of Forestry and Conservation, The University of Montana
32 Campus Dr.
Missoula, MT 59812
United States
Alan E. Watsonc
cUSDA Forest Service, Rocky Mountain Research Station, Aldo Leopold
Wilderness Research Institute
790 E. Beckwith Ave.
Missoula, MT 59801
United States
2
Abstract
The underlying validity of stated preference non-market valuation methods relies on the
analyst’s ability to identify, select, define, and articulate the goods being valued in a way that is
relevant and understandable to the respondent, which requires detailed understanding of the
respondents’ experiences and points of view. Poor articulation of the good being valued will
result in biased to useless information for decision-makers. It should therefore be of concern to
economists and policymakers that the question of how best to perform pre-design qualitative
work with local stakeholders is a neglected area of inquiry. This paper assesses Q-methodology
as an objective, transparent, easily replicable, and statistically-rigorous approach to qualitative
research to support the selection and definition of attributes for non-market valuation.
Keywords:
Stated preference methods; ecosystem services; environmental goods; environmental valuation;
factor analysis; survey methods; qualitative methods.
3
Applying Q-methodology to select and define attributes for non-market valuation: A case
study from northwest Wyoming, United States
1. Introduction
Numerous approaches have been developed to identify natural resource values impacted
by management and policy, the importance of these values to different stakeholders, and to bring
more structure to the process of developing and evaluating alternative policy and management
options. Dryzek (2013) categorized these approaches into three major discourses: (1)
administrative rationalism (‘leave it to the experts’); (2) democratic pragmatism (public
consultation, alternative dispute resolution, policy dialogue, and lay citizen deliberation); and (3)
economic rationalism (deployment of market mechanisms). In the West, Dryzek (2013) argued
administrative rationalism may be ‘running out of steam’. Natural resource management
decisions often involve complex, disputed and uncertain scientific, social and cultural facts,
multiple and conflicting values of stakeholders, a rising perception among citizens that
environmental management decisions must be legitimized by broad public input, and high stakes.
Consequently, decisions are often politically-charged and result in local to international-scale
disagreements (Albrecht, 2010; Cornatzer, 2014; Moy 2011).
To improve the likelihood that management decisions will be greeted with public support
and to avoid conflict, stakeholder participation in the design of natural resource management
policy is increasingly regarded as important and is becoming common in practice (Buchy and
Hoverman, 2000; Lennox et al., 2011; Menzel and Teng, 2009; Rutgers et al., 2012; Turner and
Daily, 2008; Videira et al., 2006). Potential difficulties and pitfalls associated with public input
and stakeholder participation (e.g. ‘overcrowded policymaking’, political manipulation, and
decreased decision quality) have been recognized in the literature (Dietz and Stern, 2008;
4
Richardson and Jordan, 1983). However, these criticisms are less germane when the purpose of
public participation is primarily that of supporting sound environmental decision-making, as
opposed to proposing solutions and reaching consensus (Dietz and Stern 2008).
Natural resource decision-making is often supported by benefit-cost analysis (BCA).
Practitioners have increasingly aimed at total economic valuation of proposed policy actions
through accounting for costs and benefits of relevant market and non-market values. The most
versatile methods for estimating non-market values are stated preference surveys (e.g. contingent
valuation and choice experiments), and best practice recognizes the need for local stakeholder
involvement in preliminary stages of survey development (Bateman et al., 2002; Bennett and
Adamowicz, 2001; Louviere et al., 2000; Mansfield and Pattanayak, 2007). Typically, this
involvement is through pre-design qualitative research focused on attribute development. Such
methods include literature review, visits to the study area, and ‘rapid appraisal methods’ such as
key informant, focus groups, direct observations, community surveys or workshops, and mini-
surveys (Bateman et al., 2002; Blamey et al., 2002; Mansfield and Pattanayak, 2007; Powe,
2007). However, details regarding which method(s) are most appropriate, and how they should
be employed are scant (Coast and Horrocks, 2007; Coast et al., 2012).
The lack of guidance provided for the pre-design qualitative research phase of non-
market valuation is potentially problematic. It is at this time that local input can be used to
ensure the survey is sensitive to the local context of the policy question by informing the
selection of goods and services (attributes) that will be the focus of tradeoffs made by
respondents, the choices about which policymakers can be informed, and the text the respondent
sees. If important attributes are excluded or respondents do not understand the meaning of the
attributes they are faced with, then the findings from the non-market valuation survey are likely
5
to be biased or even useless for informing policy (Coast et al. 2012). It should therefore be of
concern to economists and policymakers that the question of how best to perform pre-design
qualitative work with local stakeholders is a neglected area of inquiry (Coast and Horrocks 2007;
Coast et al. 2012; Louviere and Lancsar 2009; Michaels-Igbokwe et al. 2014). The field needs
more explicitly-defined procedures for pre-design qualitative research.
Michaels-Igbokwe et al. (2014) provided the only published example of an explicitly-
defined procedure for pre-design qualitative research for non-market valuation. They suggested
developing a decision map as an additional step in the non-market valuation survey development
and design process. However, the qualitative aspect of their approach involving stakeholders is
based solely on traditional focus groups and individual interviews. Baker et al. (2006) proposed
that future research assess Q-methodology as an alternative, systematic and structured approach
to attribute development, which builds upon the traditional approach by incorporating local
stakeholder knowledge in an objective, transparent, easily-replicable and statistically-rigorous
fashion. This paper performs this assessment, providing specific examples of how Q-
methodology can improve the design of non-market valuation surveys and interpretation of
results relative to traditional approaches, which include:
identifying and defining goods that are relevant to survey participants;
informing the selection of a subset of important goods for inclusion in a non-
market valuation survey;
highlighting goods where respondents may employ cause and effect reasoning;
and
providing nuance and detail that can help distinguish protest responses from true
willingness to pay (WTP) estimates.
6
This paper proceeds as follows. Section two describes the need for explicitly-defined
qualitative research methods for preliminary design of stated preference surveys. Section three
describes Q-methodology and section four presents a case study application of Q-methodology to
support non-market valuation in northwest Wyoming, USA. With reference to the case study,
the fifth section discusses how pre-design qualitative research using Q-methodology can improve
the design of stated preference non-market valuation surveys. Section six concludes.
2. The need for explicitly-defined qualitative research methods for preliminary design of
stated preference surveys
Valuation of ecosystem services is considered to be an effective avenue for identifying
and evaluating the range of tradeoffs between alternative natural resource policy and
management actions (Bagstad et al., 2012; Bateman et al., 2013; Ingraham and Foster, 2008).
For the purposes of this study, ecosystem services are defined as the benefits provided by natural
systems that directly and indirectly contribute to human well-being (Costanza et al., 1997;
Millennium Ecosystem Assessment, 2005). Ecosystem services have been categorized in several
ways (e.g. de Groot et al. 2002, Millennium Ecosystem Assessment 2005). Hein et al. (2006)
categorized ecosystem services into production services (tangible products obtained from
ecosystems, e.g. food, timber, water), regulation services (benefits reaped from the maintenance
of ecosystems, e.g. climate regulation, water purification), and cultural services (intangible
benefits, e.g. recreation).
Despite the popularity of ecosystem services valuation, there are relatively few examples
where such values have been applied to support environmental decision-making, because the
7
results are often misunderstood or considered to be unreliable, even among economists
(Adamowicz, 2004; Heal, 2000; Liu et al., 2010). Especially since the 1990s, numerous biases
regarding the hypothetical payment and marketplace that are potentially introduced in non-
market valuation survey instruments have been identified (e.g. payment mechanism bias,
hypothetical bias, anchoring effects, embedding effects, and scale-perception bias), and some
have been addressed through methodological improvements (Araña and León, 2012; Dodonova,
2009; McDaniels et al., 2003; Newell and Swallow, 2013). Methodological improvements
regarding presentation of the goods being valued within the survey instrument have also been
achieved, for example, through enhanced accounting for framing effects (Fischer and Hanley,
2007; Kragt and Bennett, 2012) and labeling effects (Blamey et al., 2000).
The underlying validity of stated preference non-market valuation methods relies on the
analyst’s ability to identify, select, define, and articulate the goods (e.g. attributes in a discrete
choice experiment) being valued in a way that is relevant and understandable to the respondent,
which requires detailed understanding of the respondents’ experiences and points of view (Hall
et al., 2004; Langlois, 1998; Sauer and Fischer, 2010). This may be especially important when
the attributes being valued are ecosystem services, which have variable spatial and temporal
provision, and stakeholders (policy-makers, natural resource managers, and the general public)
differ in their perceptions about which ecosystem services are important and how valuable they
are. Many biases and other concerns are likely to arise if pre-design qualitative research fails to
elicit a sound understanding of stakeholder perspectives (Bateman et al., 2002; Blamey et al.,
2002; Mansfield and Pattanayak, 2007).
For example, one major critique of stated preference approaches to non-market valuation
is that the results are not stable because participants “have to construct their preferences for these
8
unfamiliar, often abstract and complex environmental goods ‘on the spot,’ drawing on the
information provided by the interviewer and any pre-existing knowledge they consider relevant”
(Sauer and Fischer, 2010, p. 1). As noted by Langlois (1998, p. 58), consumers “are perfectly
informed not in general but in respect of a particular structure set out for them by the analyst”. In
order to yield more stable preferences, it has been argued that the survey instrument should be
consistent with respondents’ generic worldviews, avoid overreliance on experts and researchers,
and be presented in language that is understandable to lay stakeholders (Barkmann et al., 2008;
Coast et al., 2012; Sauer and Fischer, 2010). Poor articulation of the good being valued will
result in biased to useless information for decision-makers.
If policy-relevant, but not demand-relevant, attributes are included in a non-market
valuation survey, then “no great confidence in the statistical significance of these variables will
be expected in subsequent statistical analysis” (Bateman et al. 2002, p. 260). Great care must be
taken when including both ‘causal’ and ‘effect’ attributes in non-market valuation surveys,
where ‘causal’ attributes are those that can “cause the status or level of expression of another
‘effect’ attribute” (Blamey et al., 2002, p. 168). Respondents who establish cause-effect
relationships between the attributes being valued may draw inaccurate conclusions that result in
a greater weight being assigned to the more fundamental ‘causal’ attribute, or discount or dismiss
particular scenarios that are considered to be unrealistic (Blamey et al., 2002). The easiest way to
address this potential problem is to only include one type of attribute (i.e. causal or effect) in the
survey. While, this approach may result in omission of an attribute that is important to
respondents, it should not be an issue if the main reason the omitted attribute is valued is its
effect (or dependency) on the included attributes (Blamey et al., 2002).
9
In non-market valuation, a respondent who rejects the valuation exercise because of an
issue they have with the hypothetical market presented to them, is said to have given a protest
response. Protesters can be identified among respondents who declare negative, zero and
positive WTP, and this is typically achieved using ad hoc debriefing questions or attitudinal
statements about the hypothetical market (e.g. fairness or ethical concerns) in order to determine
if the respondent is protesting against the hypothetical market or stating a true WTP (Meyerhoff
and Liebe, 2006; Meyerhoff et al., 2012). Much of the time, the process of identifying the
protesters is poorly accounted for, as is the subsequent treatment of those protesters in analysis
(Meyerhoff and Liebe, 2010). According to Meyerhoff and Liebe (2010), protest responses are
commonly discarded before analysis with a researcher assertion downplaying the impact of such
an action. Clearly, the treatment of protest responses can influence results of analysis.
Protest responses regarding the payment mechanism are common; however a refusal to
pay for the good in question resulting from lexicographic preferences also qualifies.
Lexicographic preferences may result in a refusal to pay based on ethical considerations such as
“the notion that nature has intrinsic value irrespective of its utility to humanity” (Szabó, 2011, p.
37). According to Venn and Quiggin (2007), lexicographic preferences are one reason that total
economic valuation of the cultural heritage of Australian indigenous communities may not be
feasible. It is not that the estimation is difficult – in the conventional sense of problems with
estimating values in contingent markets – but that the idea of accepting monetary compensation
for the loss of particular types of cultural heritage is simply nonsensical to many indigenous
people. Venn and Quiggin (2007) found that partial valuation of indigenous cultural heritage
may be possible (e.g. use values, such as hunting), and that this could be complemented by
10
quantitative constraints on the decision space that require minimum acceptable protection levels
for cultural heritage that is not substitutable (e.g. a sacred site).
Despite the acknowledged benefits of rigorous pre-survey qualitative work involving a
broad range of stakeholders, which can mitigate the issues described above, there has been little
instruction and detail given with regard to such work in non-market valuation literature (Coast
and Horrocks, 2007; Coast et al., 2012; Kløjgaard et al., 2012; Michaels-Igbokwe et al., 2014).
Coast and Horrocks (2007) asserted that pre-survey qualitative work employed to develop
attributes often lacks rigor, and details regarding sampling, data collection and analysis are
usually poorly reported. More importantly, “there is almost no reflection on the analysis and
refinement of complex information to derive a manageable number attributes” (Coast and
Horrocks, 2007, p. 25). This could be particularly problematic when considering that different
pre-survey qualitative methods have been shown to yield different information and significantly
impact the design of non-market valuation surveys (Kaplowitz, 2000; Kløjgaard et al., 2012;
Powe, 2007). It is little wonder that the findings from non-market valuation studies are still
viewed with suspicion and that their application to support natural resource decision-making is
rare.
3. Q-methodology
Q-methodology provides a systematic, structured and statistically-rigorous approach for
the study of human subjectivity (Barry and Proops, 1999; McKeown and Thomas, 1988).
Participants complete a rank ordering exercise, known as the Q-sort, which obtains “insight into
the values and preferences held by the public” (Steelman and Maguire, 1999, p. 362). The Q-
sorts are subjected to factor analysis, which results in a methodical rendering of numerous
11
perspectives into a small number of general perspectives. As a result of its statistical analysis
and unique data collection process, Q-methodology is amenable to ‘objective analysis’ and
minimizes the intrusion of researcher bias (Baker et al., 2006; Focht and Lawler, 2000;
McKeown and Thomas, 1988).
A thorough discussion of the process of Q-methodology can be found in Brown (1980)
and Watts and Stenner (2012). Here we present a brief description of Q-methodology, which can
be completed in the following five steps:
1. creation of the concourse and Q-set;
2. recruitment of Q-sort participants (P-set);
3. completion of the Q-sort and exit interview;
4. data analysis; and
5. factor interpretation.
The concourse is an extensive collection of items or statements related to the research
topic, which is pared down to form the Q-set that participants will rank order during the Q-sort
(Stephenson, 1978). The methods used to develop the concourse and Q-set generally involve
literature review, interviews, and focus groups to take local context into account and ensure
representation of a broad range of sentiments regarding the topic of interest.
The second step requires the recruitment of participants to complete the Q-sort, who are
collectively referred to as the P-set. The P-set is obtained by strategic sampling, not random
sampling of a large number of participants, to ensure “comprehensiveness and diversity, rather
than representativeness or quantity” (Eden et al., 2005, p. 417). This is because Q-methodology
is “intended to identify subjectivities that exist, not to determine how those subjectivities are
distributed across a population” (Brown et al., 1999, p. 602). Stainton Rogers (1995) asserted
12
that a P-set of 40 to 60 participants is most effective in capturing a diverse range of viewpoints.
Indeed, fewer than 60 participants are typically recruited in a Q-study (e.g. Gruber, 2011; Ray,
2011). Development of the theoretical target P-set is facilitated by the dimensional sampling
approach developed by Arnold (1970), but the process of identifying actual Q-sort participants
depends on the topic being investigated (e.g. Cuppen et al., 2010).
Step three requires the participants (P-set) to rank order the statements from the Q-set.
This exercise requires the participants to decide, from their perspective, that which is important
and, conversely, that which is not (Watts and Stenner, 2005). The participants are given a deck
of shuffled cards (each card contains one statement from the Q-set) to be placed onto the Q-
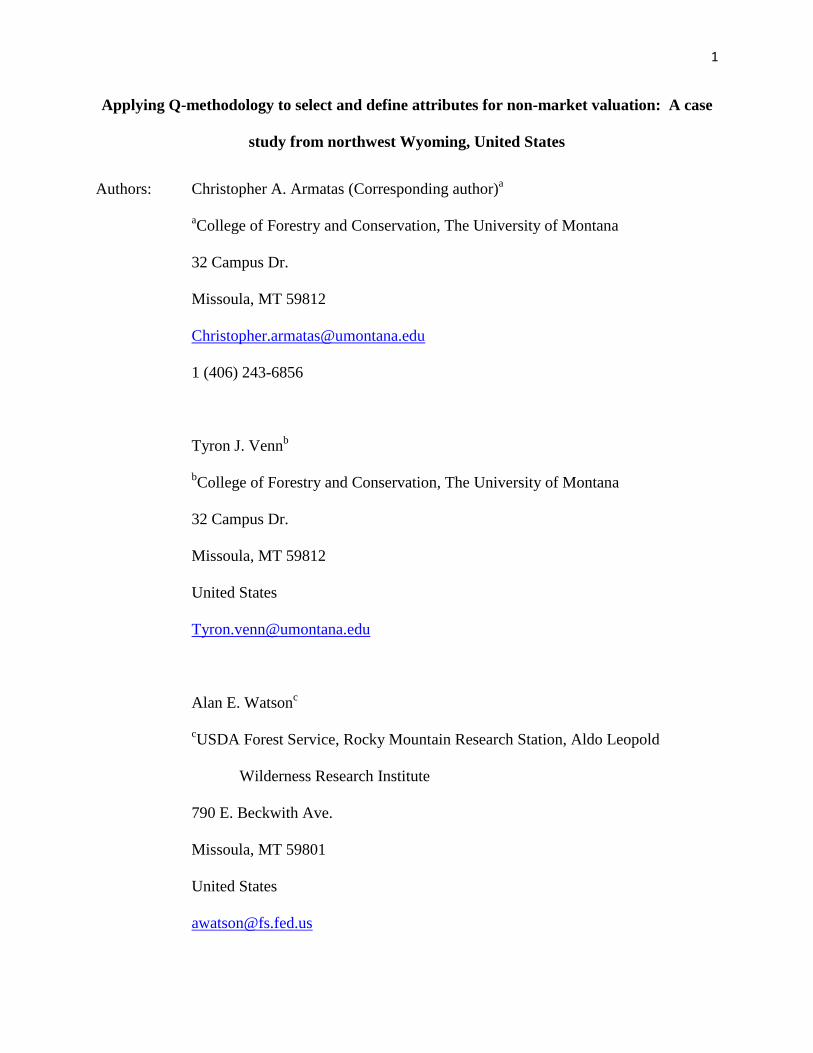
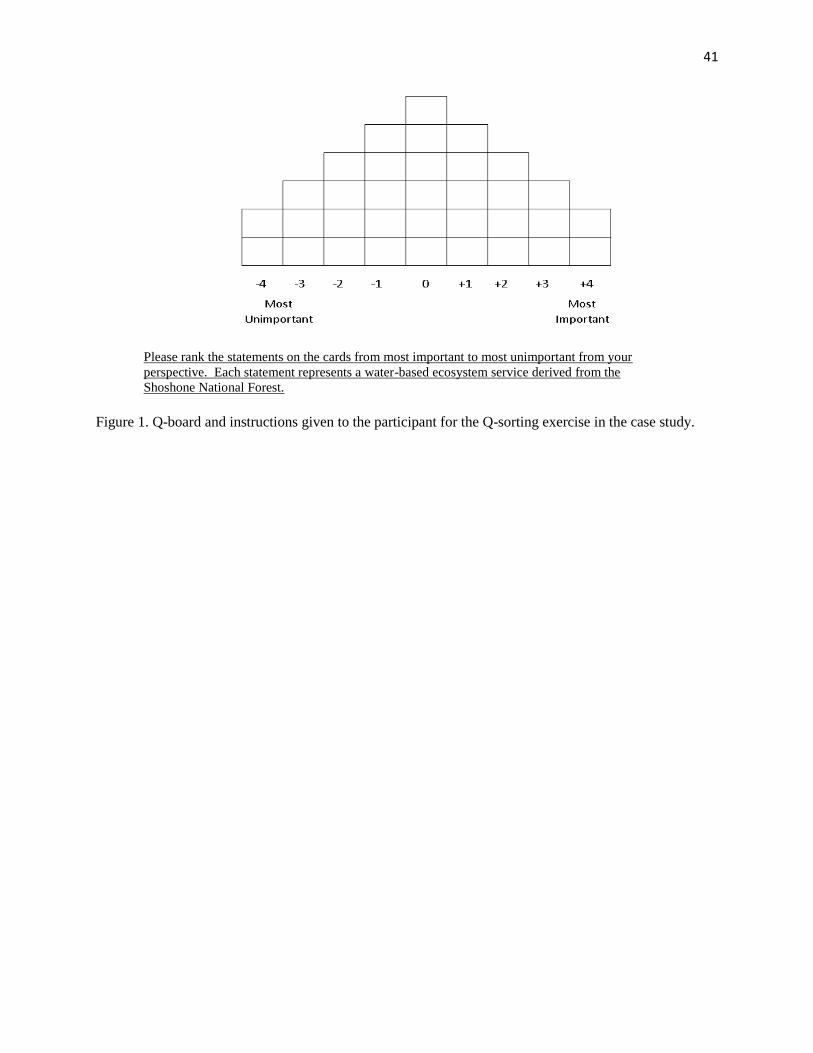
board, which provides the framework for the Q-sorting process. Q-boards typically (but not
always) require participants to distribute the cards in a manner similar to a normal distribution, as
illustrated in Figure 1. Brown (1980) describes the rationale for alternative Q-board designs. By
instructing the participants to rank the items from “most important” to “most unimportant”, the
poles of the Q-board capture the strong feelings and the middle of the Q-board captures those
items that are more neutral or insignificant (Brown, 1980; Watts and Stenner, 2012). The logic
behind this idea is that “those things which are uncharacteristic of us are just as important, in a
negative sense, as those that apply to us in a positive sense” (Brown, 1980, p. 198).
In order to help the participants complete the Q-sort, Brown (1980) suggested that
participants first divide all the statements into three groups: (1) those statements that are
positively salient; (2) those that are negatively salient; and (3) the remainder that are relatively
neutral. The participant is then instructed by the researcher to sort the cards onto the Q-board in
order of salience, with each column denoting a different level of salience. The rows indicate
how many cards from the Q-set belong in each column. For example, for the Q-board illustrated
13
in Figure 1, two cards must be selected as ‘most important’ +4, and three cards as +3 importance.
After the Q-sort is complete, the researcher conducts an exit interview, in which the participant is
asked to discuss the reasoning for ranking the statements in their unique way (Brown 1980).
The data analysis stage involves factor analysis, and results are represented by factor
arrays, which represent the general viewpoint of all the participants that load onto a particular
factor. Each factor array is defined by Q-sorts which only have a significant factor loading with
that factor. A Q-sort can also be confounded (loads significantly onto more than one factor) or
null (does not significantly load onto any factor). Confounded Q-sorts are typically not used in
the construction of the factor arrays because they are a reflection of at least two factors, which
can increase the correlation between factors and make the resulting factor arrays less distinct.
Nevertheless, confounded Q-sorts can still be explained in terms of the resulting factor arrays
onto which they significantly load. Those Q-sorts that are null are considered to be idiosyncratic
viewpoints, which are not explained by any of the resulting factor arrays and do not contribute to
the interpretation of the factor arrays.
The final step, factor interpretation, typically involves a write-up exercise, which conveys
the meaning of each factor array with the aid of information gathered during the exit interview.
Factor interpretations identify those items for a particular viewpoint that are positively salient,
negatively salient, and relatively neutral. By comparing factor arrays of each perspective, it is
also possible to identify those items about which there is consensus, contention, and ambivalence
among the perspectives.
14
4. Case study application of Q-methodology to determine the importance of water-based
ecosystem services derived from the Shoshone National Forest, USA
Forest Service managers and scientists were interested in using information about the
importance of water-based ecosystem services (WESs) to local people to support management of
the Shoshone National Forest (SNF) in Montana and Wyoming in the United States. A Q-
methodology study was conducted by Armatas (2013) to obtain a greater understanding of
stakeholder values and interests regarding the diverse range of WESs produced by the SNF. The
study area is approximately 4.5 million hectares, and has a population of about 100,000 people
(United States Census Bureau, 2010). Much of the benefit provided by water to the communities
surrounding the SNF is employment related, with about 26.3% of jobs (19,041 out of 72,524)
being derived from water-related industries (BEA, 2010). The three industries contributing to
the majority of this employment are agriculture, oil and natural gas extraction, and tourism and
recreation, all of which rely on water or affect water quality and quantity. Water in the study
area is also culturally important for both Native and non-Native American populations.
4.1. Q-set and P-set
The purpose of the Q-set in this project was to identify the broad range of WESs being
derived from the SNF. A preliminary concourse of 49 WESs was developed through a review of
ecosystem services and study area specific academic and grey literature. Two focus group
meetings were held and pilot testing of the Q-set was performed within the study area to define
the final Q-set of 34 WESs.
15
The focus group meetings were attended by a total of 18 participants who had been
identified via phone conversations with federal, state and local water resource managers,
representatives of water-reliant businesses (e.g. river outfitters), and with citizens connected to
water for professional and personal reasons (e.g. farmers and water recreation enthusiasts).
Attendees included ranchers, farmers, whitewater rafting outfitters, an archeologist and a
hydrologist from federal agencies, a state water engineer, a small business owner, and
representatives from an environmental group and Wyoming Game and Fish. These meetings
guided the authors’ selection of WESs for the Q-set by providing local stakeholder
recommendations about removing, splitting and combining WESs included in the literature
review preliminary concourse. For example, the concourse had separate WESs for river
activities such as kayaking, rafting, tubing, and surfing, but the focus groups agreed that all these
activities could be merged into one WES entitled “river-based recreation”. Conversely, the focus
groups helped to separate WESs that were originally too broad. For example, the concourse had
only one WES for irrigation, but the focus groups felt that there are two types of irrigation in the
study area - commercial and personal. The meetings also provided local context to improve
definitions of WESs, and identified and defined several additional WESs not revealed by the
literature review. For example, the WES entitled “preserving livelihoods, lifestyles, and
landscapes” was included because the focus groups agreed that large working ranches and the
prevalence of agriculture in the study area provided a layer of protection against residential
development and preserved a culturally important way of life.
Pilot testing of the Q-sort by 20 members of the general public resulted in several
changes to the Q-set and the definitions of WESs that came out of the focus group meetings. For
instance, a WES devoted to the benefits provided by glacier melt water was removed after pilot

16
testers noted that it was a benefit captured by another ecosystem service in the Q-set entitled
“gradual discharge of stored water.” Pilot testing revealed that the general public were
comfortable sorting the WESs. Table 1 lists the 34 WESs in the Q-set, which are categorized into
regulating services, provisioning services, and cultural services. Full definitions for each WES
in the Q-set are available in the Appendix.
The P-set was selected following extensive internet-based research of the study area, two
meetings with local Forest Service employees, discussions during the two focus groups
conducted to define the Q-set, and snowball sampling employed during the exit interview. These
purposeful methods yielded a P-set of 96 stakeholders who were not participants in the two focus
groups or pilot testers of the Q-set. Members of the P-set can be classified into the following
seven categories: (1) private sector (e.g. fishing and hunting outfitters, recreation enthusiasts,
farmers, and oil and natural gas representatives); (2) non-governmental organizations (e.g.
Greater Yellowstone Coalition and Wyoming State Snowmobile Association); (3) Wyoming
state government (e.g. State Engineers Office and State Parks); (4) tribal governments (e.g.
Business Council and Environmental Quality Commission); (5) local government (e.g. county
commissioners and irrigation district managers); (6) federal government (e.g. Forest Service and
Bureau of Reclamation); and (7) randomly selected participants from public locales inside and
outside the study area.
4.2. Administration of surveys, factor analysis, and the write-up exercise
Each member of the P-set attended a one-on-one meeting with the lead author at a
convenient location, which included residences, places of work, and public meeting places.
17
During these meetings, each member of the P-set completed the Q-sorting exercise and exit
interview without compensation. For the Q-sorting exercise, each participant was required to
rank the 34 WESs on the Q-board illustrated in Figure 1. During the exit interview, they
provided demographic information and reasoning supporting their Q-sort.
Factor analysis was performed on the 96 Q-sorts, and a three-factor solution explaining
48% of the study variance1 was chosen based on objective criteria commonly employed in Q-
methodology: the Scree test, Humprey’s Rule, the significant loadings test, and the eigenvalue
test (Brown, 1980; Watts and Stenner, 2012). The three factor solution provided four
perspectives for interpretation because of a bipolar third factor. That is, a factor defined by both
positive and negative loading Q-sorts or viewpoints. Of the 96 total participants, 74 have a
significant loading with one factor, 8 were confounded, and 14 were null-cases.
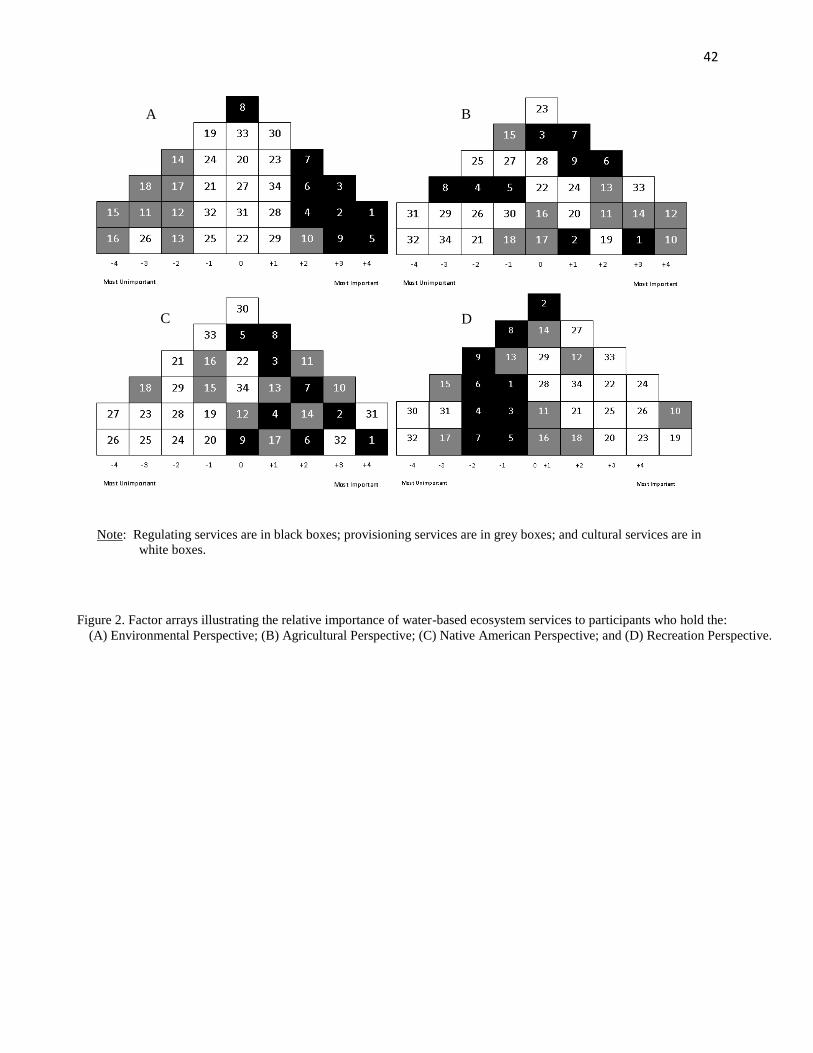
The four perspectives were named Environmental, Agricultural, Native American, and
Recreation, because of particular ecosystem services that were positively salient to the
respondents who helped to define each perspective. For example, the Environmental perspective
was labeled as such because eight of the nine positively salient WESs were regulating services.
The participants were instructed to rank order the WESs on a scale from “most important” to
“most unimportant” where the middle of the Q-board was meant for WESs that conjured feelings
of neutrality and apathy. For the purposes of interpretation, the WESs at the poles (+/-2, 3, 4) are
referred to as positively and negatively salient, and those in the middle (-1, 0, +1) are referred to
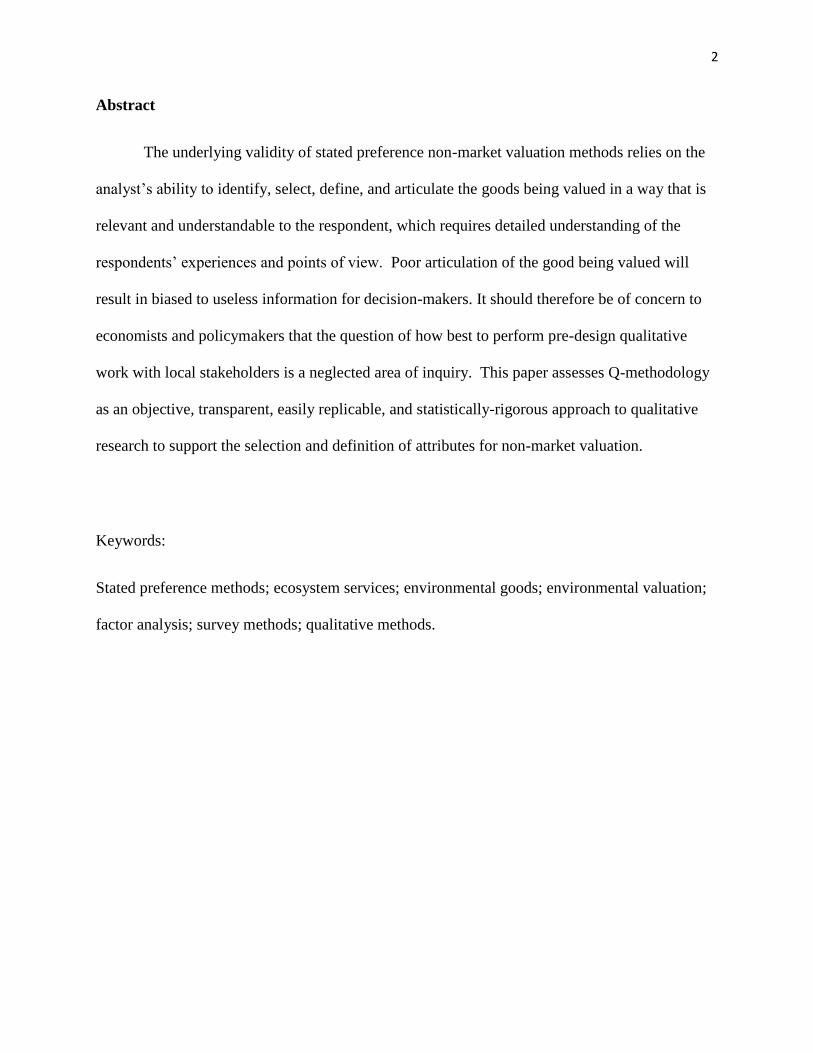
as relatively neutral. The level of salience assigned to the WESs by each perspective is shown in
the factor arrays presented in Figure 2, and the numbers within the factor arrays correspond with
the numbering of WESs in Table 1.
1 Kline (1994) noted that any solution explaining 35-40% of the study variance is considered to be a sound solution.
18
5. Benefits of Q-methodology for developing attributes to be valued in a stated preference
survey
The experience of applying Q-methodology to identify, select, define, and articulate
WESs for the SNF has highlighted several benefits of the approach as an explicitly-defined
procedure for the pre-design qualitative research step in ecosystem service valuation. The
following subsections discuss these benefits with supporting evidence from the four perspectives
yielded in the SNF case study. Throughout this section, numbers in parentheses that range from
-4 to +4 represent the level of salience that particular viewpoints assigned to the WES being
discussed. Italicized numbers in parentheses between 1 and 34 that accompany discussions of
various WESs correspond with the numbering of WESs in Table 1 and can facilitate location of
WESs within the factor arrays in Figure 2. Additionally, several quotes gathered during the exit
interviews from participants who loaded onto particular perspectives will be provided as support
for assertions being made.
5.1.Q-methodology uses stakeholder input to identify and define ecosystem services relevant to
survey participants
A critical aspect of stated preference valuation of ecosystem services is to build survey
instruments that include descriptions of the ecosystem services that are understandable and
meaningful to the respondent. This can be challenging considering the complex nature of
particular ecosystem services (e.g. biodiversity conservation (5)), the spatial variability at which
ecosystems provide benefits, and the varying levels of stakeholder knowledge regarding
ecosystem services. In accordance with good practice in non-market survey design, the
19
development of the Q-set provides a formal process for stakeholder involvement and collection
of information relevant to the local population that can: (1) minimize the chance that important
ecosystem services will be excluded from consideration; and (2) ensure ecosystem services are
defined in ways that are clear and understandable to local stakeholders.
In the SNF case study, a review of literature highlighted the importance of agriculture for
the economy, but focus groups with local residents revealed that the agricultural community is
considered by non-farmers and ranchers as both a layer of protection against further residential
development and a significant part of the region’s identity. This knowledge of the study area
resulted in the identification, definition and inclusion of the ecosystem service, preserving
livelihoods, lifestyles and landscapes (33) within the Q-set.
The utility of attribute-based stated preference surveys is often diminished by the
inclusion of attributes that are unclear or confusing for the respondent, and that consequently
have little utility for the estimation of WTP. In the SNF case study, clear accommodation of
water-based recreation required the inclusion of 12 recreation WESs in the Q-set. A literature
review of the study area made it apparent that recreation opportunities related to boating and
angling would need to be separated because of different levels of flow and turbidity that are
optimal for each activity. Stakeholder interaction through focus groups and interviews also
suggested that angling opportunities should be divided into those provided by lakes and
reservoirs, and those provided by rivers. Stakeholders asserted the need for such a split because
of the difference in fishing ethic; lake and reservoir fishing is more consumptive, whereas river-
based fishing concentrates more on the sporting aspect and the preservation of fish populations
through low impact fishing techniques, such as barbless hooks. Also, stakeholders identified the
20
need to include motorized and non-motorized ice and snow based recreation as two separate
WESs in the Q-set because of the different user groups participating in each activity.
The perspectives yielded from factor analysis of the Q-sorts can inform efforts to report
implications of current policy and proposed policy changes in the background information
section of the survey in a way that is meaningful to respondents. These perspectives can also be
helpful for identifying specific characteristics that would enhance the definition of an attribute in
a non-market valuation survey. For example, the definition for river-based fishing (19) in the Q-
set was: “The rivers throughout the study area can be used for fishing, both for sport and the
harvesting of fish for personal consumption.” Through the exit interviews it became clear that
river-based fishing in the study area is important largely because of the presence of Yellowstone
cutthroat trout (Oncorhynchus clarkia bouvieri). Participant 14 explained, “We have a reputation
around here for being a world class, if not world class then national, fishing destination, and the
cutthroat trout has a huge profile.” This sentiment suggests that an attribute designed to capture
the value of river-based fishing in the study area would need to include the cutthroat trout in its
definition.
The Q-sorts and resulting factor arrays can help definition of an attribute in a non-market
valuation survey by reinforcing (or challenging) the sentiments discovered in focus groups. For
example, focus groups for the SNF case study suggested that ecosystem services related to
biodiversity needed to be separated into biodiversity conservation (5), conservation of keystone
species (3), and conservation of rare plant species (4). One focus group participant explained,
“biodiversity covers the breadth of species, but specifically the keystone species are integral to
the system itself.” Another focus group participant suggested that rare plants should be featured
in a separate WES because of the large number of rare plants in the study area. However, the
21
factor arrays in Figure 2 illustrate that these three WESs were ranked similarly by each
perspective, suggesting it would be appropriate to combine these three services into one attribute
for the purposes of valuation.
Exit interviews employed in Q-methodology can help to identify units for quantification
of attribute levels in a non-market valuation survey that are meaningful to local people. For
example, Q-sort participants frequently commented that the number of large working farms is
integral to preserving livelihoods, lifestyles and landscapes (33), which is suggestive of an
appropriate metric for quantification. However, few members of the general public are likely to
be sufficiently informed about the environmental policy problem of interest such that they can
contribute to efforts to estimate levels (quantities) of ecosystem services for inclusion in the non-
market valuation survey. This responsibility necessarily rests with the non-market valuation
practitioner and selected experts.
Likewise, as with all pre-design qualitative research methods that accommodate
stakeholder perspectives, Q-methodology is not a remedy against definitions of ecosystem
services that invite double-counting or other WTP estimation biases. Sometimes, the preferred
definitions of stakeholders will deliberately encompass multiple values. For example, in the SNF
case study, preserving rural livelihoods, lifestyles and landscapes (33) was defined by locals to
include two major values: the culture of agriculture; and the protection of large, contiguous
landscapes by maintaining working farms. Clearly, this present s a double-counting issue that
must be addressed by non-market valuation practitioners before this WES can be included in a
survey.
22
5.2. Q-methodology supplies nuance and detail that can assist with the selection of ecosystem
services to be valued in a stated preference survey
The tradeoffs made necessary by Q-methodology are lacking in Likert-type surveys,
where a participant is allowed to assign a high level of importance to all attributes. This can be
problematic for a researcher who is trying to pare down a large list of attributes to a manageable
number to be included in a stated preference survey. Additionally, an unresolved challenge of
pre-survey qualitative work, according to Coast and Horrocks (2007), is the tension between
trying to gain a rich and nuanced understanding of the research topic using qualitative methods
and the reductive aim of capturing all the key concepts in as few attributes as possible. The
factor arrays yielded in Q-methodology highlight a limited number of potential attributes for
non-market valuation through its statistical and structured analysis of subjectivity. In other
words, this approach provides a more objective interpretation of stakeholder perspectives than
may be provided by other qualitative approaches such as focus groups and individual interviews.
Among the perspectives revealed by factor analysis, there may be consensus regarding
ecosystem services that are positively salient, negatively salient, and relatively neutral.
Ecosystem services that are positively salient to all factors, for example, household/municipal
water (10) in the SNF case study, can be considered highly relevant for inclusion in a valuation
survey and are likely to be relatively well-understood by respondents, decreasing the chance that
‘on the spot’ construction of preferences will be required. Conversely, those ecosystem services
that are relatively neutral for all perspectives should not be candidates for inclusion in a non-
market valuation survey. For example, the factor arrays in Figure 2 reveal that the ecosystem
services physically and mentally challenging recreation (29), manufacturing and industrial use
(15), and supporting of commercial land-based recreation (18) are among those that are relatively
23
neutral for most perspectives. Ecosystem services that are negatively salient may also be highly
relevant for non-market valuation, because they may be viewed as threatening important
ecosystem services. For example, oil and natural gas extraction (16) is extremely salient in a
negative sense to the environmental perspective (-4). The importance of oil and natural gas
extraction for the economy, and its prevalence within the study area suggests that land managers
could benefit from knowledge regarding willingness to accept compensation for non-marketed
externalities associated with this particular WES.
There is contention between perspectives when ecosystem services that are positively
salient to some perspectives are negatively salient to others. Decisions about the management of
such ecosystem services are likely to be politically charged and, therefore, inclusion in a
valuation survey will provide useful information to support policy-maker and manager decision-
making. An example of a WES that is contentious is motorized ice and snow based recreation,
which was positively salient to the recreation perspective (+3) and negatively salient to all other
perspectives.
The factor arrays and interpretive-write ups can also highlight policy-relevant ecosystem
services that are not demand relevant. For example, fighting forest fires (17) is not demand
relevant for most of the four perspectives, as is evident by the neutrality or negative salience
assigned to it by all four factors, but it is of policy and management concern for the SNF.
24
5.3. Q-methodology provides information to assist in distinguishing between protest responses
and true WTP
Including contentious ecosystem services in a valuation survey could lead some
respondents to register protest responses. A benefit of Q-methodology is that factor arrays are
accompanied by qualitative data regarding the logic and reasoning behind the construction of
each viewpoint, which can help researchers avoid, or identify and better understand the reasons
for protest responses. For example, the ecosystem service, Native American cultural and
spiritual values (31) is contentious across the four viewpoints. Native American cultural and
spiritual values (+4) are non-tradable, non-negotiable, inextricably tied to a way of life, and
sacrosanct to those who align with the Native American perspective. This is evident from the
following quote from Participant 77: “Our way of governing, our way of teaching, our love for
each other came from that River corridor…that is our stories, we come out of the water.” This
sentiment suggests that people who hold the Native American perspective have lexicographic
preferences in favor of Native American cultural and spiritual values. These values, however,
are neutral for the environmental perspective (0), and are negatively salient to the recreation (-3)
and agricultural perspectives (-4) due to the perception that increased protection of Native
American cultural values threatens provision of water for recreation and agriculture,
respectively. Thus, including Native American cultural and spiritual values in a valuation study
could invoke a protest response from some respondents due to lexicographic preferences for
ecosystem services that are perceived to be threatened by Native American cultural and spiritual
values, and a true low WTP due to feelings of neutrality from others. In this case, information
provided by Q-methodology could assist the researcher develop attitudinal questions for
identification of lexicographic preferences, protest responses and true WTP.
25
5.4. Q-methodology can highlight those ecosystem services where respondents may employ
cause and effect reasoning
Q-methodology can help to identify those ecosystem services where respondents are
likely to consider cause-effect relationships in a stated preference survey. A better understanding
of these situations, which can be gleaned from the factor arrays and exit interviews, could allow
the researcher to address the issue prior to survey administration. For instance, according to the
Agricultural perspective, water quality (+3) supports the preservation of livelihoods, lifestyles,
and landscapes (+3), but in-stream flow (+1) has the potential to negatively impact commercial
irrigation (+4). Participant 44 explained, “the quality of water and the quantity that has been
supplied off the forest, and historically livelihoods have been developed. Agricultural
communities, everything we do, the reason we live where we do is because of the water running
off the mountains.” Participant 45 noted that if there isn’t enough water, “then those of us that
depend on irrigation to produce crops and water for livestock would have to reduce our income
basically, because that is how most of us make our income.” According to this perspective, the
quantity of water is threatened by conservation groups advocating for in-stream flow rights.
Participant 31 commented, “increased pressure from conservation groups, fishing, in-stream flow
and anything like that would influence the ability to use it for commercial irrigation.”
The easiest way to avoid the cause-effect problem is to only include one type of attribute
(i.e. causal or effect) in the survey (Blamey et al., 2002). Therefore, in defining the set of
attributes for inclusion in a stated preference survey of water-based ecosystem services provided
by the SNF, information gathered via Q-methodology suggests it would be appropriate to
exclude water quality and in-stream flow, so long as important ‘effect’ attributes are included.
26
6. Conclusion
Non-market valuation of ecosystem services is increasingly recognized as being useful to
support natural resource management and policy-making; however skepticism remains,
particularly with regard to stated preference approaches. A major critique of stated preference
surveys is the difficulty respondents may have deciding their willingness to pay for complex and
unfamiliar environmental goods, and consequently, how much confidence can be placed in
statistically-derived non-market values for ecosystem services. The validity of these methods
rests on the analyst’s ability to identify, select, define and articulate the goods being valued in a
way that is relevant and understandable to the respondent. This requires a detailed understanding
of the respondents’ experiences and points of view. Pre-design qualitative research methods can
provide complex and nuanced data for attribute development, while also guarding against the
potential for mis-specification of attributes through too much reliance on experts and researchers.
However, the question of how best to perform this qualitative research is a neglected area of
inquiry. In this paper, we have demonstrated the potential for Q-methodology to provide a
defined procedure for pre-design qualitative research.
Q-methodology is a non-monetary preference elicitation method that can highlight
ecosystem services that are suitable for valuation and salient to a wide range of stakeholders.
The development of the Q-set incorporates diverse stakeholder input to identify and define, in
terms understandable to the local community, specific ecosystem services that are reaped in the
study area. The Q-sorting exercise and exit interviews yield nuanced and detailed stakeholder
perspectives that highlight those ecosystem services that are positively salient, negatively salient,
and relatively neutral. Interpretation of the factor arrays can identify ecosystem services where
there is consensus, contention, or ambivalence about their importance among the viewpoints. In
27
addition, the detailed perspectives can indicate situations where cause and effect reasoning is
likely to be employed by stakeholders, and highlight acceptable and unacceptable tradeoffs (e.g.
lexicographic preferences), which provides a basis to differentiate between protest responses and
true WTP.
Although Q-methodology is likely to cost more than other pre-design qualitative research
methods, the explicitly-defined procedures, and methodical and statistical rendering of multiple
perspectives into a limited number of general perspectives may be worth the additional costs in
some contexts. For example, it may be especially helpful in public land management situations
where a large number of ecosystem services affect a large number of stakeholders, none of
whom have extraordinary claim or right to those services. The nuance and detail provided by the
factor arrays will inform interpretation of the willingness to pay estimates from a non-market
valuation survey. Furthermore, the relative ease of replicating Q-sorts could facilitate cost-
effective methods to test for changing preferences over time. However, employing Q-
methodology may not be warranted in all valuation circumstances, such as where the ecosystem
services requiring valuation are obvious, or the degree of controversy and contention is known or
can be reasonably expected or anticipated.
Acknowledgements
This research was funded by the Aldo Leopold Wilderness Research Institute, which is
administered by the Rocky Mountain Research Station of the U.S. Forest Service. We would
like to thank all participants who contributed their valuable time to this research, with a special
thanks to the Crow, Eastern Shoshone, and Northern Arapaho Tribes for their cooperation. The

28
information and support provided by the Forest Service in Cody, Wyoming, was greatly
appreciated. We would also like to thank Dan McCollum (economist with the Rocky Mountain
Research Station) for commenting on an earlier version of the manuscript.
29
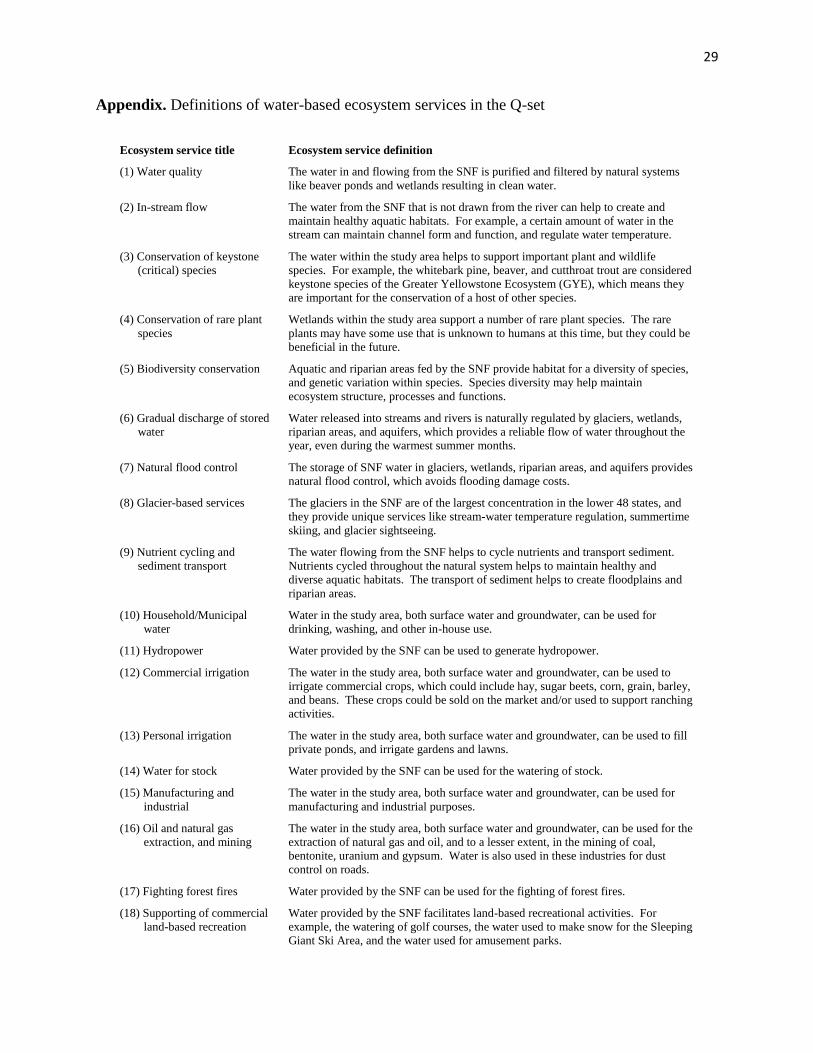
Appendix. Definitions of water-based ecosystem services in the Q-set
Ecosystem service title Ecosystem service definition
(1) Water quality The water in and flowing from the SNF is purified and filtered by natural systems
like beaver ponds and wetlands resulting in clean water.
(2) In-stream flow The water from the SNF that is not drawn from the river can help to create and
maintain healthy aquatic habitats. For example, a certain amount of water in the
stream can maintain channel form and function, and regulate water temperature.
(3) Conservation of keystone
(critical) species
The water within the study area helps to support important plant and wildlife
species. For example, the whitebark pine, beaver, and cutthroat trout are considered
keystone species of the Greater Yellowstone Ecosystem (GYE), which means they
are important for the conservation of a host of other species.
(4) Conservation of rare plant
species
Wetlands within the study area support a number of rare plant species. The rare
plants may have some use that is unknown to humans at this time, but they could be
beneficial in the future.
(5) Biodiversity conservation Aquatic and riparian areas fed by the SNF provide habitat for a diversity of species,
and genetic variation within species. Species diversity may help maintain
ecosystem structure, processes and functions.
(6) Gradual discharge of stored
water
Water released into streams and rivers is naturally regulated by glaciers, wetlands,
riparian areas, and aquifers, which provides a reliable flow of water throughout the
year, even during the warmest summer months.
(7) Natural flood control The storage of SNF water in glaciers, wetlands, riparian areas, and aquifers provides
natural flood control, which avoids flooding damage costs.
(8) Glacier-based services The glaciers in the SNF are of the largest concentration in the lower 48 states, and
they provide unique services like stream-water temperature regulation, summertime
skiing, and glacier sightseeing.
(9) Nutrient cycling and
sediment transport
The water flowing from the SNF helps to cycle nutrients and transport sediment.
Nutrients cycled throughout the natural system helps to maintain healthy and
diverse aquatic habitats. The transport of sediment helps to create floodplains and
riparian areas.
(10) Household/Municipal
water
Water in the study area, both surface water and groundwater, can be used for
drinking, washing, and other in-house use.
(11) Hydropower Water provided by the SNF can be used to generate hydropower.
(12) Commercial irrigation The water in the study area, both surface water and groundwater, can be used to
irrigate commercial crops, which could include hay, sugar beets, corn, grain, barley,
and beans. These crops could be sold on the market and/or used to support ranching
activities.
(13) Personal irrigation The water in the study area, both surface water and groundwater, can be used to fill
private ponds, and irrigate gardens and lawns.
(14) Water for stock Water provided by the SNF can be used for the watering of stock.
(15) Manufacturing and
industrial
The water in the study area, both surface water and groundwater, can be used for
manufacturing and industrial purposes.
(16) Oil and natural gas
extraction, and mining
The water in the study area, both surface water and groundwater, can be used for the
extraction of natural gas and oil, and to a lesser extent, in the mining of coal,
bentonite, uranium and gypsum. Water is also used in these industries for dust
control on roads.
(17) Fighting forest fires Water provided by the SNF can be used for the fighting of forest fires.
(18) Supporting of commercial
land-based recreation
Water provided by the SNF facilitates land-based recreational activities. For
example, the watering of golf courses, the water used to make snow for the Sleeping
Giant Ski Area, and the water used for amusement parks.
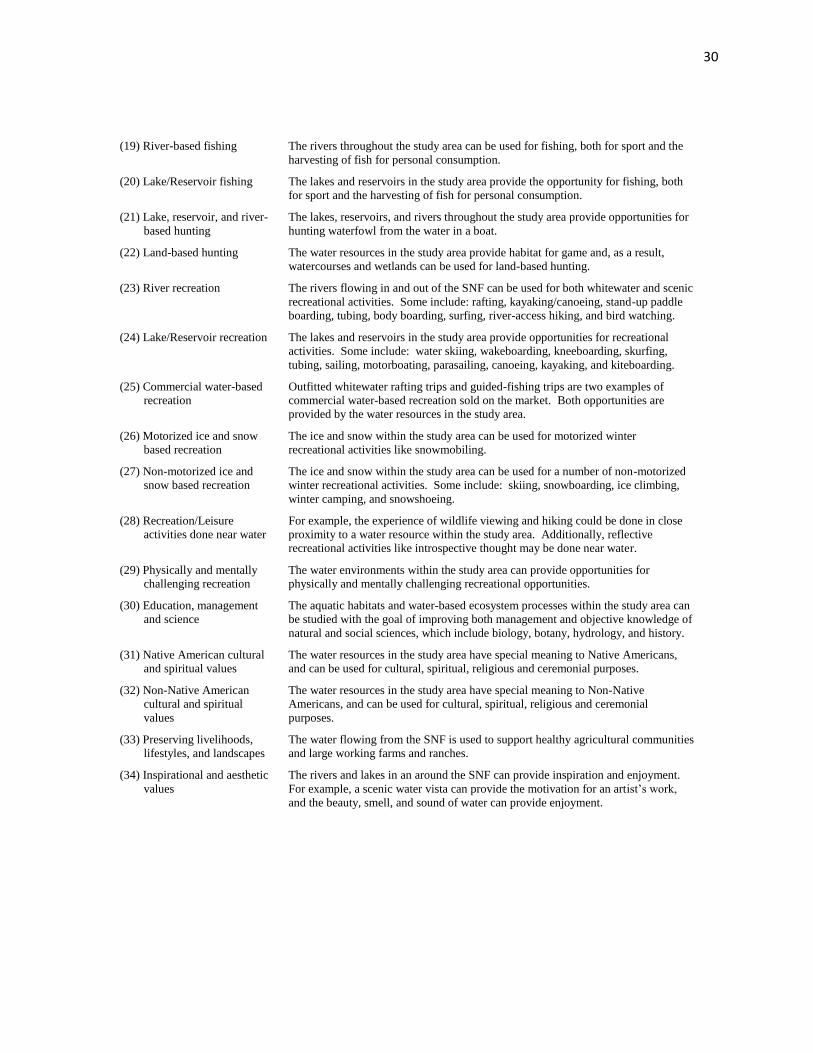
30
(19) River-based fishing The rivers throughout the study area can be used for fishing, both for sport and the
harvesting of fish for personal consumption.
(20) Lake/Reservoir fishing The lakes and reservoirs in the study area provide the opportunity for fishing, both
for sport and the harvesting of fish for personal consumption.
(21) Lake, reservoir, and river-
based hunting
The lakes, reservoirs, and rivers throughout the study area provide opportunities for
hunting waterfowl from the water in a boat.
(22) Land-based hunting The water resources in the study area provide habitat for game and, as a result,
watercourses and wetlands can be used for land-based hunting.
(23) River recreation The rivers flowing in and out of the SNF can be used for both whitewater and scenic
recreational activities. Some include: rafting, kayaking/canoeing, stand-up paddle
boarding, tubing, body boarding, surfing, river-access hiking, and bird watching.
(24) Lake/Reservoir recreation The lakes and reservoirs in the study area provide opportunities for recreational
activities. Some include: water skiing, wakeboarding, kneeboarding, skurfing,
tubing, sailing, motorboating, parasailing, canoeing, kayaking, and kiteboarding.
(25) Commercial water-based
recreation
Outfitted whitewater rafting trips and guided-fishing trips are two examples of
commercial water-based recreation sold on the market. Both opportunities are
provided by the water resources in the study area.
(26) Motorized ice and snow
based recreation
The ice and snow within the study area can be used for motorized winter
recreational activities like snowmobiling.
(27) Non-motorized ice and
snow based recreation
The ice and snow within the study area can be used for a number of non-motorized
winter recreational activities. Some include: skiing, snowboarding, ice climbing,
winter camping, and snowshoeing.
(28) Recreation/Leisure
activities done near water
For example, the experience of wildlife viewing and hiking could be done in close
proximity to a water resource within the study area. Additionally, reflective
recreational activities like introspective thought may be done near water.
(29) Physically and mentally
challenging recreation
The water environments within the study area can provide opportunities for
physically and mentally challenging recreational opportunities.
(30) Education, management
and science
The aquatic habitats and water-based ecosystem processes within the study area can
be studied with the goal of improving both management and objective knowledge of
natural and social sciences, which include biology, botany, hydrology, and history.
(31) Native American cultural
and spiritual values
The water resources in the study area have special meaning to Native Americans,
and can be used for cultural, spiritual, religious and ceremonial purposes.
(32) Non-Native American
cultural and spiritual
values
The water resources in the study area have special meaning to Non-Native
Americans, and can be used for cultural, spiritual, religious and ceremonial
purposes.
(33) Preserving livelihoods,
lifestyles, and landscapes
The water flowing from the SNF is used to support healthy agricultural communities
and large working farms and ranches.
(34) Inspirational and aesthetic
values
The rivers and lakes in an around the SNF can provide inspiration and enjoyment.
For example, a scenic water vista can provide the motivation for an artist’s work,
and the beauty, smell, and sound of water can provide enjoyment.
31
References
Adamowicz, W. L., 2004. What’s it worth? An examination of historical trends and future
directions in environmental valuation. The Australian Journal of Agriculture and
Resource Economics 48, 419-443.
Albrecht, M., 2010. Transboundary governance of the Curonian Spit World Heritage Site.
Journal of Environmental Planning and Management 53(6), 725-742.
Araña, J. E., León, C. J., 2012. Scale-perception bias in the valuation of environmental risks.
Applied Economics 44(20), 2607-2617.
Armatas, C. A., 2013. The Importance of Water-Based Ecosystem Services Derived from the
Shoshone National Forest. Thesis. The University of Montana, Missoula, Montana,
USA. Available at URL: http://etd.lib.umt.edu/theses/available/etd-01242013-102813/.
Accessed on October 23, 2013.
Arnold, D. O., 1970. Dimensional sampling: An approach for studying a small number of cases.
American Sociologist 5, 147-150.
Bagstad, K. J., Semmens, D., Winthrop, R., Jaworksi, D., Larson, J., 2012. Ecosystem services
valuation to support decisionmaking on public lands – A case study of the Sand Pedro
River watershed, Arizona: U.S. Geological Survey Scientific Investigations Report 2012-
5251, 93 p.
Baker, R., Thompson, C., Mannion, R., 2006. Q methodology in health economics. Journal of
Health Services Research & Policy 11(1), 38-45.
32
Barkmann, J., Glenk, K., Keil, A., Leemhuis, C., Dietrich, N., et al., 2008. Confronting
unfamiliarity with ecosystem functions: The case for an ecosystem service approach to
environmental valuation with stated preference methods. Ecological Economics 65, 48-
62.
Barry, J., Proops, J., 1999. Seeking sustainability discourses with Q methodology. Ecological
Economics 28, 337-345.
Bateman, I. J., Carson, R. T., Day, B., Hanemann, M., Hanley, N., et al., 2002. Economic
Valuation with Stated Preference Techniques. Edward Elgar, Cheltenham.
Bateman, I. J., Harwood, A. R., Mace, G., Watson, R. T., et al., 2013. Bringing ecosystem
services into economic decision-making: Land use in the United Kingdom. Science 341,
45-50.
BEA (Bureau of Economic Analysis), 2010. Regional Data: Total full-time and part-time
employment by industry. Available at URL:
http://www.bea.gov/iTable/iTable.cfm?ReqID=70&step=1&isuri=1&acrdn=5. Accessed
on September 15, 2012.
Bennett, J., and Adamowicz, V., 2001. Some fundamentals of environmental choice modelling,
in: Bennett, J., Blamey, R. (Eds.), The Choice Modelling Approach to Environmental
Valuation. Edward Elgar, Cheltenham, UK, pp. 37-69.
Blamey, R. K., Bennett, J. W., Louviere, J. J., Morrison, M. D., Rolfe, J., 2000. A test of policy
labels in environmental choice modeling studies. Ecological Economics 32, 269-286.
33
Blamey, R. K., Bennett, J. W., Louviere, J. J., Morrison, M. D., Rolfe, J., 2002. Attribute
causality in environmental choice modeling. Environmental and Resource Economics
23, 167-186.
Brown, S. R., 1980. Political Subjectivity: Applications of Q Methodology in Political Science.
Yale University Press, New Haven and London.
Brown, S. R., Durning, D. W., Selden, S., 1999. Q Methodology, in: Miller, G., Whicker, M. L.
(Eds.), Handbook of research methods in public administration (Vol. 71). Marcel Dekker,
New York, pp. 599-673.
Buchy, M., Hoverman, S., 2000. Understanding public participation in forest planning: a review.
Forest Policy and Economics 1, 15-25.
Coast, J., Hareth, A., Sutton, E. J., Horrocks, S. A., Vosper, A. J., Swancutt, D. R., Flynn, T. N.,
2012. Using qualitative methods for attribute development for discrete choice
experiments: Issues and recommendations. Health Economics 21, 730-741.
Coast, J., Horrocks, S., 2007. Developing attributes and levels for discrete choice experiments
using qualitative methods. Journal of Health Services Research & Policy 12(1), 25-30.
Cornatzer, B., 2014, April 3. Park County files objection to Forest Plan. Big Horn Radio
Network. Available at URL: http://www.mybighornbasin.com/Park-County-Files-
Objection-to-Forest-Plan/18733797. Accessed on 5/28/14.
Costanza, R., d’Arge, R., de Groot, R., Farber, S., Grasso, M., Hannon, B., Limburg, K., Naeem,
S., O’Neill, R. V., Paruelo, J., Raskin, R. G., Sutton, P., van den Belt, M., 1997. The
value of the world’s ecosystem services and natural capital. Nature 387, 253-260.
34
Cuppen, E., Breukers, S., Hisschemöller, M., Bergsma, E., 2010. Q methodology to select
participants for a stakeholder dialogue on energy options from biomass in the
Netherlands. Ecological Economics 69, 579-591.
De Groot, R. S., Wilson, M. A., Boumans, R. M. J., 2002. A typology for the classification,
description and valuation of ecosystem functions, goods and services. Ecological
Economics 41, 393-408.
Dietz, T., Stern, P. C., 2008. Public Participation in Environmental Assessment and Decision
Making. National Academies Press, Washington, DC.
Dodonova, A., 2009. An experimental test of anchoring effect. Applied Economics Letters 16(7),
677-678.
Dryzek, J. S., 2013. The Politics of the Earth: Environmental Discourses, third edition. Oxford
University Press, Oxford, UK.
Eden, S., Donaldson, A., Walker, G., 2005. Structuring subjectivities? Using Q methodology in
human geography. Area 37, 413-422.
Fischer, A., Hanley, N., 2007. Analysing decision behavior in stated preference surveys: A
consumer psychological approach. Ecological Economics 61, 303-314.
Focht, W., Lawler, J. J., 2000. Using Q Methodology to facilitate policy dialogue, in: Addams,
H., Proops, J. (Eds.), Social Discourse and Environmental Policy: An Application of Q
Methodology. Edward Elgar, Cheltenham, UK, pp. 100-122.
35
Gruber, J. S., 2011. Perspectives of effective and sustainable community-based natural resource
management: an application of Q-methodology to forest projects. Conservation and
Society 9, 159-171.
Hall, J., Viney, R., Haas, M., Louviere, J., 2004. Using stated preference discrete choice
modeling to evaluate health care programs. Journal of Business Research 57, 1026-1032.
Heal, G., 2000. Valuing ecosystem services. Ecosystems 3, 24-30.
Hein, L., van Koppen, K., de Groot, R. S., van Ierland, E. C., 2006. Spatial scales, stakeholders
and the valuation of ecosystem services. Ecological Economics 57, 209-228.
Ingraham, M. W., Foster, S. G., 2008. The value of ecosystem services provided by the U.S.
National Wildlife Refuge System in the contiguous U.S. Ecological Economics 67, 608-
618.
Kaplowitz, M. D., 2000. Identifying ecosystem services using multiple methods: Lessons from
the mangrove wetlands of Yucatan, Mexico. Agriculture and Human Values 17, 169-
179.
Kline, P., 1994. An easy guide to factor analysis. London: Routledge.
Kløjgaard, M. E., Bech, M., Søgaard, R., 2012. Designing a stated choice experiment: The value
of a qualitative process. Journal of Choice Modelling 5(2), 1-18.
Kragt, M. E., Bennett, J. W., 2012. Attribute framing in choice experiments: How do attribute
level descriptions affect value estimates?. Environ Resource Econ 51, 43-59.
36
Langlois, R. N., 1998. Rule-following, expertise, and rationality: A new behavioral
economics?, in: Dennis, K. (Ed.), Rationality in Economics: Alternative Perspectives.
Kluwer Academic Publishers, Boston, pp. 55-78.
Lennox, J., Proctor, W., Russel, S., 2011. Structuring stakeholder participation in New Zealand’s
water resource governance. Ecological Economics 70, 1381-1394.
Liu, S., Costanza, R., Farber, S., Troy, A., 2010. Valuing ecosystem services: Theory, practice,
and the need for a transdisciplinary synthesis. Ann. N.Y. Acad. Sci. 1185, 54-78.
Louviere, J. J., Hensher, D. A., Swait, J. D., 2000. Stated Choice Methods: Analysis and
Application. Cambridge University Press, Cambridge, UK.
Louviere, J. J., Lancsar, E., 2009. Choice experiments in health: the good, the bad, the ugly and
toward a brighter future. Health Economics, Policy and Law 4, 527-546.
Mansfield, C., Pattanayak, S. K., 2007. Getting started, in: Kanninen, B. (Ed.), Valuing
Environmental Amenities using Choice Experiments: A Common Sense Guide to Theory
and Practice. Economics of Non-market Goods and Resources Series, Volume 8.
Springer Science, Netherlands, pp. 1-20.
McDaniels, T. L., Gregory, R., Arvai, J., Chuenpagdee, R., 2003. Decision structuring to
alleviate embedding in environmental valuation. Ecological Economics 46, 33-46.
McKeown, B., Thomas, D., 1988. Q Methodology. Sage Publications, Inc., Newbury Park,
California.
Menzel, S., Teng, J., 2009. Ecosystem services as a stakeholder-driven concept for conservation
science. Conservation Biology 24, 907-909.
37
Meyerhoff, J., Liebe, U., 2006. Protest beliefs in contingent valuation: Explaining their
motivation. Ecological Economics 57, 583-594.
Meyerhoff, J., Liebe, U., 2010. Determinants of protest responses in environmental valuation:
A meta-study. Ecological Economics 70, 366-374.
Meyerhoff, J., Bartczak, A., Liebe, U., 2012. Protester or non-protester: a binary state? On the
use (and non-use) of latent class models to analyse protesting in economic valuation. The
Australian Journal of Agricultural and Resource Economics 56, 438-454.
Michaels-Igbokwe, C., Lagarde, M., Cairns, J., Terris-Prestholt, F., 2014. Using decision
mapping to inform the development of a stated choice survey to elicit youth preferences
for sexual and reproductive health and HIV services in rural Malawi. Social Science &
Medicine 105, 93-102.
Millennium Ecosystem Assessment, 2005. Ecosystems and Human Well-Being: Synthesis.
Island Press, Washington, DC.
Moy, C., 2011, July 19. 3 groups appeal air quality permit for UM biomass boiler. Missoulian.
Available at URL: http://missoulian.com/news/local/groups-appeal-air-quality-permit-
for-um-biomass-boiler/article_a177667c-b1bb-11e0-8354-001cc4c002e0.html. Accessed
3 June 2014.
Newell, L. W., Swallow, S. K., 2013. Real-payment choice experiments: Valuing forested
wetlands and spatial attributes within a landscape context. Ecological Economics 92, 37-
47.
38
Powe, N. A., 2007. Redesigning Environmental Valuation: Mixing Methods within Stated
Preference Techniques. Edward Elgar, Cheltenham, UK.
Ray, L., 2011. Using Q-methodology to identify local perspectives on wildfires in two Koyukon
Athabascan communities in rural Alaska. Sustainability: Science, Practice, & Policy 7,
18-29.
Richardson, J. J., Jordan, A. G., 1983. Overcrowded policymaking: Some British and European
reflections. Policy Sciences 15(3), 247-268.
Rutgers, M., van Wijnen, H. J., Schouten, A. J., Mulder, C., Kuiten, A. M. P., Brussaard, L.,
Breure, A. M., 2012. A method to assess ecosystem services developed from soil
attributes with stakeholders and data of four arable farms. Science of the Total
Environment 415, 39-48.
Sauer, U., Fischer, A., 2010. Willingness to pay, attitudes and fundamental values – On the
cognitive context of public preferences for diversity in agricultural landscapes.
Ecological Economics 70, 1-9.
Stainton Rogers, R., 1995. Q methodology, in: Smith, J. A., Harre, R., Van Langenhove, L.
(Eds.), Q methodology. Rethinking methods in psychology. Sage, CA, pp. 178-192.
Steelman, T. A., Maguire, L. A., 1999. Understanding participant perspectives: Q-methodology
in national forest management. Journal of Policy Analysis and Management 18, 361-388.
Stephenson, W., 1978. Concourse theory of communication. Communication 3, 21-40.
Szabó, Z., 2011. Reducing protest responses by deliberative monetary valuation: Improving the
validity of biodiversity valuation. Ecological Economics 72, 37-44.
39
Turner, R. K., Daily, G. C., 2008. The ecosystem services framework and natural capital
conservation. Environmental Resource Economics 39, 25-35.
United States Census Bureau, 2010. Profile of General Population and Housing Characteristics:
2010. Available at URL:
http://factfinder2.census.gov/faces/tableservices/jsf/pages/productview.xhtml?pid=DEC_
10_DP_DPDP1&prodType=table. Accessed on September 15, 2012.
Venn, T. J., Quiggin, J., 2007. Accommodating indigenous cultural heritage values in resource
assessment: Cape York Peninsula and the Murray-Darling Basin, Australia. Ecological
Economics 61, 334-344.
Videira, N., Antunes, P, Santos, R., Lobo, G., 2006. Public and stakeholder participation in
European water policy: a critical review of project evaluation processes. European
Environment 16, 19-31.
Watts, S., & Stenner, P., 2005. Doing Q methodology: theory, method and interpretation.
Qualitative Research in Psychology 2, 67-91.
Watts, S., & Stenner, P., 2012. Doing Q Methodological Research: Theory, Method and
Interpretation. London: SAGE Publications Ltd.

40
Table 1. The Q-set of categorized water-based ecosystem services derived from the Shoshone
National Forest, Wyoming.
Ecosystem Services Regulating
(1) Water quality (18) Supporting of commercial land-based recreation
(2) In-stream flow Cultural (3) Conservation of keystone (critical) species (19) River-based fishing
(4) Conservation of rare plant species (20) Lake/reservoir fishing
(5) Biodiversity conservation (21) Lake, reservoir, and river-based hunting
(6) Gradual discharge of stored water (22) Land-based hunting
(7) Natural flood control (23) River recreation
(8) Glacier-based services (24) Lake/reservoir recreation
(9) Nutrient cycling and sediment transport (25) Commercial water-based recreation
Provisioning (26) Motorized ice and snow based recreation
(10) Household/municipal water (27) Non-motorized ice and snow based recreation
(11) Hydropower (28) Recreation/leisure activities done near water
(12) Commercial irrigation (29) Physically and mentally challenging recreation
(13) Personal irrigation (30) Education, management and science
(14) Water for stock (31) Native American cultural and spiritual values
(15) Manufacturing and industrial (32) Non-Native American cultural and spiritual values
(16) Oil and natural gas extraction, and mining (33) Preserving livelihoods, lifestyles, and landscapes
(17) Fighting forest fires (34) Inspirational and aesthetic values
41
Please rank the statements on the cards from most important to most unimportant from your
perspective. Each statement represents a water-based ecosystem service derived from the
Shoshone National Forest.
Figure 1. Q-board and instructions given to the participant for the Q-sorting exercise in the case study.
42
Figure 2. Factor arrays illustrating the relative importance of water-based ecosystem services to participants who hold the:
(A) Environmental Perspective; (B) Agricultural Perspective; (C) Native American Perspective; and (D) Recreation Perspective.
Note: Regulating services are in black boxes; provisioning services are in grey boxes; and cultural services are in
white boxes.
A B
C D