Embed Size (px)
Citation preview

30th Sep' 2017
3 30th June' 2017
Application of Funds
Non-Current Assets 4,860,781,776 4,811,878,401
Property, Plant and Equipment 3.00 2,862,069,376 2,884,022,386
Capital Work-in-process 4.00 1,998,712,400 1,927,856,015
Investment 5.00 100,381,538 100,381,538
Current Assets 7,636,958,316 7,588,072,483
Inventories 6.00 1,885,552,166 2,073,061,052
Trade & Other Receivables 7.00 2,964,350,668 2,933,494,369
Advances, Deposits and Prepayments 8.00 2,757,213,203 2,561,727,721
Cash and Cash Equivalent 9.00 29,842,278 19,789,340
TOTAL ASSETS 12,598,121,629 12,500,332,422
Source of Funds:
Shareholders Equity 7,872,335,029 7,845,909,815
Share Capital 10.00 3,542,000,000 3,542,000,000
Share Premium 11.00 1,200,000,000 1,200,000,000
Revaluation Surplus 12.00 1,141,578,189 1,141,578,189
Retained Earnings 13.00 1,988,756,840 1,962,331,626
Non-Current Liabilities 978,474,250 1,064,368,064
Long Term Borrowings 14.00 889,878,204 992,428,084
Long Term Liabilities for Deferred Taxes 20.00 88,596,046 71,939,980
Current Liabilities 3,747,312,350 3,590,054,543
Short Term Borrowings 15.00 2,064,756,653 1,914,143,972
Bank Overdraft 16.00 267,630,104 284,054,401
Current Portion of Long Term Borrow 14.00 755,337,329 802,396,307
Liabilities for Expenses 17.00 102,760,705 55,858,170
Trade & Other Payables 18.00 15,883,080 16,368,582
Provision for Income Tax 19.00 384,925,714 370,565,287
Other Provisions 21.00 156,018,765 146,667,825
TOTAL EQUITY AND LIABILITIES 12,598,121,629 12,500,332,422
CONTINGENT LIABILITIES & COMMITMENT
Net Asset Value (NAV) 30.00 22.23 22.15
Sd/- Sd/-
Chief Financial Officer Chairman
Sd/-
Company secretary
Dated: 11th November, 2017
Sd/-
Sd/-
Director
APPOLLO ISPAT COMPLEX LIMITED
Statement of Financial Position
As on 30 Sep' 2017
Amount in TakaNotesParticulars
The accounting policies and other notes from 01 to 34 form an integral part of the
Financial Statements. The Financial Statements were authorized for issue by the
Board of Directors on 11.11.2017 and signed on its behalf by :
Managing Director
1
Net Turnover 22.00 1,247,664,353 1,761,298,970 5,714,343,956
Cost of Sales 23.00 (1,017,499,350) (1,332,071,619) (4,603,973,529)
A.Gross Profit 230,165,003 429,227,351 1,110,370,427
Operating Expenses:
Administrative Expenses 24.00 (32,533,190) (32,520,162) (134,903,485)
Selling and Distribution Expenses 25.00 (15,818,722) (8,307,831) (44,716,524)
B.Total Operating Expenses (48,351,913) (40,827,992) (179,620,010)
C.Profit from Operating Activities (A-B) 181,813,090 388,399,359 930,750,417
Financial Expenses 26.00 (148,581,763) (119,941,510) (420,600,360)
Net Profit from Operation 33,231,328 268,457,849 510,150,058
Non Operating Income 27.00 28,496,401 31,003,037 169,844,209
Profit before Gratuity and WPPF Fund 61,727,729 299,460,886 679,994,267
Provision For Gratuity 21.01 (1,262,774) (4,851,713) (7,571,303)
Provision for Workers Profit Participation Fund (WPPF) 21.02 (3,023,248) (14,730,459) (33,621,148)
Profit Before Income Tax 57,441,707 279,878,714 638,801,815
Taxation (Expenses)/Income 28.00 (31,016,492) (63,297,358) (160,076,486)
Net Profit after Tax 26,425,214 216,581,356 478,725,329
7.87%
Basic Earning per share (Taka) 29.00 0.07 0.67 1.35
Sd/- Sd/-
Chief Financial Officer Chairman
Sd/- Sd/-
Company secretary Director
Dated: 11th November, 2017
30th June 2017
These financial statements should be read in conjunction with the annexed notes from 1 to 34
Notes July'16 to Sep'16
Managing Director
Sd/-
APPOLLO ISPAT COMPLEX LIMITED
Statement of Profit or Loss and Other Comprehensive Income
For the Period of ended 30th September 2017
Amount in Taka
July'17 to Sep'17Particulars
2
Cash Flow from Operating Activities:
Cash receipts from customers and others 1,216,808,055 1,879,607,421 5,206,004,600
Cash receipts from others income 28,496,401 31,003,037 169,844,209
Cash payments for suppliers, employees and others (997,615,815) (1,841,152,399) (5,258,719,061)
A) Net Cash used in Operating Activities 247,688,641 69,458,059 117,129,749
Cash Flow from Investing Activities:
Purchase of property, plant and equipment (2,610,974) (69,787,819) (34,515,380)
Capital Work in Process (70,856,385) (23,521,663) (114,406,285)
B) Net Cash used in Investing Activities (73,467,359) (93,309,482) (148,921,665)
Cash Flow from Financing Activities:
Dividend Paid (166,107) - (135,839,966)
Borrowing Costs/Finance Costs (148,581,763) (119,941,510) (420,600,360)
Increase/(Decrease) in bank overdraft (16,424,297) 19,191,580 85,300,293
Increase/(Decrease) in short term borrowings 150,612,680 240,534,263 866,804,308
Increase/(Decrease) in long term borrowings (149,608,858) (101,532,333) (363,818,002)
C) Net Cash Flow from Financing Activities (164,168,344) 38,252,000 31,846,274
Net increase in Cash and Bank Balances (A+B+C) 10,052,938 14,400,577 54,358
Cash and Bank balances at beginning of period 19,789,340 19,734,983 19,734,982
Cash and Bank Balances at end of Period 29,842,278 34,135,560 19,789,340
Net Operating Cash Flows per share-NOCFPS 0.70 0.22 0.33
These financial statements should be read in conjunction with the annexed notes from 1 to 34
Sd/- Sd/- Sd/-
Chief Financial Officer Managing Director Chairman
Sd/- Sd/-
Company secretary Director
Dated: 11th November, 2017
July'17 to Sep' 17
Amounts in Taka
July'16 to sep'16Particulars
30th June' 2017
APPOLLO ISPAT COMPLEX LIMITED
Statement of Cash Flows
For the Period of ended 30th September, 2017
3
Particulars Revaluation Reserve Total Equity
Balance as at 01-07-2016 3,220,000,000 1,200,000,000 1,966,606,296 1,141,578,189 7,528,184,485
Net Profit after Tax 216,581,356 216,581,356
Increased in Paid up capital
Adjustment of Dividend
Less:ReversalTax benefit on Unabsorbed
Closing Balance (30-09-2016) 3,220,000,000 1,200,000,000 2,183,187,652 1,141,578,189 7,744,765,841
Balance as at 01-07-2017 3,542,000,000 1,200,000,000 1,962,331,626 1,141,578,189 7,845,909,815
Net Profit after Tax 26,425,214 26,425,214
Increased in Paid up capital
Adjustment of Dividend
Less:ReversalTax benefit on Unabsorbed
Closing Balance (30-09-2017) 3,542,000,000 1,200,000,000 1,988,756,840 1,141,578,189 7,872,335,029
These financial statements should be read in conjunction with the annexed notes from 1 to 34
Sd/-
Chief Financial Officer
Sd/- Sd/-
Company secretary Director
Dated: 11th November, 2017
APPOLLO ISPAT COMPLEX LIMITED
Statement of Changes In EquityAs on 30 Sep' 2017
Managing Director
Share Capital Share premium Retained Earnings
Chairman
Sd/- Sd/-
4
Balance as on
01.07.2017 Addition Revaluation Disposal
Total Cost as at
30.09.2017
Rate
%
Balance as on
01.07.2017
Charge
During the
Period
Disposal Accumulated Dep.
as on 30.07.2017
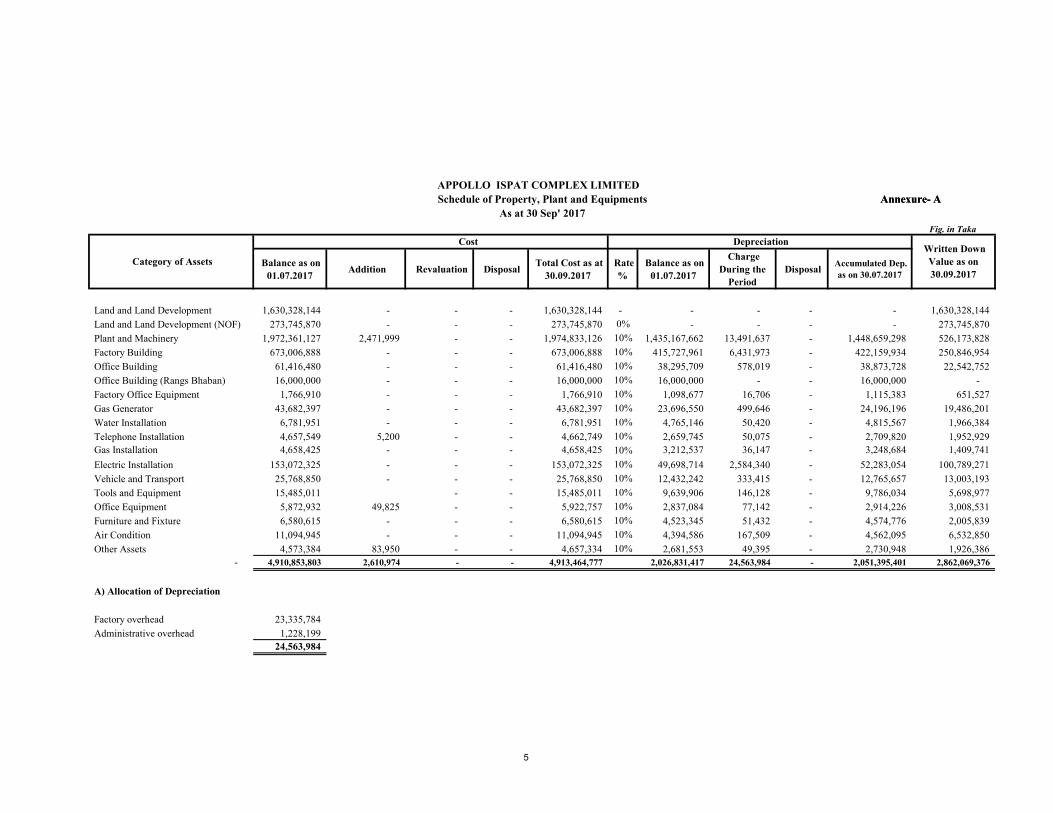
Land and Land Development 1,630,328,144 - - - 1,630,328,144 - - - - - 1,630,328,144
Land and Land Development (NOF) 273,745,870 - - - 273,745,870 0% - - - - 273,745,870
Plant and Machinery 1,972,361,127 2,471,999 - - 1,974,833,126 10% 1,435,167,662 13,491,637 - 1,448,659,298 526,173,828
Factory Building 673,006,888 - - - 673,006,888 10% 415,727,961 6,431,973 - 422,159,934 250,846,954
Office Building 61,416,480 - - - 61,416,480 10% 38,295,709 578,019 - 38,873,728 22,542,752
Office Building (Rangs Bhaban) 16,000,000 - - - 16,000,000 10% 16,000,000 - - 16,000,000 -
Factory Office Equipment 1,766,910 - - - 1,766,910 10% 1,098,677 16,706 - 1,115,383 651,527
Gas Generator 43,682,397 - - - 43,682,397 10% 23,696,550 499,646 - 24,196,196 19,486,201
Water Installation 6,781,951 - - - 6,781,951 10% 4,765,146 50,420 - 4,815,567 1,966,384
Telephone Installation 4,657,549 5,200 - - 4,662,749 10% 2,659,745 50,075 - 2,709,820 1,952,929
Gas Installation 4,658,425 - - - 4,658,425 10% 3,212,537 36,147 - 3,248,684 1,409,741
Electric Installation 153,072,325 - - - 153,072,325 10% 49,698,714 2,584,340 - 52,283,054 100,789,271
Vehicle and Transport 25,768,850 - - - 25,768,850 10% 12,432,242 333,415 - 12,765,657 13,003,193
Tools and Equipment 15,485,011 - - 15,485,011 10% 9,639,906 146,128 - 9,786,034 5,698,977
Office Equipment 5,872,932 49,825 - - 5,922,757 10% 2,837,084 77,142 - 2,914,226 3,008,531
Furniture and Fixture 6,580,615 - - - 6,580,615 10% 4,523,345 51,432 - 4,574,776 2,005,839
Air Condition 11,094,945 - - - 11,094,945 10% 4,394,586 167,509 - 4,562,095 6,532,850
Other Assets 4,573,384 83,950 - - 4,657,334 10% 2,681,553 49,395 - 2,730,948 1,926,386
- 4,910,853,803 2,610,974 - - 4,913,464,777 2,026,831,417 24,563,984 - 2,051,395,401 2,862,069,376
A) Allocation of Depreciation
Factory overhead 23,335,784
Administrative overhead 1,228,199
24,563,984
APPOLLO ISPAT COMPLEX LIMITED
Schedule of Property, Plant and Equipments
As at 30 Sep' 2017
Category of Assets
Cost Depreciation Written Down
Value as on
30.09.2017
Annexure- A
Fig. in Taka
Annexure- A
5
1.00 Reporting Entity and its Activities:
1.01 Legal forms of the Entity:
1.02 Nature of Business Activities:
1.03 Factory Operations:
2.00
2.01
2.02
The preparation of Financial Statements requires management to make judgments, estimates and assumptions
that affect the reported amounts of revenues, expenses, assets & liabilities and the accompanying disclosures.
Uncertainty about these assumptions and estimates could result in outcomes that require a material adjustment to
the carrying amount of assets or liabilities affected in future periods. Actual results may differ from these
estimates and under lying assumptions are reviewed on an ongoing basis.
This comprises Statement of Financial Position, Statement of Profit or Loss and Other Comprehensive Income,
Statement of Changes in Equity, Statement of Cash Flows, Notes to the Financial Statements covering accounting
policies. This is prepared under the historical cost convention and in accordance with the requirements of the
Companies Act, 1994 and the Bangladesh Accounting Standards (BASs) adopted by the Institute of Chartered
Accountants of Bangladesh (ICAB) as well as those standards, disclosures recommended by BASs & BFRSs and
as applicable to this Company. The Board of Directors are responsible for preparing and presenting the financial
statements including adequate disclosures, who approved and authorized for issue of this financial statements.
The preparation of the financial statements in conformity with the Bangladesh Accounting Standards (BASs)
requires Board of Directors to make estimates and assumptions that affect the reported amounts of revenues and
expenses, assets and liabilities at the date of the reporting period.
Due to the inherent uncertainty involved in making estimates, actual result could differ from those estimates.
The Company is engaged in manufacturing and marketing of CR Coil, GP Coil ,CI (Corrugated Iron) Sheet of
different thickness, ranging from 0.120 mm to 0.420 mm, under its well established brand " Rani Marka Dheutin"
which is used mainly in rural and semi-urban areas of Bangladesh for construction of traditional houses and
fencing and raw materials of Colour coated CI Sheet Industries.
Appollo Ispat Complex Limited started its journey by setting up its factory at Shimrail, Siddhirgong, Narayangang
and went into commercial production in its 1st modern and sophisticated Continuous Galvanizing Line (CGL) in
early July 1997 and 2nd CGL early 2002 and Cold Rolled Manufacturing unit in January 2005.
To meet the growing market demand management intends to further expand its operation through introducing a
new environment friendly product named Non Oxidized Furnace (NOF) C.I Sheet with a production capacity of
60,000 MT.The project is expected to go into commercial production from June, 2017.
The factory comprises of land measuring 1675.05 decimals, around 13 buildings like factory buildings (CGL, NOF
CGL & CRM) different factory sheds, office building and guest house etc. constructed in different years and plant
and machineries like CGL, CRM, Effluent Treatment Plant, Boiler, Acid Regenerating Plant, Corrugation Machine,
Sharing Machine, Softener Plant, DM Plant, Dryer Machine, EOT Crane, Compressor, Gas Generator and Cooling
Machine etc. were purchased from different countries viz India, Japan, Germany etc.
Significant Accounting Policy for the Presentation of the Financial Statements:
The specific accounting policies selected and applied by the company’s management for significant transactions
and events that have material effects within the framework of Bangladesh Accounting Standard (BAS-I)
“Presentation of Financial Statements”, in preparation and presentation of financial statements have been
consistently applied throughout the year and were also consistent with those used in earlier years.
Corporate Financial Statements:
Use of Estimates and Judgments:
APPOLLO ISPAT COMPLEX LIMITEDNotes to the Financial Statements
As at and for the year ended 30 Sep 2017
The Registered Office of the company is located at 407, Tejgaon Industrial Area,(4th Floor) Dhaka-1208. The
industrial units are located at Shimrail, Siddhirgonj, Narayanganj, Dhaka.
Appollo Ispat Complex Limited (hereinafter referred to as "AICL"/"Appollo"/"the company") is a public limited
company was incorporated in Bangladesh on December 31, 1994 as a "private company" limited by shares.
Subsequently, the company was converted into "Public Company" limited by shares vide special resolution passed
in Extraordinary General Meeting held on March 30, 2010.
The Company listed with both Dhaka Stock Exchange Ltd. and Chittagong Stock Exchange Ltd. on December 24,
2013.
6
APPOLLO ISPAT COMPLEX LIMITEDNotes to the Financial Statements
As at and for the year ended 30 Sep 20172.03 Going Concern:
2.04
2.05 Reporting Period:
2.06 Reporting Currency:
2.06 Segmental Reporting:
2.07
2.08 Comparative Information and Re-arrangement Thereof:
2.09 Compliance with BAS:
BAS 1
BAS 2
BAS 7
BAS 10
BAS 12
BAS 16
BAS 18
BAS 19
BAS 21
BAS 23
BAS 24
BAS 25
BAS 33
BAS 34
BAS 36
BAS 37
Events after the reporting period
Income Taxes
Property, Plant and Equipment
Revenue
Employee Benefits
The related BFRS are also complied for the preparation of this financial statements.
Related Party Disclosures
The Effects of Changes in Foreign Exchange Rates
Provisions, Contingent Liabilities and Contingent Assets
Earnings Per Share
The figures in the financial statements represent Bangladesh currency (Taka), which have been rounded off to the
nearest integer.
No segmental reporting is applicable for the company as required by BAS 14: Segment Reporting as the company
operates in a single industry segment and within a single geographical segment.
Fundamental Accounting Concepts/ Assumption:
The financial statements have been prepared under historical cost convention on Accrual concept and such other
convection as required by BAS-1 and BFRS for fair presentation of financial statements.
The following BAS is applicable to the financial statements for the year under review:
This report is the1st Quarter of the financial period of 1st July' 2017 to 30th September; 2017.
The company has adequate resources to continue its operation for the foreseeable future. For this reasons the
directors continue to adopt going concern basis in preparing the accounts. The current credit facilities and
resources of the company provides sufficient fund to meet the present requirements of its existing business.
Foreign Currency Transactions:
The financial statements are presented in Taka/Tk./BDT, which is company's functional currency. Transactions in
foreign currencies are recorded in the books at exchange rate prevailing on the date of the transaction. Monetary
assets and liabilities are converted at the rates prevailing at the statement of financial position date. Non-monetary
assets and liabilities denominated in foreign currencies, stated at historical cost, are translated into Bangladeshi
Taka at the exchange rate ruling at the date of transaction. Exchange differences arising on the settlement of
monetary items or on translating monetary items at the end of the reporting period are recognized in profit or loss
as per BAS-21 "The Effects of Changes in Foreign Exchange Rates".
Investment
Comparative Information has been disclosed for all numerical information in the financial statements and also the
narrative and descriptive information where it is relevant for understanding of the current period's financial
statements. Comparative figures have been re-arranged wherever considered necessary to ensure better
comparability with the current period without causing any impact on the profit and value of assets and liabilities as
reported in the financial statements.
In accordance with the provisions of BAS-34: Interim Financial Reporting, Comparative information has been
disclosed for all numerical information in the financial statements and also the narrative and descriptive
information where it is relevant for understanding of the current period's financial statements.
Comparative figures have been re-arranged wherever considered necessary to ensure better comparability with
the current period without causing any impact on the profit and value of assets and liabilities as reported in the
financial statements.
Presentation of Financial Statements
Inventories
Statement of Cash Flows
Borrowing Costs
Impairment of Assets
Interim Financial Reporting (For Quarterly Reporting)
7

APPOLLO ISPAT COMPLEX LIMITEDNotes to the Financial Statements
As at and for the year ended 30 Sep 2017
2.10
2.11 Net Profit Before Tax:
2.12 Regulatory Compliance:
The Companies Act, 1994
The Income Tax Ordinance, 1984
The Income Tax Rules, 1984
The Customs Act 1969
2.13
2.13.1
These are capitalized at cost of acquisition and subsequently stated at cost less accumulated depreciation. The
cost of acquisition comprises of purchase price, including import duties and non-refundable Taxes and any directly
attributable cost of bringing the assets to its state of its intended use. Expenditure incurred after the assets have
been put into operation, such as repairs and maintenance is normally charged off as revenue expenditure in the
period in which it is incurred. In situation where it can be clearly demonstrated that the expenditure has resulted in
an increase in the future economic benefit expected to be obtained from the use of the fixed assets, the
expenditure is capitalized as an additional cost of the assets.
Revaluation of Property, Plant & Equipment (PPE):
PPE have been stated at cost other than Land which revalued amounts in accordance with BAS: 16 Property ,
Plant & Equipment. The Land as on 30 June 2012 have been revalued at fair market value as per decision of the
board of directors. The revaluation of assets has been made at present market value. Increase in the carrying
amount arising on revaluation are credited to “Revaluation Surplus” under share holders equity.
distribution of such surplus to the shareholders is restricted.
i) Effective date of revaluation to the Financial Statements 30-06-2012.
ii) Land has been revalued by A. Wahab & Co. Chartered Accountants a Govt. approved independent valuer.
iii) Revaluation surplus of Land & Land development has been transferred to Revaluation Reserve and
Events after the Reporting Date:
In compliance with the requirements of BAS 10: Events after the reporting period, post events that provide
additional information about the company's position at the reporting date are reflected in the financial statements
and events after reporting date that are not adjusting events are disclosed in the notes when material.
Net Profit Before Tax for the year were not materially affected by:
(b) Circumstances of an exceptional or non-recurring nature;
(c) Changes of credits relating to prior years; and
(d) Changes in accounting policies.
The Financial Statements have been prepared in compliance with the following laws and regulations:
The Value Added Tax (VAT) Act, 1991
The Value Added Tax (VAT) Rules, 1991
(a) Transaction of a nature not usually undertaken by the company;
Securities and Exchange Rules, 1987
Securities and Exchange Ordinance, 1969
Securities and Exchange Commission Act 1993
Recognition and measurement of Tangible Fixed Assets:
8
APPOLLO ISPAT COMPLEX LIMITEDNotes to the Financial Statements
As at and for the year ended 30 Sep 2017
2.13.2
Land & Land Development Nil
All other Fixed Assets 10%
2.13.3
2.13.4 Capital Work in Process:
2.13.5
2.13.6 Impairment of Assets:
2.13.7 Subsequent Costs:
2.14 Inventories:
Nature of Inventories
Raw Materials
Work-in Progress
Chemicals, Stores and Spares
Finished Goods
Capitalization of Borrowing Costs:
As per the requirements of IAS /BAS- 23 ''Borrowing Cost'', directly attributable borrowing cost are capitalised
during construction period for all qualifying assets. A qualifying asset is an asset that necessarily takes a
substantial period of time to get ready for its intended use or sale. The borrowing costs that are directly
attributable to the acquisition , construction or production of a qualifying asset are those borrowing costs that
would have been avoided if the expenditure on the qualifying asset had not been made. All other borrowing cost
are recognized in profit or loss in the period in which they are incurred.
All fixed assets have been reviewed and it was confirmed that no such fixed assets have been impaired during the
year and for this reason no provision has been made for Impairment of assets as per BAS-36.
Inventories are measured at the lower of cost and net realizable value as prescribed by BAS-2. The cost of
inventories is based on the weighted average method, and includes expenditure incurred in acquiring the
inventories, production or conversion costs and other costs incurred in bringing them to their existing location and
condition. In the case of manufactured inventories and work-in-progress, cost includes an appropriate share of
production overheads based on normal operation capacity.
Depreciation of Tangible Fixed Assets:
Derecognition:
Depreciation Methods, useful lives and residual values are reviewed at each financial year end and adjusted if
appropriate.
Cost Formula
Weighted Average Cost
Material cost Plus Proportionate conversion cost based on percentage of
completion.
Weighted Average Cost
Valued at cost or net realizable value whichever is lower
The cost of replacing part of an items of property, plant and Equipment is recognized in the carrying amount of the
item if it is probable that the future benefit embodied within the part will flow to the company and its cost can be
measured reasonably. The costs of the day to day servicing of Property, Plant and equipment are recognized in
the profit & loss as expenses.
No depreciation is charged on Land and Land Development and Capital Work in Process (CWIP) as the land and
land development has ultimated useful life and the Capital Work in Process has not yet been started commercial
operation.
Depreciation on fixed assets other than Land & Land Development have been computed during the year using
the reducing balance method. Depreciation of an asset commences when the asset is available for use and
ceases at the earlier of the date the asset is classified as held for sale and the date the asset is derecognized.
After considering the useful life of assets as per BAS-16, the annual depreciation rates have been applied as
under which is considered reasonable by the management.
An item of Property, Plant and Equipment is derecognized upon disposal or when no future economic benefits are
expected from its use or disposal. Any gain or loss on derecognition of an item of property, Plant and Equipment is
determined as the difference between the net disposal proceeds and the carrying amount of the asset and is
recognized in profit or loss.
Capital Work in Process consists of unfinished work of NOF project and capital inventory. The major civil works
are completed and erection of prefabricated steel structure building has already completed, the commission and
errection of capital machinery has already started and expected to complete.Commercial production may resume
end of June 2017. Spare Parts expected to be used for more than one year are treated as Capital work in
process. Capital Work in Process is recognised when risks and rewards associated with such assets are
transferred to the company.
9
APPOLLO ISPAT COMPLEX LIMITEDNotes to the Financial Statements
As at and for the year ended 30 Sep 2017
2.15 Trade Debtors:
2.16 Cash & Cash Equivalents:
2.17 Income Tax:
2.17.1 Provision For Income Tax:
2.17.2 Deferred Tax:
2.18 Revenue Recognition:
2.19 Employee Benefits:
a)
b)
i) Staff Gratuity:
ii)
iii) Annual Leave Encashment
The Company decided to operate for workers a 'Workers Profit Participation and Welfare Fund' as per section-234
of Bangladesh Labor Act-2006 and provision has been made during the period.@ 5% of the profit before charging
such expense.
Defined Contribution Plan (Provident fund):
The company adopted a policy to establish a contributory Provident Fund (CPF) scheme under the defined
contribution plan. The fund will be operated by a separate board of trustees after approval by the NBR as per
Income Tax Ordinance, 1984. All eligible employees will contribute @ 5% of their basic pay to the fund. The
company also will contribute equal of employees contribution to the fund. The fund will be managed under Trust
Rules. Necessary steps has been taken for constitution of the fund.
Defined Benefit Plan :
The Company Operates gratuity scheme, and provision in respect of which is made annually covering all its
eligible employees. Provision for Gratuity has been made for all eligible employees for current year equivalent to
two basic pay.
Workers Profit Participation & Welfare Fund:
The Company provides annual leave encashment benefit to all permanent employees under short term
employees benefit obligations. Annual leave encashment benefit obligations are measured on an undiscounted
basis . Provision is created for the amount of annual leave encashment under salary and allowance based on the
latest basic salary.
Revenue from the sale of goods is measured at the fair value of the consideration received or receivable, net of
returns, trade discounts and volume rebates exclusive of VAT as per BAS-18. Revenue is recognized when the
significant risks and reward of ownership have been transferred to the buyer, recovery of the consideration is
probable, the associates costs and possible return of goods can be estimated reliably & there is no continuing
management involvement with the goods sold. Transfer of risk and rewards occurs for the sale of goods when the
product is delivered along with dispatch documents and invoices to customers.
Appollo Ispat Complex Ltd.is maintaining both defined contribution plan and defined benefit plan for its eligible
permanent employees. The eligiblity is determined according to the terms and conditions as mentioned in the
respective deeds.The defined contribution plan and defined benefit plan are funded.
According to BAS 7 'Statement of Cash Flows' cash comprises of cash in hand, demand deposits and Cash
equivalents which are short term highly liquid investments that are readily convertible to Cash and which are
subject to an insignificant risk of changes in value. BAS 1 ``Presentation of Financial Statements'' provides that
Cash & Cash Equivalents are not restricted in use. Considering the provision of BAS 7 & BAS 1, Cash in Hand &
Bank Balances have been treated as Cash & Cash Equivalents.
The company has decided to adopt policy of reorganization of deferred tax in accordance with the Bangladesh
Accounting Standard (BAS)-12. Deferred tax is provided using the liability method for temporary difference
between the carrying value of fixed assets as per accounts and the corresponding income tax written down value.
Deferred tax is calculated at the effective Income Tax rate.
Trade debtors are carried at original invoice amount less an estimate made for doubtful debts based on a review
of all outstanding amounts at the year end.
Provision for taxation has been made as per rates prescribed in Finance Act 2016 and the Income Tax
Ordinance,1984 on the profit made by the company. As per BAS-12" Income Taxes'' income Tax provision has
been made during the year as the company earned taxable income.
10
APPOLLO ISPAT COMPLEX LIMITEDNotes to the Financial Statements
As at and for the year ended 30 Sep 2017
2.20 Financial expenses/ Borrowing cost:
2.21 Statement of Cash Flows:
2.22 Provisions:
a.
b.
c. Reliable estimates can be made of the amount of the obligation.
Dividend
2.23 Earnings Per Share:
2.24 Components of Financial Statements:
• Statement of Financial Position as on 30 Sep' 2017
• Statement of Profit or Loss and other Comprehensive Income for the Period ended 30 Sep '2017
• Statement of Cash Flows for the Period ended 30 Sep'2017
• Statement of Change in Equity for the Period ended 30 Sep' 2017
• Accounting Policies and explanatory notes to the financial statements.
2.25 Responsibility for preparation and presentation of Financial Statements:
2.26 Risk and uncertainties for use of estimates in preparation of financial statements:
when it is probable that an outflow of resources embodying economic benefits will be required to settle the
obligation; and
The company recognizes a liability to make cash dividend when the distribution is authorize and the distribution is
no longer at the discretion of the company. As per the corporate laws in Bangladesh, a distribution is authorized
when it is approved by the shareholders in the Annual General Meeting (AGM). A corresponding amount is
recognized directly in equity.
This has been calculated in compliance with the requirements of BAS 33: Earnings Per Share is the basic
earnings dividing by the weighted average number of ordinary shares outstanding the end of the year.
The Board of Directors is responsible for the preparation and presentation of Financial Statements under Section
183 of the Companies Act, 1994 and as per the provision of "the framework for the preparation and presentation
of financial statements” issued by the International Accounting Standards Committee (IASC).
Statement of Cash Flows is prepared principally in accordance with IAS 7 as adopted by ICAB as BAS 7
“Statement of Cash Flows” and the cash flows from the operating activities have been presented under direct
method as prescribed by the Securities and Exchange Rules, 1987 and considering the provision of paragraph 19
of IAS 7 which provides that “enterprises are encouraged to report cash flows from operating activities using the
direct method”.
In accordance with the guidelines as prescribed by BAS-37: Provisions, Contingent Liabilities and Contingent
Assets, provisions are recognized in the following situations:
when the company has an obligation ( legal or constructive) as a result of past events;
Finance expenses/ Borrowing cost comprise interest expenses, financial charges and exchange differences
arising from foreign currency borrowings on bank loan, finance lease and other borrowings. Borrowing costs are
recognized as expenses in the period in which they incurred and capitalized the same that incurred before
commencement of commercial operation.
The preparation of financial statements in conformity with the International Accounting Standards requires
management to make estimates and assumption that affect the report, amounts of assets and liabilities and
disclosure of contingent assets and liabilities at the date of the financial statements and revenue and expenses
during the period reported. Actual results could differ from those estimates. Estimates are used for accounting of
certain terms such as long term contracts, provision for doubtful accounts, depreciation and amortization,
employees benefit plans, taxes reserves and contingencies.
11
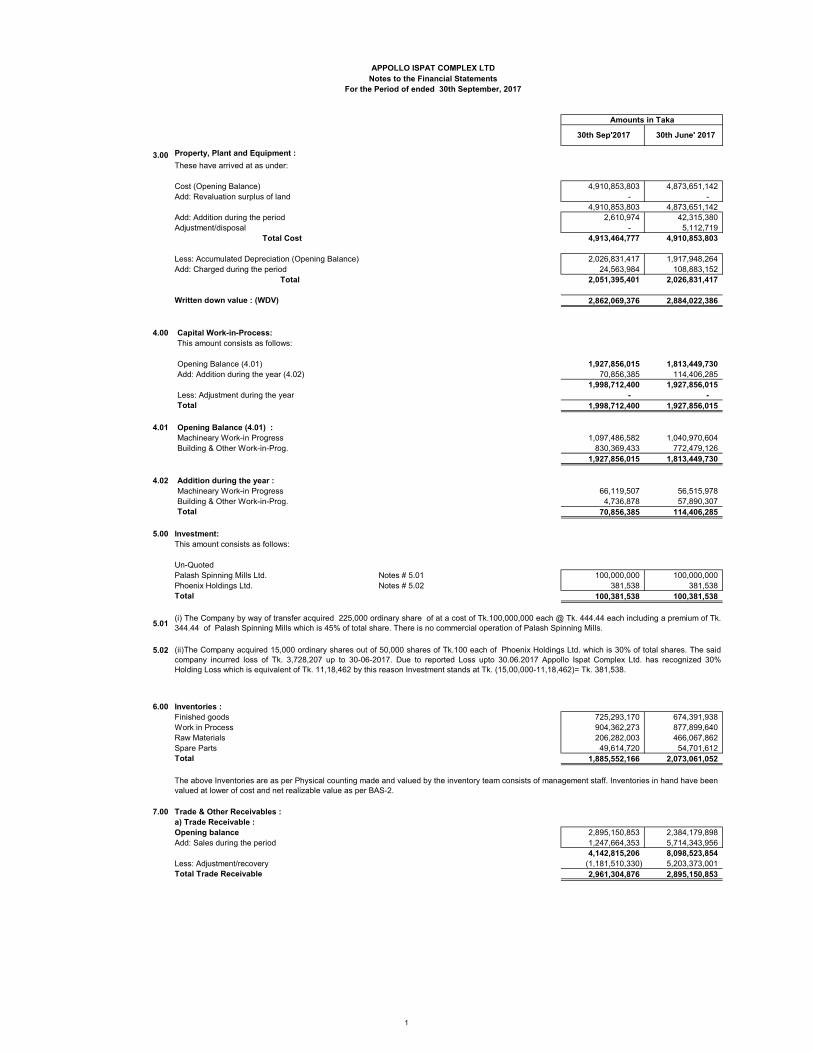
3.00 Property, Plant and Equipment :
These have arrived at as under:
Cost (Opening Balance) 4,910,853,803 4,873,651,142
Add: Revaluation surplus of land - -
4,910,853,803 4,873,651,142
Add: Addition during the period 2,610,974 42,315,380
Adjustment/disposal - 5,112,719
Total Cost 4,913,464,777 4,910,853,803
Less: Accumulated Depreciation (Opening Balance) 2,026,831,417 1,917,948,264
Add: Charged during the period 24,563,984 108,883,152
Total 2,051,395,401 2,026,831,417
Written down value : (WDV) 2,862,069,376 2,884,022,386
4.00 Capital Work-in-Process:
This amount consists as follows:
Opening Balance (4.01) 1,927,856,015 1,813,449,730
Add: Addition during the year (4.02) 70,856,385 114,406,285
1,998,712,400 1,927,856,015
Less: Adjustment during the year - -
Total 1,998,712,400 1,927,856,015
4.01 Opening Balance (4.01) :
Machineary Work-in Progress 1,097,486,582 1,040,970,604
Building & Other Work-in-Prog. 830,369,433 772,479,126
1,927,856,015 1,813,449,730
4.02 Addition during the year :
Machineary Work-in Progress 66,119,507 56,515,978
Building & Other Work-in-Prog. 4,736,878 57,890,307
Total 70,856,385 114,406,285
5.00 Investment:
This amount consists as follows:
Un-Quoted
Palash Spinning Mills Ltd. Notes # 5.01 100,000,000 100,000,000
Phoenix Holdings Ltd. Notes # 5.02 381,538 381,538
Total 100,381,538 100,381,538
5.01
5.02
6.00 Inventories :
Finished goods 725,293,170 674,391,938
Work in Process 904,362,273 877,899,640
Raw Materials 206,282,003 466,067,862
Spare Parts 49,614,720 54,701,612
Total 1,885,552,166 2,073,061,052
7.00 Trade & Other Receivables :
a) Trade Receivable :
Opening balance 2,895,150,853 2,384,179,898
Add: Sales during the period 1,247,664,353 5,714,343,956
4,142,815,206 8,098,523,854
Less: Adjustment/recovery (1,181,510,330) 5,203,373,001
Total Trade Receivable 2,961,304,876 2,895,150,853
30th June' 2017
(i) The Company by way of transfer acquired 225,000 ordinary share of at a cost of Tk.100,000,000 each @ Tk. 444.44 each including a premium of Tk.
344.44 of Palash Spinning Mills which is 45% of total share. There is no commercial operation of Palash Spinning Mills.
The above Inventories are as per Physical counting made and valued by the inventory team consists of management staff. Inventories in hand have been
valued at lower of cost and net realizable value as per BAS-2.
For the Period of ended 30th September, 2017
(ii)The Company acquired 15,000 ordinary shares out of 50,000 shares of Tk.100 each of Phoenix Holdings Ltd. which is 30% of total shares. The said
company incurred loss of Tk. 3,728,207 up to 30-06-2017. Due to reported Loss upto 30.06.2017 Appollo Ispat Complex Ltd. has recognized 30%
Holding Loss which is equivalent of Tk. 11,18,462 by this reason Investment stands at Tk. (15,00,000-11,18,462)= Tk. 381,538.
Amounts in Taka
APPOLLO ISPAT COMPLEX LTD
30th Sep'2017
Notes to the Financial Statements
1

For the Period of ended 30th September, 2017
Notes to the Financial Statements
b) Other Receivable:
Insurance Receivable 2,239,721 38,343,516
Interest Receivable 806,070 -
Total Other Recievable 3,045,792 38,343,516
Total Trade & Other Receivables :
(A+B) 2,964,350,668 2,933,494,369
A district wise break down given below:
B. Baria 79,306,374 79,806,374
Bagerhat 90 90
Barisal (5,279,362) 1,878,828
Bhola 69,506,985 71,730,325
Bogra 593,059,505 686,624,122
Borguna 984,716 5,177,996
Chandpur 47,388,942 47,388,942
Chittagong 2,148,407 2,148,407
Chuadanga 23,529,314 52,079,182
Comilla 48,736,001 53,632,511
Dhaka 1,085,163,041 1,085,163,041
Dinajpur (42,342,258) 202,877
Faridpur (24,215,324) (1,711,294)
Feni 685,936 685,936
Gaibandha 94,831,605 96,387,825
Gazipur 88,782,942 89,241,762
Gopalgonj (1,470,335) 229,415
Jamalpur 50,517,491 53,014,951
Jessore 62,651,431 64,332,066
Jhalokati (34,486,856) 741,784
Jhenaidah 256,493 3,408,770
Khulna 27,323,830 41,548,380
Kishorgonj 3,073,433 6,078,761
Kurigram (1,587,323) 108,359
Kustia (2,242,339) 1,847,021
Lalmonirhat (13,013,681) 58,034
Madaripur 1,083,081 1,061,021
Magura 472,177 472,177
Manikgonj (21,880,470) 236,730
Mymensingh 1,758 9,746,179
Munshigonj (38,749,282) 1,758
Naogaon (2,980,026) 515,381
Narail (165,750) 2,324,836
Narayangonj 5,827,610 6,928,810
Natore 13,205,327 1,943,507
Netrokona 1,943,507 2,790,050
Nayabazar 22,556,161 26,523,350
Nilfamary 2,276,040 59,378,751
Noakhali 44,682,191 4,507,071
Norshingdhi 2,306,771 16,146,172
Others (Trade Debtors) 496,790,769 (15,289,073)
Suspenses A/c (Trade Debtors) 41,239 46,354
Pabna 33,771,980 4,907,428
Panchagar (3,045,522) 77,550,642
Potuakhali 404,941 2,585,193
Pirojpur (3,909,357) 404,941
Rajbari (8,621,444) (342,887)
Rajshahi 126,380,943 1,962,311
Rangpur 42,731 114,892,905
Satkhira 291,988 291,988
Sariyatpur 21,464,529 7,731
Sherpur (74,515) 35,864,541
Sirajgonj 46,354 (534,845)
Sylhet 117,449,576 136,027,716
Tangail (11,716,415) (56,269,840)
Thakurgaon 10,216,225 18,551,939
Zinjira (2,117,298) 113,552
Total 2,961,304,876 2,895,150,853
30 Sep'2017 30 June' 2017
Amounts in Taka
2
For the Period of ended 30th September, 2017
Notes to the Financial Statements
8.00 Advances, Deposits and Prepayments :
This amount consists as follows:
Advances Note-8.01 2,575,933,981 2,415,464,302
Deposits and Investments Note-8.03 181,279,222 146,263,418
2,757,213,203 2,561,727,721
8.01 Advances :
Against goods and services 343,939,927 368,591,217
Against Salary 10,566,944 9,998,927
Against Land purchase 398,698,214 336,785,714
Advance Building Construction for NOF - 286,500
Advance for Preliminary & Pre-Operating Expense (NOF) 18,292,367 12,606,294
Advance Income Tax Note-8.02 533,939,135 499,655,610
Factory current account 17,364,021 1,560,249
Material in Transit 795,591,615 852,581,374
L/C margin 456,141,476 332,951,752
VAT current account 630,402 182,665
Bank Gurantee Commission 769,880 264,000
2,575,933,981 2,415,464,302
8.02 Advance Income Tax :
Opening Balance 499,655,610 339,966,313
Add: Addition during the year 34,283,525 159,689,297
533,939,135 499,655,610
Less: Refund during the year - -
Less : Adjusted after Tax Assessment - -
-
Closing Balance 533,939,135 499,655,610
8.03 Deposits and Investments:
FDR with Eastern Bank Ltd. 59,659,908 59,659,908
CDBL 500,000 500,000
FDR with South East Bank Ltd. 3,803,312 3,803,312
FDR with IFIC Bank Ltd. 85,500,275 50,796,106
FDR with Jamuna Bank Ltd. 414,000 414,000
Deposit Against GAS cylindar 60,000 60,000
Security deposit with Titas Gas,WASA, DESA & Custom 31,341,728 31,030,093
Total 181,279,222 146,263,418
9.00 Cash and Bank balances :
This amount consists as follows:
Cash in Hand 456,117 374,896
Cash at Bank (Notes-9.01) 29,386,161 19,414,444
29,842,278 19,789,340
Amounts in Taka
30 June' 2017 30 sep'2017
3

For the Period of ended 30th September, 2017
Notes to the Financial Statements
30 Sep'2017 30 June' 2017
9.01 Cash at Bank:
Agrani Bank Ltd Tejgaon Br. A/c No-02-699597 55,394 268,615
AB Bank Ltd Kawran Bazar Br. A/c No-4002-750680-000 47,435 201,772
AB Bank Ltd Kawran Bazar Br. A/c No-STD 750680-430 1,081
Al-Arafah Islami Bank Ltd Motijheel A/c No 0151020015224 750,701 221,672
Al-Arafah Islami Bank Ltd Jatra Bari A/C No 200078491 230,032 230,032
Bank Asia Ltd Scotia Br. IPO STD-00736-764 5,300,607 5,420,322
Bank Asia Ltd Scotia Br. A/c No-00736-495 287,956 368,356
Basic Bank Ltd karwan bazar A/cNo-3110-01-180 43,893 133,308
BRAC Bank Ltd Gulshan Br. A/c No-1501200130284001 130,491 14,110
BRAC Bank Ltd Kawran Bazar Br. A/C No-1540100130284001 80,317 80,317
City Bank Ltd Po Motijheel A/c No-872001 700,906
City Bank Ltd Motijheel A/c No-3102004872002 2,028,331 728,331
Dutch Bangla Bank Ltd Dilkusha A/c No-10112-2704 146,246 1,657,485
Dutch Bangla Bank Ltd /Local KB A/c No-11053 124,989 124,989
Dhaka Bank Ltd K.Bazar Local A/c No-02071-6359 3,504,934 3,351,647
Dhaka Bank Ltd ( Motijheel) 567,000 -
Eastern Bank Ltd Sonargoan Br. A/c No-105106-8112 2,557,956 1,557,956
Exim Bank Ltd Motijheel A/c No-001111-11871 119,405 277,405
First Security Bank Ltd Mohakhali Br. A/c No-0103131-518 374,057 161,260
Islami Bank BD Ltd Mohakhali A/c No-205019109-1007 1,639,668 298,669
Islami Bank BD Ltd Gandria A/c No-5107 5,000 5,000
IFIC Bank Ltd K.Bazar A/c No-1017124260001 56,882 16,665
Jamuna Bank Ltd Dhilkusha A/c No-0195 790,136 1,300,505
Janata Bank Ltd Farmgate Br. A/c No-008036-173 67,468 70,168
Mercantail Bank ( Motijheel) 120 -
Mutual Trust Bank Ltd Motijheel Br. A/c No-0002-0210010672 2,529,600 48,767
Mutual Trust Bank Ltd Dhanmondi Br. A/c No-01875 10,000 10,000
National Bank Ltd Dhilkusha Br. A/c No-3379 17,284 167,284
National Bank Ltd Dhilkusha Br. A/c No- New Ipo 10,000 10,000
National Bank Ltd K Bazzar A/c No. 1048-662855 2,214,544 72,387
NCC Bank Ltd Dhanmondhi Br. A/c No. 00100210010127 1,685 1,865
NRB bank A/c No 22067 10,000 10,000
One Bank Ltd Dhilkusha Br. A/c No. 0010016238007 100,691 199,474
Prime Bank Ltd K.Bazzar A/c No 11331030018756 293,150 72,545
Primier Bank Ltd Gulshan Br. A/c No-0102111-7477 2,867 2,867
Pubali Bank Ltd Tejgaon A/c No. 0017 2,360 2,360
Pubali Bank Ltd Tejgaon A/c No. 2369901009161 1,642,777 295,335
Rupali Bank Ltd Green Road A/c No. 0414024-15 276,211 388,687
Southeast Bank Ltd Dhanmondhi Br.-25 A/c No. 0012111-9826 42,808 4,386
Southeast Bank Ltd Dhanmondhi Br. A/c No. 0012131-939 21,429 21,429
Shajalal Bank Ltd Motijheel Br. A/c No. 4001111-6337 182,520 147,941
Social Islami Bank Ltd Motijheel Br. A/c No. 0021330037219 3,868 503,868
Social Islami Bank Ltd Panthopath Br. A/c No. 015136-979 154,274 -
Sonali Bank Ltd A.H.M Br. A/c No. 1634536-97 19,097 102,795
Sonali Bank Ltd Tejgaon Br. A/c No. 012424-236 167,710 167,710
Sonali Bank Ltd Motejheel Br. A/c No. 8235 4,940 5,000
Sonali Bank Ltd RJC Motejheel Br. A/c No 131303-6 234,499 59,917
State Bank Of India A/c No. 0516030202-1 6,430 6,430
United Commercial Bank Ltd Mohakhali Br. A/c No. 0781301-176 160,564 356,422
United Commercial Bank Ltd Naya Bazar Br. A/c No. 000125 55,690 55,690
Uttara Bank Ltd A.H.M Br. A/c No. 102412200212361 1,610,160 212,704
Total 29,386,161 19,414,444
10.00 Share Capital :
Authorized Capital : Tk.
500,000,000 Ordinary share of Tk.10 each. 5,000,000,000 5,000,000,000
Issued, Subscribed and paid up
Capital:
This amount consists as follows:
250,000,000 Ordinary Share of
Tk.10 each, fully paid up in cash
2,500,000,000 2,500,000,000
Bonus Share Note:10.01 1,042,000,000 1,042,000,000
3,542,000,000 3,542,000,000
Amounts in Taka
4
For the Period of ended 30th September, 2017
Notes to the Financial Statements
30 Sep'2017 30 June' 2017
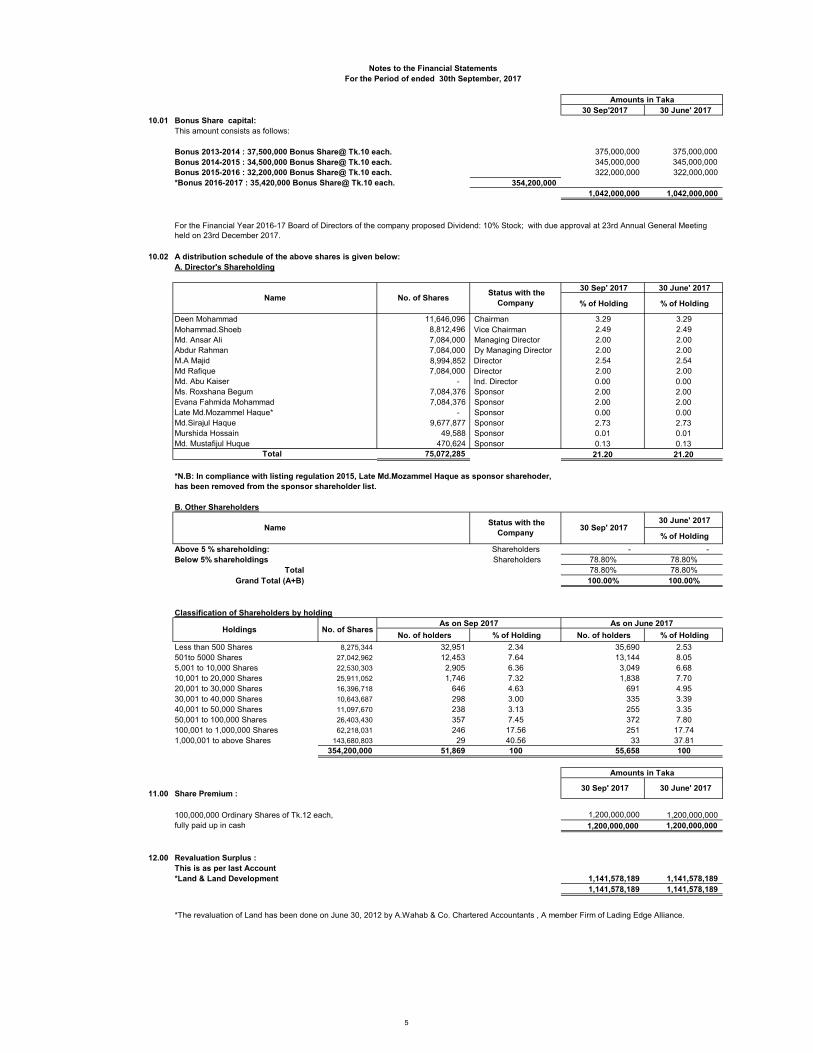
10.01 Bonus Share capital:
This amount consists as follows:
375,000,000 375,000,000
345,000,000 345,000,000
Bonus 2015-2016 : 32,200,000 Bonus Share@ Tk.10 each. 322,000,000 322,000,000
*Bonus 2016-2017 : 35,420,000 Bonus Share@ Tk.10 each. 354,200,000
1,042,000,000 1,042,000,000
10.02 A distribution schedule of the above shares is given below:
A. Director's Shareholding
30 Sep' 2017 30 June' 2017
% of Holding % of Holding
Deen Mohammad 11,646,096 Chairman 3.29 3.29
Mohammad.Shoeb 8,812,496 Vice Chairman 2.49 2.49
Md. Ansar Ali 7,084,000 Managing Director 2.00 2.00
Abdur Rahman 7,084,000 Dy Managing Director 2.00 2.00
M.A Majid 8,994,852 Director 2.54 2.54
Md Rafique 7,084,000 Director 2.00 2.00
Md. Abu Kaiser - Ind. Director 0.00 0.00
Ms. Roxshana Begum 7,084,376 Sponsor 2.00 2.00
Evana Fahmida Mohammad 7,084,376 Sponsor 2.00 2.00
Late Md.Mozammel Haque* - Sponsor 0.00 0.00
Md.Sirajul Haque 9,677,877 Sponsor 2.73 2.73
Murshida Hossain 49,588 Sponsor 0.01 0.01
Md. Mustafijul Huque 470,624 Sponsor 0.13 0.13
75,072,285 21.20 21.20
B. Other Shareholders
30 June' 2017
% of Holding
Above 5 % shareholding: Shareholders - -
Below 5% shareholdings Shareholders 78.80% 78.80%
Total 78.80% 78.80%
Grand Total (A+B) 100.00% 100.00%
Classification of Shareholders by holding
No. of holders % of Holding No. of holders % of Holding
Less than 500 Shares 8,275,344 32,951 2.34 35,690 2.53
501to 5000 Shares 27,042,962 12,453 7.64 13,144 8.05
5,001 to 10,000 Shares 22,530,303 2,905 6.36 3,049 6.68
10,001 to 20,000 Shares 25,911,052 1,746 7.32 1,838 7.70
20,001 to 30,000 Shares 16,396,718 646 4.63 691 4.95
30,001 to 40,000 Shares 10,643,687 298 3.00 335 3.39
40,001 to 50,000 Shares 11,097,670 238 3.13 255 3.35
50,001 to 100,000 Shares 26,403,430 357 7.45 372 7.80
100,001 to 1,000,000 Shares 62,218,031 246 17.56 251 17.74
1,000,001 to above Shares 143,680,803 29 40.56 33 37.81
354,200,000 51,869 100 55,658 100
11.00 Share Premium :
100,000,000 Ordinary Shares of Tk.12 each, 1,200,000,000 1,200,000,000
fully paid up in cash 1,200,000,000 1,200,000,000
12.00 Revaluation Surplus :
This is as per last Account
*Land & Land Development 1,141,578,189 1,141,578,189
1,141,578,189 1,141,578,189
*The revaluation of Land has been done on June 30, 2012 by A.Wahab & Co. Chartered Accountants , A member Firm of Lading Edge Alliance.
*N.B: In compliance with listing regulation 2015, Late Md.Mozammel Haque as sponsor sharehoder,
has been removed from the sponsor shareholder list.
Amounts in Taka
No. of Shares
Bonus 2013-2014 : 37,500,000 Bonus Share@ Tk.10 each.
Bonus 2014-2015 : 34,500,000 Bonus Share@ Tk.10 each.
For the Financial Year 2016-17 Board of Directors of the company proposed Dividend: 10% Stock; with due approval at 23rd Annual General Meeting
held on 23rd December 2017.
30 Sep' 2017
Status with the
Company
Name
Name
As on June 2017
Amounts in Taka
Total
Status with the
Company
As on Sep 2017
30 Sep' 2017
Holdings No. of Shares
30 June' 2017
5

For the Period of ended 30th September, 2017
Notes to the Financial Statements
13.00 Retained Earnings:
This amount consists as follows:
Balance brought forward Note-13.01 1,962,331,626 1,966,606,296
Add. Profit for the period 26,425,214 478,725,330
Add:Unabsorbed Carry Forwrded u/s 42(6) - -
1,988,756,840 2,445,331,626
Less:ReversalTax benefit on Unabsorbed Dep.allowance Carry Forwrded u/s 42(6)
(Since this amount has been Considerd as per Assessment in the New
TAX Liabilities ( BAS-8,Para 36)
Less: Cash Dividend paid to Share Holder as per approval at 22nd Annual General Meeting.
from 32,20,00,000 shares @5% - (161,000,000)
- (322,000,000)
Balance carried forward 1,988,756,840 1,962,331,626
14.00 Long Tern Borrowings:
This amount consists as follows:
Due within one year Due after more than
one year Due within one year
Due after more
than one year
Jamuna Bank Ltd. 120,630,000 192,069,882 120,630,000 214,681,372
Southeast Bank Ltd - - 3,624,107 -
IFIC Bank Ltd. 228,383,328 146,219,658 228,383,328 191,524,496
Mercantile Bank limited 60,087,072 107,345,314 60,000,000 117,124,492
Mutual trust Bank limited 51,783,804 12,452,490 51,783,804 22,239,379
Phoenix Finance & Investment 93,968,124 280,025,454 93,968,124 264,505,386
GSP Finance Company Ltd 13,960,956 24,652,253 13,960,956 27,985,066
GSP Finance Company Ltd(Lease) 41,489,129 - 13,960,956 30,762,633
NCC Bank limited 60,000,000 10,414,186 100,404,000 5,189,452
Islamic Finance & Investment Ltd 69,554,916 78,717,615 55,593,960 106,248,201
Social Islami Bank limited 15,480,000 37,981,352 60,087,072 12,167,607
755,337,329 889,878,204 802,396,307 992,428,084
15.00 Short Term Borrowings:
This amount consists as follows:
Jamuna Bank Ltd ( TR ) 306,037,036 305,269,295
Mutual Trust Bank Ltd 130,703,000 129,838,311
IFIC Bank Ltd (TR) 323,640,948 227,501,313
IFIC Bank Ltd (Deferred) 177,464,060 165,372,314
GSP Finance Company Ltd. 350,957,098 356,267,117
Southeast Bank Ltd 171,432,712 100,799,915
Phoenix Finance & Investment Ltd 150,273,611 169,484,069
Time loan with Jamuna bank Ltd. 151,446,572 152,819,972
MIDAS Finance Ltd. 100,751,616 101,791,666
Union Capital Ltd. 202,050,000 205,000,000
Total 2,064,756,653 1,914,143,972
16.00 Bank overdraft:
This consist of the following:
Jamuna Bank 60,520,382 61,622,160
AB Bank Ltd Kawran Bazar Br. - 2,996,571
City Bank Ltd Po Motijheel - 13,488,638
Janata Bank Ltd Bangshal Br. 1,655,533 1,378,143
Social Islami Bank Ltd Panthopath Br. - 137,788
IFIC Bank Ltd 205,454,189 204,431,101
Total 267,630,104 284,054,401
Less: Amount Transferred to Share Capital as Bonus Share of 322,00,000 (10% Stock Bonus) @ Tk. 10
each with due approval at 22nd Annual General Meeting.
30 sep' 2017 30 June' 2017
This represent the present outstanding balances of the above term loans. The above loans are secured by personal guarantee of the director of the
company and the pari passu sharing agreement between banks on fixed and floating assets of the company. The interest rate of this loans are varying
from 10%-13%. The Payment of installment were being made regularly.
30 June 2017
Amounts in Taka
Name of Bank
1,645,215,533 1,794,824,391 Total Long Term Borrowings
Total
As on 30 Sep, 2017
6

For the Period of ended 30th September, 2017
Notes to the Financial Statements
17.00 Liabilities for Expenses :
This consist of the following:
Audit fee 80,000 330,000
Electricity 7,221,670 4,560,835
Gas 47,749,091 18,406,088
Salary and Allowances** 24,712,703 13,295,828
Wages and Salary 6,725,301 3,652,617
AIT payable 482,647 527,017
Income Tax Deducted at source from Salary 592,836 276,143
VAT Deducted at source 4,983,909 4,885,044
AGM Expenses 2,398,685 2,398,685
Telephone 454,981 441,168
Contribution to Providend fund 7,358,883 7,084,745 -
102,760,705 55,858,170
17.01 Salary, wages & allowance Payable
18.00 Trade & Other Payables:
This amount consists as follows:
Trade Payables 6,453,365 6,562,815
Other Payables 9,429,715 9,805,767
15,883,080 16,368,582
18.01 Trade Payables:
AK Traders 3,721,666 2,770,756
Airtech 37,500 493,500
Ator Banu Traders - 143,450
Encon 187,110 -
Eastern Chemical 75,482 23,289
MD Steel Casting Indus. 20,000
Hilfu We Engoneering - 160,000
Happy Int. 1,620
Mofizul Islam Technical Boaring 120,400 120,400
Motaleb Iron Store 30,000
National Steel Corp. 203,277 203,277
Sensotec Automation & Control 50,400
Divine IT (50,000) 20,000
Prime Technologies 12,000 12,000
S.B Rubber Industries 169,200 169,200
Rafi Ent. - 140,000
Pakard Eng. Ltd. - 12,225
Royal Rubber Insd. 572,096 675,904
S Construction 687,434 38,603
Sunrise chemical 348,680 1,210,471
Surat Ali Enterprise 162,120 162,120
Department of Mechanical Eng. BUET 156,000 156,000
6,453,365 6,562,815
18.02 Other Payables:
Dividend Unpaid 4,930,185 5,096,292
IPO Applicant (Refund warrant with Bank Asia) 4,499,530 4,619,475
Satcom IT Ltd - 90,000
9,429,715 9,805,767
30 June' 2017
The company pays salary & allowance on accrual basis i.e. current's month salary is accrued for the month and it is paid on following month.
Amounts in Taka
30 Sep' 2017
7
For the Period of ended 30th September, 2017
Notes to the Financial Statements
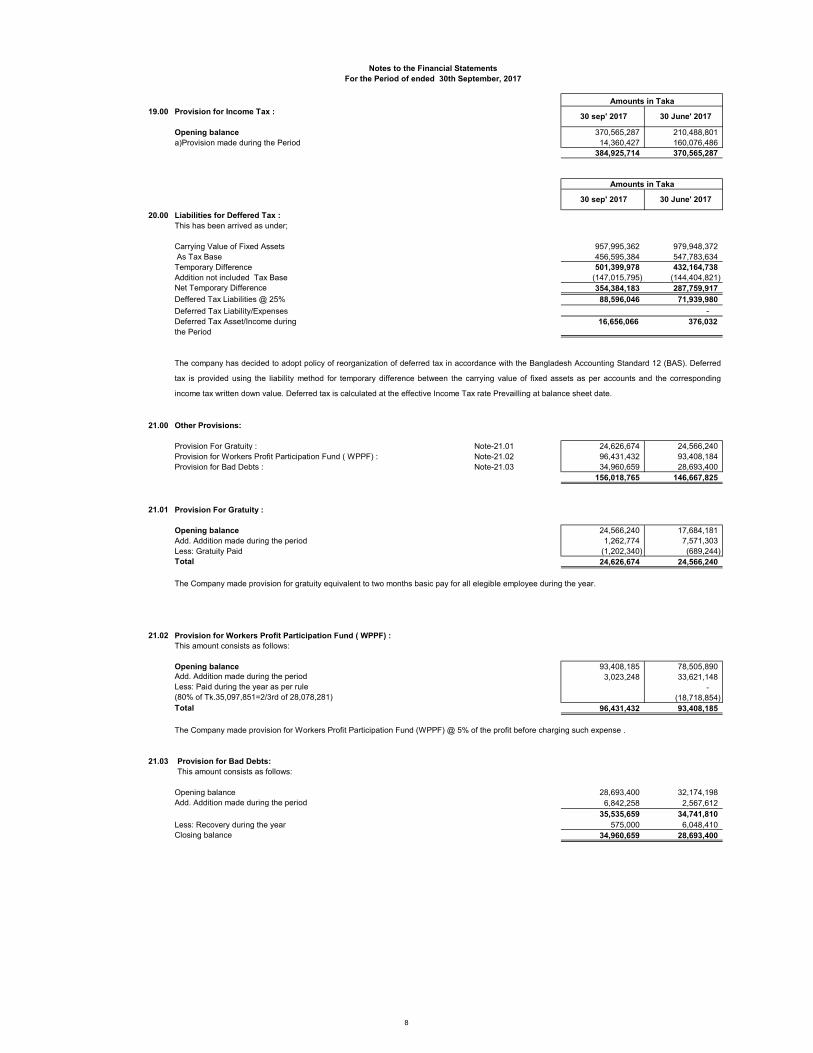
19.00 Provision for Income Tax :
Opening balance 370,565,287 210,488,801
a)Provision made during the Period 14,360,427 160,076,486
384,925,714 370,565,287
20.00 Liabilities for Deffered Tax :
This has been arrived as under;
Carrying Value of Fixed Assets 957,995,362 979,948,372
As Tax Base 456,595,384 547,783,634
Temporary Difference 501,399,978 432,164,738
Addition not included Tax Base (147,015,795) (144,404,821)
Net Temporary Difference 354,384,183 287,759,917
Deffered Tax Liabilities @ 25% 88,596,046 71,939,980
Deferred Tax Liability/Expenses -
Deferred Tax Asset/Income during
the Period
16,656,066 376,032
21.00 Other Provisions:
Provision For Gratuity : Note-21.01 24,626,674 24,566,240
Note-21.02 96,431,432 93,408,184
Provision for Bad Debts : Note-21.03 34,960,659 28,693,400
156,018,765 146,667,825
21.01 Provision For Gratuity :
Opening balance 24,566,240 17,684,181
Add. Addition made during the period 1,262,774 7,571,303
Less: Gratuity Paid (1,202,340) (689,244)
Total 24,626,674 24,566,240
The Company made provision for gratuity equivalent to two months basic pay for all elegible employee during the year.
21.02
This amount consists as follows:
Opening balance 93,408,185 78,505,890
3,023,248 33,621,148
-
(18,718,854)
Total 96,431,432 93,408,185
The Company made provision for Workers Profit Participation Fund (WPPF) @ 5% of the profit before charging such expense .
21.03 Provision for Bad Debts:
This amount consists as follows:
Opening balance 28,693,400 32,174,198
Add. Addition made during the period 6,842,258 2,567,612
35,535,659 34,741,810
Less: Recovery during the year 575,000 6,048,410
Closing balance 34,960,659 28,693,400
(80% of Tk.35,097,851=2/3rd of 28,078,281)
Amounts in Taka
30 sep' 2017
Provision for Workers Profit Participation Fund ( WPPF) :
Provision for Workers Profit Participation Fund ( WPPF) :
30 June' 2017
The company has decided to adopt policy of reorganization of deferred tax in accordance with the Bangladesh Accounting Standard 12 (BAS). Deferred
tax is provided using the liability method for temporary difference between the carrying value of fixed assets as per accounts and the corresponding
income tax written down value. Deferred tax is calculated at the effective Income Tax rate Prevailling at balance sheet date.
30 June' 2017
Add. Addition made during the period
Amounts in Taka
30 sep' 2017
Less: Paid during the year as per rule
8

For the Period of ended 30th September, 2017
Notes to the Financial Statements
22.00 Net Turnover :
This amount consists as follows:
111
CI Sheet 1,175,432,588 1,345,250,096 4,258,499,044
CR Coil 18,762,365 255,343,698 1,029,364,756
GP Coil 46,222,125 148,580,000 363,566,100
Ridge 7,247,164 12,125,176 62,914,057
Total 1,247,664,353 1,761,298,970 5,714,343,956
23.00 Cost of Goods Sold :
This has been arrived as under;
Work in process ( opening) 877,899,640 994,516,675 994,516,675
Add. Raw Material Consumed 992,580,221 1,252,146,014 4,149,435,721
Total Work in Process 1,870,479,861 2,246,662,690 5,143,952,396
Less: Work in Process (Closing) 904,362,273 982,585,645 877,899,640
Total Consumption 966,117,588 1,264,077,045 4,266,052,756
Add: Factory Overhead 102,282,994 92,453,083 383,199,087
Cost of Production 1,068,400,582 1,356,530,128 4,649,251,843
Add: Finished Goods (Opening) 674,391,938 629,113,625 629,113,625
Finished Goods Available 1,742,792,520 1,985,643,753 5,278,365,468
Less: Finished Goods (Closing) 725,293,170 653,572,134 674,391,938
1,017,499,350 1,332,071,619 4,603,973,529
23.01 Raw Material Consumed :
A. Opening Stock of Raw Materials
HR Coil 367,520,752 428,327,659 428,327,659
Zinc Ingot 74,520,103 314,302,885 314,302,885
Chemical 24,027,007 20,967,799 20,967,799
Spare parts 54,701,612 45,737,021 45,737,021
520,769,474 809,335,364 809,335,365
B. Add: Raw Material Purchased
HR Coil 399,512,350 979,314,026 2,652,513,907
Zinc Ingot 296,177,005 207,358,022 1,013,249,664
Chemical 16,802,834 48,223,603 135,373,680
Spare parts 15,215,282 17,457,212 59,732,579
727,707,470 1,252,352,863 3,860,869,830
C. Raw Material available for Consumption (A+B) 1,248,476,944 2,061,688,227 4,670,205,195
D. Less: Closing Stock of Raw Materials
HR Coil 172,731,007 503,556,807 367,520,752
Zinc Ingot 15,416,646 218,876,037 74,520,103
Chemical 18,134,350 30,537,899 24,027,007
Spare parts 49,614,720 56,571,470 54,701,612
255,896,723 809,542,213 520,769,474
Raw Material Consumption
HR Coil 594,302,095 904,084,878 2,713,320,814
Zinc Ingot 355,280,462 302,784,870 1,253,032,446
Chemical 22,695,491 38,653,503 132,314,472
Spare parts 20,302,174 6,622,763 50,767,989
992,580,221 1,252,146,014 4,149,435,721
23.02 Factory Overhead :
This consist of the following:
Depreciation 23,335,784 25,354,817 103,438,995
Loss on Damaged Assets - 25,293,578 5,112,719
Electricity 19,011,555 1,283,156 106,277,526
Electric lighting & fittings 3,261,905 9,391,957 6,127,983
Gas Bill 11,277,194 152,901 40,709,846
Entertainment 212,702 1,570,817 2,528,269
Insurance Premium on Fire and RSD 1,008,548 - 4,903,996
Other Production Materials - 61,435 767,537
Office maintenance factory 106,911 504,505 965,728
Labour and carrying charge 159,209 329,129 4,603,025
Medical Expenses 39,700 75,508 173,378
Repair and Maintenance 13,737,120 2,641,108 26,725,700
Travel & conveyance 19,912 14,424 108,966
Postage & courier 23,174 17,813 36,029
Salary and Allowances 24,775,474 10,189,532 37,032,299
Telephone 7,151 2,000 66,700
Wages and Allowances 5,306,655 15,570,402 43,620,391
102,282,994 92,453,083 383,199,087
July'16 to Sep'16
Amounts in Taka
Amounts in Taka
July'16 to Sep'16 30 June' 2017
a) Salary and Allowance includes salary and allowances, bonus and leave pay / Notice pay.& Wages and allowances includes Wages and overtime.
July'17 to Sep'17 30 June' 2017
b) Repair and Maintenance includes Factory maintenance, Forklift maintenance, Generator maintenance, Machinery maintenance, Boiler Machine
maintenance, Factory building maintenance, Crane maintenance and Vehicle maintenance.
July'17 to Sep'17
9
For the Period of ended 30th September, 2017
Notes to the Financial Statements
Amounts in Taka
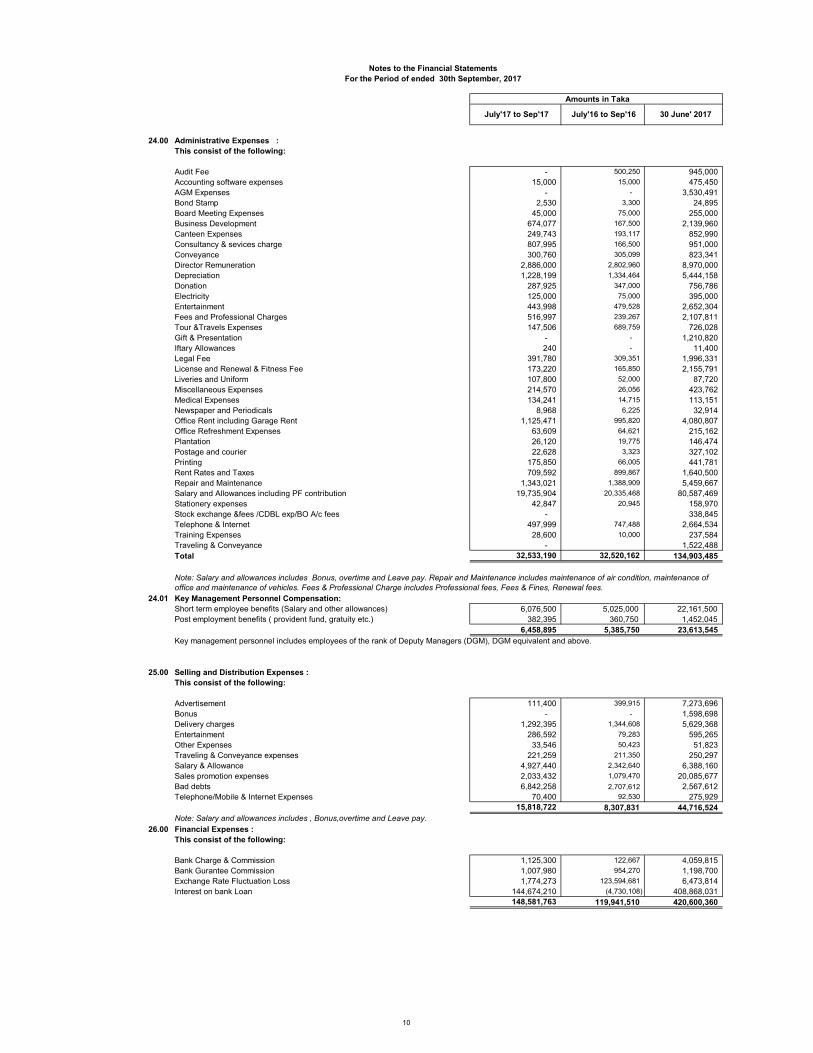
24.00 Administrative Expenses :
This consist of the following:
Audit Fee - 500,250 945,000
Accounting software expenses 15,000 15,000 475,450
AGM Expenses - - 3,530,491
Bond Stamp 2,530 3,300 24,895
Board Meeting Expenses 45,000 75,000 255,000
Business Development 674,077 167,500 2,139,960
Canteen Expenses 249,743 193,117 852,990
Consultancy & sevices charge 807,995 166,500 951,000
Conveyance 300,760 305,099 823,341
Director Remuneration 2,886,000 2,802,960 8,970,000
Depreciation 1,228,199 1,334,464 5,444,158
Donation 287,925 347,000 756,786
Electricity 125,000 75,000 395,000
Entertainment 443,998 479,528 2,652,304
Fees and Professional Charges 516,997 239,267 2,107,811
Tour &Travels Expenses 147,506 689,759 726,028
Gift & Presentation - - 1,210,820
Iftary Allowances 240 - 11,400
Legal Fee 391,780 309,351 1,996,331
License and Renewal & Fitness Fee 173,220 165,850 2,155,791
Liveries and Uniform 107,800 52,000 87,720
Miscellaneous Expenses 214,570 26,056 423,762
Medical Expenses 134,241 14,715 113,151
Newspaper and Periodicals 8,968 6,225 32,914
Office Rent including Garage Rent 1,125,471 995,820 4,080,807
Office Refreshment Expenses 63,609 64,621 215,162
Plantation 26,120 19,775 146,474
Postage and courier 22,628 3,323 327,102
Printing 175,850 66,005 441,781
Rent Rates and Taxes 709,592 899,867 1,640,500
Repair and Maintenance 1,343,021 1,388,909 5,459,667
Salary and Allowances including PF contribution 19,735,904 20,335,468 80,587,469
Stationery expenses 42,847 20,945 158,970
Stock exchange &fees /CDBL exp/BO A/c fees - 338,845
Telephone & Internet 497,999 747,488 2,664,534
Training Expenses 28,600 10,000 237,584
Traveling & Conveyance - 1,522,488
Total 32,533,190 32,520,162 134,903,485
24.01 Key Management Personnel Compensation:
Short term employee benefits (Salary and other allowances) 6,076,500 5,025,000 22,161,500
Post employment benefits ( provident fund, gratuity etc.) 382,395 360,750 1,452,045
6,458,895 5,385,750 23,613,545
Key management personnel includes employees of the rank of Deputy Managers (DGM), DGM equivalent and above.
25.00 Selling and Distribution Expenses :
This consist of the following:
Advertisement 111,400 399,915 7,273,696
Bonus - - 1,598,698
Delivery charges 1,292,395 1,344,608 5,629,368
Entertainment 286,592 79,283 595,265
Other Expenses 33,546 50,423 51,823
Traveling & Conveyance expenses 221,259 211,350 250,297
Salary & Allowance 4,927,440 2,342,640 6,388,160
Sales promotion expenses 2,033,432 1,079,470 20,085,677
Bad debts 6,842,258 2,707,612 2,567,612
Telephone/Mobile & Internet Expenses 70,400 92,530 275,929
15,818,722 8,307,831 44,716,524
26.00 Financial Expenses :
This consist of the following:
Bank Charge & Commission 1,125,300 122,667 4,059,815
Bank Gurantee Commission 1,007,980 954,270 1,198,700
Exchange Rate Fluctuation Loss 1,774,273 123,594,681 6,473,814
Interest on bank Loan 144,674,210 (4,730,108) 408,868,031
148,581,763 119,941,510 420,600,360
Note: Salary and allowances includes Bonus, overtime and Leave pay. Repair and Maintenance includes maintenance of air condition, maintenance of
office and maintenance of vehicles. Fees & Professional Charge includes Professional fees, Fees & Fines, Renewal fees.
Note: Salary and allowances includes , Bonus,overtime and Leave pay.
July'16 to Sep'16 30 June' 2017 July'17 to Sep'17
10

For the Period of ended 30th September, 2017
Notes to the Financial Statements
27.00 Non Operating Income :
This consist of the following:
Scrap sales and Others 11,632,995 28,562,351 104,847,029
Other Income-InterestReceived/Receivable Note: 27.01 636,206 2,440,686 4,326,701
CR& GP Processing Charges 16,227,200 - 60,765,330
Profit/(Loss) on Investment Note: 26.02 - (94,851)
Gain on sale of Investment - -
28,496,401 31,003,037 169,844,209
27.01 Income from Bank Interest :
Interest on Dividend Account - 147,907.37 210,834
Interest on IPO Account - - 158,662
Interest on FDR A/C 1,617,544 2,292,779 3,957,205
1,617,544 2,440,686 4,326,701
27.02 Loss on Investment:
a) Phoenix Holding Ltd:
Share of Holding (Loss for the year ended 30 June 2017. Tk.316,170 @ 30%) - - 94,851
Total Loss on Investment - - 94,851
28.00 Taxation:
Current Tax Expenses 14,360,427 69,969,679 159,700,454
Tax Provision adjustment as per Assessment order (Note: 28.01) -
Deferred Tax (Income)/Expenses Note: 19.00 16,656,066 (6,672,321) 376,032
Tax (Expenses)/Income 31,016,492 63,297,358 160,076,486
29.00 Earning Per Share :
The composition of earning per shares (EPS) is given below:
Profit after taxation 26,425,214 216,581,356 478,725,330
Number of ordinary shares at the period end 354,200,000 322,000,000 354,200,000
Weighted Average number of ordinary shares outstanding 354,200,000 322,000,000 354,200,000
Earning per share * 0.07 0.67 1.35
Number of ordinary shares Considering the 2015-16 Stock Dividend 354,200,000 354,200,000 354,200,000
0.07 0.61 1.35
30.00 Net Assets Value Per Share :
The composition of net assets value per share is given below:
Total Assets 12,598,121,629 11,870,127,340 12,500,332,422
Non-Current Liabilities plus Current Liabilities 4,725,786,600 4,125,361,498 4,654,422,608
Net Assets Value including Revaluation Surplus 7,872,335,029 7,744,765,842 7,845,909,814
Number of ordinary shares at the year end 354,200,000 322,000,000 354,200,000
* Net Asset Value (NAV) including Revaluation Surplus 22.23 24.05 22.15
Restated Net Assets Value (RNAV) per Share 22.23 21.87 22.15
30 June' 2017
Amounts in Taka
30 Sep' 2017 July'17 to Sep'17
EPS for the period ended has been restated based
This has been calculated in compliance with the requirements of BAS 33: Earning per share is the basic earning dividing by the weighted average
number of ordinary shares outstanding the end of the year.
11
For the Period of ended 30th September, 2017
Notes to the Financial Statements
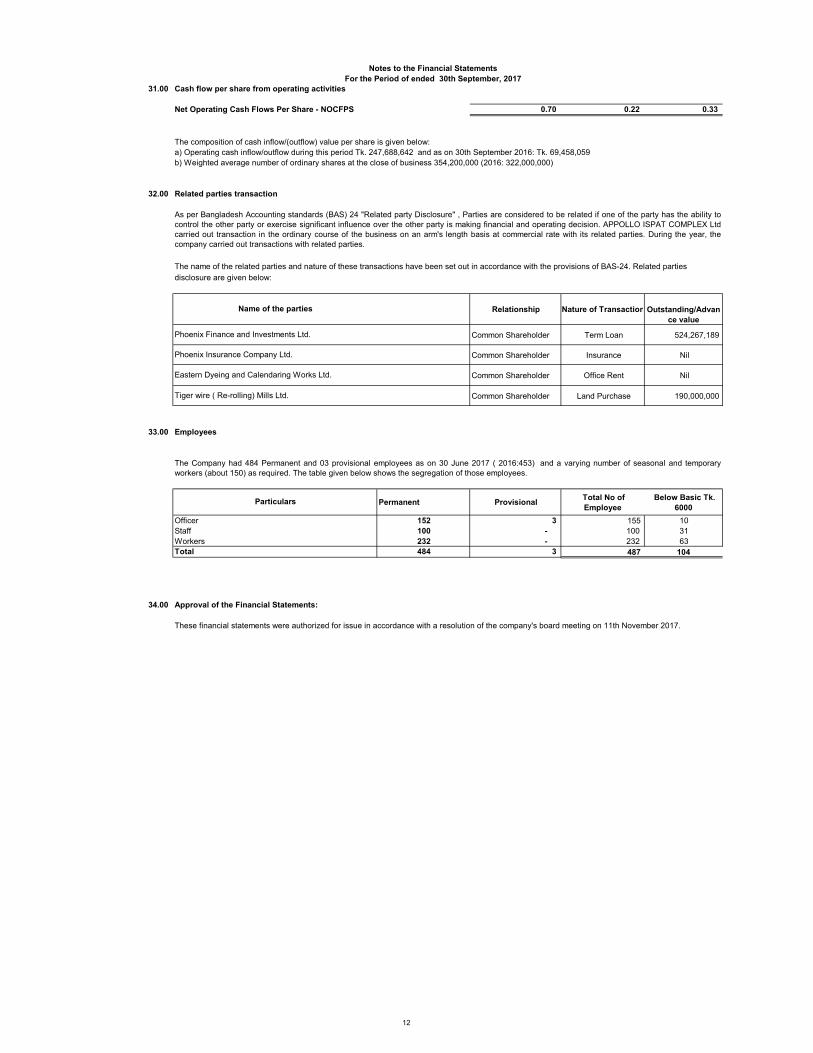
31.00 Cash flow per share from operating activities
Net Operating Cash Flows Per Share - NOCFPS 0.70 0.22 0.33
The composition of cash inflow/(outflow) value per share is given below:
a) Operating cash inflow/outflow during this period Tk. 247,688,642 and as on 30th September 2016: Tk. 69,458,059
b) Weighted average number of ordinary shares at the close of business 354,200,000 (2016: 322,000,000)
32.00 Related parties transaction
Relationship Nature of Transaction
Outstanding/Advan
ce value
Common Shareholder Term Loan 524,267,189
Common Shareholder Insurance Nil
Common Shareholder Office Rent Nil
Common Shareholder Land Purchase 190,000,000
33.00 Employees
Permanent Provisional Total No of
Employee
Below Basic Tk.
6000
Officer 152 3 155 10
Staff 100 - 100 31
Workers 232 - 232 63
Total 484 3 487 104
34.00 Approval of the Financial Statements:
The Company had 484 Permanent and 03 provisional employees as on 30 June 2017 ( 2016:453) and a varying number of seasonal and temporary
workers (about 150) as required. The table given below shows the segregation of those employees.
These financial statements were authorized for issue in accordance with a resolution of the company's board meeting on 11th November 2017.
Eastern Dyeing and Calendaring Works Ltd.
Phoenix Insurance Company Ltd.
The name of the related parties and nature of these transactions have been set out in accordance with the provisions of BAS-24. Related parties
disclosure are given below:
Name of the parties
Phoenix Finance and Investments Ltd.
As per Bangladesh Accounting standards (BAS) 24 "Related party Disclosure" , Parties are considered to be related if one of the party has the ability to
control the other party or exercise significant influence over the other party is making financial and operating decision. APPOLLO ISPAT COMPLEX Ltd
carried out transaction in the ordinary course of the business on an arm's length basis at commercial rate with its related parties. During the year, the
company carried out transactions with related parties.
Tiger wire ( Re-rolling) Mills Ltd.
Particulars
12