Embed Size (px)
Citation preview

1
Approaches to allergy detection using aptasensors
Brys, E., Tombelli, S., Minunni, M., Mascini, M. and Turner, A.P.F.
In: Smart Biosensors (Eds, G.K. Knopf and A.S. Bassi). pp 539-565.
Taylor & Francis, Boca Raton, USA. (2007) ISBN 978-0-8493-3759-8
Emile Brys (Cranfield University, 74 Lock Chase, London, SE3 9HA, UK, email:
Sara Tombelli (Dip. Di Chimica, Università di Firenze, Via della Lastruccia 3, 50019 Sesto F. no
(FI), Italy, email: [email protected]),
Maria Minunni (Dip. Di Chimica, Università di Firenze, Via della Lastruccia 3, 50019 Sesto F.
no (FI), Italy, email: [email protected]),
Marco Mascini (Dip. Di Chimica, Università di Firenze, Via della Lastruccia 3, 50019 Sesto F.
no (FI), Italy, email: [email protected]),
and Anthony P F Turner (Professor Anthony P F Turner PhD, DSc, FRSC, Head of Cranfield
University at Silsoe, Cranfield University, Silsoe, Bedfordshire MK45 4DT,UK, email:

2
1. Immunoglobulins and IgE
Antibodies are glycoprotein molecules which are produced by plasma cells in response to an
immunogen (1). They belong to a class of spherical proteins called globulins and are hence
known as immunoglobulins (Igs). Their primary function is to mediate the host immune response
by binding to antigens.
Igs have been divided, on the basis of physical and functional properties, into the five following
classes: IgG, IgM, IgA, IgD, and IgE. They have a Y-shaped structure and are composed of two
identical light chains and two identical heavy chains, which are held together by disulfide bonds
(2), as illustrated in Figure 1. Each heavy chain and each light chain has a variable (V) domain
and a constant (C) domain. The V domain is responsible for binding to the antigen and the C
domain mediates the antibody’s function (2).
Figure 1
1.1. IgE
Human IgE is a monomeric immunoglobulin of approximately 190 000 Da (3). Initially termed
IgND after its discovery by Johansson in 1967 (4), it was soon confirmed to be identical to the γE
discovered by Ishizaka and Ishizaka (5), and determined to be central in the immediate
hypersensitivity reaction pathway (6). Of similar structure to the other immunoglobulins (IgG,
IgM, IgD and IgA), it is composed of two light chains and two heavy chains, as shown in Figure
2, and constitutes about 0.0005% of total serum immunoglobulins in adults (3).

3
Figure 2
1.2. The hypersensitivity reaction
The term “allergy” was originally introduced by von Pirquet in 1906, meaning “changed
reactivity” of the host after the second or subsequent contact with an allergenic agent (7). The
first evidence of a transferable / soluble factor as the mediator of an allergic reaction was
published in 1919 by Ramirez (8), where the author reported on an incident during which a man
entering a horse-drawn carriage experienced an acute asthmatic episode two weeks after having
received a blood transfusion from a man with a known horse allergy (7). It was not until 1921,
however, that Prausnitz and Küster gave the first scientific description of the mechanism of the
allergic reaction, showing that hypersensitivity could be transferred from an allergic patient to
that of a non-allergic patient through a serum factor (7). Type I hypersensitivity reactions, in
which IgE plays a central role, include wheal and flare eruptions of the skin, sneezing,
rhinorrhoea and conjunctival irritation (9). More serious conditions include asthma and
anaphylaxis, which are believed to share a similar pathogenesis (9).
The production of IgE is mainly under control of T cells and T cell cytokines. T cells can undergo
two separate differentiation pathways, namely Th1 and Th2, in response to distinct stimuli, and
characterised by the type of cytokines predominantly produced (7). Th1 cells secrete, amongst
others, interleukin (IL)-2, interferon-γ (IFN-γ), tumor necrosis factor-α (TNF-α) and lymphotoxin
(LT). These cytokines mobilise the cellular and humoral defence mechanisms against
intracellular pathogens and antagonise IgE responses (9). The cytokines secreted by Th2 cells
include IL-4, IL-5, IL-6, Il-9, and IL-13. These cytokines coordinate the host defence against
large, extra-cellular pathogens (9).

4
The hypersensitivity cascade pathway, depicted in Figure 3, begins with the presentation of an
antigen / allergen to a T helper cell by an antigen presenting cell (APC) and, in this case, native T
cells undergo differentiation along the Th2 pathway, defined by the production of Th2 cytokines
(7), as described above. IL-4 and IL-13 then direct the differentiation of B cells to IgE-producing
plasma cells (10). This differentiation also requires interaction between the CD40 antigen, a cell
surface receptor expressed on B cells, and its ligand (CD154) on the T cell surface (9). The
biological activities of the free circulating IgE are then mediated through specific receptors (7):
the high-affinity receptor (FcεRI) (see Figure 2) is mainly expressed on mast cells and
basophiles, whereas the low affinity receptor (FcεRII) is expressed on B cells. Following binding
of IgE to the high affinity receptors, mast cells remain sensitised for up to 12 weeks, thereby
greatly increasing the half life of free-circulating serum IgE, which is of approximately two and a
half days (7). Re-exposure of sensitized patients to the allergen leads to specific binding of the
allergen to the IgE-FcεRI complexes on the mast cells. Cross-linking of the receptors then
triggers the release of inflammatory cytokines, chemokines and mediators, such as histamine and
heparin (7). It is these molecules that cause the symptoms observed in the allergic response. IgE
is thus the “gatekeeper” of immediate type I hypersensitivity.
Figure 3
1.3. Importance of IgE
Allergies represent a very serious health problem, with the prevalence of asthma, hay fever and
other IgE-mediated diseases dramatically increasing over the past two to three decades in
industrialised countries (7; 11). In the United States, for example, asthma prevalence increased by

5
75% between 1980 and 1994 (12), with an estimated 15 million individuals affected and more
than 5000 asthmatics dying annually (11). In Britain, 23% of children aged six to seven years,
and 21% of children aged 12 to 14 years, suffer from asthma (13). Furthermore, in Sweden, the
number of children with allergic rhinitis, asthma or eczema doubled during the years 1979 – 1991
(14). In addition, the high degree of morbidity associated with allergic disorders requires large
quantities of costly medication to relieve symptoms. In the United States for example, the total
annual costs for treating asthma were estimated at $6 billion in 1997 (15).
A number of theories attempting to explain the observed increase in allergic disease have been
put forward, many of them centring on the role of the western lifestyle. Reasons put forth include
the increase in air pollution as well as a lack of exposure of the immune system to infections due
to increased sanitisation and vaccinations, resulting in the failure of the immune system to “learn”
optimally (10). Although there is much evidence to support these hypotheses, the causes remain
complex and many unknowns still remain.
The above examples expose the severity and scope of allergic diseases and consequently
highlight the importance of IgE as a medical analyte.
1.4. Current diagnosis methods
The primary aim of allergy testing is to determine whether an individual presenting with
symptoms of an allergic hypersensitivity has demonstrable allergen-specific IgE. The first step in
the diagnostic procedure is an assessment of symptom history and a physical examination. Once
the clinician has concluded that there is a high degree of suspicion of an allergic disorder, in vivo
and in vitro analyses for the presence of IgE can be performed to strengthen the likelihood of the

6
diagnosis being correct (3). In vivo testing refers to skin testing, which has become the standard
to which other detection methods are compared, and is the primary method for detection of
specific IgE (6). In vitro tests, examined in more detail below, refer to IgE immunoassays which
are used as an alternative to skin tests when these are not practical or possible, or when equivocal
results are obtained (6). This could be the case, for example, when an allergenic substance is not
available as a licensed extract for skin testing (e.g. latex, industrial chemicals), or when a patient
is taking medication that would preclude a skin test (6). Generally, results of skin testing
performed under optimal conditions agree with those obtained using specific IgE immunoassays,
but experts agree that these two methods are not interchangeable (6). When discrepancies in
results exist, the skin test is usually positive and the immunoassay negative, probably due to the
limitations of the immunoassays (6). On the other hand, in the case of a positive immunoassay
test and a negative skin test, one should question whether the skin test was performed correctly
(6). Most studies, however, show a sensitivity of approximately 70 – 90% when immunoassays
are compared to skin testing (16; 17).
The first commercial in vitro assay designed for the detection of IgE was the Phadebas RAST
(Radioallergosorbent Test) (Pharmacia, Uppsala, Sweden). In this format, an allergosorbent was
prepared by covalently coupling an allergen of a particular specificity onto cyanogen bromide
activated cellulose paper disks. Allergen specific antibody of all isotypes in the serum could then
bind after addition of the sample. After washing, radio-iodinated anti-human IgE was used to
detect bound IgE. After a second wash, radioactivity relating to the amount of IgE initially
present in the sample was measured using a gamma-counter (3). Although the term “RAST” is
still commonly used to refer to an immunoassay for allergen specific IgE, it is in fact a trademark
name and refers to an assay which is now very rarely used (6). So called “second generation”
allergen-specific IgE antibody assays have almost all been based on the RAST chemistry, but use

7
a larger number and higher quality of allergen extract for the preparation of allergosorbents.
Furthermore, the shelf-life, ease of use and safety of these tests have improved due to the use of
non-radioactive, enzyme-labelled antibodies. Automation has also improved precision and
reproducibility of results (3). Consequently, these assays have become a lot more competitive
with the in vivo skin tests.
There are, however, a number of problems associated with immunoassays, the greatest of which
is the lack of standardisation. This is in most part due to the varying sources of raw allergenic
materials, different methods for binding allergen to the detection matrix and different detection
systems (6). Although no official test standard exists, the Pharmacia CAP system is in worldwide
use and is a de facto standard to which other tests are compared (6).
It is important to bear in mind that although these assays are often promoted as allergy diagnosis
tests, they should best be regarded as tests indicating the presence or absence of detectable
specific IgE (6). Furthermore, specific IgE can be found in patients with allergic diseases as well
as in about 15% of normal asymptomatic individuals (6). Immunoassays or skin tests therefore
cannot be used to determine whether the patient will exhibit symptoms of IgE mediated
hypersensitivity upon exposure to an allergen. Assays for total serum IgE, based on the same
format as specific IgE immunoassays, are also available. High serum levels of IgE may correlate
to an atopic (i.e. allergic) state in the individual, although the limitations of using total serum IgE
as a diagnostic analyte include its age-related concentration and the wide overlap in
concentrations between atopic and non-atopic individuals (6). The detection of total IgE therefore
cannot result in a definite clinical diagnosis, but rather, would serve as a first-line test to guide
clinicians in their decision making process.

8
1.5. Affinity biosensors
Affinity based biosensors are devices incorporating a Molecular Recognition Element (MRE)
such as an antibody, receptor protein, nucleic acid, molecular imprinted polymer (MIP) or
aptamer. The use of affinity-based biosensors has increased significantly over the past decade
(18). This is due to the progress made in signal transduction technologies, as well as to the fact
that MREs, especially antibodies, have become easier to isolate and purify and hence have
become more widely available. When an affinity biosensor includes an antibody or antibody-
related substance as the MRE, it is known as an immunosensor (19). Affinity biosensors can be
further classified based on the MRE incorporated into the device and on the type of transducer
used. The following is a brief overview of affinity biosensors and their applications, in particular
as applied to the detection of IgE.
1.5.a. Types of affinity biosensor
1.5.a.i. Immunosensors
Although immunosensors have been designed in a variety of different ways, incorporating
different transduction technologies, they generally fit in to one of three basic formats, namely
direct non-competitive, competitive (direct or indirect) or sandwich (20) (see Figure 4). In the
direct non-competitive format, the binding of the antigen to the antibody is directly detected
based on the electrochemical or optical properties of the analyte (Figure 4(A)). Surface Plasmon
Resonance (SPR), discussed in Section 1.2, is a pertinent example of direct optical detection of
the binding event. Competitive assay formats are generally used when the analyte is of a low
molecular weight and the binding event cannot be detected directly. In these formats, the signal is

9
inversely related to the analyte concentration (18) (Figure 4B). The sandwich format is based on
the Enzyme Linked Immunosorbent Assay (ELISA) principle, where the analyte tracer is
conjugated to an enzyme, such as horseradish peroxidase, and is detected after addition of a
substrate (Figure 4C). Most electrochemical transducers are based on this format, where the
secondary antibody is usually conjugated to an enzyme capable of generating an electro-active
product after addition of a substrate (21).
Although electrochemical transducers are the most well characterised of the transducer
technologies (18), they do not lend themselves well to affinity based sensors. This is because
most affinity-based reactions are not electrochemically active and therefore cannot participate
directly in redox reactions (21). In the case of amperometric immunosensors, coupling of an
immuno-reaction to the transducer usually requires a labelled immuno-agent to facilitate the
production of electro-active species, which in turn can be detected electrochemically (21). The
first report of an amperometric immunosensor was from Aizawa (1979) (22), who used catalase
as a label to detect human chorionic gonadotrophin (hCG). Major advantages of this type of
electrochemical immunosensor include the ability to detect the label in turbid media, which is not
possible with optical sensors, and the ability to increase the surface area in order to increase
sensitivity (21). Potentiometric immunosensors, based on charge differences between antibody-
antigen complexes and the antibody or antigen alone, ion-selective or gas-sensing electrodes,
have also been reported (21). They have, however, been less successful due to lack of sensitivity
caused by non-specific binding and other background interferences with the transducer (21).
They also require additional time due to the indirect nature of the configurations.
Figure 4

10
Piezoelectric immunosensors, the most common of which is the quartz crystal microbalance
(QCM), have also been widely applied to detect antibody binding to an immobilised antigen (18).
This technique is able to measure small changes in surface properties, such as bound surface
mass and surface viscosity, which can then be related to the concentration of the analyte in the
sample (18; 20). The major advantages of these devices include their small size, high sensitivity
and stability, simplicity of construction and operation, and low power requirement (20).
A recent development in the field of immunosensors is the use of antibodies labelled with
paramagnetic particles (23; 24).With the antigen immobilised, the binding event can be detected
by measuring the magnetic field induced by the magnetic particles. A major advantage of this
method is the ability to permanently record the signal, which could, in principle, be re-measured
at any time.
The last category is optical immunosensors, for which direct and indirect detection methods exist.
Direct methods, requiring no labelling of the antibody or antigen, include internal reflectance
spectroscopy, evanescent wave sensing and surface plasmon resonance, which will be examined
in detail in Section 1.3.
The above-mentioned methods have also been applied to indirect immunosensing, in which a
label, usually fluorescent, is used to monitor the binding event (21). This approach improves the
sensitivity and selectivity of the assay, given that the quantitative signal arises only from the
presence of the label, thereby eliminating non-specific binding interference.
1.5.a.ii. Other types of affinity biosensors

11
Other types of affinity based biosensors include DNA biosensors, also known as gene chips.
These biosensors are used for recognition and quantitation of target DNA sequences, based on
hybridisation of complementary strands to immobilised single-stranded (ss) DNA (20; 21).
Electrochemical and optical transduction methods have been applied, using electro-active or
fluorescent labels specific for binding to hybridised sequences. Label-free electrochemical
detection is also possible through the direct oxidation of guanine bases (25; 26). Fluorescent tags
are still the labelling method of choice for DNA biosensors and were first introduced by
Affymetrix with the GeneChip, in 1996 (21). Piezoelectric DNA biosensors, capable of detecting
the mass change associated with hybridisation, have also been reported (27), as have
electrochemical sensors, such as those from Nanogen.
Molecularly imprinted polymers (MIPs) are artificial ligands which possess steric and chemical
memory for a template, which they can bind with specificity similar to that of an antibody-
antigen interaction (28). They have been employed as non-biological alternatives to antibodies in
competitive binding assays, and applications for analytes such as cortisol, theophylline and
morphine have been investigated, suggesting that MIPs are a promising technique for use in
affinity sensors (19).
Lastly, aptamers are also a very promising technology for the use in immunosensors, and will be
discussed in detail in Section 1.3.
1.6. Recent work on IgE biosensors
Early work performed by Su et al. (1999) (29) made use of anti-human IgE antibodies
immobilised on a piezoelectric sensor for the detection of total IgE in serum samples. The

12
immunosensor proved to have a sensitivity of 12µg/l and could be regenerated five times without
appreciable loss of activity. Further work was performed by Kreuzer et al. (2001) (30), who
described an amperometric immunosensor for the detection of IgE. The sensor used a disposable
screen-printed carbon electrode and had a detection limit of 90ng/l of IgE in whole blood, with an
analysis time of 30 minutes.
More recently, Liss et al. (2002) (31) reported on work performed using a quartz crystal
biosensor and compared the performance of a specifically designed aptamer and an antibody for
the detection of IgE. The authors compared a well-established, published aptamer, which they
subsequently improved on during experimentation, with a commercially available monoclonal
anti-IgE antibody. Their work demonstrated an equal specificity and sensitivity (100µg/l) of the
aptamer with respect to the antibody but with an extended linear detection range to 10-fold higher
concentrations of IgE. In addition to this, the study demonstrated for the first time that an
aptamer-based biosensor could specifically detect an analyte in a complex protein matrix. Lastly,
regeneration of the aptamer receptor layer was shown to be possible.
The work used to illustrate this chapter is based on surface plasmon resonance aptasensors, and
as such the theory of surface plasmon resonance and aptamers is expanded on in the Sections 1.2
and 1.3, respectively.
2. Surface Plasmon Resonance
SPR, as applied to biosensors, is a relatively new technology which has been used in a number of
fields to determine a desired quantity by measuring the change in refractive index occurring due
to the interaction between, for example, a receptor molecule and its ligand (32). The development

13
of SPR-sensing configurations and applications has been described for the measurement of
physical, chemical and biological quantities. It is, however, in the field of affinity biosensors that
SPR has shown the greatest potential, allowing real-time (i.e. under continuous flow conditions)
analysis of bio-specific interactions without the use of labelled molecules (33).
Much of the success of SPR is due to the fact that it is a fast, reliable and sensitive method that
can be used to answer a number of fundamental questions about the interactions of the molecules
being investigated. The information that can be gained includes the following (34):
Concentration determination of the interacting molecules.
Determination of the association and dissociation rate constants and affinity.
Determination of active binding regions and relative binding patterns (e.g. epitope
mapping).
Specificity of the interaction (for a particular molecule or a class of molecules).
The potential of SPR for the characterisation of thin molecular films and monitoring processes at
metal interfaces was recognised in the late seventies (35; 36). Currently, several companies have
commercialised SPR sensor technology, which has become a leading method for the direct real-
time observation of biomolecular interactions (37).
2.1. Theory
A surface plasmon (SP) is a charge-density oscillation (wave) that may exist at the interface of
two media with dielectric constants of opposite signs, such as a metal and a dielectric (e.g. water)

14
(32). The wave is strongly localised and propagates along the interface between the metal and the
ambient medium (34).
The basic principle behind using SPR as a biospecific-interaction analysis (BIA) technique is as
follows. Incident light is used to excite an SP. At the surface plasmon resonance angle, where the
energy and momentum of the incident light coincide with that of the charge density wave, the
photon energy is transferred to the charge density wave (38). This phenomenon is observed by a
sharp dip in intensity of the reflected incident light. The resulting wave propagates along the
interface between the metal and the ambient medium and is extremely sensitive to changes in
refractive index near the metal surface, for example due to receptor-ligand interactions (38).
Changes in the SPR angle, for small angular shifts, are proportional to changes in the refractive
index and consequently to the mass concentration of the biomolecules at the surface of the metal,
which is the basis of the use of SPR for bio-sensing purposes (34).
The most common setup for SPR applications is the Kretschmann configuration, shown in Figure
5. In this configuration, SPs are excited at the surface of a gold film deposited on a prism. The
thickness (d) of the gold film is crucial, as the efficiency of conversion of bulk waves into SPs
decreases with increasing thickness and decreasing transparency of the gold film (39). On the
other hand, if the film is too thin, SPs are rapidly reconverted into bulk waves, significantly
changing the width of the resonance curve and reducing the sensitivity of the SPR measurements
(39). The optimal thickness for a gold film using, for example, a wavelength of 790nm, is 45nm
(39).
As mentioned above, SPs occur at the interface between two media of dielectric permeabilities of
opposite sign, such as between free electron-like metals including silver, aluminium and gold,

15
and water. Given that the dielectric permeability of any material is a function of the wavelength
of the incident light, it follows that for any given interface, the excitation of SPs will not be
possible at all wavelengths (39). For metals, the dielectric constant (εm) is negative in the
infrared-visible range of the spectrum, whereas it is positive for water (εb) within the same range.
This therefore allows the existence of SPs at metal-water interfaces (39). Due to its optical and
chemical properties, gold is the most commonly used metal for SPR applications, a thin film of
which is typically deposited onto a glass substrate (39).
Figure 5
SP waves are distinguished by the fact that they have maximal intensity at the interface, decaying
exponentially in both the metal and the ambient medium, with distance from the surface. The SP
wave is thus specifically associated with the metal-dielectric interface and is therefore different to
a bulk wave. The propagation of electromagnetic waves is characterised by a wave, or
propagation, vector. The propagation vectors for the SP wave (ksp) and the bulk wave (kb) are
defined below (39) (see Figure 5):
ksp = k0 [εm εb / (εm + εb)]1/2 (Equation 1)
kb = k0 εb1/2 (Equation 2)
where k0 is the propagation vector in a vacuum.

16
The condition required for resonance, that is to say the condition required for the bulk wave to be
transformed to the SP wave, is that the bulk propagation vector be equal to the SP propagation
vector (39):
ksp = kb (Equation 3)
Furthermore, resonance depends on the angle of incidence, φ, in the following way (39):
ksp = np kb sinφ (Equation 4)
where np is the refractive index of the prism.
At a particular angle of incidence, ksp will equal kb and the conditions for resonance will be
fulfilled (see Equation 3). At this angle there is maximal coupling of incident light into SPs,
which results in maximal absorption of the incident light by the gold film and a resultant sharp
decrease (minimum) in the reflection coefficient of the incident light is observed (see Figure 9
(A)). The angle at which the SPR minimum occurs is greatly dependent on all the refractive
indices of all the boundary media, including the gold film, the bulk solution in contact with the
gold-coated prism and additional layers such as molecules deposited on the gold surface (39).
Generally, ksp increases proportionately with increasing bio layer thickness, resulting in increases
in the resonance angle (see Equation 4) (39). Therefore, the thicker the bio layer at the surface,
the greater the SPR-minimum shifts to higher angles will be. These shifts can be measured in real
time during the adsorption of biomolecules at the gold film surface.
17
The SPR technique is extremely sensitive to optical thickness changes, and it has been shown that
a change in protein surface concentration of 1ng/mm2 will generate a change of SPR coupling
angle of 0.1° (40).
2.2. Concept
Generally, an SPR device consists of an optical system, a transducing medium and an electronic
system supporting the optoelectronic components of the sensor and allowing data processing
(32). The optical component of the SPR device contains a source of optical radiation and an
optical structure in which the SP wave is excited and interrogated. The transducing medium
interrelates the optical and bio(chemical) domains, relating changes in the refractive index to
changes in the quantity of interest. Its properties also determine the selectivity and response time
of the sensor. The sensitivity, stability and resolution of the sensor, on the other hand, depend on
the properties of both the optical system and the transducing medium (32). Most modern SPR
devices use light emitting diodes (LEDs) as light sources and linear arrays of charge-coupled
devices (CCDs) to detect reflected light from the surface. The use of array detectors allows
reflected light to be measured at a wide range of angles, thereby avoiding the need to
mechanically control the angular position of the detector (39).
2.3. Applications
SPR has been applied to a number of fields, including physics, chemistry and molecular biology.
In the field of physics, SPR sensing devices have been developed to exploit certain physical
phenomena that occur in various optical transducing materials, such as humidity induced

18
refractive index changes in porous thin layers and polymers; or temperature sensors based on the
thermo-optic effect in hydrogenated amorphous silicon (32).
Most chemical SPR sensors are based on the measurement of SPR variations due to adsorption or
a chemical reaction of an analyte with a transducing medium which results in changes in its
optical properties (32). Applications of these sensors include, amongst others, monitoring of the
concentration of vapours of hydrocarbons, aldehydes and alcohols by adsorption in polyethylene
glycol films, and the detection of vapours of aromatic hydrocarbons by their adsorption in Teflon
films (32).
It is, however, in the field of molecular biology that SPR has been most successful, with
applications including immunological analysis, studies of protein-protein interactions, molecular-
biological studies on the mechanisms of gene expression, signal transduction and cell-cell
interactions, screening of new ligands, quantification of protein adsorption and immobilisation,
the evaluation of surfaces for biocompatibility, epitope mapping, determining affinity constants,
and the examination of binding kinetics (39). The first application of SPR to biosensing was
demonstrated in 1983 (41). Since then, the technology and consequent breadth of applications has
continued to develop. This is due in major part to the fact that it is possible to measure the
kinetics of biomolecular interactions in real time with a high degree of sensitivity; and that no
labelling of the biomolecules is necessary for their detection (39). Furthermore, analysis of
receptor-ligand interactions with a wide range of molecular weights, affinities, binding rates and
in numerous different chemical environments is possible (42). Indeed, analyses of analytes with
masses ranging from hundreds of Daltons to whole cell binding have been reported (42).

19
Detection methods are most often direct, where analyte quantification is carried out by direct
detection of the binding of the analyte to the immobilised receptor. In cases where the analyte is
small and its binding to the receptor does not produce a measurable increase in the refractive
index, indirect sandwich or competitive assay methods may be used (32).
Table 1 lists the most common molecular biological applications of SPR biosensors. Examples of
the italicised applications are given below.
Table 1
As mentioned previously, the use of SPR for the determination of kinetic parameters is a major
contributor to its success as an analytical technology. Early work using SPR for the determination
of reaction kinetics was performed to determine the effect of single base pair mismatches on
DNA hybridisation kinetics. In work performed by Gotoh et al. (1995) (44), it was shown that the
association kinetics for DNA hybridisation were inversely proportional to the number of
mismatched base pairs, and that the dissociation kinetics were even more strongly influenced by
the number of mismatches.
In more recent work, the determination of kinetic parameters has proven to be extremely
valuable. Indeed, numerous examples exist in which interaction rates are more descriptive of a
given biological process than the equilibrium binding affinities (42). For example, Leferink et al.
(2000) (45) described growth factor interactions with ErbB-1 in which the dynamic rate
constants correlated better with mitogenic activity than did the equilibrium constants (42). A
more pertinent example, however, is that of McDonnell et al. (2001) (46), who identified a role
for the Cε2 domain for IgE (see Figure 2) in allergic responses. Removal of this domain from IgE

20
has little effect on the overall affinity of IgE for its receptor FcεRI, but has a clear effect on the
off rate. It was thus demonstrated that Cε2 contributes to the slow off rate of IgE-mediated mast
cell sensitisation during the allergic response.
Insights into binding reaction mechanisms can be gained by analysing binding kinetics and
thermodynamics over a range of conditions, such as temperature, ionic strength and pH.
Measurements over a range of ionic strengths, for example, can help describe the role of
electrostatic interactions for a particular binding reaction. Thus one can, for example,
discriminate between specific and non-specific protein-DNA binding, due to their difference
ionic strength dependence. Indeed, non-specific protein-DNA binding interactions are highly
dependent on ionic strength due to the significant electrostatic contribution of the negatively
charged phosphates of the DNA backbone (42).
SPR has also been used for investigating biological membrane events. This has been made
possible by the recent introduction of sensor surfaces specifically designed for this purpose, such
as the HPA (hydrophobic) or L1 (lipophilic) surfaces from BIAcore (43). These surfaces offer the
ability to specifically orient immobilised ligands and have been shown to be a successful
membrane mimic (42). Danelian et al. (2000) (47), for example, used a liposome-covered sensor
surface for an assay for lipid absorption for a panel of 27 drugs and showed a strong correlation
with passive intestinal absorption. Future advances in this field might include inserting ion
channels, transmembrane receptors and cell-signalling molecules within the immobilised lipid
surface in an attempt to closer mimic in vivo systems (43).
Lastly, the general versatility, ease of automation, lack of labelling requirements and low sample
consumption of SPR analysis make it a promising means for large scale screening for binding

21
events, both for small molecules in drug discovery and for macromolecules in large scale ligand
fishing experiments (42). It is able to perform functional characterisation of “hits” from primary
screens, providing information not obtainable from traditional screening methods and making it
possible to rank ligands based on affinity as well as association and dissociation kinetics.
Additionally, some of the more advanced instruments (BIAcore 2000 and 3000) have a
throughput of 100 – 300 samples per day, depending on assay conditions (43), thus making this
method capable of high throughput analysis. SPR has in fact been used to monitor binding of
thyroxin analogues to an immobilised antibody (48), as well as by the La Jolla Pharmaceutical
Company for the development of a new drug for the treatment of systemic lupus erythromatosis
(42).
2.4. Future developments
Despite the many advantages offered by SPR, there are a number of advances that will need to be
made in order for this analytical technique to become as widespread as, for example,
immunoassays, which are the major competitor of SPR within the field of analysis and detection
of biochemical substances, and which offer low cost and high sensitivity and specificity testing.
These advances are likely to include (32):
Improvement of detection limits. Current detection limits stand at about 1pg/mm2, which
is not sufficient for detecting low concentrations of low molecular weight analytes.
Although optimisation of SPR optical instruments and refining of data processing
methods may lower the current detection limits, no approach currently exists that will
lower this limit by the necessary orders of magnitude. Progress will therefore need to be
made in this area.
22
Multi-channel performance. This would be required for high throughput screening and
detection for new pharmaceuticals. Advances have already been made in this area, with
the introduction of a four-channel chip which can be rotated by 90°, effectively providing
16 channels. Myszka and Rich (2000) (49) have more recently described a prototype
micro array chip with 64 individual immobilisation sites in a single flow cell.
Development of advanced recognition elements for applications involving complex
realistic samples (e.g. blood). Stable receptor matrices which allow sensor responses and
non-specific background effects to be resolved will also have to be developed.
All these developments may eventually lead to miniaturised, integrated, compact and rugged
sensing elements which would fulfil a number of the requirements of an ideal biosensor.
3. Aptamers
Aptamers have been defined by James (2000) (50) in the Encyclopaedia of Analytical Chemistry
as: “…artificial nucleic acid ligands that can be generated against amino acids, drugs, proteins
and other molecules. They are isolated from complex libraries of synthetic nucleic acid by an
iterative process of adsorption, recovery and re-amplification. They have potential applications in
analytical devices, including biosensors, and as therapeutic agents.” In essence, they are synthetic
oligonucleotide sequences which are able to bind a wide array of molecules (ligands) with high
affinity and specificity (51; 52). Their name is derived from the Latin word “aptus”, meaning “to
fit” (52).
Importantly, the ligand binding capacity of aptamers is based on their three dimensional
conformation and not on nucleotide base pair complementarity (53). Indeed, upon association

23
with their molecular targets, aptamers fold into molecular structures in which the target becomes
an intrinsic part of the nucleic acid structure (54). They are therefore able to bind proteins and
other molecules that would not normally interact with deoxyribonucleic acid (DNA) or
ribonucleic acid (RNA), making them extremely powerful as screening tools (53). They were
initially reported on in 1990 quasi simultaneously by three independent laboratories: those of
Joyce (55), Szostak (56) and Gold (57), and are obtained using an in vitro selection and
purification technique, now known as SELEX (Systematic Evolution of Ligands by Exponential
Enrichment), as described in Section 1.4.2 (51).
3.1. Aptamer libraries
Before the SELEX process is undertaken, an aptamer library has first to be created. Part of the
enormous potential of aptamers lies precisely in the fact that libraries with vast numbers of
potential ligands can be created and screened within a few days. Typically, aptamer libraries
consist of 1013 – 1018 random oligonucleotide sequences (51) and can be screened within a
number of days. This is all the more impressive when compared to conventional libraries of
potential drugs which consist generally of no more than 106 different molecules and may take
months to screen (53).
When creating a library however, the following factors need to be taken into account (53):
The aptamer library complexity: given random manufacture of aptamers, the library complexity
can be calculated relatively easily. For example, a library of oligonucleotides of N nucleotides in
length generated from y different nucleotides (not solely limited to the four naturally occurring
nucleotides) will have a complexity of yN. However, for practical purposes, and as mentioned

24
above, the maximum number of unique sequences that can be screened in a library is limited to
1013 – 1018. It is interesting to note, however, that further diversity may be introduced during the
SELEX process itself (see Section 1.4.2), in particular due to the infidelity of the DNA
polymerase used in the polymerase chain reaction (PCR) step, which may not be 100% accurate.
The nucleotide chemistry: this is important because, firstly, it defines the range of possible three-
dimensional structures into which the aptamer can fold, and secondly, the nucleotide chemistry
plays an extremely important role in relation to the aptamer’s stability to degradation. Indeed, the
susceptibility of single stranded oligonucleotides to enzymatic or chemical cleavage is a severe
practical handicap to the use of aptamers that needs to be overcome for the molecules to be stable
in biological fluids. Three different approaches have been adopted to overcome this problem:
Modification of nucleotide bases, which has been the most commonly used
method. The modification of pyrimidines at the 5’ position with I, Br, Cl, NH3
and N3 and at the 2’ position with NH2, F and OCH, for example, has been
described by Pieken et al. (1997) (58). These modifications can increase the RNA
oligonucleotide half-life up to 15 hours (54). It should be noted, however, that any
modified nucleotides should still be compatible with the enzymes used in the
SELEX protocol (for example DNA polymerase). Interestingly, some problems
associated with modified nucleotides have been overcome by a modification of the
SELEX protocol known as “Transcription Free SELEX”, in which random RNA
fragments bind random DNA templates, after which the fragments are ligated
either enzymatically or using a standard chemical condensation reaction. The
RNA aptamer can then be recovered by melting the duplex.

25
Modification of the phosphodiester backbone, for example through the use of α-
thio substituted deoxynucleotide triphosphates, although this technique has been
more successful with DNA as opposed to RNA aptamers.
The use of enantiomeric aptamers, known as spiegelmers (from the German word
meaning “mirror”). This technique consists in creating a mirror image of the target
and selecting an aptamer for this mirror image. A stereo isomer of the selected
aptamer is then created (i.e. the spiegelmer), which will be specific for the target
but will not be susceptible to normal enzymatic degradation due to the substitution
of the natural D-ribose with L-ribose (54).
The constant region primer design: the random aptamer sequence has to be flanked by 5’ and 3’
constant sequences, usually 20 – 25 base pairs in length, which provide hybridisation sites during
a number of steps of the SELEX process (51). The 3’ flanking sequence generally acts as an
attachment site for the reverse transcriptase primer; and the 5’ flanking sequence acts as the
attachment site for the PCR primers during the amplification step of the SELEX protocol. The
design of the constant region for the SELEX protocol is even more important than for normal
PCR given that a complete SELEX protocol may include up to 200 cycles of PCR. Any artefacts
would thus be drastically amplified in the final aptamer population.
3.2. SELEX
After a suitable aptamer library has been prepared, it can undergo the SELEX protocol, as shown
in Figure 6. This technique essentially consists of the repeated binding, selection and
amplification of aptamers from the initial library until one (or more) aptamer(s) displaying the
desired characteristic(s) has (have) been isolated (53).

26
Referring to Figure 6, Steps 1 and/or 2 involve the preparation of the aptamer library/candidate
mixture, as detailed above. Note that the library would generally consist of double-stranded
DNA, which either needs to be transcribed (for RNA selection) or strand-separated (for single-
stranded DNA selection), in order to be in a suitable form for selection (54).
In Step 3, the target and the aptamers are brought together under favourable binding conditions,
where the aptamers with the highest affinity will bind the target. These aptamers are then
partitioned from the aptamers with lower affinity in Step 4. This step can be performed by
attaching the aptamers to a solid phase support, such as sepharose, and specifically eluting the
desired aptamers after binding has taken place. Immobilising the aptamers, however, is likely to
affect the binding interactions between the aptamer and the target. The same would be true if the
target were immobilised instead of the aptamer (53). Alternatively, the aptamer and target could
be allowed to interact freely in solution, after which the target-aptamer complex could be
recovered by filtration through nitrocellulose (54). This method is commonly used, although it is
important to note that it is only applicable when the target molecule is a protein. A negative
selection step is also frequently used at this stage, in which the aptamers are passed over a
cellulose filter in the absence of the target. This is to eliminate aptamers that bind the filter in a
target-independent manner (54). Counter selection is also sometimes used, where aptamers that
bind structures similar to that of the target are removed (51). Affinity chromatography is
generally used to isolate aptamers for small molecular targets (54).
The high affinity aptamers are then amplified by reverse transcription PCR (RT-PCR) (for RNA
aptamers) (Step 5) or by PCR for DNA aptamers (Step 6), in order to create a new aptamer
library enriched with the aptamers of high affinity. The entire process is then repeated (Step 7),

27
resulting in fewer and fewer unique sequences, with higher and higher affinity to the target, being
retained. Note that during each round of selection, the binding conditions for the aptamer and the
target are generally made more stringent in order to increase the selective pressure on the
remaining aptamers. Generally, a complete SELEX process (between 8 – 15 cycles) will yield a
final mixture of no more than ten aptamers (53; 54). The aptamers can then be cloned and
sequenced, allowing further identical aptamers to be generated by chemical synthesis.
Figure 6
The SELEX procedure is clearly involved and can take weeks to months to produce a suitable
aptamer when performed manually. Cox et al. (1998) (59) first reported on the automation of the
procedure. A more recent report (60), however, details the automation of the procedure where
approximately 12 rounds of selection can be carried out in two days. Based on these figures, it
has been estimated that one robot could produce aptamers against 120 targets in one month,
exceeding manual throughput by 10 – 100 fold. It has also been suggested that further
development of the automated procedure could lead to the production of aptamers to upwards of
1000 targets per month. Several robots working in parallel could therefore generate aptamers to
an entire proteome within a relatively short period of time, further highlighting the immense
potential of aptamers. An additional advantage of an automated procedure is the consistency of
the repetitive tasks that it offers, creating a bench mark to allow comparisons between different
laboratories and eliminating variations due to manual selection techniques (59).
3.3 Aptamers and antibodies

28
Given the characteristics of aptamers described above, it is clear that they could be of great use
for therapeutic, analytical and diagnostic procedures. Currently, antibodies are most frequently
used in procedures where high affinity and specificity for a particular target are required, such as
ELISAs. The following is a discussion of the advantages and disadvantages of using aptamers or
antibodies for these techniques.
The use of antibodies to detect analytes became widespread in the 1970s, when polyclonal sera
from immunized animals were the most popular choice (52). It was not long thereafter till the
discovery of monoclonal antibody technology which allowed the production of a unique antibody
in large quantities (52). This technology allowed affinity based assays to be further refined and
optimised and was embraced throughout the scientific community. The many advantages of
antibodies include their high affinity and specificity for their particular antigen, typically with
very low dissociation constants. Furthermore, selected clones producing the antibody of choice
can be cultured continuously, hence providing a limitless supply of a particular antibody
(theoretically). Lastly, the immunogen used for the identification of a monoclonal antibody does
not have to be pure (52).
There are, however, a number of disadvantages and limitations associated with the use of
antibodies. These are listed below (52):
The production of antibodies requires animals. The generation of antibodies against
molecules that are not well tolerated by the animal (e.g. toxins) or against molecules that
are not inherently immunogenic can therefore be problematic.

29
The production and identification of monoclonal antibodies are laborious procedures and
are likely to be costly in searches for rare antibodies requiring the screening of large
numbers of colonies.
High yields of antibodies may be problematic to obtain due to difficulties associated with
growing certain hybridomas in vivo, the manner in which high yields are typically
achieved.
The performance of the same antibody may vary between batches, requiring the
immunoassay to be re-optimised with each new batch of antibody.
It is not feasible to identify antibodies that could detect targets under non-physiological
conditions.
There is no control over the selection of the target protein to which the antibody binds
(this is “determined” by the immune system of the animal) (54).
The kinetic parameters of antibody-target interactions cannot be manipulated on demand.
Antibodies are heat-labile, undergoing irreversible denaturation.
They have a limited shelf-life.
It is important to note that various approaches addressing the shortcomings listed above are being
investigated, including humanisation of antibodies, antibody engineering and in vitro
immunisation (52).
Listed below are the various advantages aptamers offer over antibodies for the use in analytical
and diagnostic devices (52):
Aptamers do not require the use of animal systems for their production.

30
The properties of aptamers can be changed on demand due to the fact that they are
produced through an in vitro process that does not depend on animals or on in vivo
conditions.
Selection conditions can be manipulated to obtain aptamers that bind the target under
non-physiological conditions, for example. Similarly, the kinetic parameters of the
aptamer can also be manipulated on demand.
Aptamers can be generated against targets that are toxic or that are not inherently
immunogenic.
Batch to batch variation is eliminated in aptamer production, given the fact that they are
chemically synthesised.
Aptamers can be easily engineered to include reporter molecules at a precise location,
specified by the user, without affecting their binding characteristics.
Small aptamers can be used to generate dense receptor layers, thus allowing increased
sensitivity for a given affinity (31).
The heat denaturation process in aptamers is reversible, allowing them to be easily
regenerated.
Aptamers are stable in long-term storage.
The main advantages of aptamers over antibodies are summarised in Table 2.
Table 2
The main drawbacks of aptamers include the time required for selection using a manual SELEX
process, although this is slowly being overcome by the introduction of automated SELEX
processes. Additionally, their affinity constants are generally lower than those of antibodies and

31
their structural stability is still questionable (19). Furthermore, the fact that the science of
aptamers is relatively young and much of the work and knowledge-base in the field is still highly
experimental is an additional concern hindering their common use.
3.4. Applications
3.4.a. Two site binding assays
ELISA sandwich assays, using antibodies, are a very common diagnostic assay. The term
ELONA (Enzyme Linked Oligonucleotide Assay) is applied to the same assay format using
aptamers (51). Various ELONA formats can be adopted, using for example (51):
Aptamers as capture molecules and antibodies as reporter molecules;
Antibodies as capture molecules and labelled aptamers against the antibody-antigen
complex as reporter molecules;
Aptamers as capture molecules and labelled aptamers against the aptamer-analyte
complex as reporter molecules.
ELONAs have been demonstrated to be successful for the detection of VEGF (61) and CD4+
cells (62).
3.4.b. Flow cytometry
Flow cytometry is a powerful tool that is used both analytically and diagnostically for the multi-
parameter analysis of cells in suspension. Generally, this method is performed using labelled

32
monoclonal antibodies. Recently however, aptamers have been used to perform the role of
monoclonal antibodies in this process, with promising results. Indeed, it has been shown that
aptamers can be relatively easily conjugated to small fluorophores, such as fluorescein, or even to
larger proteins such as phycoerythrin, and still retain their binding characteristics, demonstrating
their ability to be used with a wide variety of reporter molecules that are generally used in
diagnostics (52). Generally, aptamers have been shown to perform as well as antibodies or can
even be used in combination with them for flow cytometry analyses (52).
3.4.c. Biosensors
Affinity sensors should ideally fulfil at least three basic criteria (52), namely:
The ability to transduce the binding event without adding extra reagent;
The ability to detect and quantify the target within the desired concentration range and
time period;
The ability to make repeated measurements on the same transducer.
The use of aptamer-based biosensors would offer a number of advantages in this respect. Indeed,
the function of immobilised aptamers could be regenerated using extremes of heat, salt
concentration or chelating agents, without loss of activity, resulting in a reusable transducer (52).
Aptamers can also be easily modified for immobilisation without affecting their function (52).
Furthermore, they can be selected-for in conditions resembling those of the real matrix, which is
particularly useful for environmental and food applications (51). Lastly, aptamers can be easily
labelled with a wide range of reporter molecules, allowing the design of a variety of detection
formats (52).

33
Recent work on aptamers in affinity sensors includes the use of an RNA aptamer specific for L-
adenosine (63) and a DNA aptamer for human thrombin (64). Results in both cases were
promising, with the aptamers showing high specificity and the ability to be regenerated (52).
3.4.d. Molecular beacons
Molecular beacons are a class of fluorogenic probe in which a fluorophore is attached to one
terminus and a quencher is attached to the other. In the absence of the target molecule, the probe
forms a hairpin loop, bringing the fluorophore and the quencher into close proximity, resulting in
the absence of a fluorescent signal. In the presence of a target molecule, however, the hairpin
loop structure is opened (the target is complementary to the loop region), the fluorophore and
quencher are distanced from each other and a fluorescent signal is produced, as illustrated in
Figure 7. Until recently, these probes have only been available for the detection of nucleic acid
targets, due to the inability of these probes to interact with other classes of targets, such as
proteins (52).
Figure 7
Aptamers, however, have the ability to interact with a very wide range of targets and have
therefore been exploited to extend this technique to include targets other than nucleic acids. For
this purpose, molecular beacons, termed ligand beacons when used in this way, are designed to
be complementary to a nucleotide region in the aptamer. In the absence of the target (Figure
8(A)), the ligand beacon binds the aptamer, resulting in the separation of the fluorophore and the
quencher and the production of a fluorescent signal. In the presence of the target (Figure 8(B)),
34
however, the binding site on the aptamer is no longer available to the ligand beacon because it is
bound by the target. This results in the ligand beacon adopting an internal hairpin loop structure
and in the absence of a fluorescent signal (52).
Figure 8
This format is also applicable to a multiplex system, in which a number of different analytes are
detected simultaneously with the use of ligand beacons conjugated to fluorophores emitting at
different wavelengths (52).
This type of assay once again clearly shows the potential of aptamers for analytical and
diagnostic procedures, which cannot be fulfilled by antibodies.
3.4.e. Capillary electrophoresis
Capillary electrophoresis (CE) is a separation technique based on the same principle as
conventional electrophoresis. It offers the advantages of speed, small sample volumes, suitability
for automation, sensitivity and the possibility of performing multiplex assays (52). CE is now
being adapted for immunoassays, in which antibody-antigen complexes are separated on a fluidic
stream under an applied electric field (52). However, there are many practical difficulties
associated with this method, such as poor separation between antibody-target complexes and free,
labelled, antibodies when the targets are small and uncharged (52).
Recently, German et al. (1998) (65) adapted the technique to use a fluorescently labelled DNA
aptamer for the detection and quantification of human IgE. The technique was able to separate

35
free aptamer from the aptamer-IgE complex in the presence and in the absence of serum,
indicating that the aptamer-target interaction was not affected by the complex medium.
3.4.f. Molecular switches
A very relevant example, as described by Jayasena (1999) (52), of where aptamers can be used as
molecular switches is in PCR. In order to avoid non specific amplification, which is often due to
non-specific binding of primers at sub-optimum temperatures and to the ambient temperature
activity of the DNA polymerase enzyme, an essential amplification ingredient can be withheld
until the temperature is sufficient to ensure specific binding of the primers. This has been
achieved, for example, by using a monoclonal antibody which neutralises the activity of the DNA
polymerase. When the temperature of the reaction mixture is increased to begin the amplification
reaction, the antibody is denatured and the DNA polymerase regains its activity. One of the
shortcomings of this method is the high temperature at which the antibody is denatured (>75°C).
Although suitable for DNA amplification, these high temperatures would denature RNA targets,
making this method of preventing non-specific amplification unsuitable for RT-PCR.
For this purpose, aptamers able to inhibit the activity polymerase enzymes and which are
“switched off” above 40°C have been selected using high temperature selection conditions (52),
demonstrating how aptamers can be used as temperature-sensitive molecular switches.
It is clear, however, that aptamers could be selected as molecular switches sensitive to other
criteria such as pH, salt or the presence of metal chelating agents (52).
3.4.g. Aptamer arrays

36
Although antibody-based microarrays for the use in proteomics are currently being developed,
aptamer-based arrays would be attractive for the following reasons (52):
Aptamer identification can be performed on an automated platform;
Aptamers can be immobilised at defined densities and at precise locations using existing
deposition technology;
Homogenous preparations of aptamers are readily available from chemical synthesis;
Aptamer-based arrays would be robust and have a long shelf life;
Proteins could be bound irreversibly using specifically modified aptamers.
These arrays will certainly play an increasingly important role in the study of proteomics as the
wealth of information at the DNA level continues to increase with the multitude of genome
screening projects.
3.4.h. Aptazymes
Aptazymes are aptamers linked to ribozymes (catalytic RNA molecules) possessing catalytic
activity. They are able to directly transduce molecular recognition into a quantifiable catalytic
event and can be generated using two different strategies (54):
Pre-existing aptamers and pre-existing catalytic RNAs, with known specificity and
catalytic properties, can be integrated. In this way, the resulting molecule will possess the
desired affinity for the target as well as the expected catalytic effect.

37
The aptazyme with the desired binding specificity is selected from a pool of aptazymes
containing a random sequence receptor site and a catalytic region with established
properties.
Aptazymes have been applied to the monitoring of post-translational modification (66) and have
also been adapted to a chip array able to distinguish between various metabolites (67).
4. Implementation and Illustration of Instrumentation
The Biacore X (Biacore, Uppsala, Sweden) SPR analytical instrument is a typical device with
which this type of work can be performed. The following is a brief description of the methods
involved in this work.
4.1. Immobilisation
The IgE-specific aptamer was immobilised to a dextran sensor chip (CM5) obtained from Biacore
(Uppsala, Sweden) via a streptavidin-biotin reaction. The dextran chip allows for a more
“biocompatible” environment, increased receptor activity, increased receptor density, as well as
reduction in non-specific sample interactions. Once immobilisation was complete, binding
experiments using IgE could then be performed by running appropriate sample concentrations
and volumes over the sensor surface. After binding of the target molecule, the sensor surface
could be regenerated using a solution of EtOH/NaOH. A typical result obtained from an SPR
experiment, known as a sensogram, is shown in Figure 9.
Figure 9

38
4.2. Calibration
Using a range of concentrations, it is possible to obtain a calibration curve, which can be used to
extrapolate the concentration of target analyte in solutions of unknown concentrations. Such a
calibration curve is shown in Figure 10.
Figure 10
Although this work has been carried out successfully, there remain a number of areas where vast
improvements can still be made, particularly with respect to the sensitivity of the measurements.
Indeed, in this particular case, the sensitivity of the aptasensor has not yet been optimised and is
not sufficient for the detection of IgE in real samples. For measurements of very low
concentrations of target analyte to be feasible, a high association constant of the aptamer and IgE
is necessary. This constant is very much dependent upon the three dimensional stability of the
aptamer and further developments in the design and selection of theses aptamers needs to be
made.
5. Future Prospects
If an aptasensor for the detection of IgE were to be developed for routine clinical use, the aptamer
selected would need to form a very stable complex with the target analyte in order to withstand
the numerous washing steps which would be necessary for its detection in a complex solution
such as blood. Selection of an aptamer known to form a stable complex with IgE when
immobilised to a solid support would therefore appear to be necessary.

39
Further work would also be needed to test the aptamer in complex protein solutions which would
undoubtedly be necessary to develop an aptasensor capable of clinical application.
The ultimate aim would be to develop allergen-specific IgE aptamers and incorporate them into a
commercially viable aptasensor which could be used by an individual to diagnose precisely to
which allergen they are allergic.
References
(1) Mayer G. 2004. The structure and function of immunoglobulins. Available at
http://www.med.sc.edu:85/mayer/IgTypes2000.htm
(2) Stefan R-I, van Staden J and Aboul-Enein H. 2000. Immunosensors in clinical analysis
Fresenius Journal of Analytical Chemistry 366: 659 – 668.
(3) Hamilton R and Adkinson N. 2003. Clinical laboratory assessment of IgE-dependent
hypersensitivity. Journal of Allergy and Clinical Immunology 111: S687 – 701.
(4) Johansson SG and Benich H. 1967. Immunological studies of an atypical (myeloma)
immunoglobulin. Immunology 13: 381 - 394.
(5) Ishizaka K and Ishizaka T. 1967. Identification of gamma-E-antibodies as a carrier of
reaginic activity. Journal of Immunology 99(6): 1187 - 1198.

40
(6) Dolen WK. 2003. IgE antibody in the serum – detection and diagnostic significance. Allergy
58: 717 – 723.
(7) Hamelmann E, Rolinck-Werninghaus C and Wahn U. 2002. From IgE to Anti-IgE: Where do
we stand? Allergy 57: 983 – 994.
(8) Ramirez M. 1919. Horse asthma following blood transfusion: Report of a case. JAMA 73:
984.
(9) Corry DB and Kheradmand F. 1999. Induction and regulation of the IgE response. Nature
402: B18 – B23.
(10) Miescher S and Vogel M. 2002. Molecular aspects of allergy. Molecular Aspects of
Medicine 23: 413 – 462.
(11) Leung DY. 1998. Molecular basis of allergic diseases. Molecular Genetics and Metabolism
63: 157 – 167.
(12) Doyle R. 2000. Asthma worldwide. Scientific American 282: 30.
(13) Mitchell EA. 1999. Asthma epidemiology: clues and puzzles. Pediatric Pulmonol Suppl
18:31 – 33.

41
(14) Aberg, N, Hesselmar B, Aberg B and Eriksson B. 1995. Increase of asthma, allergic rhinitis
and eczema in Swedish school children between 1979 and 1991. Clinical and Experimental
Allergy 25: 815 – 819.
(15) Smith DH, Malone DC, Lawson KA, Okamoto LJ, Battista C and Saunders WB. 1997. A
national estimate of the economic costs of asthma. American Journal of Respiratory and Critical
Care Medicine 156: 787–793.
(16) Williams PB, Dolen WK, Koepke JW and Selner JC. 1992. Comparison of skin testing and
three in vitro assays for specific IgE in the clinical evaluation of immediate hypersensitivity.
Annals of Allergy 68: 35 – 45.
(17) Ownby DR, Magera B and Williams PB. 2000. A blinded, multi-centre evaluation of two
commercial in vitro tests for latex specific IgE antibodies. Annals of Allergy, Asthma and
Immunology 84: 193 – 196.
(18) Rogers K and Mulchandani A. 1998. Affinity biosensors: techniques and protocols. Humana
Press Inc, New Jersey, USA.
(19) Luppa PB, Sokoll LJ and Chan DW. 2001. Immunosensors--principles and applications to
clinical chemistry. Clinica Chimica Acta: 314(1-2):1 - 26.
(20) Turner APF, Laschi S and Mascini M. 2002. Biosensors. Kirk-Othmer Encyclopaedia of
Chemical Technology. John Wiley & Sons, Inc.

42
(21) D’Orazio P. 2003. Biosensors in clinical chemistry. Clinica Chimica Acta 334:41 – 69.
(22) Aizawa M, Morioka A, Suzuki S, Nagamura Y. 1979. Enzyme immunosensor. III.
Amperometric determination of human chorionic gonadotropin by membrane-bound antibody.
Analytical Biochemistry. 94(1): 22-8.
(23) Richardson J, Hawkins P, Luxton R. 2001. The use of coated paramagnetic particles as a
physical label in a magneto-immunoassay. Biosensors and Bioelectronics. 16(9-12): 989-993.
(24) Gabig-Ciminska M, Holmgren A, Andresen H, Bundvig Barken K, Wumpelmann M, Albers
J, Hintsche R, Breitenstein A, Neubauer P, Los M, Czyz A, Wegrzyn G, Silfversparre G, Jurgen
B, Schweder T, Enfors SO. 2004. Electric chips for rapid detection and quantification of nucleic
acids. Biosensors and Bioelectronics. 19(6): 537-546.
(25) Mascini M, Palchetti I, Marrazza G. 2001. DNA electrochemical biosensors. Fresenius
Journal of Analytical Chemistry. 369(1): 15-22.
(26) Lucarelli F, Kicela A, Palchetti I, Marrazza G, Mascini M. 2002. Electrochemical DNA
biosensor for analysis of wastewater samples. Bioelectrochemistry. 58(1): 113-118.
(27) Mannelli I, Minunni M, Tombelli S, Mascini M. 2003. Quartz crystal microbalance (QCM)
affinity biosensor for genetically modified organisms (GMOs) detection. Biosensors and
Bioelectronics 18(2-3): 129-140.

43
(28) Piletsky S and Turner APF. 2004. Molecular Imprinting, Landes Bioscience, Georgetown,
TX, USA.
(29) Su X, Chew FT and Li SFY. 1999. Self-assembled monolayer-based piezoelectric crystal
immunosensor for the quantification of total human immunoglobulin E. Analytical Biochemistry
273: 66 – 72.
(30) Kreuzer MP, O’Sullivan CK, Pravda M and Guilbault GG. 2001. Development of an
immunosensor for the determination of allergy antibody (IgE) in blood samples Analytica
Chimica Acta 442: 45 – 53.
(31) Liss M, Petersen B, Wolf H and Prohaska E. 2002. An aptamer-based quartz crystal protein
biosensor. Analytical Chemistry 74: 4488 – 4495.
(32) Homola J, Yee S and Gauglitz G. 1999. Surface plasmon resonance sensors: review.
Sensors and Actuators B 54: 3 – 15.
(33) Mullett WM, Lai EPC and Yeung JM. 2000. Surface Plasmon Resonance-Based
Immunoassays. Methods 22: 77 – 91.
(34) Liedberg B and Johansen K. 1998. Affinity biosensing based on surface plasmon resonance
detection. In: Rogers K and Mulchandani A. 1998. Affinity biosensors: techniques and protocols.
Humana Press Inc, New Jersey, USA.

44
(35) Brockman JM, Nelson BP and Corn RM. 2000. Surface plasmon resonance imaging
measurements of ultrathin organic films. Annual Review of Phys Chem 51: 41 - 63.
(36) Hickel W, Kamp D, and Knoll W. 1989. Surface plasmon microscopy. Nature 339:186.
(37) Elkind JL, Stimpson DI, Strong AA, Bartholomew DU and Melendez JL. 1999. Integrated
analytical sensors: the use of the TISPR-1 as a biosensor. Sensors and Actuators B 54: 182 – 190.
(38) Liedberg B, Nylander C and Lundström I.1995. Biosensing with surface plasmon resonance
— how it all started. Biosensors and Bioelectronics 10(8): i – ix.
(39) Silin V and Plant A. 1997. Biotechnological applications of surface plasmon resonance.
Trends in biotechnology 15: 353 – 359.
(40) Earp R and Dessy R. 1996. Surface Plasmon Resonance. In: Commercial biosensors:
applications to clinical, bioprocess, and environmental samples. Graham Ramsay (ed.), 1998.
John Wiley & Sons Inc., New York, USA.
(41) Liedberg B, Nylander C and Lundstrőm I. 1983. Surface plasmon resonance for gas
detection and biosensing. Sensors and Actuators 4: 299 – 304.
(42) McDonnell JM. 2001. Surface plasmon resonance: towards an understanding of the
mechanisms of biological molecular recognition. Current Opinion in Chemical Biology 5: 572 –
577.

45
(43) Rich R and Myszka D. 2000. Advances in surface plasmon resonance biosensor analysis.
Current Opinion in Chemical Biology 11: 54 – 61.
(44) Gotoh M, Hasegawa Y, Shinohara Y, Shimizu M and Tosu M. 1995. A new approach to
determine the effect of mismatches on kinetic parameters in DNA hybridization using an optical
biosensor. DNA Research 2(6): 285 - 293.
(45) Leferink AE, van Zoelen EJ, van Vugt MJ, Grothe S, van Rotterdam W, van de Poll ML and
O’Connor-McCourt MD. 2000. Superantagonistic activation of ErbB-1 by EGF-related growth
factors with enhanced association and dissociation rate constants. Journal of Biological
Chemistry 275: 26748 - 26753.
(46) McDonnell JM, Calvert R, Beavil RL, Beavil AJ, Sutton BJ, Gould HJ and Cowburn D.
2001. The structure of the IgE Ce2 domain and its role in stabilizing the complex with its high-
affinity receptor FceRI. Nature Structural Biology 8: 437 - 441.
(47) Danelian E, Karlen A, Karlsson R, Winiwarter S, Hansson A, Lofas S, Lennernas H and
Hamalainen MD. 2000. SPR biosensor studies of the direct interaction between 27 drugs and a
liposome surface: correlation with fraction absorbed in humans. Journal of Medicinal Chemistry
43: 2083 - 2086.
(48) Adamczyk M, Moore JA and Yu Z. 2000. Application of surface plasmon resonance
towards studies of low-molecular-weight antigen-antibody binding interactions. Methods 20: 319
- 328.

46
(49) Myszka D and Rich R. 2000. Implementing surface plasmon resonance biosensors in drug
discovery. Pharmaceutical Science & Technology Today 3: 310 - 317.
(50) James W. 2000. In: Aptamers. Encyclopaedia of analytical chemistry. Mayers RA (ed.), p.
4848 – 4871.
(51) O’Sullivan CK. 2002. Aptasensors – the future of biosensing? Anal Bioanal Chem 372: 44 –
48.
(52) Jayasena SD. 1999. Aptamers: An emerging class of molecules that rival antibodies in
diagnostics. Clinical Chemistry 45(9): 1628 - 1650.
(53) Sampson T. 2003. Aptamers and SELEX: the technology. World Patent Information 25: 123
- 129.
(54) Luzi E, Minunni M, Tombelli S and Mascini M. 2003. New trends in affinity sensing:
Aptamers for ligand binding. Trends in Analytical Chemistry 22(11): 810 – 818.
(55) Robertson DL & Joyce GF. 1990. Selection in vitro of an RNA enzyme that specifically
cleaves single-stranded DNA. Nature 344 (6265): 467-468.
(56) Ellington AD & Szostak JW. 1990. In vitro selection of RNA molecules that bind specific
ligands. Nature 346: 818-822.

47
(57) Tuerk C & Gold L. 1990. Systematic evolution of ligands by exponential enrichment: RNA
ligands to bacteriophage T4 DNA polymerase. Science 249: 505-510.
(58) Pieken et al. 1997. High affinity nucleic acid ligand containing modified nucleotides. US
patent No 5,660,985.
(59) Cox JC, Rudolph P and Ellington AD. 1998. Automated RNA Selection. Biotechnol. Prog.
14: 845 - 850.
(60) Cox JC & Ellington AD. 2001. Automated selection of anti-protein aptamers. Bioorganic &
Medical Chemistry 9: 2525 – 2531.
(61) Drolet DW, Moon-McDermott L and Romig TS. 1996. An enzyme-linked oligonucleotide
assay. Nat Biotechnol 14 (8): 1021-1025.
(62) Davis KA, Lin Y, Abrams B and Jayasena SD. 1998. Staining of cell surface human CD4
with 2'-F-pyrimidine-containing RNA aptamers for flow cytometry. Nucleic Acids Res 26 (17):
3915 - 3924.
(63) Kleinjung F, Klussmann S, Erdmann VA, Scheller FW, Fürste JP and Bier FF. 1998. High-
Affinity RNA as a Recognition Element in a Biosensor. Anaytical Chemistry 70 (2): 328 – 331.
(64) Potyrailo RA, Conrad RC, Ellington AD and Hieftje GM. 1998. Adapting selected nucleic
acid ligands (aptamers) to biosensors. Analytical Chemistry 70: 3419 – 3425.

48
(65) German I, Buchanan DD and Kennedy RT. 1998. Aptamers as Ligands in Affinity Probe
Capillary Electrophoresis. Analytical Chemistry 70 (21): 4540 – 4545.
(66) Vaish NK, Dong F, Andrews L, Schweppe RE, Ahn NG, Blatt L and Seiwert SD. 2002
Monitoring post-translational modification of proteins with allosteric ribozymes. Nature
Biotechnology 20 (8):810 – 815.
(67) Seetharaman S, Zivarts M, Sudarsan N and Breaker R. 2001. Immobilized RNA switches for
the analysis of complex chemical and biological mixtures. Nature Biotechnology 19 (4):336 –
341.
(68) Katsamba PS, Park S and Laird-Offringa IA. 2002. Kinetic studies of RNA-protein
interactions using surface plasmon resonance. Methods 26: 95 – 104.
Figure 1
Agbinding
site
VariableRegion
ConstantRegion
S S
S S
LightChains
HeavyChains

49
Figure 2
Figure 3
YY Y
Y
Antigen/allergen
Antigenpresenting cell
T-helpercell
B cell
Plasma cell IgE
Mast cell
Mediatorrelease
T cellreceptor
IL-4IL-13
IL-4, IL-5, IL-6
FcεRI receptor
Antigen/allergen
YYY
Cε1
Cε2
Cε3Binding site
for FcεRI
Cε4

50
Ag
Ag
A Ag
Ag
AgEnz
Enz
(B) Indirect competitiveimmunoassay
Detection
Ag
Ag
Ag
Enz
Enz
Enz
Enz
Detection
(C) Sandwich Immunoassay
S
P
(A) Direct competitive immunoassayIncubation
Washing
Affinity Reaction
EnzAg
AgAg
Ag
AgAg
Ag
EnzAg
EnzAg
EnzAg
EnzAg

51
Figure 4
Figure 5
np kb sinφ
kb
ksp
Metal Film (nm)
Glass Prism (np)
φ
I
I
d
Ag
Antibody Antigen
EnzAg
Enzyme-labelledantigen
Enz
Enzyme-labelledantibody

52
Figure 6
Random Sequence
5’ Constant 3’ Constant
DNA Library
Transcription5 3’
RNA Library
FoldedAptamers
Target
Mixing
Partition
Discard Enrich
5 3
53
5 3
3 5
PCR
ReverseTranscription
Step 1
Step 2
Step 3
Step 4
Step 5
Step 6
Step 7 (10-12 x)
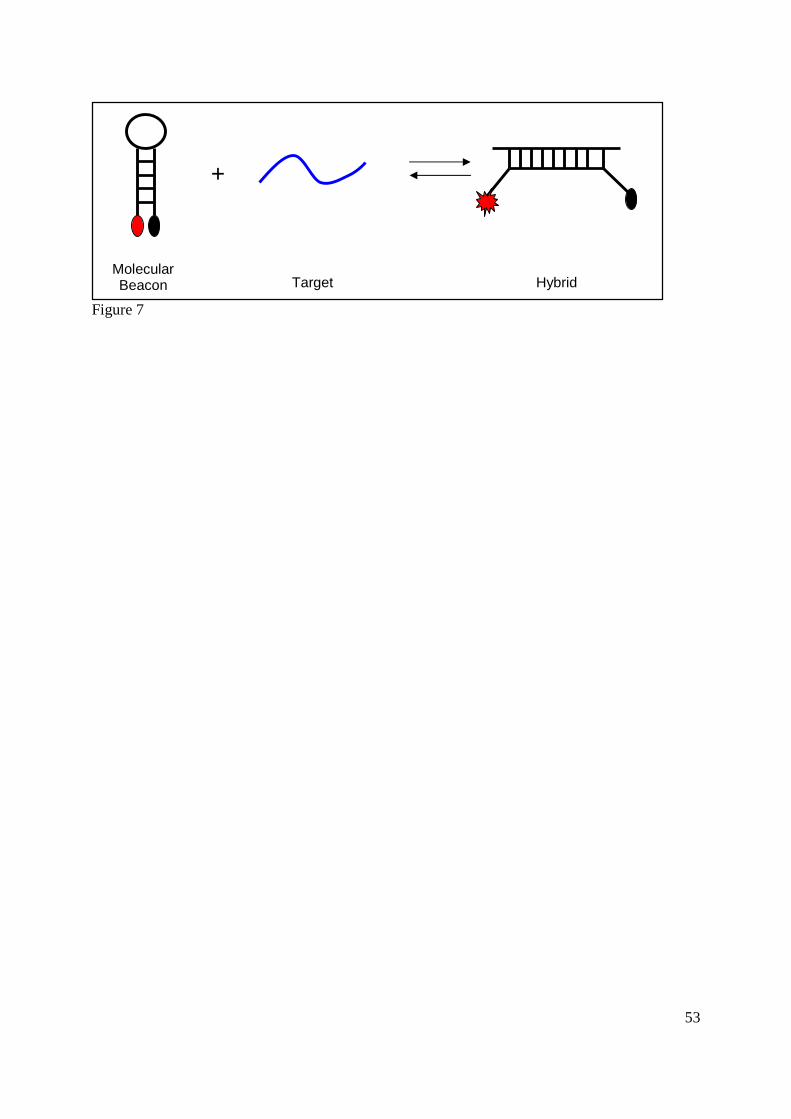
53
Figure 7
+
MolecularBeacon Target Hybrid

54
Figure 8
LigandBeacon
+
Aptamer Fluorescence
(A)
+
LigandBeacon
NoFluorescence
+
Target
Aptamer-Target
complex
(B)

55
Figure 9
Regeneration
Dissociation
I II
Intensity
Angle
RU
Association
Time
(A)
(B)

56
Figure 10Figures
Figure 1 General structure of an immunoglobulin.
Figure 2 Structure of IgE (modified from 7). Note the various domains of the antibody.
Figure 3 The allergic cascade (modified from 7).
Figure 4 Immunosensor formats (modified from 20). (A) Direct competitive immunoassay. (B)
Indirect competitive immunoassay. (C) Sandwich immunoassay.
Figure 5 Kretschmann configuration for SPR. See text for details.
Figure 6 The SELEX Protocol (modified from 53) (see text for details).
Figure 7 Functioning of a molecular beacon.
R2 = 0.9778
0
100
200
300
400
500
600
0 10 20 30 40 50 60
Concentration (ppm)
RU
Calibration curve in the association phase (Biacore)

57
Figure 8 Functioning of a ligand beacon. (A) In the absence of the target analyte, a fluorescent
signal is produced. (B) In the presence of the target analyte, no fluorescent signal is produced.
Figure 9 Sensogram from a typical SPR experiment (modified from 68). (A) Decrease in
intensity of reflected light at resonance angles. (B) The shift in resonance angle (from position I
to position II) is due to the binding of the analyte at the sensor surface.
Figure 10 Calibration curve in the association phase (Biacore). This curve was constructed for
IgE binding in the association phase at concentrations from 5ppm to 50ppm. Standard deviations
were calculated based on three samples at 5ppm, three at 10ppm and four at 20ppm, giving a
CVave of 22%. Binding experiments at higher concentrations were only carried out once in order
to conserve reagents.
Tables
Table 1 SPR biosensor applications (modified from 43).
Table 2 Advantages of aptamers over antibodies (modified from 51).
Table 1Qualitative Quantitative
Following molecular purification Active concentration
Specificity Kinetics
Epitope mapping Equilibrium constants
Molecular assembly Thermodynamics

58
Ligand fishing Stoichiometry
Small molecule screening Mechanism
Table 2Antibodies Aptamers
Requires the use of animals No animals required
Limitations against non-immunogenic and
toxic substances
Can be generated against non-immunogenic
and toxic substances
Kinetic parameters cannot be modified on Kinetic parameters can be modified on demand

59
demand
Labelling can cause loss of affinityVariety of reporter molecules can be attached
without affecting binding properties
Not feasible to identify antibodies that interact
with targets under non-physiological conditions
Selection conditions can be modified to select
aptamers with particular properties
Problems with batch to batch variation Little or no batch to batch variation
Limited shelf-life, temperature sensitive &
susceptible to denaturation
Stable in long-term storage, can be transported
at ambient temperature & can be regenerated
after denaturation

60

61
Future Perspectives

62
Anthony P F Turner
Cranfield University, Silsoe, Bedfordshire MK45 4DT, UKEmail [email protected] www.silsoe.cranfield.ac.uk
Biosensors comprise a biological or biologically derived sensing element intimately associatedwith or integrated within a physicochemical transducer. Over 1,500 papers are published eachyear describing the various permutations of sensing element and transducer [2]. These areapplied mainly in medical diagnostics [3], environmental diagnostics [4], in the food industry [5]and for crime prevention and security [6]. The most significant impact of biosensors to date hasbeen in the field of diabetes, where mediated amperometric biosensors account for over $4 billionin sales. Until now, however, no device has come close to delivering a truly one-step procedure.In the immediate future we can expect to see new technology to deliver this objective. Thedevelopment of suitably robust biosensors for many situations outside of glucose monitoring, hasbeen hindered by several problems associated with the properties of biological material. Thesearch for possible solutions to these problems has led to the development of biomimetic systemssuch as the electronic nose, which shows excellent practical potential for the detection of diseaseand infections [7]. An alternative approach has been to seek synthetic analogues of naturalreceptors and antibodies using supramolecular systems. If nature can produce nanomaterials withrecognition and functional properties by evolution, molecular engineers should be able toaccomplish comparable, but broader capabilities by design, guided by examples from livingsystems. One of the most promising areas of biomimetics is Molecularly Imprinted Polymers(MIPs) [8]. A key element here is the need for rational design [9]. The ability to constructhighly stable sensing structures which are either small enough to be implanted in the body,distributed widely in the environment, configured as high density arrays or coupled to moderninformation systems, offers exciting new horizons in the information revolution by furnishing ourinformation and telecommunication systems with sophisticated “senses”.
1. Turner, A.P.F. (2000). Biosensors – Sense and Sensitivity. Science 290 (5495), 1315-1317.
2. Newman, J.D., Tigwell, L.T., Turner, A.P.F. and Warner, P.J. (2004). Biosensors – AClearer View, Cranfield University.
3. Newman, J and Turner, APF (2004). Biosensors for monitoring glucose. Sensors inMedicine and Health Care (Sensors Applications) 3, Eds: Öberg, P. Å.,Togawa, T. andSpelman, F. A. Wiley-VCH. ISBN: 3527295569.
4. Bilitewski, U. and Turner, A.P.F. (2000). Biosensors for Environmental Monitoring.Harwood Academic publishers. 1-409pp. ISBN 90 5702 449 7.
5. Tothill, I and Turner, A.P.F (2003). Biosensors. Encyclopaedia of Food Sciences andNutrition (2nd Edition), (Editor in Chief: Benjamin Caballero; Eds. Luiz Trugo and PaulFinglas), Academic Press. pp 489-499. ISBN: 0-12-227055-X.
6. Turner, A.P.F. and Piletsky, S. (2005). Biosensors and Biomimetic Sensors for the Detectionof Drugs, Toxins and Biological Agents. In: Defense Against Bioterror - DetectionTechnologies, Implementation Strategies and Commercial Opportunities. (Ed DennisMorrison) Kluwer Academic, The Netherlands. (in press).

63
7. Turner, A.P.F and Magan, N (2004). Electronic noses and disease diagnostics. NatureMicrobiology Reviews 2, 161-166.
8. Piletsky, S. and Turner, A.P.F. (2004). Molecular Imprinting, Landes Bioscience,Georgetown, TX, USA . www.landesbioscience.com/iu/output.php?id=358
9. Chianella, I., Lotierzo M, Piletsky, S.A., Tothill, I., Chen, B., Karim, K., Turner, A.P..F(2002). Rational design of the polymer specific for microcystin-LR using a computationalapproach. Analytical Chemistry 74, 1288-1293.