Embed Size (px)
Citation preview

Approved Feb 2016
Algebra 3 Unit 1: Systems and Matrices
Pacing: 6 weeks A/B Block Schedule
Mathematical Practices Mathematical Practices #1 and #3 describe a classroom environment that encourages thinking mathematically and are critical for quality teaching and learning. Practices in bold are to be emphasized in the unit. 1. Make sense of problems and persevere in solving them. 2. Reason abstractly and quantitatively. 3. Construct viable arguments and critique the reasoning of others. 4. Model with mathematics. 5. Use appropriate tools strategically. 6. Attend to precision. 7. Look for and make use of structure. 8. Look for and express regularity in repeated reasoning.
Standards Overview
Graph and solve systems of equations using a variety of function families: linear, quadratic, absolute value, and square root functions. Solve systems of two and three using matrices. Use systems and matrices to solve real world problems.

Approved Feb 2016
Algebra 3 Unit 1: Systems and Matrices
Priority and Supporting CCSS Explanations and Examples*
A-CED 3. Represent constraints by equations or inequalities, and by systems of equations and/or inequalities, and interpret solutions as viable or nonviable options in a modeling context...
Example: Given two sets of data that can be modeled with linear functions, find the intersection of the two trend lines, if it exists, and interpret the solution. For instance, if these trends continue, when will the women catch the men and what percentage of women will be earning $50,000 - $74,999?
Number of
years since 2000
% of men
earning
$50,000 - $74,999
% of women
earning
$50,000 - $74,999
3 20.2 13.3
4 20.5 14.2
5 20.7 15.1
A-REI 5. Prove that, given a system of two equations in two variables, replacing one equation by the sum of that equation and a multiple of the other produces a system with the same solutions.
Example: Given that the sum of two numbers is 10 and their difference is 4, what are the numbers? Explain how your answer can be deduced from the fact that they two numbers, x and y, satisfy the equations x + y = 10 and x – y = 4.
Approved Feb 2016
Algebra 3 Unit 1: Systems and Matrices
Priority and Supporting CCSS Explanations and Examples*
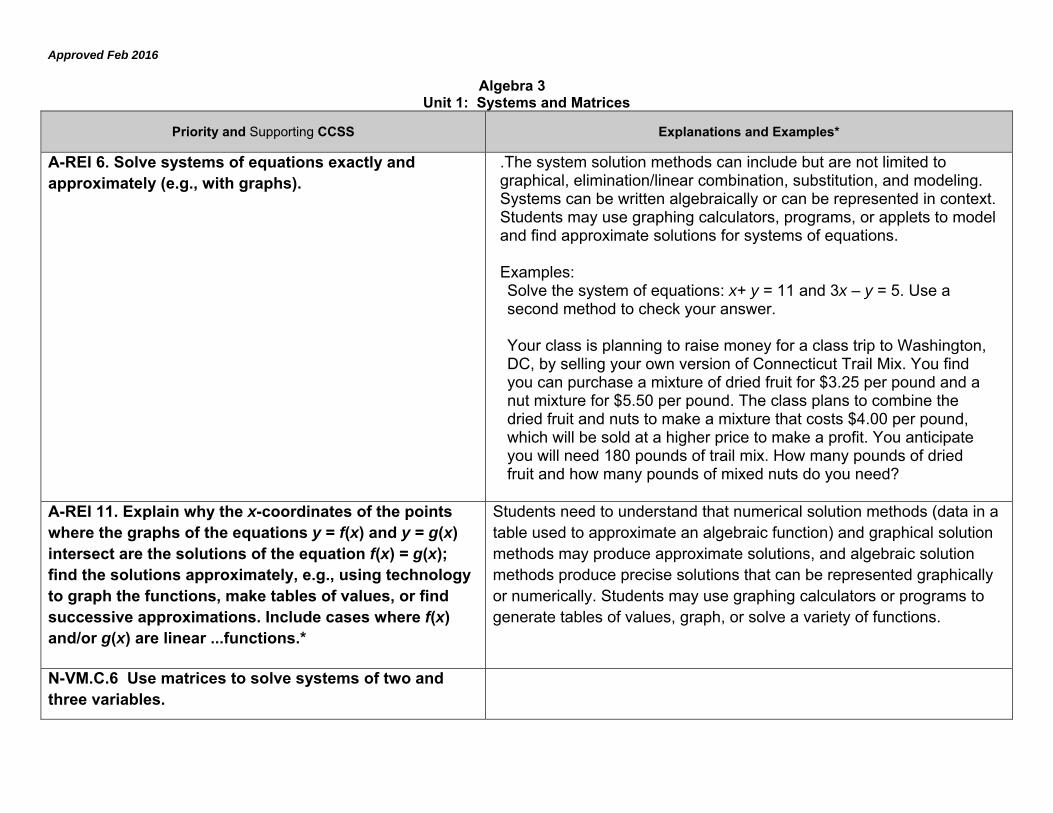
A-REI 6. Solve systems of equations exactly and approximately (e.g., with graphs).
.The system solution methods can include but are not limited to graphical, elimination/linear combination, substitution, and modeling. Systems can be written algebraically or can be represented in context. Students may use graphing calculators, programs, or applets to model and find approximate solutions for systems of equations. Examples: Solve the system of equations: x+ y = 11 and 3x – y = 5. Use a second method to check your answer. Your class is planning to raise money for a class trip to Washington, DC, by selling your own version of Connecticut Trail Mix. You find you can purchase a mixture of dried fruit for $3.25 per pound and a nut mixture for $5.50 per pound. The class plans to combine the dried fruit and nuts to make a mixture that costs $4.00 per pound, which will be sold at a higher price to make a profit. You anticipate you will need 180 pounds of trail mix. How many pounds of dried fruit and how many pounds of mixed nuts do you need?
A-REI 11. Explain why the x-coordinates of the points where the graphs of the equations y = f(x) and y = g(x) intersect are the solutions of the equation f(x) = g(x); find the solutions approximately, e.g., using technology to graph the functions, make tables of values, or find successive approximations. Include cases where f(x) and/or g(x) are linear ...functions.*
Students need to understand that numerical solution methods (data in a table used to approximate an algebraic function) and graphical solution methods may produce approximate solutions, and algebraic solution methods produce precise solutions that can be represented graphically or numerically. Students may use graphing calculators or programs to generate tables of values, graph, or solve a variety of functions.
N-VM.C.6 Use matrices to solve systems of two and three variables.

Approved Feb 2016
Algebra 3 Unit 1: Systems and Matrices
Concepts What Students Need to Know
Skills What Students Need To Be Able To Do
Bloom’s Taxonomy Levels
Systems of equations (2 variable) Solution to a system of equations Graphing method Substitution method Systems of equations (3 variable) Matrices Graphing Calculator features
Solve (systems using graphs) Solve (systems using algebraic
methods) Interpret (solutions) Solve Write and solve Use
3 3
2 3 3 2
Essential Questions
What does the number of solutions (none, one or infinite) of a system of equations represent?
What are the advantages and disadvantages of solving a system of equations graphically versus algebraically?
Corresponding Big Ideas A system of equations is an algebraic way to compare two or more functions that model a situation. Matrices can be used to facilitate the solving of systems involving two- and three-variables.

Approved Feb 2016
Algebra 3 Unit 1: Systems and Matrices
Standardized Assessment Correlations
(State, College and Career) CollegeBoard PSAT and SAT
Vocabulary
System of equations, intersection, no solution, infinitely many solutions, substitution method, graphing method, standard form, coefficients, augmented matrix (matrices), dimensions, rows, columns
Learning Activities
Topic CCSS Systems of Equations
Find exact solution(s) by substitution method Find approximate solution using graphing Explain why the x coordinate of the point of intersection is the
solution to the equation f(x)=g(x) Interpret solutions of systems (one solution, no solutions,
infinitely many solutions) Write and solve systems of equations to model real world
situations Set up and solve matrices of 2 Set up and solve systems of 3 by elimination and substitution
methods
Text:
College Algebra
p. 486
Algebra 2
p. 225, 241
CC.9-12.A.CED.3
CC.9-12.A.REI.6
CC.9-12.A.REI.5
CC9.12.A.REI.11
CC9.12.N.VMC.6

Approved Feb 2016
Algebra 3 Unit 1: Systems and Matrices
Set up and solve matrices of 3 Use graphing calculator to solve matrices of 2 and 3
p. 181
Unit Assessments Section quizzes, End-of-Unit Test
Application
Approved Feb 2016
Algebra 3 Unit 1: Systems and Matrices
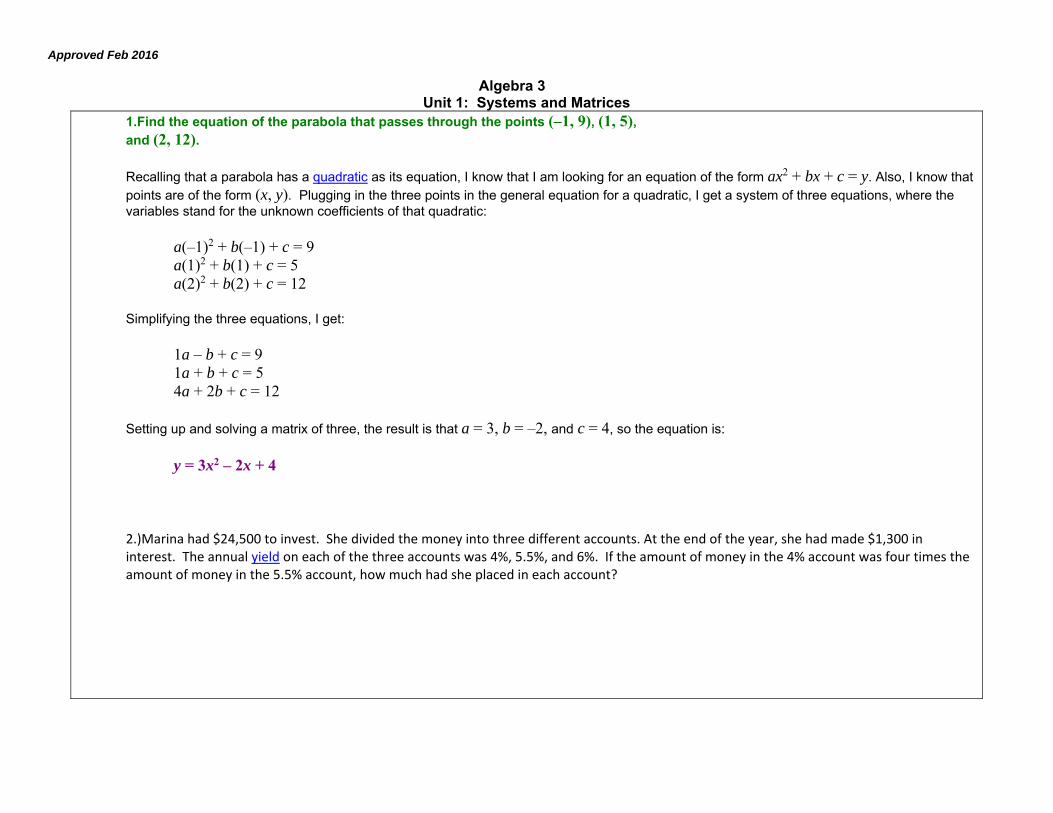
1.Find the equation of the parabola that passes through the points (–1, 9), (1, 5), and (2, 12).
Recalling that a parabola has a quadratic as its equation, I know that I am looking for an equation of the form ax2 + bx + c = y. Also, I know that points are of the form (x, y). Plugging in the three points in the general equation for a quadratic, I get a system of three equations, where the variables stand for the unknown coefficients of that quadratic:
a(–1)2 + b(–1) + c = 9 a(1)2 + b(1) + c = 5 a(2)2 + b(2) + c = 12
Simplifying the three equations, I get:
1a – b + c = 9 1a + b + c = 5 4a + 2b + c = 12
Setting up and solving a matrix of three, the result is that a = 3, b = –2, and c = 4, so the equation is:
y = 3x2 – 2x + 4
2.)Marina had $24,500 to invest. She divided the money into three different accounts. At the end of the year, she had made $1,300 in interest. The annual yield on each of the three accounts was 4%, 5.5%, and 6%. If the amount of money in the 4% account was four times the amount of money in the 5.5% account, how much had she placed in each account?

Approved Feb 2016
Algebra 3 Unit 1: Systems and Matrices
3.) The currents running through an electrical system are given by the following system of equations. The three currents, I1, I2, and I3, are measured in amps. Solve the system to find the currents in this circuit. I1 + 2I2 - I3 = 0.425 3I1 - I2 + 2I3 = 2.225 5I1 + I2 + 2I3 = 3.775
4.) In the position function for vertical height, s(t) = ½at2 + v0t + s0, s(t)represents height in meters and t represents time in seconds. (a) Find the position function for a volleyball served at an initial height of one meter, with height of 6.275 meters ½ second after serve, and height of 9.1 meters one second after serve. (b) How long until the ball hits the ground on the other side of the net if everyone on that team completely misses it?
Approved Feb 2016
Algebra 3 Unit 2: Polynomial and Inverse Functions
Pacing: 6 weeks A/B Block Schedule
Mathematical Practices
Mathematical Practices #1 and #3 describe a classroom environment that encourages thinking mathematically and are critical for quality teaching and learning. Practices in bold are to be emphasized in the unit. 1. Make sense of problems and persevere in solving them. 2. Reason abstractly and quantitatively. 3. Construct viable arguments and critique the reasoning of others. 4. Model with mathematics. 5. Use appropriate tools strategically. 6. Attend to precision. 7. Look for and make use of structure. 8. Look for and express regularity in repeated reasoning.
Standards Overview
Analyze functions using features of their equations and their parent graphs. Use technology to verify and interpret the key features of a function’s graph.

Approved Feb 2016
Algebra 3 Unit 2: Polynomial and Inverse Functions
CC.9-12.N.CN.7 Solve quadratic equations with real coefficients that have complex solutions.
Examples:
● Within which number system can x 2= – 2 be solved? Explain how you know.
● Solve x2+ 2x + 2 = 0 over the complex numbers.
● Find all solutions of 2x2 + 5 = 2x and express them in the form a + bi.
CC.9-12.N.CN.1 Know there is a complex number i such that i2 = √-1, and every complex number has the form a + bi with a and b real.
CC.9-12.N.CN.8 (+) Extend polynomial identities to the complex numbers. For example, rewrite x2 + 4 as (x + 2i)(x - 2i).
CC.9-12.N.CN.9 (+) Know the Fundamental Theorem of Algebra; show that it is true for quadratic polynomials
Examples:
● How many zeros does -2x2 + 3x – 8 have? Find all the zeros and explain, orally or in written format, your answer in terms of the Fundamental Theorem of Algebra.
● How many complex zeros does the following polynomial have? How do you know?
p(x) = (x2 -3) (x2 +2)(x - 3)(2x – 1)

Approved Feb 2016
Algebra 3 Unit 2: Polynomial and Inverse Functions
CC.9-12.A.REI.4b Solve quadratic equations by inspection (e.g., for x2 = 49), taking square roots, completing the square, the quadratic formula and factoring, as appropriate to the initial form of the equation. Recognize when the quadratic formula gives complex solutions and write them as a ± bi for real numbers a and b
Students should solve by factoring, completing the square, and using the quadratic formula. The zero product property is used to explain why the factors are set equal to zero. Students should relate the value of the discriminant to the type of root to expect. A natural extension would be to relate the type of solutions to ax2 + bx + c = 0 to the behavior of the graph of y = ax2 + bx + c .
Value of Discriminant Nature of Roots Nature of Graph
b2 – 4ac = 0 1 real roots intersects x-axis once
b2 – 4ac > 0 2 real roots intersects x-axis twice
b2 – 4ac < 0 2 complex roots does not intersect x-axis
● Are the roots of 2x2 + 5 = 2x real or complex? How many roots does it have? Find all solutions of the equation.
● What is the nature of the roots of x2 + 6x + 10 = 0? Solve the equation using the quadratic formula and completing the square. How are the two methods related?
CC.9-12.A.CED.1 Create equations in one variable and use them to solve problems. Include equations arising from linear and quadratic functions, and simple rational and exponential functions.
Equations can represent real world and mathematical problems. Include equations and inequalities that arise when comparing the values of two different functions, such as one describing linear growth and one describing exponential growth.

Approved Feb 2016
Algebra 3 Unit 2: Polynomial and Inverse Functions
Examples:
Given that the following trapezoid has area 54 cm2, set up an equation to find the length of the base, and solve the equation.
Lava coming from the eruption of a volcano follows a parabolic path. The height h in feet of a piece of lava t seconds after it is ejected from the volcano is given by h(t)= -t2 + 16t + 936. After how many seconds does the lava reach its maximum height of 1000 feet?
CC.9-12.A.CED.2 Create equations in two or more variables to represent relationships between quantities; graph equations on coordinate axes with labels and scales.
CC.9-12.A.REI.4 Solve quadratic equations in one variable Students should solve by factoring, completing the square, and using the quadratic formula. The zero product property is used to explain why the factors are set equal to zero. Students should relate the value of the discriminant to the type of root to expect. A natural extension would be to relate the type of solutions to ax2 + bx + c = 0 to the behavior of the graph of y = ax2 + bx + c . Value of Discriminant Nature of Roots Nature of Graph
b2 – 4ac = 0 1 real roots intersects x-axis once
b2 – 4ac > 0 2 real roots intersects x-axis twice

Approved Feb 2016
Algebra 3 Unit 2: Polynomial and Inverse Functions
b2 – 4ac < 0 2 complex roots does not intersect x-axis
● Are the roots of 2x2 + 5 = 2x real or complex? How many roots does it have? Find all solutions of the equation.
● What is the nature of the roots of x2 + 6x + 10 = 0? Solve the equation using the quadratic formula and completing the square. How are the two methods related?
CC.9-12.F.IF.7 Graph functions expressed symbolically and show key features of the graph, by hand in simple cases and using technology for more complicated cases.*
Key characteristics include but are not limited to maxima, minima, intercepts, symmetry, end behavior, and asymptotes. Students may use graphing calculators or programs, spreadsheets, or computer algebra systems to graph functions.
continued on next page

Approved Feb 2016
Algebra 3 Unit 2: Polynomial and Inverse Functions
CC.9-12.F.IF.7c Graph polynomial functions, identifying zeros when suitable factorizations are available, and showing end behavior
Students should extract the greatest common factor (whether a constant, a variable, or a combination of each). If the remaining expression is quadratic, students should factor the expression further.
Example: Factor x3 – 2x2 – 35x
Approved Feb 2016
Algebra 3 Unit 2: Polynomial and Inverse Functions
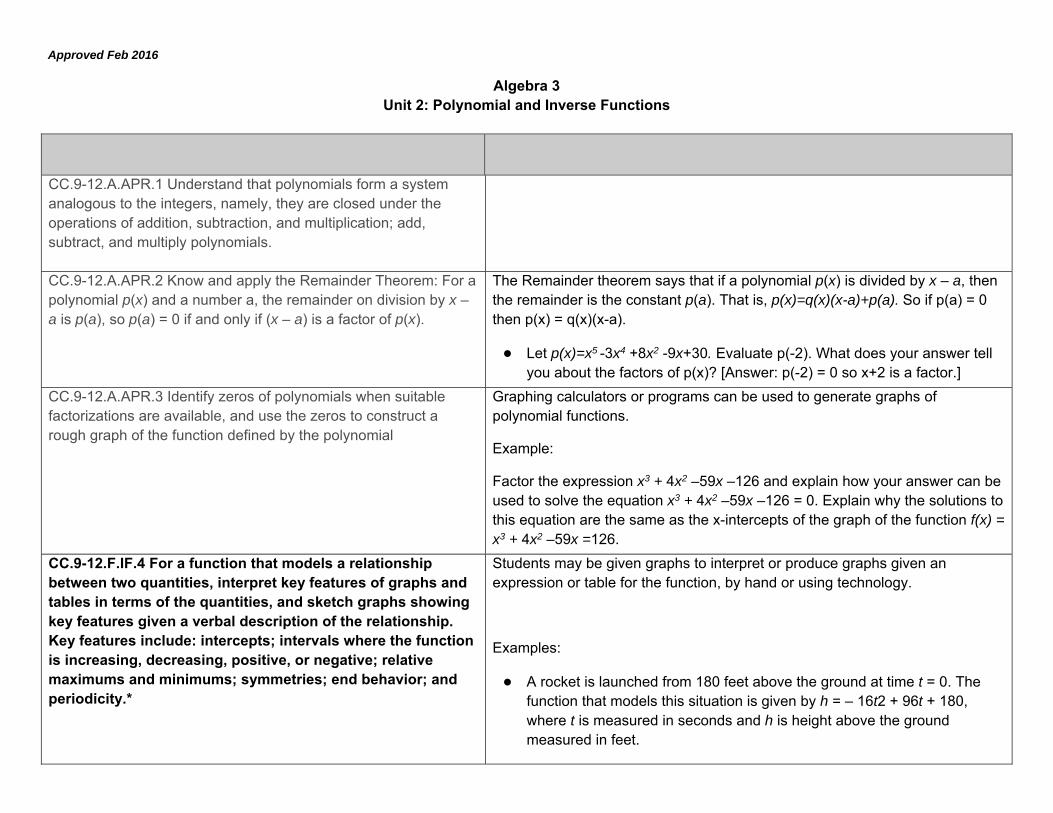
CC.9-12.A.APR.1 Understand that polynomials form a system analogous to the integers, namely, they are closed under the operations of addition, subtraction, and multiplication; add, subtract, and multiply polynomials.
CC.9-12.A.APR.2 Know and apply the Remainder Theorem: For a polynomial p(x) and a number a, the remainder on division by x – a is p(a), so p(a) = 0 if and only if (x – a) is a factor of p(x).
The Remainder theorem says that if a polynomial p(x) is divided by x – a, then the remainder is the constant p(a). That is, p(x)=q(x)(x-a)+p(a). So if p(a) = 0 then p(x) = q(x)(x-a).
● Let p(x)=x5 -3x4 +8x2 -9x+30. Evaluate p(-2). What does your answer tell you about the factors of p(x)? [Answer: p(-2) = 0 so x+2 is a factor.]
CC.9-12.A.APR.3 Identify zeros of polynomials when suitable factorizations are available, and use the zeros to construct a rough graph of the function defined by the polynomial
Graphing calculators or programs can be used to generate graphs of polynomial functions.
Example:
Factor the expression x3 + 4x2 –59x –126 and explain how your answer can be used to solve the equation x3 + 4x2 –59x –126 = 0. Explain why the solutions to this equation are the same as the x-intercepts of the graph of the function f(x) = x3 + 4x2 –59x =126.
CC.9-12.F.IF.4 For a function that models a relationship between two quantities, interpret key features of graphs and tables in terms of the quantities, and sketch graphs showing key features given a verbal description of the relationship. Key features include: intercepts; intervals where the function is increasing, decreasing, positive, or negative; relative maximums and minimums; symmetries; end behavior; and periodicity.*
Students may be given graphs to interpret or produce graphs given an expression or table for the function, by hand or using technology.
Examples:
● A rocket is launched from 180 feet above the ground at time t = 0. The function that models this situation is given by h = – 16t2 + 96t + 180, where t is measured in seconds and h is height above the ground measured in feet.

Approved Feb 2016
Algebra 3 Unit 2: Polynomial and Inverse Functions
o What is a reasonable domain restriction for t in this context?
o Determine the height of the rocket two seconds after it was launched.
o Determine the maximum height obtained by the rocket.
o Determine the time when the rocket is 100 feet above the ground.
o Determine the time at which the rocket hits the ground.
o How would you refine your answer to the first question based on your response to the second and fifth questions?
● Compare the graphs of y = 3x2 and y = 3x3.
● Find the domain of R(x). Also find the range, zeros,
and asymptotes of R(x).
● Let f(x) = 5x3 – x2 – 5x + 1. Graph the function and identify end behavior and any intervals of constancy, increase, and decrease.
● It started raining lightly at 5am, then the rainfall became heavier at 7am. By 10am the storm was over, with a total rainfall of 3 inches. It didn’t rain for the rest of the day. Sketch a possible graph for the number of inches of rain as a function of time, from midnight to midday.

Approved Feb 2016
Algebra 3 Unit 2: Polynomial and Inverse Functions
CC.9-12.F.BF.4b (+) Verify by composition that one function is the inverse of another.
CC.9-12.F.BF.1c (+) Compose functions. For example, if T(y) is the temperature in the atmosphere as a function of height, and h(t) is the height of a weather balloon as a function of time, then T(h(t)) is the temperature at the location of the weather balloon as a function of time.
Students may use graphing calculators or programs, spreadsheets, or computer algebra systems to model functions.
Examples:
● For the function h(x) = (x – 2)3, defined on the domain of all real numbers, find the inverse function if it exists or explain why it doesn’t exist.
● Graph h(x) and h-1(x) and explain how they relate to each other graphically.
Find a domain for f(x) = 3x2 + 12x - 8 on which it has an inverse. Explain why it is necessary to restrict the domain of the function.
CC.9-12.F.BF.4c (+) Read values of an inverse function from a graph or a table, given that the function has an inverse.
CC.9-12.F.BF.4d (+) Produce an invertible function from a non-invertible function by restricting the domain.
Approved Feb 2016
Algebra 3 Unit 2: Polynomial and Inverse Functions
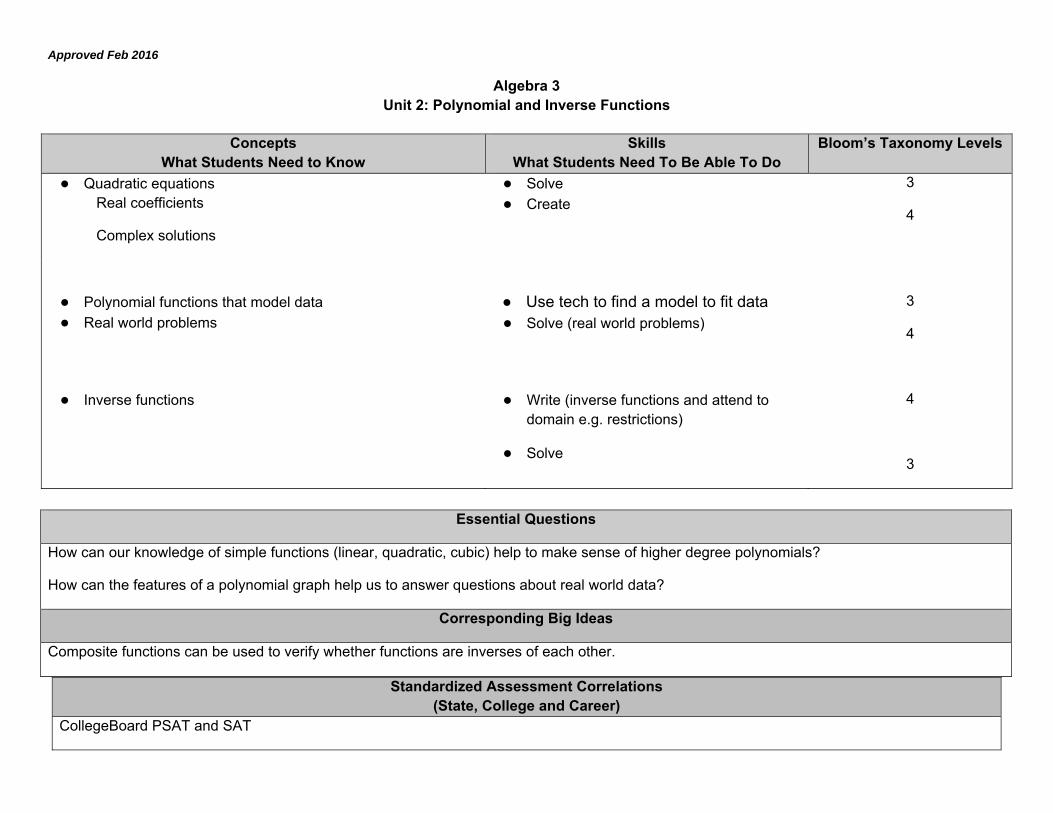
Concepts
What Students Need to Know Skills
What Students Need To Be Able To Do Bloom’s Taxonomy Levels
● Quadratic equations Real coefficients
Complex solutions
● Solve ● Create
3
4
● Polynomial functions that model data ● Real world problems
● Use tech to find a model to fit data ● Solve (real world problems)
3
4
● Inverse functions
● Write (inverse functions and attend to domain e.g. restrictions)
● Solve
4
3
Standardized Assessment Correlations (State, College and Career)
CollegeBoard PSAT and SAT
Essential Questions
How can our knowledge of simple functions (linear, quadratic, cubic) help to make sense of higher degree polynomials?
How can the features of a polynomial graph help us to answer questions about real world data?
Corresponding Big Ideas
Composite functions can be used to verify whether functions are inverses of each other.
Approved Feb 2016
Algebra 3 Unit 2: Polynomial and Inverse Functions
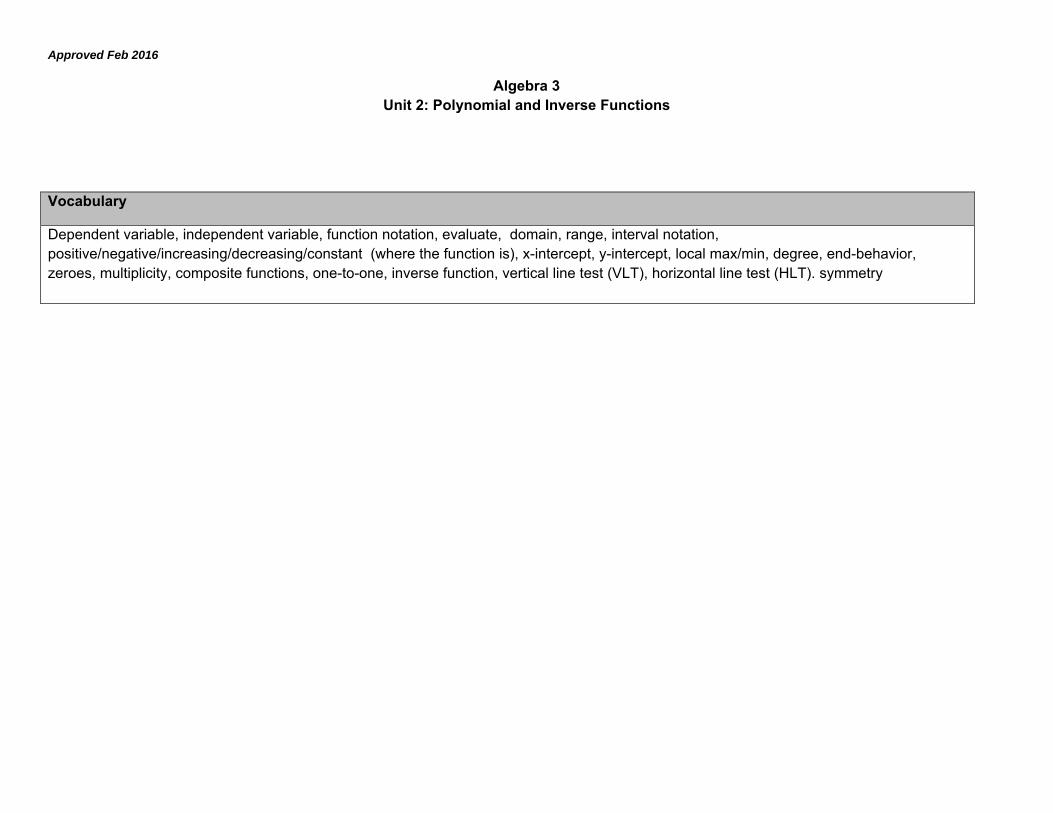
Vocabulary
Dependent variable, independent variable, function notation, evaluate, domain, range, interval notation, positive/negative/increasing/decreasing/constant (where the function is), x-intercept, y-intercept, local max/min, degree, end-behavior, zeroes, multiplicity, composite functions, one-to-one, inverse function, vertical line test (VLT), horizontal line test (HLT). symmetry

Approved Feb 2016
Algebra 3 Unit 2: Polynomial and Inverse Functions
Learning Activities
Topic Source(s) CCSS
Information from or about the graph of a function
Properties of Functions
Graphically Algebraically
Polynomial Models
Link knowledge of quadratics and cubic functions to higher degree polynomials using end-behaviors, real zeroes, and multiplicity.
Build models from data using the graphing calculator.
Composite Functions ( ( ) ( )( )f g x f g x
Evaluate (table, graph, explicit rules) Find a composite function and its domain Show that two composites are equal Find components of a composite
PC Text 2.2
Section 2.3
Section 4.1
Section 5.1
CC.9-12.F.IF.4
CC.9-12.F.IF.4
CC.9-12.F.IF.7
CC.9-12.F.BF.1c (+)
CC.9-12.F.BF.4b (+)
Approved Feb 2016
Algebra 3 Unit 2: Polynomial and Inverse Functions
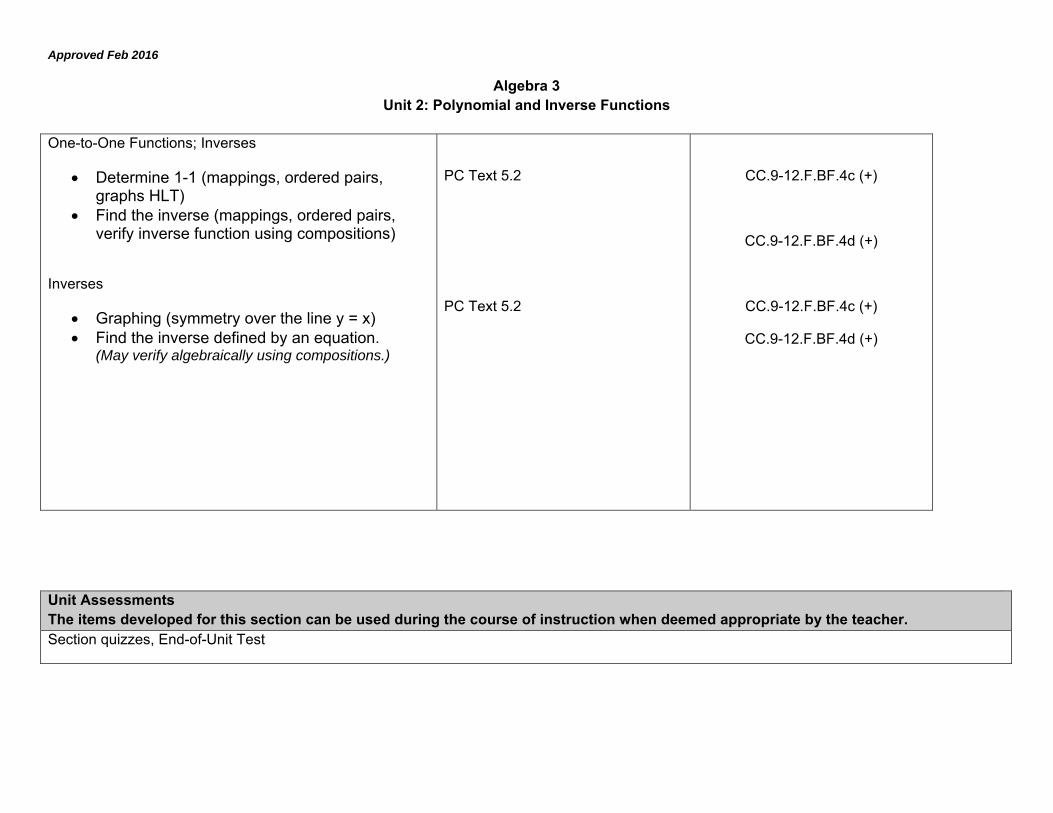
One-to-One Functions; Inverses
Determine 1-1 (mappings, ordered pairs, graphs HLT)
Find the inverse (mappings, ordered pairs, verify inverse function using compositions)
Inverses
Graphing (symmetry over the line y = x) Find the inverse defined by an equation.
(May verify algebraically using compositions.)
PC Text 5.2
PC Text 5.2
CC.9-12.F.BF.4c (+)
CC.9-12.F.BF.4d (+)
CC.9-12.F.BF.4c (+)
CC.9-12.F.BF.4d (+)
Unit Assessments The items developed for this section can be used during the course of instruction when deemed appropriate by the teacher. Section quizzes, End-of-Unit Test

Approved Feb 2016
Algebra 3 Unit 2: Polynomial and Inverse Functions
Application
The following data represents the percentage of families in the United States whose income is below the poverty level.
Year t = 1 for 1990 Percent below Poverty Level, P1990 0 10.91991 1 11.51992 2 11.91993 3 12.31994 4 11.61995 5 10.81996 6 11.01997 7 10.31998 8 10.01999 9 9.32000 10 8.72001 11 9.22002 12 9.62003 13 10.02004 14 10.2
1. With a graphing calculator, draw a scatter plot of the data. 2. Using the scatter plot, what is the minimum degree of a polynomial that might model this data? Explain how you know this. 3. Find the polynomial function that models the data. Round all coefficients to the nearest ten‐thousands and write the equation below, use function notation, P(t).
4. On your calculator graph the function and the data together. The function model shows a range of , . Is this reasonable expectation of the data? Explain.
5. Using your function model, find P(23). Explain the meaning of your answer in context to the application. Does this seem reasonable? 6. Find the regression function one degree higher than the one you choose. Graph it on the scatter plot. Why is this function a better fit? 7. Using your new function model, find P(23). Is this a more reasonable answer than in #5? Explain.

Approved Feb 2016
Algebra 3 Unit 2: Polynomial and Inverse Functions
Consider the function ( ) 350 16C p p that models the total cost of catering based on the number of people.
a. Find the total cost of serving 150 people.
b. Transform the given function to write a new function modelling the number of people served based on the total cost.
c. Use the function to find the number people based on a total cost of $1,790.

Approved Feb 2016
Algebra 3 Unit 2: Polynomial and Inverse Functions
a.) What is the local minimum? ___________ Explain what it means in context to the application. b.) What is the local maximum? ____________ Explain what it means in context to the application. c.) On what time interval(s) does the function increase: ___________________________; decrease: __________________________
Approved Feb 2016
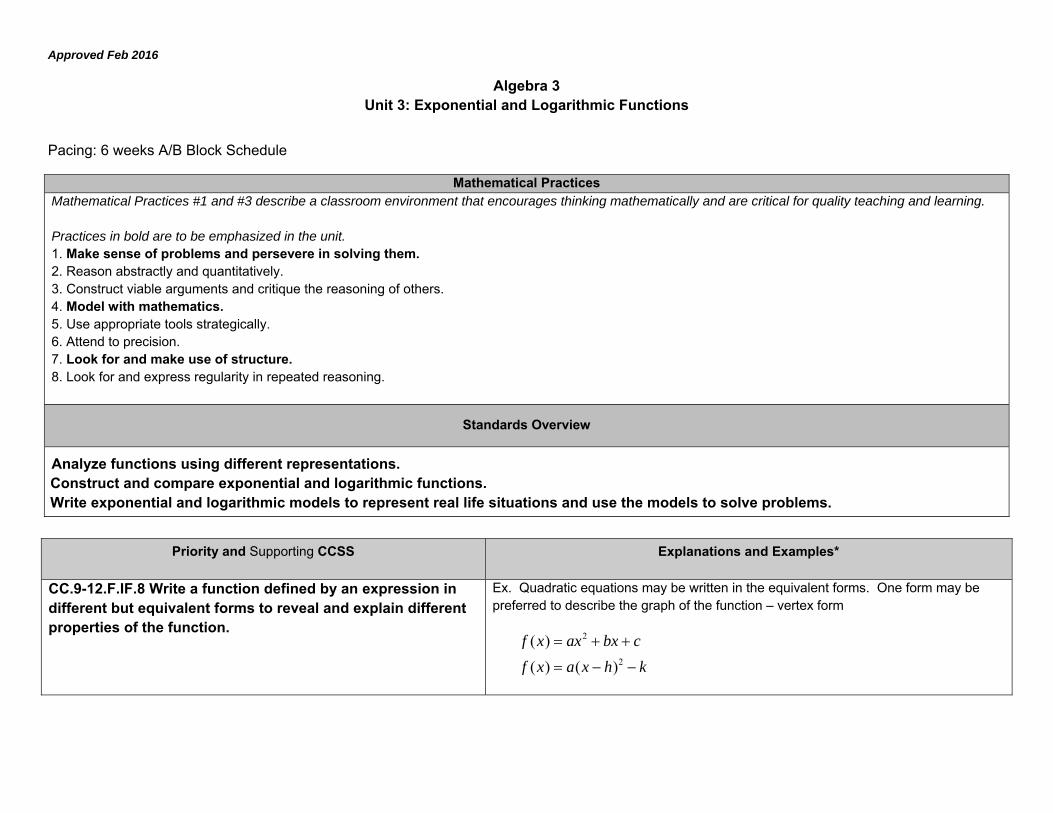
Algebra 3 Unit 3: Exponential and Logarithmic Functions
Pacing: 6 weeks A/B Block Schedule
Mathematical Practices Mathematical Practices #1 and #3 describe a classroom environment that encourages thinking mathematically and are critical for quality teaching and learning. Practices in bold are to be emphasized in the unit. 1. Make sense of problems and persevere in solving them. 2. Reason abstractly and quantitatively. 3. Construct viable arguments and critique the reasoning of others. 4. Model with mathematics. 5. Use appropriate tools strategically. 6. Attend to precision. 7. Look for and make use of structure. 8. Look for and express regularity in repeated reasoning.
Standards Overview
Analyze functions using different representations. Construct and compare exponential and logarithmic functions. Write exponential and logarithmic models to represent real life situations and use the models to solve problems.
Priority and Supporting CCSS Explanations and Examples*
CC.9-12.F.IF.8 Write a function defined by an expression in different but equivalent forms to reveal and explain different properties of the function.
Ex. Quadratic equations may be written in the equivalent forms. One form may be preferred to describe the graph of the function – vertex form
2
2
( )( ) ( )
f x ax bx cf x a x h k

Approved Feb 2016
Algebra 3 Unit 3: Exponential and Logarithmic Functions
Priority and Supporting CCSS Explanations and Examples*
CC.9-12.F.IF.8b Use the properties of exponents to interpret expressions for exponential functions. For example, identify percent rate of change in functions such as y = (1.02) t, y = (0.97)t, y = (1.01) 12t, y = (1.2) (t/10), and classify them as representing exponential growth or decay
CC.9-12.A.SSE.1 Interpret expressions that represent a quantity in terms of its context.*
Students should understand the vocabulary for the parts that make up the whole expression and be able to identify those parts and interpret there meaning in terms of a context.
CC.9-12.A.SSE.1b Interpret complicated expressions by viewing one or more of their parts as a single entity. For example, interpret P(1+r)n as the product of P and a factor not depending on P
CC.9-12.A.SSE.4 Derive the formula for the sum of a finite geometric series (when the common ratio is not 1), and use the formula to solve problems. For example, calculate mortgage payments.*
Example:
● In February, the Bezanson family starts saving for a trip to Australia in September. The Bezanson’s expect their vacation to cost $5375. They start with $525. Each month they plan to deposit 20% more than the previous month. Will they have enough money for their trip?
CC.9-12.A.CED.1 Create equations and inequalities in one variable and use them to solve problems. Include equations arising from linear and quadratic functions, and simple rational and exponential functions.
Equations can represent real world and mathematical problems. Include equations and inequalities that arise when comparing the values of two different functions, such as one describing linear growth and one describing exponential growth.
Examples:

Approved Feb 2016
Algebra 3 Unit 3: Exponential and Logarithmic Functions
Priority and Supporting CCSS Explanations and Examples*
Given that the following trapezoid has area 54 cm2, set up an equation to find the length of the base, and solve the equation.
Lava coming from the eruption of a volcano follows a parabolic path. The height h in feet of a piece of lava t seconds after it is ejected from the volcano is given by h(t)= -t2 + 16t + 936. After how many seconds does the lava reach its maximum height of 1000 feet?
CC.9-12.F.BF.1 Write a function that describes a relationship between two quantities.*
Students will analyze a given problem to determine the function expressed by identifying patterns in the function’s rate of change. They will specify intervals of increase, decrease, constancy, and, if possible, relate them to the function’s description in words or graphically. Students may use graphing calculators or programs, spreadsheets, or computer algebra systems to model functions.
Examples:
● You buy a $10,000 car with an annual interest rate of 6 percent compounded annually and make monthly payments of $250. Express the amount remaining to be paid off as a function of the number of months, using a recursion equation.
● A cup of coffee is initially at a temperature of 93º F. The difference between its temperature and the room temperature of 68º F decreases by 9% each minute. Write a function describing the temperature of the coffee as a function of time.
CC.9-12.F.BF.1b Combine standard function types using arithmetic operations. For example, build a function that models the temperature of a cooling body by adding a constant function to a decaying exponential, and relate these functions to the model

Approved Feb 2016
Algebra 3 Unit 3: Exponential and Logarithmic Functions
Priority and Supporting CCSS Explanations and Examples*
● The radius of a circular oil slick after t hours is given in feet by r = 10t2 – 0.5t, for 0 < t < 10. Find the area of the oil slick as a function of time.
CC.9-12.A.CED.2 Create equations in two or more variables to represent relationships between quantities; graph equations on coordinate axes with labels and scales.
CC.9-12.F.IF.4 For a function that models a relationship between two quantities, interpret key features of graphs and tables in terms of the quantities, and sketch graphs showing key features given a verbal description of the relationship. Key features include: intercepts; intervals where the function is increasing, decreasing, positive, or negative; relative maximums and minimums; symmetries; end behavior; and periodicity.*
Students may be given graphs to interpret or produce graphs given an expression or table for the function, by hand or using technology.
Examples:
● A rocket is launched from 180 feet above the ground at time t = 0. The function that models this situation is given by h = – 16t2 + 96t + 180, where t is measured in seconds and h is height above the ground measured in feet.
o What is a reasonable domain restriction for t in this context?
o Determine the height of the rocket two seconds after it was launched.
o Determine the maximum height obtained by the rocket.
o Determine the time when the rocket is 100 feet above the ground.
o Determine the time at which the rocket hits the ground.
o How would you refine your answer to the first question based on your

Approved Feb 2016
Algebra 3 Unit 3: Exponential and Logarithmic Functions
Priority and Supporting CCSS Explanations and Examples*
response to the second and fifth questions?
● Compare the graphs of y = 3x2 and y = 3x3.
● Find the domain of R(x). Also find the range, zeros,
and asymptotes of R(x).
● Let f(x) = 5x3 – x2 – 5x + 1. Graph the function and identify end behavior and any intervals of constancy, increase, and decrease.
● It started raining lightly at 5am, then the rainfall became heavier at 7am. By 10am the storm was over, with a total rainfall of 3 inches. It didn’t rain for the rest of the day. Sketch a possible graph for the number of inches of rain as a function of time, from midnight to midday.
CC.9-12.F.BF.3 Identify the effect on the graph of replacing f(x) by f(x) + k, kf(x), f(kx), and f(x + k) for specific values of k (both positive and negative); find the value of k given the graphs. Experiment with cases and illustrate an explanation of the effects on the graph using technology. Include recognizing even and odd functions from their graphs and algebraic expressions for them
Students will apply transformations to functions and recognize functions as even and odd. Students may use graphing calculators or programs, spreadsheets, or computer algebra systems to graph functions.
Examples:
Is f(x) = x3 - 3x2 + 2x + 1 even, odd, or neither? Explain your answer orally or in written format.
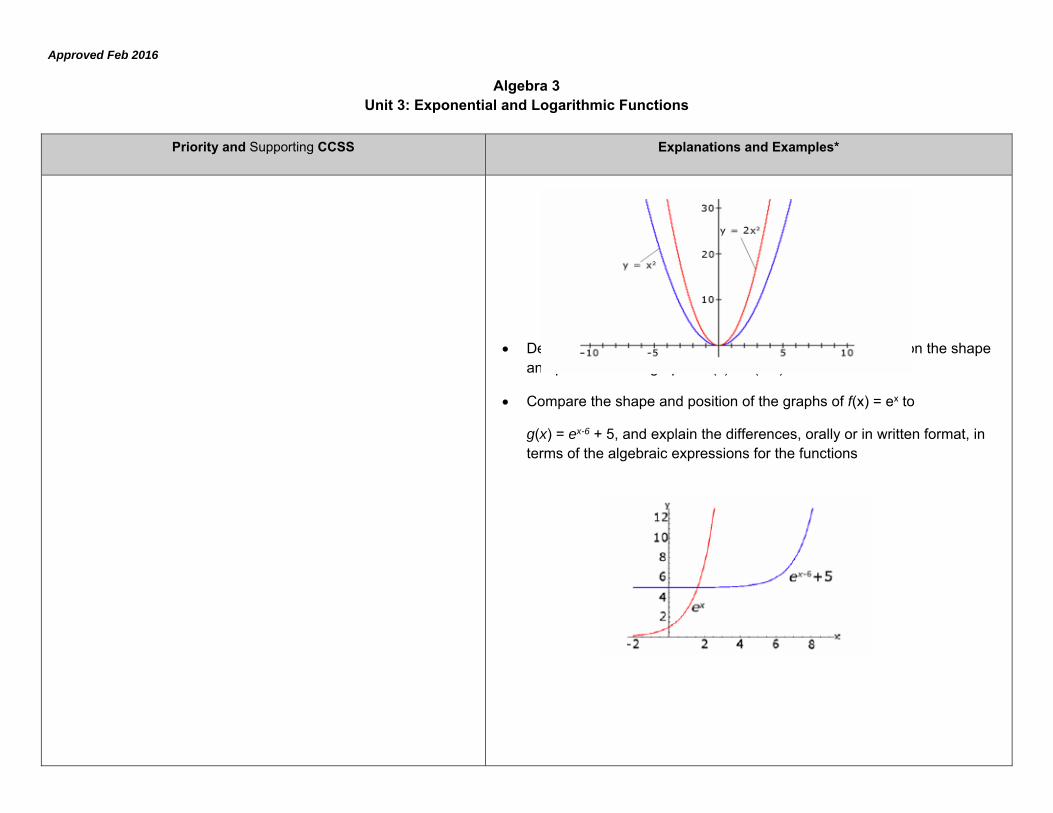
Compare the shape and position of the graphs of f(x) = x2 and
g(x) = 2x2, and explain the differences in terms of the algebraic expressions for the function
Approved Feb 2016
Algebra 3 Unit 3: Exponential and Logarithmic Functions
Priority and Supporting CCSS Explanations and Examples*
Describe effect of varying the parameters a, h, and k have on the shape and position of the graph of f(x) = a(x-h)2 + k.
Compare the shape and position of the graphs of f(x) = ex to
g(x) = ex-6 + 5, and explain the differences, orally or in written format, in terms of the algebraic expressions for the functions

Approved Feb 2016
Algebra 3 Unit 3: Exponential and Logarithmic Functions
Priority and Supporting CCSS Explanations and Examples*
Describe the effect of varying the parameters a, h, and k on the shape and position of the graph f(x) = ab(x + h) + k., orally or in written format. What effect do values between 0 and 1 have? What effect do negative values have?
Compare the shape and position of the graphs of y = sin x to y = 2 sin x.
CC.9-12.A.REI.11 Explain why the x-coordinates of the points where the graphs of the equations y = f(x) and y = g(x) intersect are the solutions of the equation f(x) = g(x); find the solutions approximately, e.g., using technology to graph the functions, make tables of values, or find successive approximations. Include cases where f(x) and/or g(x) are linear, polynomial, rational, absolute value, exponential, and logarithmic functions.*
Students need to understand that numerical solution methods (data in a table used to approximate an algebraic function) and graphical solution methods may produce approximate solutions, and algebraic solution methods produce precise solutions that can be represented graphically or numerically. Students may use graphing calculators or programs to generate tables of values, graph, or solve a variety of functions.
Example:
● Given the following equations determine the x value that results in an
Approved Feb 2016
Algebra 3 Unit 3: Exponential and Logarithmic Functions
Priority and Supporting CCSS Explanations and Examples*
equal output for both functions.
f(x) = 3x – 2
g(x) = (x + 3)2 – 1
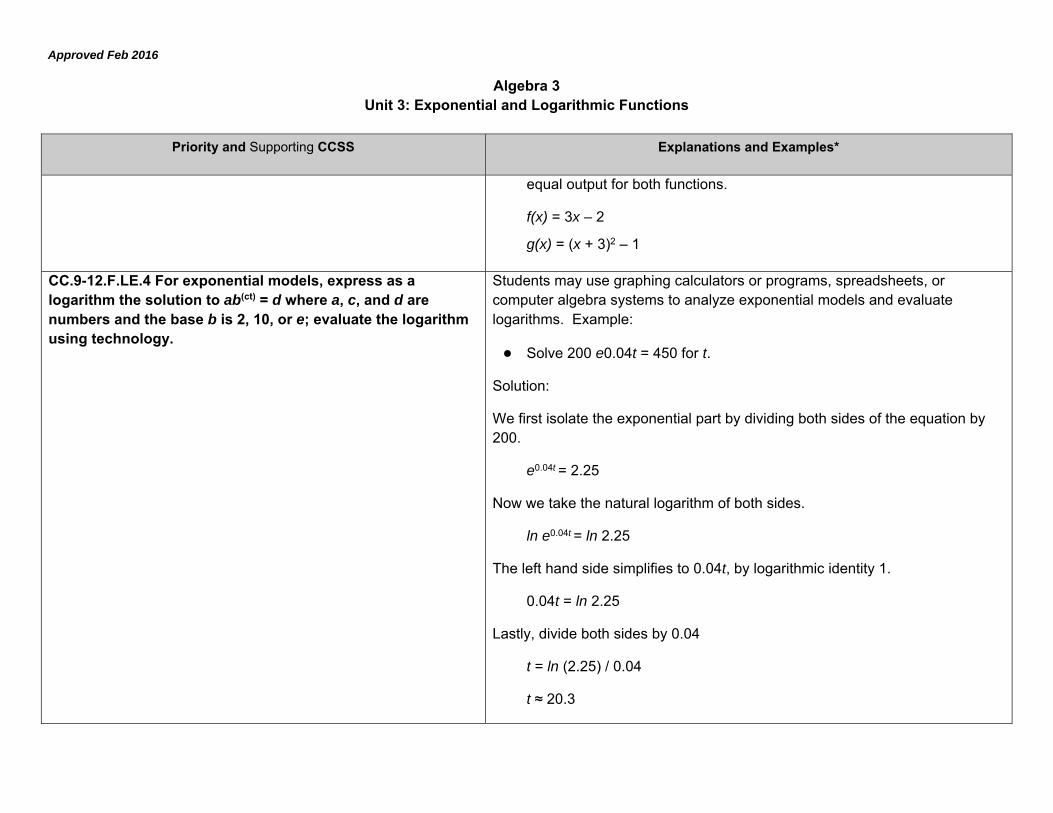
CC.9-12.F.LE.4 For exponential models, express as a logarithm the solution to ab(ct) = d where a, c, and d are numbers and the base b is 2, 10, or e; evaluate the logarithm using technology.
Students may use graphing calculators or programs, spreadsheets, or computer algebra systems to analyze exponential models and evaluate logarithms. Example:
● Solve 200 e0.04t = 450 for t.
Solution:
We first isolate the exponential part by dividing both sides of the equation by 200.
e0.04t = 2.25
Now we take the natural logarithm of both sides.
ln e0.04t = ln 2.25
The left hand side simplifies to 0.04t, by logarithmic identity 1.
0.04t = ln 2.25
Lastly, divide both sides by 0.04
t = ln (2.25) / 0.04
t ≈ 20.3

Approved Feb 2016
Algebra 3 Unit 3: Exponential and Logarithmic Functions
Priority and Supporting CCSS Explanations and Examples*
CC.9-12.F.BF.5 (+) Understand the inverse relationship between exponents and logarithms and use this relationship to solve problems involving logarithms and exponents.
Students may use graphing calculators or programs, spreadsheets, or computer algebra systems to solve problems involving logarithms and exponents.
Example:
● Find the inverse of f(x) = 3(10)2x.
Concepts What Students Need to Know
Skills What Students Need To Be Able To Do
Bloom’s Taxonomy Levels
● Equivalent forms of expression ● Properties of exponents ● Exponential growth or decay
● Write (function to model) ● Use (properties of exponents) ● Interpret / Classify (grown or decay)
4 3 4
● Functions (expressed symbolically) Exponential Logarithmic
● Key Features Intercepts intervals
increasing or decreasing positive or negative
end behavior / asymptotes ● Technology (graphing complicated functions)
● Graph
● Show (key features / intercepts / end behavior)
● Use (technology)
3
4
3

Approved Feb 2016
Algebra 3 Unit 3: Exponential and Logarithmic Functions
Concepts
What Students Need to Know Skills
What Students Need To Be Able To Do Bloom’s Taxonomy Levels
● Exponential / logarithmic form
● Logarithm
● Express (as logarithm)
● Evaluate (logarithm)
3
2
Essential Questions
When does a function best model a situation?
Corresponding Big Ideas
Lines, exponential functions, and parabolas each describe a specific pattern of change.
Standardized Assessment Correlations
(State, College and Career) CollegeBoard PSAT and SAT
Vocabulary
Exponential, growth factor, growth rate, base, power, logarithm, common log, correlation coefficient

Approved Feb 2016
Algebra 3 Unit 3: Exponential and Logarithmic Functions
Learning Activities
Topic Source(s) CCSS
Exponential Function
Write an exponential function to model a real life situation
Use a model equation to make a prediction Use the graphing calculator to estimate Write an exponential function given a graph Analyze a written function to determine
whether it represents growth or decay (equation, table)
Describe an exponential function as a transformation from its parent graph
Graph an exponential equation as a transformation from its parent graph
Solve exponentials Evaluate exponentials
Logarithmic Function
Define as the inverse of an exponential Write a logarithmic function to model a real life
situation Use a model equation to make a prediction Write a logarithmic function given a graph Describe a logarithmic function as a
transformation from its parent graph Graph a logarithmic equation as a
transformation from its parent graph or as the inverse of its related exponential
Algebra 2 Text section 8.1
PC text section 5.3
Department generated worksheets
Department generated worksheets
Algebra 2 Text section 8.5
CC.9-12.A.CED.1
CC.9-12.F.IF.8b
CC.9-12.F.BF.3 I
CC.9-12.F.IF.7e
CC.9-12.F.IF.8
CC.9-12.F.LE.4
CC.9-12.A.CED.1
CC.9-12.F.IF.7e

Approved Feb 2016
Algebra 3 Unit 3: Exponential and Logarithmic Functions
Unit Assessments
The items developed for this section can be used during the course of instruction when deemed appropriate by the teacher.
Quizzes, calculator projects, identical unit assessment
Solve logarithmic equations Evaluate logarithmic functions

Approved Feb 2016
Algebra 3 Unit 3: Exponential and Logarithmic Functions
Application
Using the graphing calculator, enter the data using the STAT menu and use the STAT: Calc option to determine best model to fit the data. Use your knowledge of the shapes of function family graphs to choose the model to try. Use r and r2 to choose the best model.
Find a function that best fits the relation between the age and average total cholesterol for adult males at various ages.
Age Total Cholesterol
27 189
40 205
50 215
60 210
70 210
80 194
Function family: _________________________ r = _____________; r2 = _______________ Equation: __________________________
The wind speed s (in miles per hour) near the center of a tornado is related to the distance d (in miles) the tornado travels by the equation s 93log d 65 .
On March 18, 1925, a tornado whose wind speed was about 280 miles per hour struck the Midwest. How far did the tornado travel?
Jonas purchased a new car for $15,000. Each year the value of the car depreciates by 30% of its value the previous year. In how many years will the car be worth $500?

Approved Feb 2016
Algebra 3 Unit 4: Applications of Trigonometry
Pacing: 6 weeks A/B Block Schedule
Mathematical Practices Mathematical Practices #1 and #3 describe a classroom environment that encourages thinking mathematically and are critical for quality teaching and learning. Practices in bold are to be emphasized in the unit. 1. Make sense of problems and persevere in solving them. 2. Reason abstractly and quantitatively. 3. Construct viable arguments and critique the reasoning of others. 4. Model with mathematics. 5. Use appropriate tools strategically. 6. Attend to precision. 7. Look for and make use of structure. 8. Look for and express regularity in repeated reasoning.
Standards Overview
Define trigonometric ratios and solve problems involving right triangles. (+)Apply trigonometry to general triangles using laws of sines and cosines.
(+) indicates additional mathematics that students should learn in order to take advanced courses such as calculus, advanced statistics, or discrete mathematics Use trigonometry to solve triangles. Review solving right triangles using trig ratios. Use the Laws of Sines and Cosines, to solve non-right triangles. Use trigonometry to find the area of triangles for which a height is not given.
Approved Feb 2016
Algebra 3 Unit 4: Applications of Trigonometry
Priority and Supporting CCSS Explanations and Examples*
CC.9-12.G.SRT.8 Use trigonometric ratios and the Pythagorean Theorem to solve right triangles in applied problems.*
To use the Pythagorean Theorem and its Converse To use sine, cosine, and tangent ratios to determine side lengths in right triangles To use inverse functions to determine angle measures in right triangles To use angles of elevation and depression to solve problems To find the area of a triangle using trigonometry
To find the area of any triangle (formula derived using law of sines)
CC.9-12.G.SRT.9 (+) Derive the formula A = 1/2absin(C) for the area of a triangle by drawing an auxiliary line from a vertex perpendicular to the opposite side.
CC.9-12.G.SRT.11 (+) Understand and apply the Law of Sines and the Law of Cosines to find unknown measurements in right and non-right triangles.
To use the Law of Sines and Law of Cosines in finding the measures of sides and angles of a triangle

Approved Feb 2016
Algebra 3 Unit 4: Applications of Trigonometry
Concepts What Students Need to Know
Skills What Students Need To Be Able To Do
Bloom’s Taxonomy Levels
Pythagorean Theorem
Six Trigonometric Ratios
Law of Sines
Law of Cosines
Area of Triangle
12
Area bh ; 1 sin2
Area bc A ;
Heron’s Formula:
( )( )( )Area s s a s b s c , where 1 ( )2
s a b c
Write model equation and solve Know Use to write model equations and solve
Know Use to write model equations and solve Analyze diagram to know when to apply
Know Use to write model equations and solve Analyze diagram to know when to apply
Analyze diagram information to select appropriate area formula

Approved Feb 2016
Algebra 3 Unit 4: Applications of Trigonometry
Essential Questions
How might the features of one figure be useful when solving problems about a similar figure?
Corresponding Big Ideas Similarity and the properties of similar triangles allow for the application of trigonometric ratios to real-world situations.
Standardized Assessment Correlations (State, College and Career)
CollegeBoard PSAT and SAT
Vocabulary Pythagorean Theorem, trigonometric ratios, inverse trigonometric functions, law of sines, law of cosines, Heron’s formula

Approved Feb 2016
Algebra 3 Unit 4: Applications of Trigonometry
Unit Assessments The items developed for this section can be used during the course of instruction when deemed appropriate by the teacher. Section Quizzes, End-of-Unit Test
Learning Activities Topic Source(s) CCSS
Review six trigonometric functions (Sine, cosine, tangent, cosecant, secant, cotangent)
Review solving right triangles using Pythagorean Thm and trig ratios (applications)
Law of Sines Law of Cosines
Area of Triangles (include Heron’s Formula)
Algebra 2 text: Section 14.3 Section 14.4 Section 14.5 Section 14.4
G-SRT6, G-SRT7 and G-SRT8
G-SRT4 and G-SRT8
G-SRT10, G-SRT11
G-SRT9
Approved Feb 2016
Algebra 3 Unit 4: Applications of Trigonometry
Application
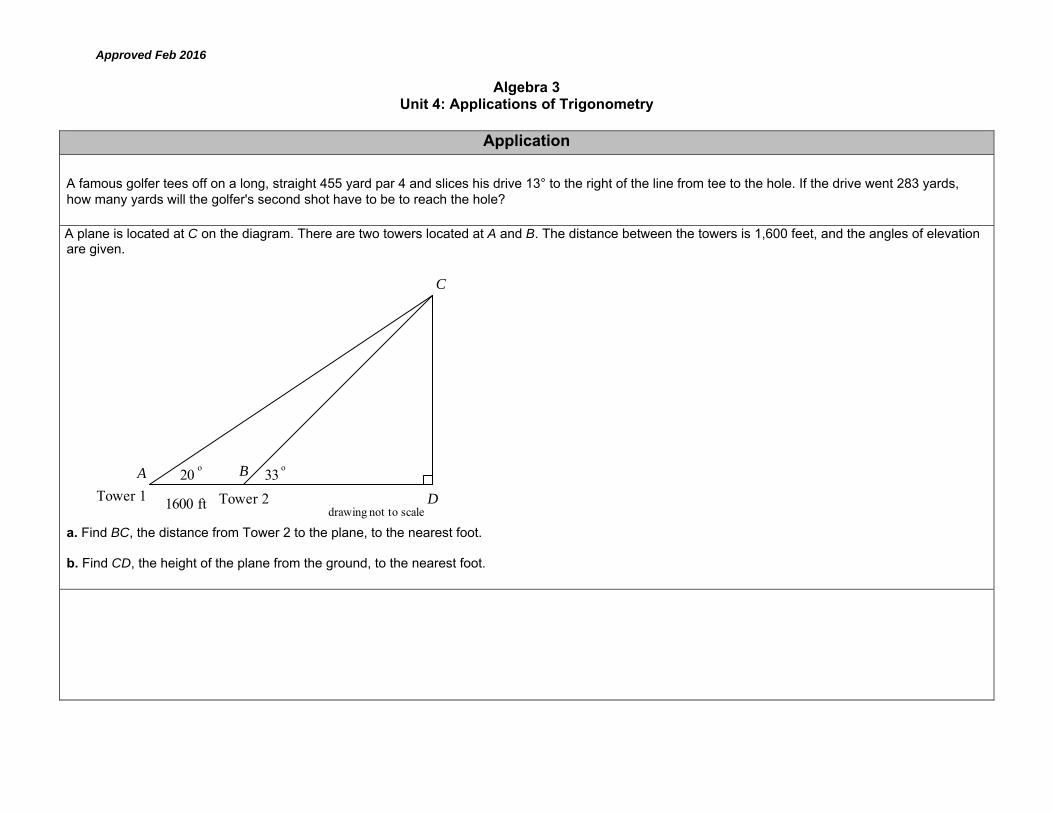
A famous golfer tees off on a long, straight 455 yard par 4 and slices his drive 13° to the right of the line from tee to the hole. If the drive went 283 yards, how many yards will the golfer's second shot have to be to reach the hole?
A plane is located at C on the diagram. There are two towers located at A and B. The distance between the towers is 1,600 feet, and the angles of elevation are given.
a. Find BC, the distance from Tower 2 to the plane, to the nearest foot. b. Find CD, the height of the plane from the ground, to the nearest foot.
A
DTower 1 Tower 2
C
20 33o oB
1600 ft drawing not to scale
Approved Feb 2016
Algebra 3 Unit 4: Applications of Trigonometry
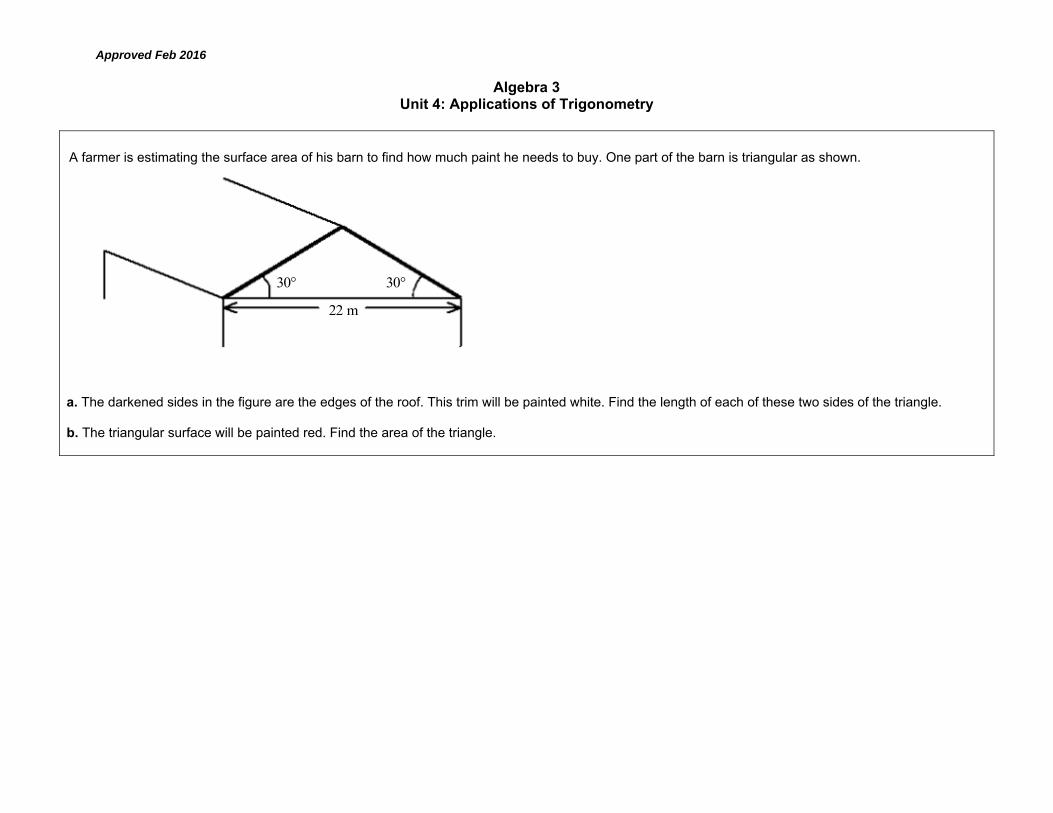
A farmer is estimating the surface area of his barn to find how much paint he needs to buy. One part of the barn is triangular as shown.
a. The darkened sides in the figure are the edges of the roof. This trim will be painted white. Find the length of each of these two sides of the triangle. b. The triangular surface will be painted red. Find the area of the triangle.
30° 30°
22 m
Approved Feb 2016
Algebra 3 Unit 5: Statistics
Pacing: 8 weeks A/B Block Schedule
Mathematical Practices
Mathematical Practices #1 and #3 describe a classroom environment that encourages thinking mathematically and are critical for quality teaching and learning. Practices in bold are to be emphasized in the unit. 1. Make sense of problems and persevere in solving them. 2. Reason abstractly and quantitatively. 3. Construct viable arguments and critique the reasoning of others. 4. Model with mathematics. 5. Use appropriate tools strategically. 6. Attend to precision. 7. Look for and make use of structure. 8. Look for and express regularity in repeated reasoning.
Standards Overview
Summarize, represent, and interpret data on a single count or measurement variable Summarize, represent, and interpret data on two categorical and quantitative variables. Interpret differences in shape, center, and spread in the context of the data sets, accounting for possible effects of extreme data points. Use the mean and standard deviation of a data set to fit it to a normal distribution and to estimate population percentages.

Approved Feb 2016
Algebra 3 Unit 5: Statistics
Priority and Supporting CCSS Explanations and Examples*
CC.9-12.S.ID.4 Use the mean and standard deviation of a data set to fit it to a normal distribution and to estimate population percentages. Recognize that there are data sets for which such a procedure is not appropriate. Use calculators, spreadsheets, and tables to estimate areas under the normal curve.
Students may use spreadsheets, graphing calculators, statistical software and tables to analyze the fit between a data set and normal distributions and estimate areas under the curve. Examples:
● The bar graph below gives the birth weight of a population of 100 chimpanzees. The line shows how the weights are normally distributed about the mean, 3250 grams. Estimate the percent of baby chimps weighing 3000-3999 grams.
●
● Determine which situation(s) is best modeled by a normal distribution. Explain your reasoning.
o Annual income of a household in the U.S. o Weight of babies born in one year in the U.S.

Approved Feb 2016
Algebra 3 Unit 5: Statistics
Priority and Supporting CCSS Explanations and Examples*
CC.9-12.S.IC.1 Understand statistics as a process for making inferences about population parameters based on a random sample from that population.
CC.9-12.S.IC.2 Decide if a specified model is consistent with results from a given data-generating process, e.g., using simulation. For example, a model says a spinning coin falls heads up with probability 0.5. Would a result of 5 tails in a row cause you to question the model?
Possible data-generating processes include (but are not limited to): flipping coins, spinning spinners, rolling a number cube, and simulations using the random number generators. Students may use graphing calculators, spreadsheet programs, or applets to conduct simulations and quickly perform large numbers of trials. The law of large numbers states that as the sample size increases, the experimental probability will approach the theoretical probability. Comparison of data from repetitions of the same experiment is part of the model building verification process. Example:
● Have multiple groups flip coins. One group flips a coin 5 times, one group flips a coin 20 times, and one group flips a coin 100 times. Which group’s results will most likely approach the theoretical probability?
CC.9-12.S.IC.6 Evaluate reports based on data. Explanations can include but are not limited to sample size, biased survey sample, interval scale, unlabeled scale, uneven scale, and outliers that distort the line-of-best-fit. In a pictogram the symbol scale used can also be a source of distortion. As a strategy, collect reports published in the media and ask students to consider the source of the data, the design of the study, and the way the

Approved Feb 2016
Algebra 3 Unit 5: Statistics
Priority and Supporting CCSS Explanations and Examples*
data are analyzed and displayed. Example:
● A reporter used the two data sets below to calculate the mean housing price in Arizona as $629,000. Why is this calculation not representative of the typical housing price in Arizona?
o King River area {1.2 million, 242000, 265500, 140000, 281000, 265000, 211000}
o Toby Ranch homes {5million, 154000, 250000, 250000, 200000, 160000, 190000}
S-ID 1 Represent data with plots on the real number line (dot plots, histograms, and box plots).
Students may compare and contrast the advantage of each of these representations.
S-ID 2. Use statistics appropriate to the shape of the data distribution to compare center (median, mean) and spread (interquartile range, standard deviation) of two or more different data sets.
Students may use spreadsheets, graphing calculators and statistical software for calculations, summaries, and comparisons of data sets. Example: Given a set of test scores: 99, 96, 94, 93, 90, 88, 86, 77, 70, 68, find the mean, median and standard deviation. Explain how the values vary about the mean and median. What information does this give the teacher?

Approved Feb 2016
Algebra 3 Unit 5: Statistics
Priority and Supporting CCSS Explanations and Examples*
S-ID 3. Interpret differences in shape, center, and spread in the context of the data sets, accounting for possible effects of extreme data points (outliers).
Example: After the 2009-2010 NBA season LeBron James switched teams from the Cleveland Cavaliers to the Miami Heat, and he remained the top scorer (in points per game) in his first year in Miami. Compare team statistics for Cleveland (2009-2010) and Miami (2010-2011) for all players who averaged at least 10 minutes per game. Using the 1.5 X IQR rule, determine for which team and year James’s performance may be considered an outlier.
S-ID5. Summarize categorical data for two categories in two-way frequency tables. Interpret relative frequencies in the context of the data(including joint, marginal, and conditional relative frequencies). Recognize possible associations and trends in the data.

Approved Feb 2016
Algebra 3 Unit 5: Statistics
Concepts
What Students Need to Know Skills
What Students Need To Be Able To Do Bloom’s Taxonomy
Levels Data (Who, What, When, Where, Why)
Measures of central tendency (mean, median, mode)
Measures of spread (range, interquartile range, standard deviation)
Outlier Histogram Box plot Correlation Normal Distribution Population percentages Appropriate use of normal approx Calculators, spreadsheets, tables Area under normal curve Inference Population parameters Sample survey data Population mean / proportion
Identify Interpret Classify (Categorical, Quantitative)
Calculate (mean, median, mode,
interquartile range) Use (statistics to infer)
Use (technology to find standard
deviation) Interpret (correlation) Identify (outliers)
Fit (normal distribution) Estimate (population percentages) Recognize (inappropriate usage) Use (technology) Estimate (area under normal) Make (inferences based on data)
● Use (data to make inference) ● Estimate (population parameters)
1 2 1
1
3
3
2 4
3 3 4 3 3 4
4 4

Approved Feb 2016
Algebra 3 Unit 5: Statistics
Essential Questions
How can the properties of data be communicated to showcase its important features?
Corresponding Big Ideas Statisticians summarize, represent and interpret categorical and quantitative data in different ways since one method can reveal or create a different impression than another.
Standardized Assessment Correlations (State, College and Career)
Collegeboard PSAT and SAT
Vocabulary Population, sample, variable, quantitative variable, categorical variable, relative frequency, contingency table, marginal distribution, conditional distribution, histogram, symmetrical data, skewed data, outlier value, mean, median, interquartile range, standard deviation, Normal model, z-score

Approved Feb 2016
Algebra 3 Unit 5: Statistics
Learning Activities
Topic Source(s) CCSS Define Data – 5 W’s Categorical Data Create a relative frequency table Analyze data displays Calculate marginal distributions from a contingency table Calculate conditional distribution from a contingency table Determine whether variables are dependent/independent Quantitative Data Create histogram by hand and with calculator Discuss shape, center, spread Calculate range, median, quartiles and interquartile range Calculate population percentages based on quartile info Mean, Median, Standard Deviation, IQR (Interquartile range) Calculate Determine most appropriate measure based on data info Normal Distribution Determine whether a data set is normal Z-Scores Calculate Use scores to compare data
Stats in Your World text
CC.9-12.S.IC.1 CC.9-12.S.IC.2
S-ID5
CC.9-12.S.IC.6 S-ID 3
S-ID 1 S-ID 2 S-ID 3
CC.9-12.S.ID.4 S-ID 2 S-ID 3
CC.9-12.S.ID.4

Approved Feb 2016
Algebra 3 Unit 5: Statistics
Unit Assessments The items developed for this section can be used during the course of instruction when deemed appropriate by the teacher. Section Quizzes, End-of-Unit Test
Application The Pew Research Center for the People and the Press (http://people-press.org) has asked a representative sample of U.S. adults about global warming, repeating the question over time. In January, 2007 the responses reflected an increased belief that global warming is real and due to human activity. Below is a display of the percentages of respondents choosing each of the major alternatives offered, list two errors in the display.
Normal Model 68-95-99.7 model Sketch with deviations identified Calculate percentages of a population Calculate z-scores for a given population percentage
Approved Feb 2016
Algebra 3 Unit 5: Statistics
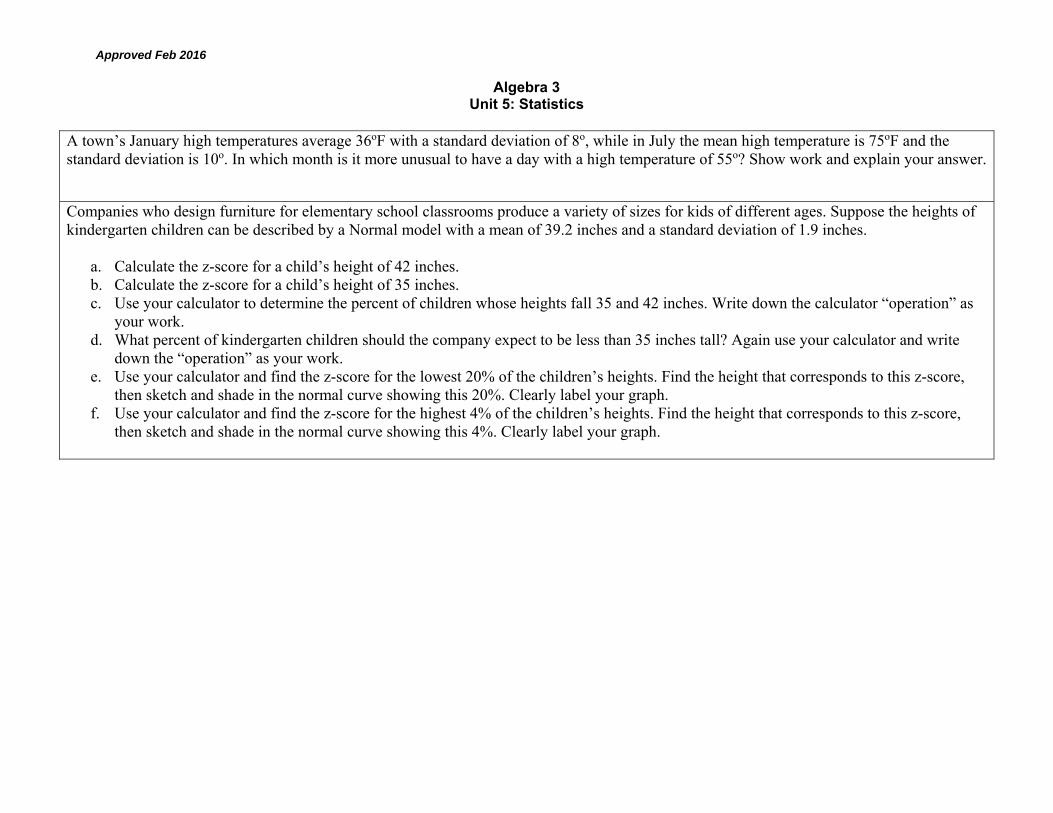
A town’s January high temperatures average 36oF with a standard deviation of 8o, while in July the mean high temperature is 75oF and the standard deviation is 10o. In which month is it more unusual to have a day with a high temperature of 55o? Show work and explain your answer.
Companies who design furniture for elementary school classrooms produce a variety of sizes for kids of different ages. Suppose the heights of kindergarten children can be described by a Normal model with a mean of 39.2 inches and a standard deviation of 1.9 inches.
a. Calculate the z-score for a child’s height of 42 inches. b. Calculate the z-score for a child’s height of 35 inches. c. Use your calculator to determine the percent of children whose heights fall 35 and 42 inches. Write down the calculator “operation” as
your work. d. What percent of kindergarten children should the company expect to be less than 35 inches tall? Again use your calculator and write
down the “operation” as your work. e. Use your calculator and find the z-score for the lowest 20% of the children’s heights. Find the height that corresponds to this z-score,
then sketch and shade in the normal curve showing this 20%. Clearly label your graph. f. Use your calculator and find the z-score for the highest 4% of the children’s heights. Find the height that corresponds to this z-score,
then sketch and shade in the normal curve showing this 4%. Clearly label your graph.
Approved Feb 2016
Algebra 3 Unit 6: Probability and Counting
Pacing: 3 weeks A/B Block Schedule
Mathematical Practices Mathematical Practices #1 and #3 describe a classroom environment that encourages thinking mathematically and are critical for quality teaching and learning. Practices in bold are to be emphasized in the unit. 1. Make sense of problems and persevere in solving them. 2. Reason abstractly and quantitatively. 3. Construct viable arguments and critique the reasoning of others. 4. Model with mathematics. 5. Use appropriate tools strategically. 6. Attend to precision. 7. Look for and make use of structure. 8. Look for and express regularity in repeated reasoning.
Standards Overview
Use permutations and combinations to compute probabilities of compound events.

Approved Feb 2016
Algebra 3 Unit 6: Probability and Counting
Priority and Supporting CCSS Explanations and Examples*
CC.9-12.S-CP.9 (+) Use permutations and combinations to compute probabilities of compound events and solve problems
!( )!n r
nPn r
!( )! !n r
nCn r r
CC.9-12.MD.1 (+) Define a random variable for a quantity of interest by assigning a numerical value to each event in a sample space
Concepts What Students Need to Know
Skills What Students Need To Be Able To Do
Bloom’s Taxonomy Levels
Sample Space Probability Counting principle Permutation Combination
Create Calculate Understand Identify Calculate Identify Calculate
Approved Feb 2016
Algebra 3 Unit 6: Probability and Counting
Essential Questions
In what ways does one event impact the probability of another event occurring? How is probability used to make informed decisions about uncertain events?
Corresponding Big Ideas Probability provides a process to determine the likelihood of events and determine whether the occurrence of one evnt makes some other result more or less likely. The rules of probability can lead to more valid and reliable predictions about the likelihood of an event occurring.
Standardized Assessment Correlations (State, College and Career)
CollegeBoard PSAT and SAT
Vocabulary Probability, random selection, sample space, outcome, factorial (!), counting principle, permutation, combination,

Approved Feb 2016
Algebra 3 Unit 6: Probability and Counting
Unit Assessments The items developed for this section can be used during the course of instruction when deemed appropriate by the teacher. Section quizzes, End-of-Unit Test
Learning Activities Topic Source(s) CCSS
Create sample space Calculate probability Determine whether written scenario represents a
permutation or combination Select the appropriate formula to accurately calculate
the count of a permutation and/or combination
Stats in Your World Chapter 13 p. 284
CC9-12.CP.9