Embed Size (px)
Citation preview

Brazil What we can
expect next?
Ivan Melo

GLOBAL S&D
140
145
150
155
160
165
170
175
180
185
190
-15
-10
-5
-
5
10
15
mln
t, ra
w v
alu
e
mln
t, ra
w v
alu
e
Global Sugar Balance (mln t) Surplus/Deficit
Worls Sugar Prod
World Sugar Cons
Normal Weather All going well.....
Production 16/17 17/18 F
Var.
(mln t,
tel quel)
CS Brasil 35,6 36,5 0,9
India 19,8 24,1 4,3
EU 16,7 19,7 3,0
Thailand 9,8 12,0 2,2
China 9,3 10,3 1,0

Price & Parity
Hydrous floor: ↑ PIS/COFINS ↑ Import tax. o PIS/COFINS in the producer
BR

CS- Region Sugar Mix
Máx: 49,4%
Sugar: 38,0 mln t
Min: 44,6% Sugar: 34,3 mln t
25%
30%
35%
40%
45%
50%
55%
1º
Q A
br
2º
Q A
br
1º
Q M
ai
2º
Q M
ai
1º
Q J
un
2º
Q J
un
1º
Q J
ul
2º
Q J
ul
1º
Q A
go
2º
Q A
go
1º
Q S
et
2º
Q S
et
1º
Q O
ut
2º
Q O
ut
1º
Q N
ov
2º
Q N
ov
1º
Q D
ez
2º
Q D
ez
CANE ALLOCATION TO SUGAR Max Min 16/17 17/18E

Petrobras New diesel and gasoline pricing policy
• Petrobras will adopt competitive prices using as reference Import Parity Prices plus a margin.
• The competitiveness will depend on commercial and financial objectives

WTI & Petrobras Adj & Gasoline SP & Hydrous SP
PIS/COFINS

2018 Crop
• Lower renovation - Cane Ageing
• Cane Treatment below Ideal
• Normal weather conditions vs Good weather
conditions in 2017
Election – FX??
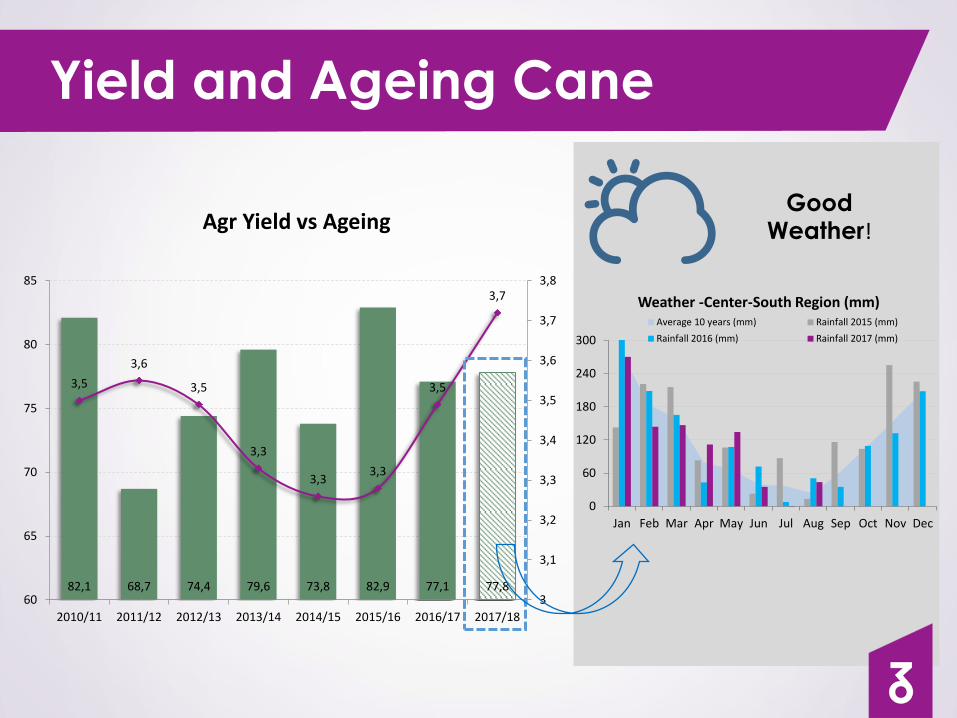
Yield and Ageing Cane
82,1 68,7 74,4 79,6 73,8 82,9 77,1 77,8
3,5
3,6
3,5
3,3
3,3 3,3
3,5
3,7
3
3,1
3,2
3,3
3,4
3,5
3,6
3,7
3,8
60
65
70
75
80
85
2010/11 2011/12 2012/13 2013/14 2014/15 2015/16 2016/17 2017/18
Agr Yield vs Ageing Good
Weather!
0
60
120
180
240
300
Jan Feb Mar Apr May Jun Jul Aug Sep Oct Nov Dec
Weather -Center-South Region (mm) Average 10 years (mm) Rainfall 2015 (mm)
Rainfall 2016 (mm) Rainfall 2017 (mm)

Historical Planting
Low renovation
Cane ageing
The agricultural yield must be closely watched as the impact of
any adverse weather is stronger in
a aged cane field

BRAZILIAN ELECTION & FX