Embed Size (px)
Citation preview
April 11,2011NH Department of Education
UnderstandingNew Hampshire’s
2011Adequate Yearly Progress
(AYP) Reports
111

April 11,2011NH Department of Education
AgendaAYP Status Reports
Background What’s New This Year AYP Summary Reports (Did we make AYP?) AYP Data Reports (Where does the data come from?) AYP Index Reports (How are we doing?) AYP Data Files
Looking Beyond the AYP “Yes” and “No”
How are School in Need of Improvement (SINI) or District in Need of Improvement (DINI) Designations Made?
Growth Target and Growth Roster ReportsAnswering Your Questions
222

April 11,2011NH Department of Education
2011 AYP Status Results and Resources
www.education.nh.gov
Go through the Assessment/Accountability link on the left; orUse the Alphabet at the top of the page under A for
Adequate Yearly Progress
Look under 2010-2011 AYP tab
AYP Summary, Data, & Index Reports for Elem/Middle and Secondary schools and districts
AYP Summary Report Explained (pdf) AYP Confidence Interval Look-up Table (pdf and xls) AYP Confidence Interval Look-up Table Explained (pdf) AYP Data File Layouts (xls) AYP Report Data for Summary Pages (csv) AYP Report Data for Index Pages (csv)
Links to AYP Status lists for Schools and Districts, SINI and DINI lists Link to 2011 AYP page
for other support and appeals information 333

April 11,2011NH Department of Education44
Online Reference Materials
Click on “2011 AYP Results”:
AYP Summary Report Explained (detailed explanation of the 3-page report)
Understanding the 2011 Reports (PowerPoint)
Reference Guide for Navigating 2010 AYP Reports and Files
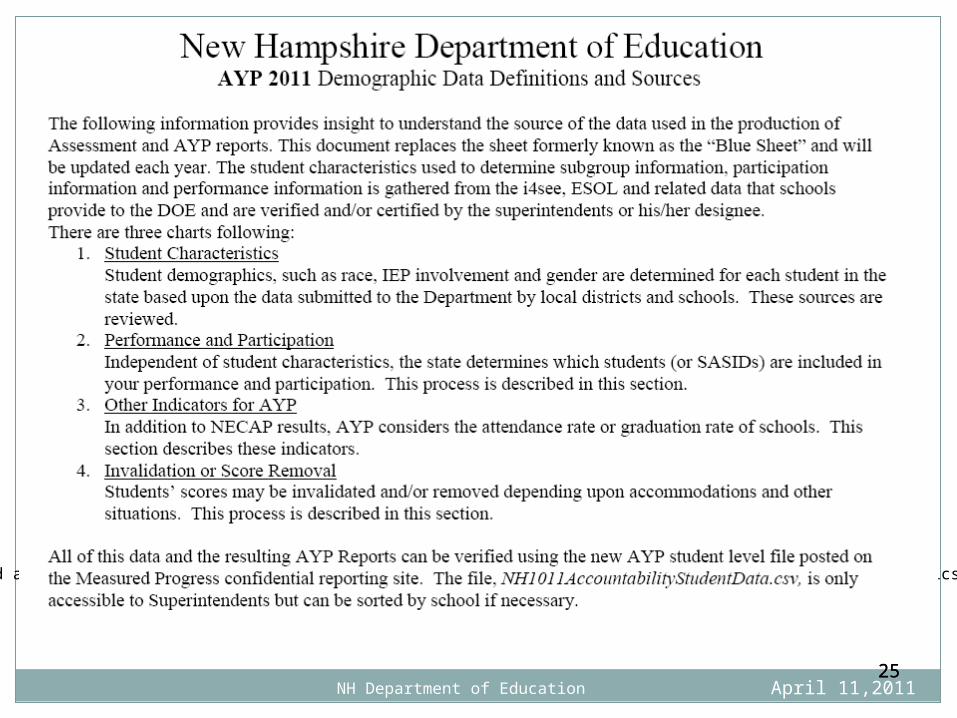
Demographic Data Definitions and Sources
Accountability for Students Placed Out of District (policy explained)Index cut points and Targets by year AYP Index Confidence Interval (CI) Look-up Table and Look-up Table Explained
Preliminary AYP Results and Status for All Schools & Districts (lists & data files)
Preliminary AYP Status for Schools and Districts In Need of Improvement
4
AYP Report Overview
April 11,2011NH Department of Education
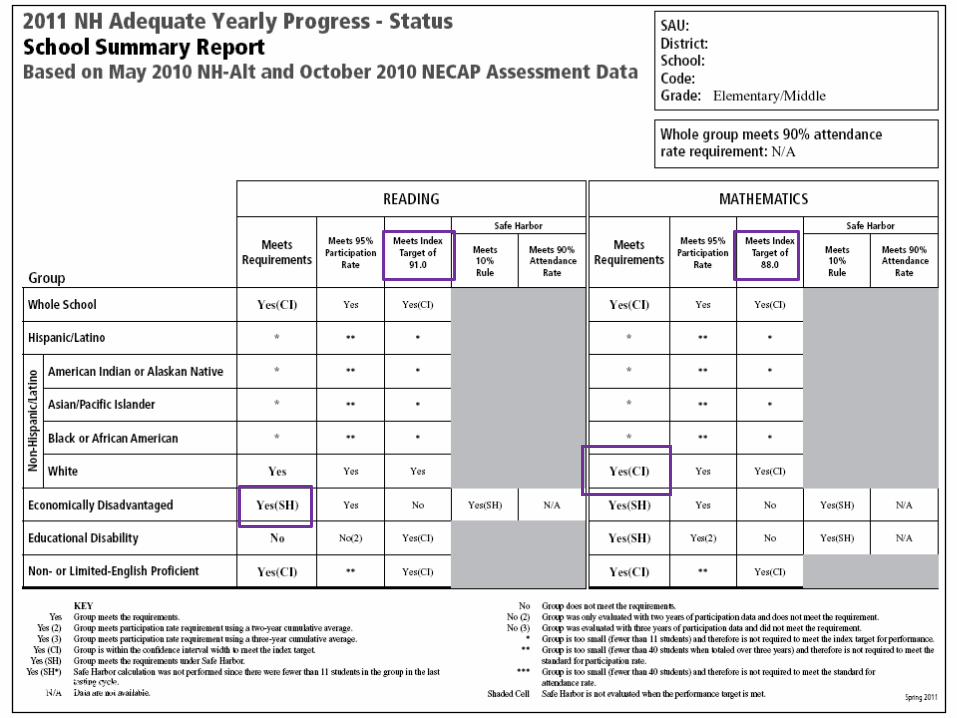
Page 1: AYP “Summary” Report
Page 2: AYP “Data” Report
Page 3: AYP “Index” Report
AYP Summary Reports Explained (a separate document with glossary of terms)
5
Adequate Yearly Progress (AYP)What does it mean?
April 11,2011NH Department of Education
Since 2003, federal and state accountability laws have required the NH Department of Education to annually measure and publicly report on the progress of students in each school and district in meeting statewide performance targets (Annual Measurable Objectives-AMOs) on the statewide assessment.
NCLB (20 USC 6311 §1111(b)(2)(b) (2001)) (NH RSA 193-H-2)
66
6
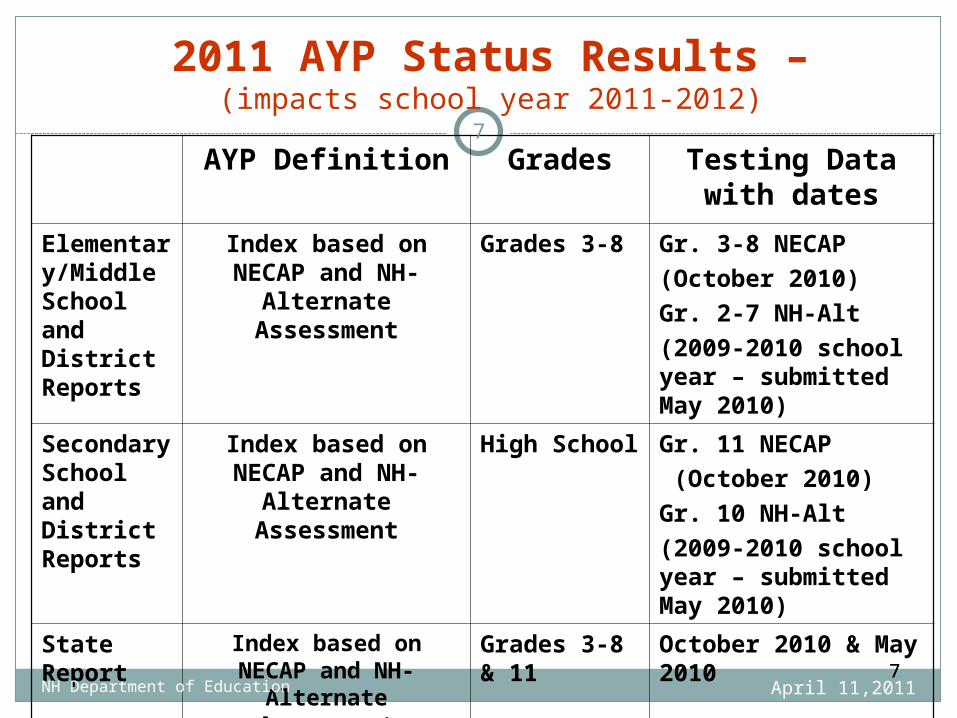
2011 AYP Status Results –(impacts school year 2011-2012)
AYP Definition Grades Testing Data with dates
Elementary/Middle School and District Reports
Index based on NECAP and NH-Alternate
Assessment
Grades 3-8 Gr. 3-8 NECAP
(October 2010)
Gr. 2-7 NH-Alt
(2009-2010 school year – submitted May 2010)
SecondarySchool and District Reports
Index based on NECAP and NH-Alternate
Assessment
High School Gr. 11 NECAP
(October 2010)
Gr. 10 NH-Alt
(2009-2010 school year – submitted May 2010)
State Report
Index based on NECAP and NH-Alternate
Assessment
Grades 3-8 & 11
October 2010 & May 2010
April 11,2011NH Department of Education77
7

Adequate Yearly Progress (AYP)What does it mean?
April 11,2011NH Department of Education
Both federal and state accountability laws required the establishment of an Annual Measurable Objective (AMO) timeline to ensure that all students are performing at proficient or above by the 2013-2014 school year.
8

AYP Status TargetsAnnual Measurable Objectives (AMOs)2 year intervals, equally spaced to 100%
Index Targets
School Year
Grades 3-8 Grade 11
Reading Mathematics Reading Mathematics
2005-06 82 76 - -
2006-07 82 76 - -
2007-08 86 82 84 58
2008-09 86 82 84 58
2009-10 91 88 89 72
2010-11 91 88 89 72
2011-12 95 94 94 86
2012-13 95 94 94 86
2013-14 100 100 100 100
April 11,2011NH Department of Education
9

2010 AYP Status Results – What’s New
April 11,2011NH Department of Education
2010
AMOs or Index targets changed (EMR-91 EMM-88; HSR-89 HSM-72)
Demographic categories updated to match new federal labels
No more “I” for improving – must hit target
Participation rate averaging over up to 3 years
Full Academic Year now based on .90 ADM (Average Daily Membership)
# enrolled & # participating on data page
2011
AMOs or Index Targets did not change.
No change
Graduation rate now calculated using the “cohort” method and the target was raised to 80%
No change
No change
No change
1010
10
Question #1
Did we make AYP?
April 11,2011NH Department of Education
Use the AYP Summary Reports
Check the list: Preliminary AYP status for NH Schools
1111
11

AYP Summary Report
April 11,2011NH Department of Education
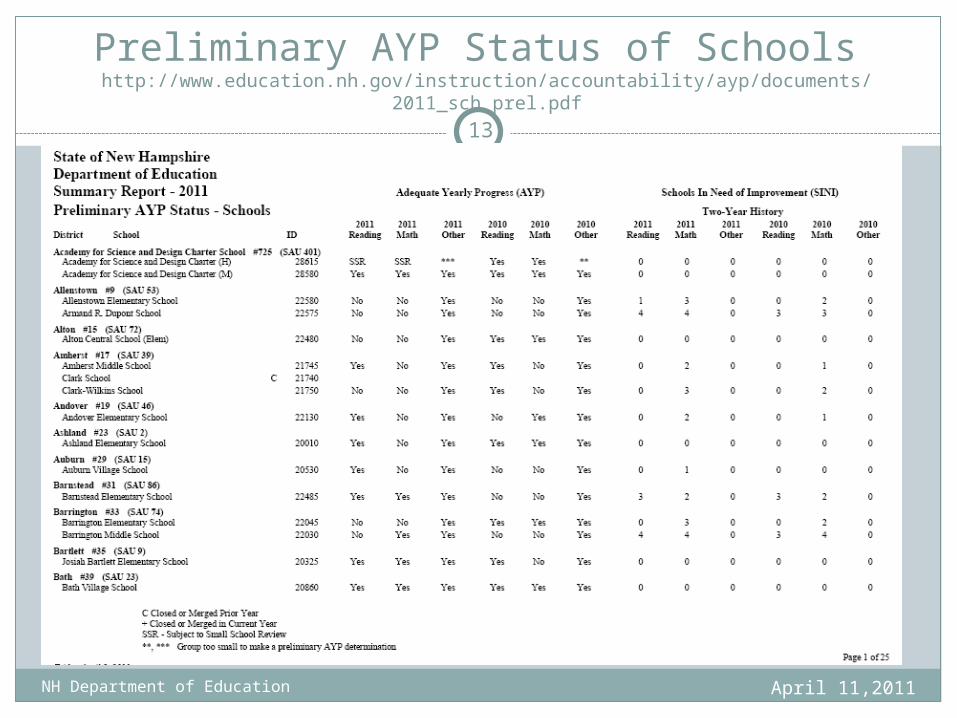
Preliminary AYP Status of Schools http://www.education.nh.gov/instruction/accountability/ayp/documents/
2011_sch_prel.pdf
April 11,2011NH Department of Education
13
April 11,2011NH Department of Education
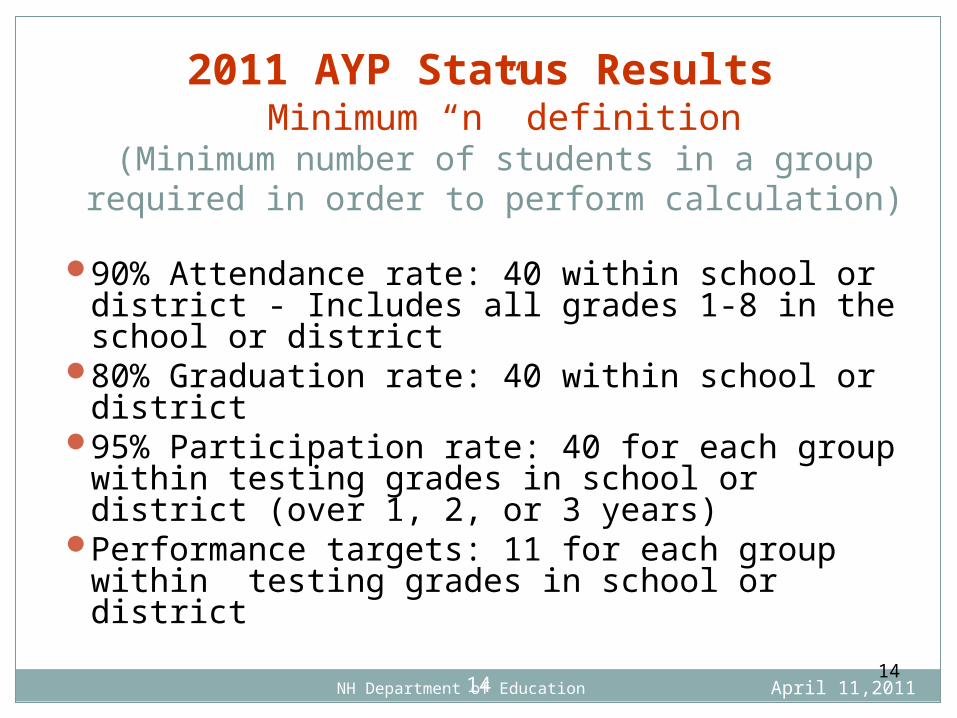
2011 AYP Status Results Minimum “n” definition
(Minimum number of students in a group required in order to perform calculation)
90% Attendance rate: 40 within school or district - Includes all grades 1-8 in the school or district
80% Graduation rate: 40 within school or district
95% Participation rate: 40 for each group within testing grades in school or district (over 1, 2, or 3 years)
Performance targets: 11 for each group within testing grades in school or district
1414
2011 AYP Status Results Basic Calculation
April 11,2011NH Department of Education
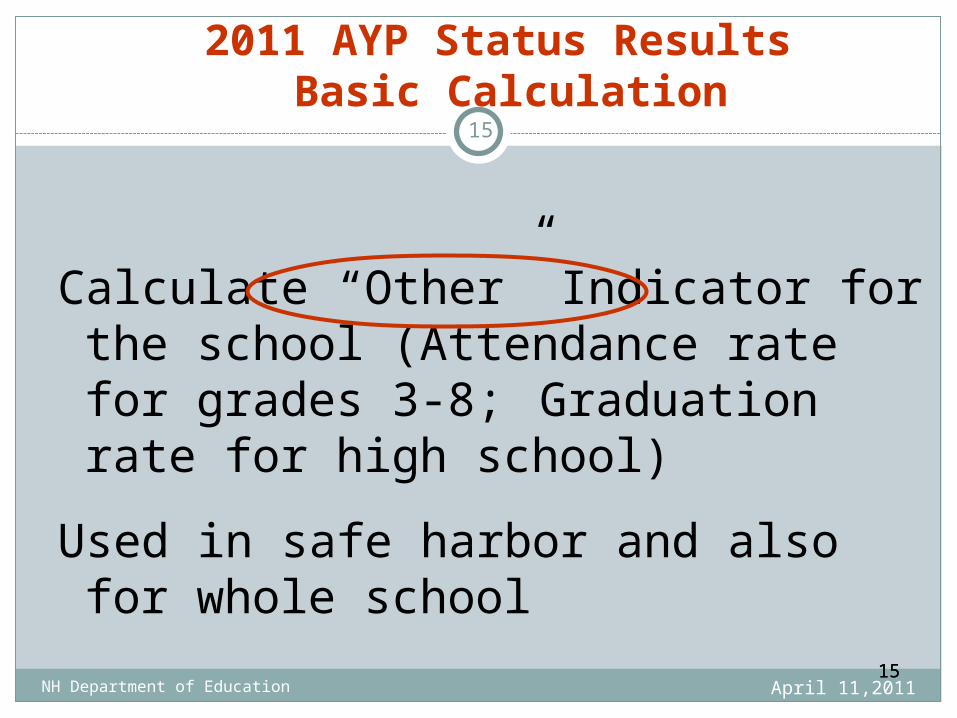
Calculate “Other” Indicator for the school (Attendance rate for grades 3-8; Graduation rate for high school)
Used in safe harbor and also for whole school
1515
15
April 11,2011 NH Department of Education16
2011 AYP Status Results Basic Calculation
April 11,2011NH Department of Education
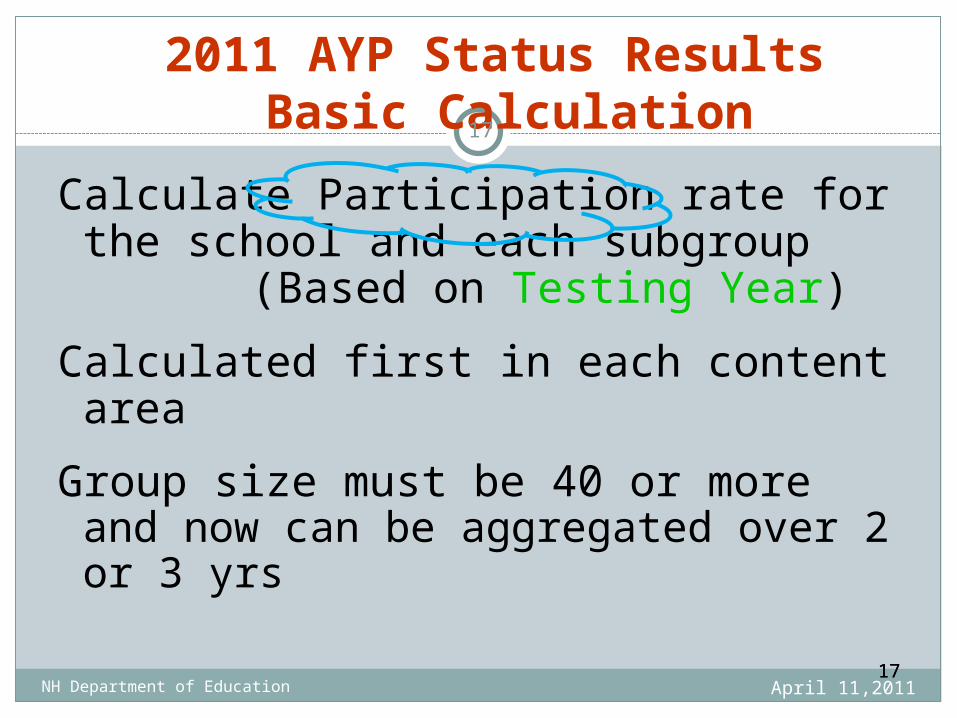
Calculate Participation rate for the school and each subgroup (Based on Testing Year)
Calculated first in each content area
Group size must be 40 or more and now can be aggregated over 2 or 3 yrs
1717
17
April 11,2011NH Department of Education 18

April 11,2011NH Department of Education
2011 AYP Status Results Basic Calculation
1919
Calculate Performance for the school as a whole and each subgroup
Performance is based on students with an average daily membership (ADM) of .90 or better for the teaching year – 2009-2010 school year
–Calculate Index (Compare to AMO target)
–If not OK, check confidence interval (99%)
–If still not OK, check safe harbor19
April 11,2011NH Department of Education 20
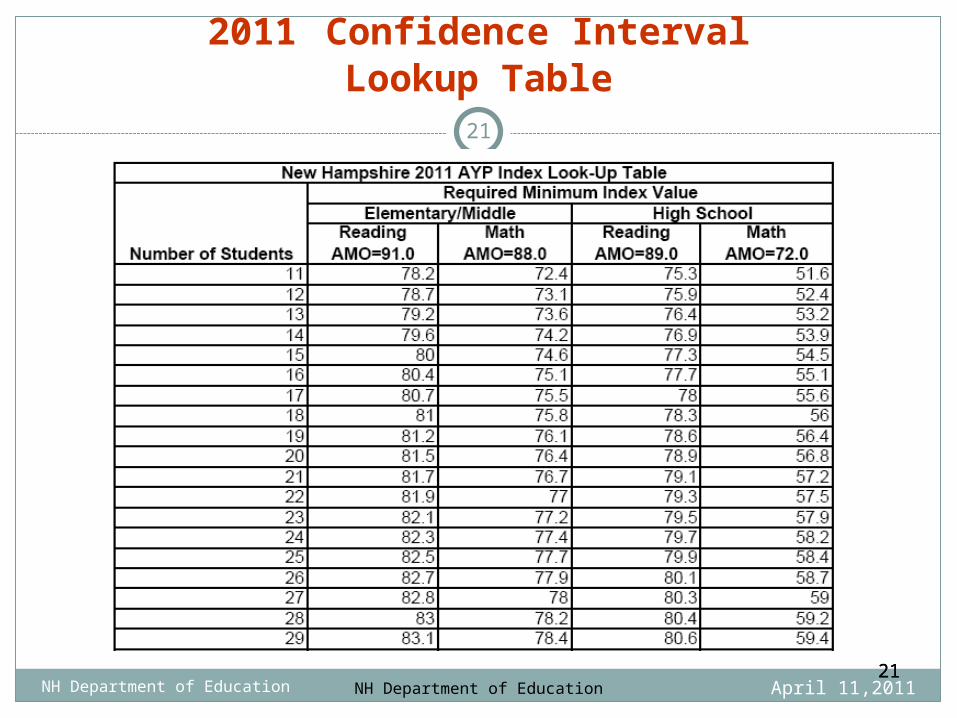
2011 Confidence IntervalLookup Table
April 11,2011NH Department of Education2121
NH Department of Education
21
April 11,2011NH Department of Education
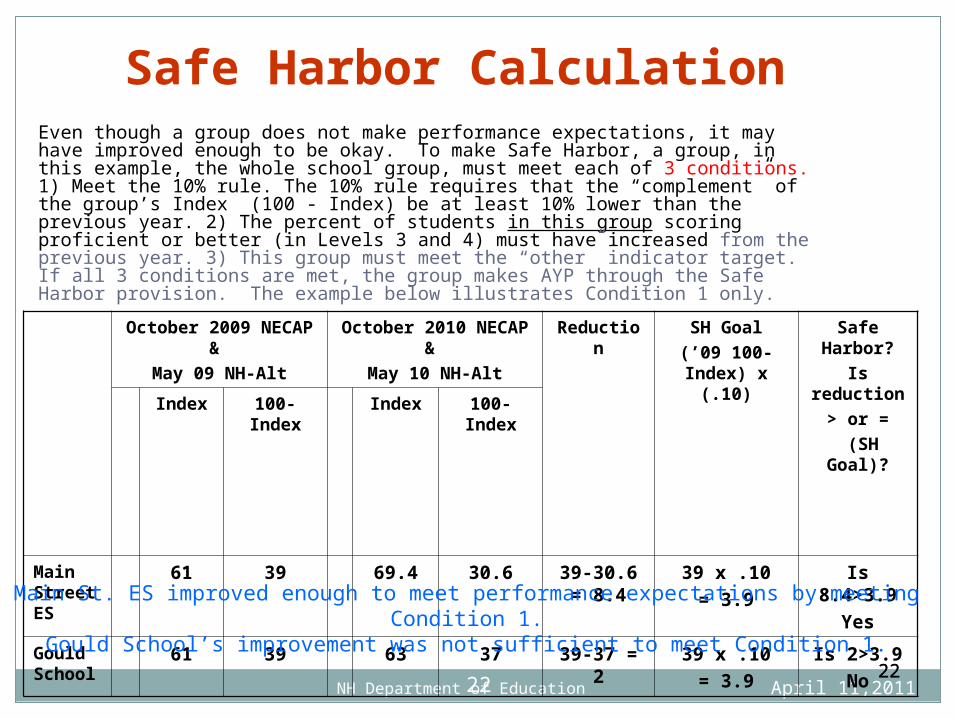
Safe Harbor CalculationEven though a group does not make performance expectations, it may have improved enough to be okay. To make Safe Harbor, a group, in this example, the whole school group, must meet each of 3 conditions. 1) Meet the 10% rule. The 10% rule requires that the “complement” of the group’s Index (100 - Index) be at least 10% lower than the previous year. 2) The percent of students in this group scoring proficient or better (in Levels 3 and 4) must have increased from the previous year. 3) This group must meet the “other” indicator target. If all 3 conditions are met, the group makes AYP through the Safe Harbor provision. The example below illustrates Condition 1 only.
October 2009 NECAP &
May 09 NH-Alt
October 2010 NECAP &
May 10 NH-Alt
Reduction SH Goal
(’09 100-Index) x (.10)
Safe Harbor?
Is reduction
> or =
(SH Goal)?
Index 100-Index Index 100-Index
Main Street ES
61 39 69.4 30.6 39-30.6 = 8.4
39 x .10
= 3.9
Is 8.4>3.9
Yes
Gould School
61 39 63 37 39-37 = 2 39 x .10
= 3.9
Is 2>3.9
No
2222
Main St. ES improved enough to meet performance expectations by meeting Condition 1.
Gould School’s improvement was not sufficient to meet Condition 1.
22
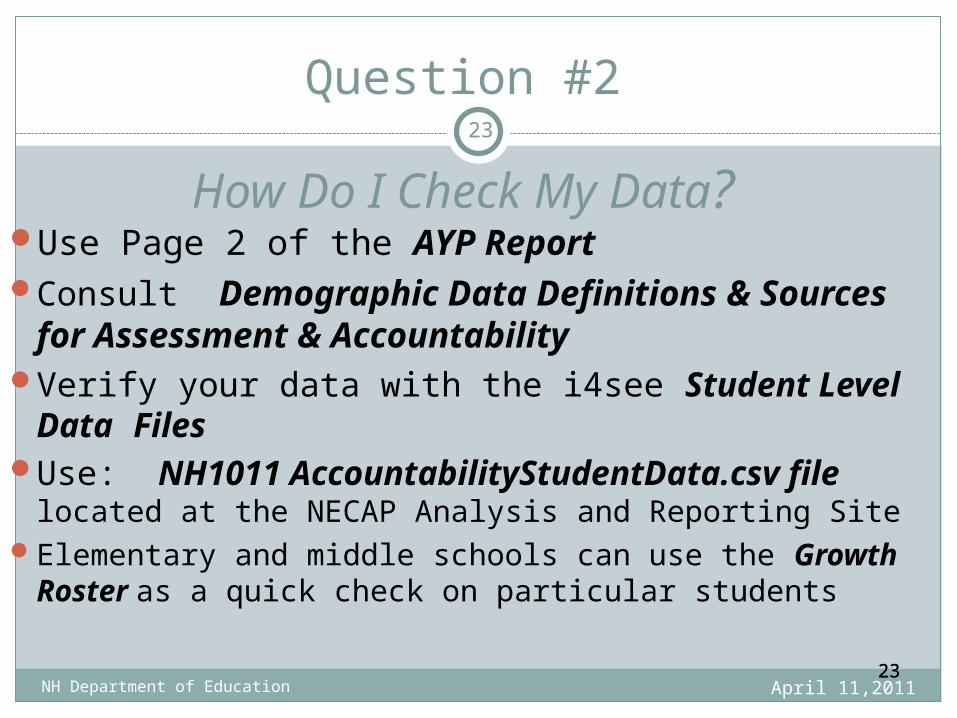
Question #2
How Do I Check My Data?
April 11,2011NH Department of Education
Use Page 2 of the AYP ReportConsult Demographic Data Definitions &
Sources for Assessment & AccountabilityVerify your data with the i4see Student Level
Data Files Use: NH1011
AccountabilityStudentData.csv file located at the NECAP Analysis and Reporting Site
Elementary and middle schools can use the Growth Roster as a quick check on particular students 2323
23

April 11,2011NH Department of Education2424
24
April 11,2011NH Department of Education2525
Found at http://www.ed.state.nh.us/education/doe/organization/curriculum/Assessment/AYP/2010/demographics.pdf
April 11,2011NH Department of Education
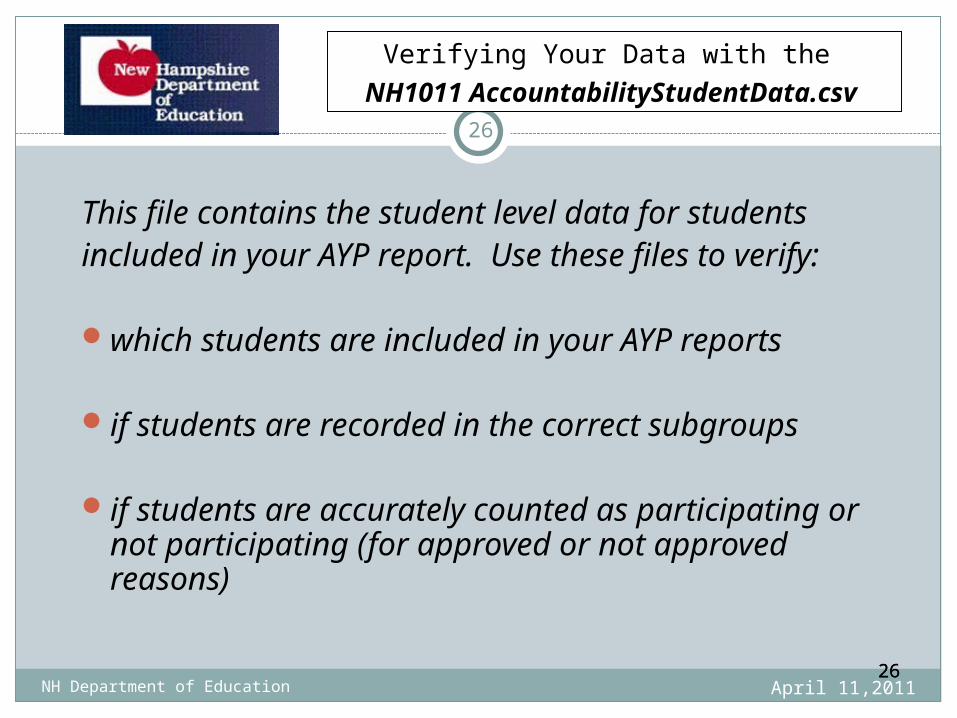
This file contains the student level data for studentsincluded in your AYP report. Use these files to verify:
which students are included in your AYP reports
if students are recorded in the correct subgroups
if students are accurately counted as participating or not participating (for approved or not approved reasons)
2626
Verifying Your Data with the
NH1011 AccountabilityStudentData.csv
26
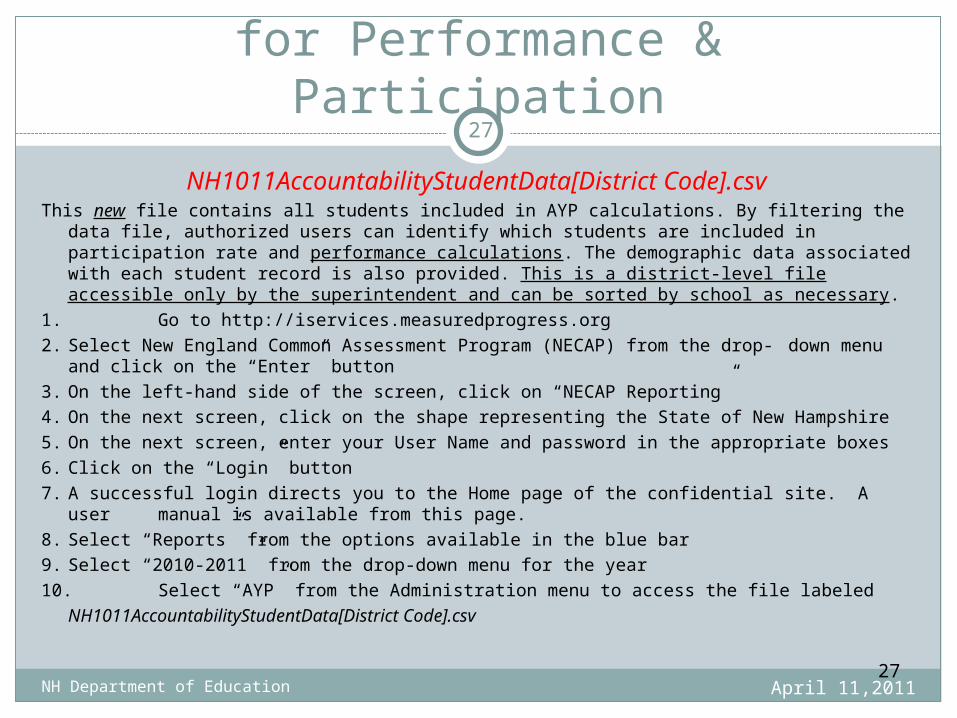
April 2011 AYP Student Level Data for Performance & Participation
April 11,2011NH Department of Education
NH1011AccountabilityStudentData[District Code].csvThis new file contains all students included in AYP calculations. By filtering the data file,
authorized users can identify which students are included in participation rate and performance calculations. The demographic data associated with each student record is also provided. This is a district-level file accessible only by the superintendent and can be sorted by school as necessary.
1. Go to http://iservices.measuredprogress.org2. Select New England Common Assessment Program (NECAP) from the drop- down
menu and click on the “Enter” button3. On the left-hand side of the screen, click on “NECAP Reporting”4. On the next screen, click on the shape representing the State of New Hampshire5. On the next screen, enter your User Name and password in the appropriate boxes6. Click on the “Login” button7. A successful login directs you to the Home page of the confidential site. A user manual is
available from this page.8. Select “Reports” from the options available in the blue bar9. Select “2010-2011” from the drop-down menu for the year10. Select “AYP” from the Administration menu to access the file labeled
NH1011AccountabilityStudentData[District Code].csv
27
27

April 11,2011NH Department of Education 28
Var Num
Variable Length Description Values
1 enrDiscode 3 Enrolled District Code Numeric2 enrSchcode 5 Enrolled School Code Numeric3 tchDiscode 3 Teaching District Code Numeric, blank4 tchSchcode 5 Teaching School Code Numeric, blank5 tstDiscode 3 Testing District Code Numeric6 tstSchcode 5 Testing School Code Numeric
7enrSendDiscode
3 Enrolled Sending District Code Numeric, blank
8tchSendDiscode
3 Teaching Sending District Code Numeric, blank
9 tstSendDiscode 3 Testing Sending District Code Numeric, blank
10 enrschtype 3 Enrolled School Type
PUB=Public School,PRI=Private School,OOD=Out of District,CHA=Charter School
11 tchschtype 3 Teaching School Type
PUB=Public School,PRI=Private School,OOD=Out of District,CHA=Charter School
12 tstschtype 3 Testing School Type
PUB=Public School,PRI=Private School,OOD=Out of District,CHA=Charter School
13 StuStatus 1 Student Reporting Status
0=Publically Funded,1=Homeschooled,2=Privately funded,3=Exchange student,4=Excluded state
14 bookletnumber 10 Bookletnumber 2010 Numeric15 Lname 20 Last Name Alpha, blank16 Fname 11 First Name Alpha, blank17 MI 1 Middle Initial Alpha, blank18 Bday 2 Birth day 01-31, blank19 Bmonth 2 Birth month 01-12, blank20 Byear 4 Birth year 1900-2999, blank
21 Grade 2
Fall 2010 grade (NECAP Testing Year) for all students still in the state. For NH-Alt students who are no longer enrolled, NH-Alt grade plus one.
03-08,11
22 AltGrade 2Reported Grade for Alt. Blank for NECAP Students
02-08,10, 11, blank
23 LEPFirstYear 1LEP First Year based on the November 2010 ESS Submission
1=Yes, 0=No
24 tchContDis 1 Teaching Full Academic Year District 1=Yes, 0=No25 tchContSch 1 Teaching Full Academic Year School 1=Yes, 0=No
April 11,2011NH Department of EducationApril 6, 2009 2929
NH Department of Education29

April 11,2011NH Department of Education
Grades 3-8 and Grade 11 NECAP
Achievement LevelsNECAP Cut points Commissioners from VT, RI, and NH adopted cut points for Grades 3-8 in January, 2006
and for Grade 11 in January, 2008. Proficiency at the student level includes performance at achievement levels 3 and 4.
While the 3 states share the same cut points and achievement levels for NECAP, each state has its own accountability (AYP) system.
Achievement Levels: Level 1: Substantially Below Proficient Level 2: Partially Proficient Level 3: Proficient Level 4: Proficient with Distinction
Scaled Scores are reported as a 3-digit number where the first digit is the grade level and the other part will be a score 00 to 80 (reported as whole numbers at the student level).
X40 is the reported cut point for Proficient.Grade 3: 300-380Grade 4: 400-480Grade 5: 500-580Grade 6: 600-680Grade 7: 700-780Grade 8: 800-880Grade 11: 1100-1180
303030
April 11,2011NH Department of Education
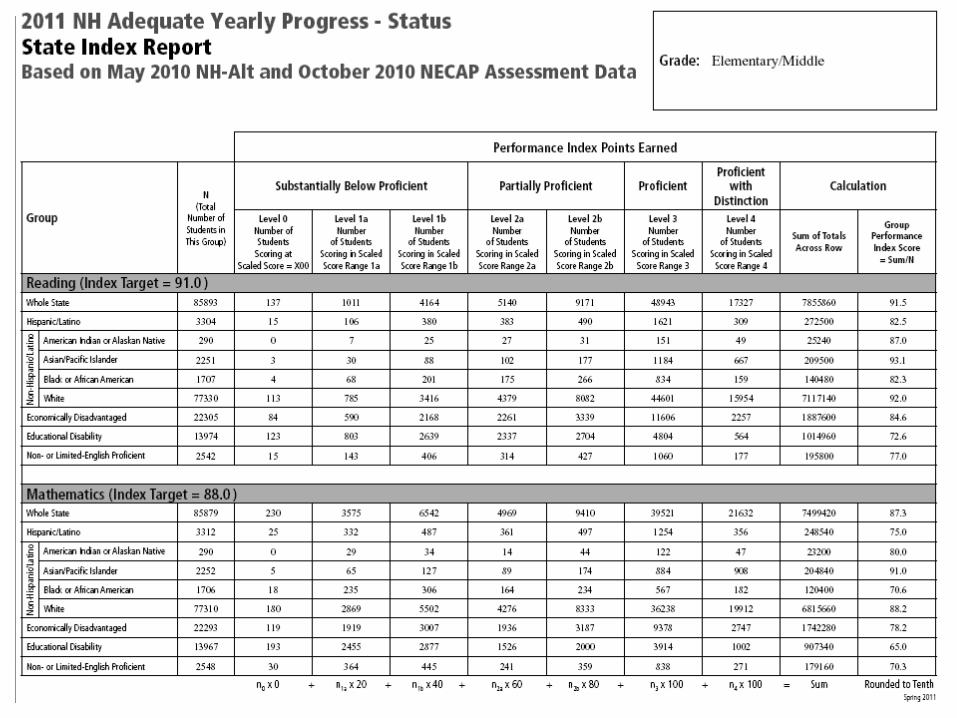
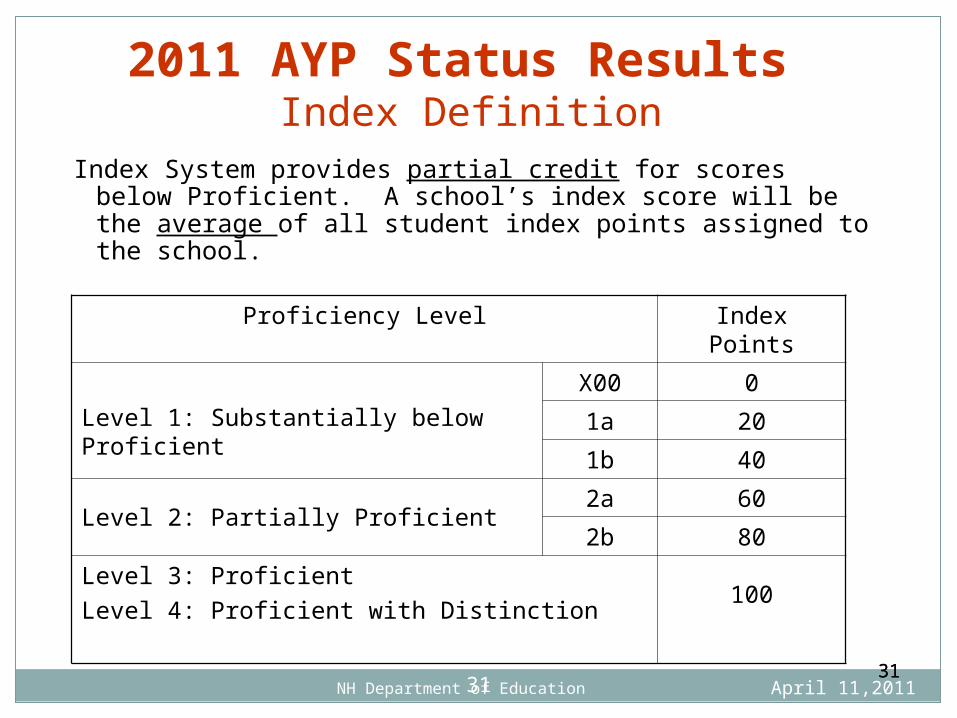
2011 AYP Status Results Index Definition
Index System provides partial credit for scores below Proficient. A school’s index score will be the average of all student index points assigned to the school.
Proficiency Level Index Points
Level 1: Substantially below Proficient
X00 0
1a 20
1b 40
Level 2: Partially Proficient2a 60
2b 80
Level 3: Proficient
Level 4: Proficient with Distinction100
313131
April 11,2011NH Department of Education
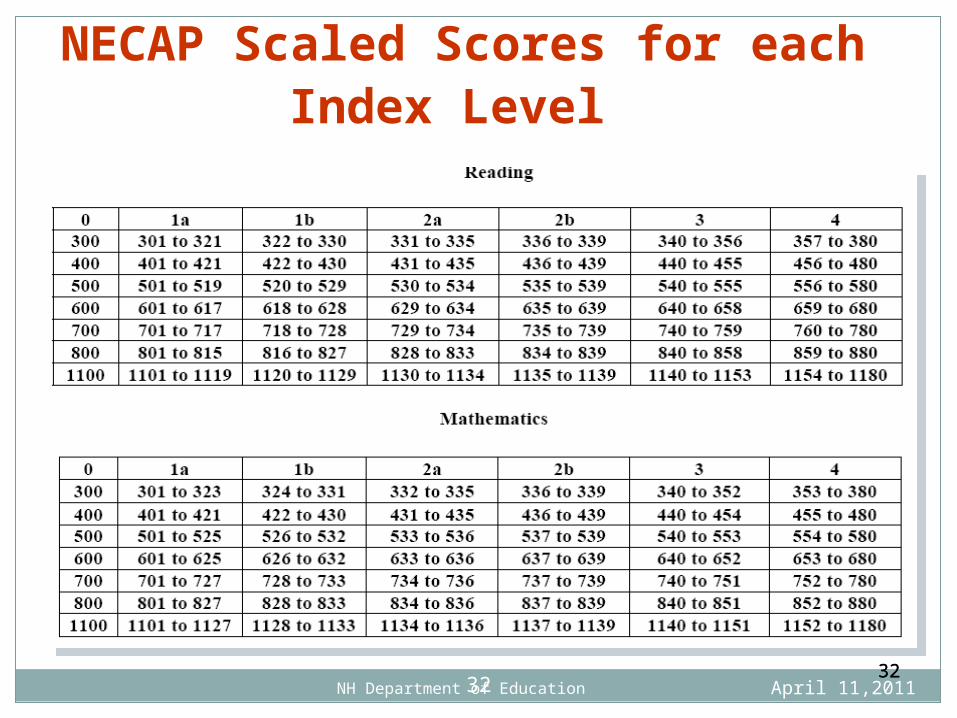
NECAP Scaled Scores for each Index Level
323232

April 11,2011NH Department of Education
Raw Score to Performance IndexConversion Table for NH-Alt
* The lowest score any scoreable portfolio can earn is 13 raw score points. ** A raw score of 0 is only possible if the portfolio submitted was judged to be
unscoreable by two trained and independent scorers.
Portfolio Raw Score Points Earned
Proficiency Level Performance Index Level
Performance Index Points Assigned
47-52 Proficient with Distinction 4 100
38-46 Proficient 3 100
34-37 Partially Proficient 2b 80
29-33 Partially Proficient 2a 60
21-28 Substantially Below Proficient 1b 40
13*-20 Substantially Below Proficient 1a 20
0** Un-scoreable (SBP) 0 0
333333
April 11,2011NH Department of Education
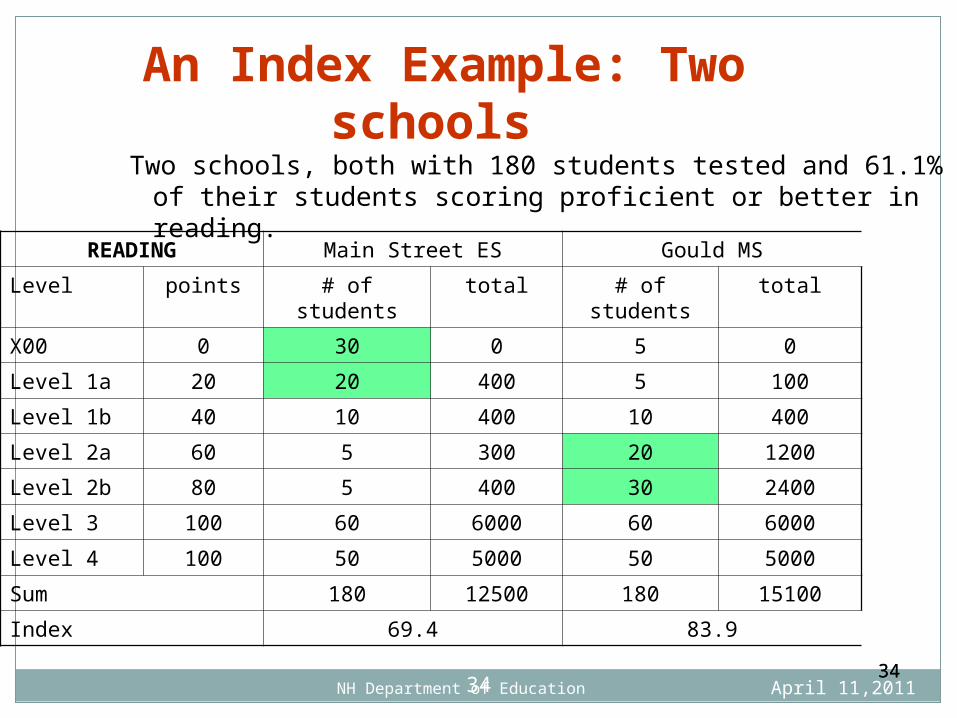
An Index Example: Two schools
Two schools, both with 180 students tested and 61.1% of their students scoring proficient or better in reading.
READING Main Street ES Gould MS
Level points # of students total # of students total
X00 0 30 0 5 0
Level 1a 20 20 400 5 100
Level 1b 40 10 400 10 400
Level 2a 60 5 300 20 1200
Level 2b 80 5 400 30 2400
Level 3 100 60 6000 60 6000
Level 4 100 50 5000 50 5000
Sum 180 12500 180 15100
Index 69.4 83.9
343434

Beyond Yes and No
April 11,2011NH Department of Education
It’s important to:look at ALL the data that led to the Yes or
No and the AYP designationNOT compare schools – especially within
the same district (unless you really look deeply at the data)
understand how schools and districts BECOME SINIs or DINIs – as well as how they EXIT from improvement status
focus on the teaching and learning and be able to show growth
35
35
How Did My School Become a SINI?
April 11,2011NH Department of Education
A school receives a designation as a School In Need of Improvement (SINI) if the school does not make AYP in the same content area (Reading or Mathematics) or the other academic indicator (attendance or graduation rate) for two consecutive years.
Only the content area matters – not the subgroup.
36
36
How Did My District Become a DINI?
April 11,2011NH Department of Education
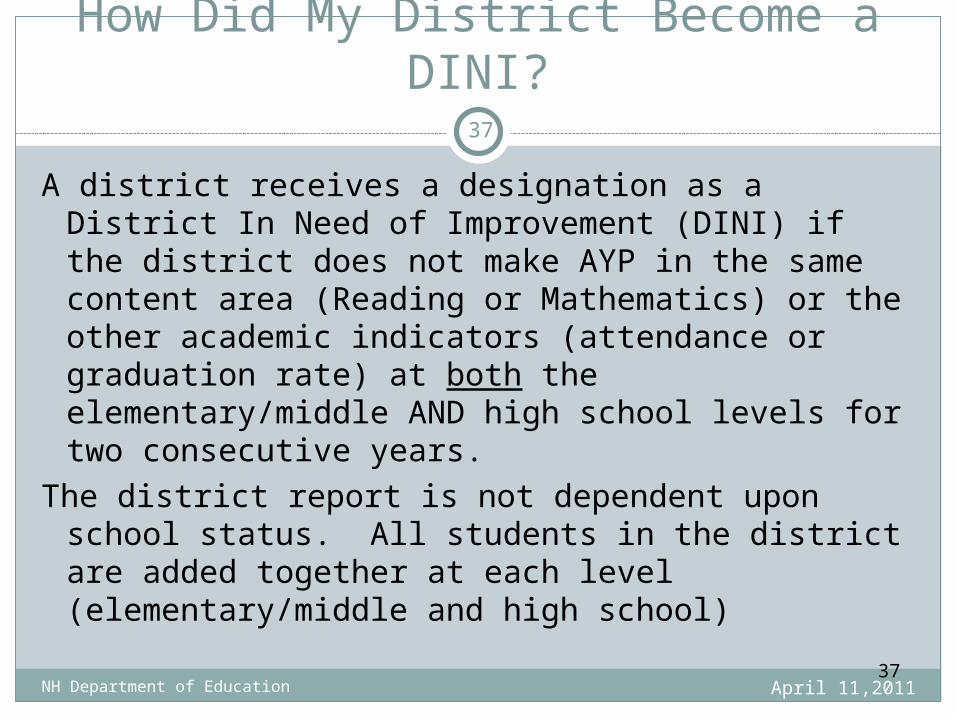
A district receives a designation as a District In Need of Improvement (DINI) if the district does not make AYP in the same content area (Reading or Mathematics) or the other academic indicators (attendance or graduation rate) at both the elementary/middle AND high school levels for two consecutive years.
The district report is not dependent upon school status. All students in the district are added together at each level (elementary/middle and high school)
37
37
How is District AYP Different from School AYP?
April 11,2011NH Department of Education
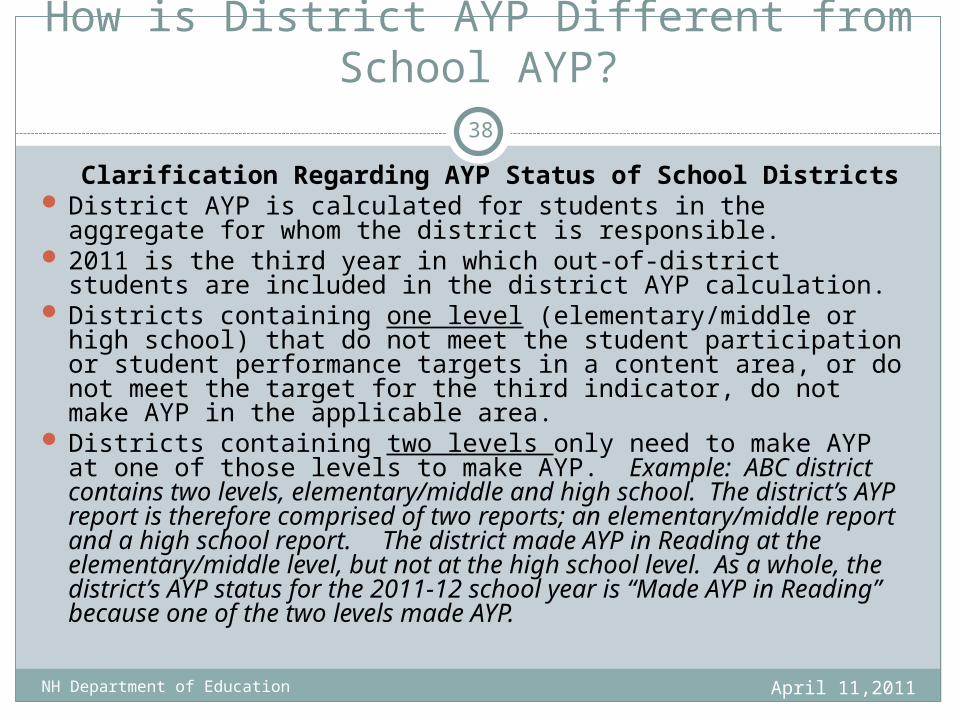
Clarification Regarding AYP Status of School Districts District AYP is calculated for students in the aggregate for
whom the district is responsible. 2011 is the third year in which out-of-district students are
included in the district AYP calculation. Districts containing one level (elementary/middle or high school)
that do not meet the student participation or student performance targets in a content area, or do not meet the target for the third indicator, do not make AYP in the applicable area.
Districts containing two levels only need to make AYP at one of those levels to make AYP. Example: ABC district contains two levels, elementary/middle and high school. The district’s AYP report is therefore comprised of two reports; an elementary/middle report and a high school report. The district made AYP in Reading at the elementary/middle level, but not at the high school level. As a whole, the district’s AYP status for the 2011-12 school year is “Made AYP in Reading” because one of the two levels made AYP.
38

How do we exit SINI/DINI status?
April 11,2011NH Department of Education
To exit SINI status, the school must make AYP for two consecutive years in the area(s) that caused the SINI designation.
To exit DINI status, the district must make AYP for two consecutive years in the area(s) that caused the DINI designation. Districts with two levels need only make AYP at one level to make AYP.
Questions on AYP?Questions on Growth Reports?
39
April 11,2011NH Department of Education
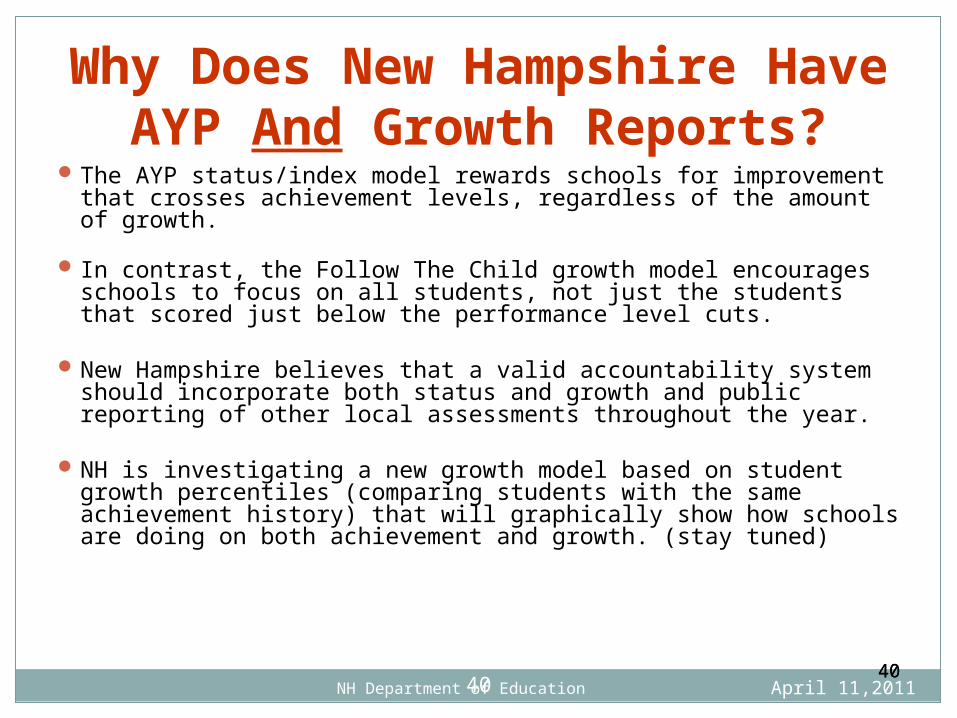
Why Does New Hampshire Have AYP And Growth
Reports?The AYP status/index model rewards schools for improvement that crosses achievement levels, regardless of the amount of growth.
In contrast, the Follow The Child growth model encourages schools to focus on all students, not just the students that scored just below the performance level cuts.
New Hampshire believes that a valid accountability system should incorporate both status and growth and public reporting of other local assessments throughout the year.
NH is investigating a new growth model based on student growth percentiles (comparing students with the same achievement history) that will graphically show how schools are doing on both achievement and growth. (stay tuned)
404040

April 11,2011NH Department of Education
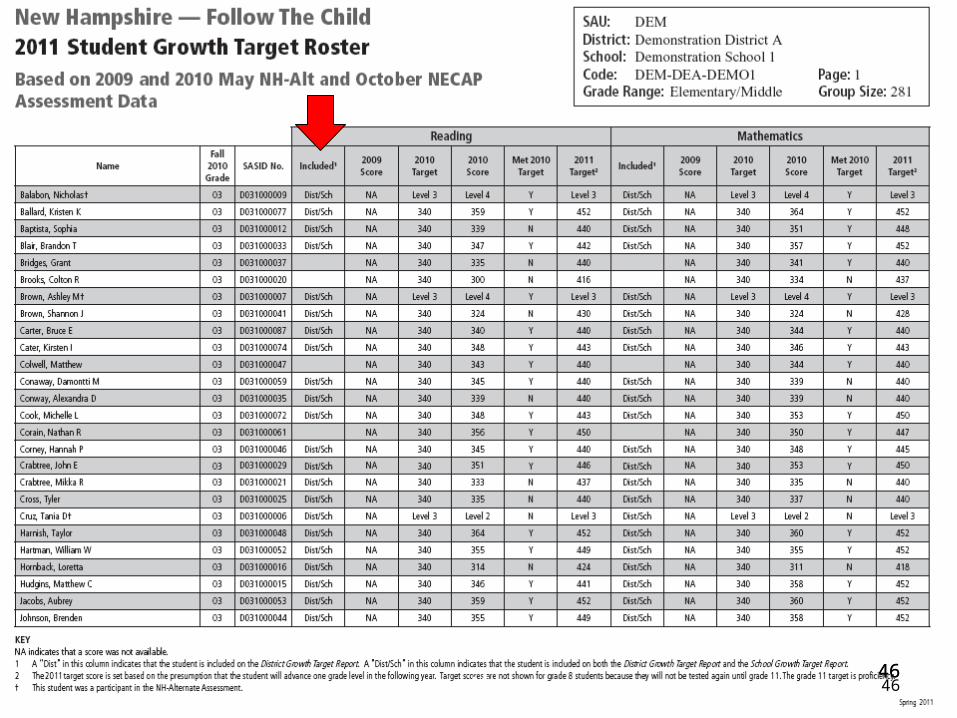
What is the NH Follow The Child Growth Model?
We calculate growth targets for EVERY student, and tally the number of students meeting or exceeding their target
The targets are based on the previous year’s NECAP score – and if no NECAP score is available, the target is proficiency
Targets are based on the distance to proficiency – closing the gap (as measured by the number of standard deviations below proficiency) This ensures comparability between grades
If students are already proficient, the target is designed to encourage a level that exceeds proficiency 4141
41

April 11,2011NH Department of Education4242
42

April 11,2011NH Department of Education
NH Follow The Child Growth Expectations
4343
>1 SD below
½ to 1 SD below
0 to ½ SD below
0 to ¼ SD above
¼ to 1¼ SD above
> 1 ¼ SD above
Narrow gap to prof. by one third of the # of SD below
Narrow gap to prof. by one half of the # of SD below
Proficiency
Drop by no more than ¼ SD
Stay at least 1 SD above prof.
Previous NECAP scaled score.
Targets for next testing cycle.
43
April 11,2011NH Department of Education
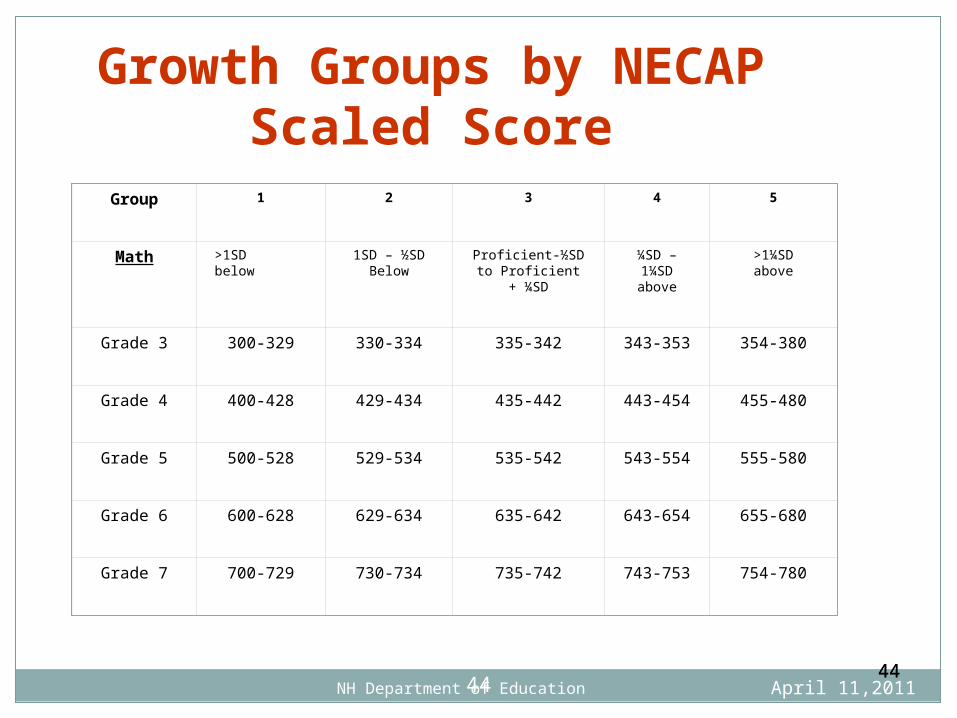
Growth Groups by NECAP Scaled Score
4444
Group 1 2 3 4 5
Math >1SDbelow
1SD – ½SDBelow
Proficient-½SD to Proficient + ¼SD
¼SD – 1¼SDabove
>1¼SDabove
Grade 3 300-329 330-334 335-342 343-353 354-380
Grade 4 400-428 429-434 435-442 443-454 455-480
Grade 5 500-528 529-534 535-542 543-554 555-580
Grade 6 600-628 629-634 635-642 643-654 655-680
Grade 7 700-729 730-734 735-742 743-753 754-780
44

April 11,2011NH Department of Education
Reading Growth Targets
4545
Grades 3 to 4 Grades 4 to 5 Grades 5 to 6 Grades 6 to 7 Grades 7 to 8
Score Target Score Target Score Target Score Target Score Target
300 416 400 513 500 612 600 713 700 814
301 416 401 514 501 612 601 714 701 814
302 417 402 514 502 613 602 714 702 815
303 417 403 515 503 614 603 715 703 816
304 418 404 516 504 614 604 716 704 816
305 419 405 516 505 615 605 716 705 817
306 419 406 517 506 616 606 717 706 818
307 420 407 518 507 617 607 718 707 818
308 420 408 518 508 617 608 718 708 819
309 421 409 519 509 618 609 719 709 820
310 422 410 520 510 619 610 720 710 820
Complete reading and mathematics growth targets charts available at:http://www.education.nh.gov/innovations/follow_child/documents/math_growth_targets.pdfhttp://www.education.nh.gov/innovations/follow_child/documents/reading_growth_targets.pdf 45
April 11,2011NH Department of Education46464646
April 11,2011NH Department of Education
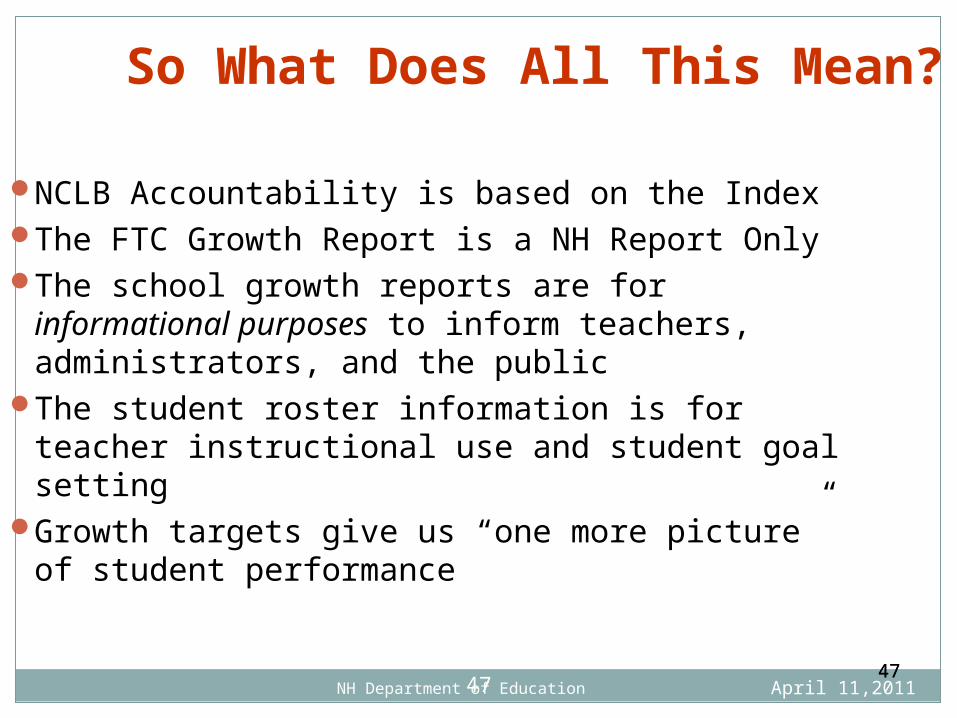
So What Does All This Mean?
NCLB Accountability is based on the IndexThe FTC Growth Report is a NH Report OnlyThe school growth reports are for
informational purposes to inform teachers, administrators, and the public
The student roster information is for teacher instructional use and student goal setting
Growth targets give us “one more picture” of student performance
474747

What is an Accountability System?
April 11,2011NH Department of Education
State Standards - Curriculum Frameworks- Standards for School Approval- NH Learning Progressions for NH-ALPs
Valid & Reliable Assessment System- state assessment s (NECAP & NH-Alt)- local formative, benchmark & competency based assessments
Data Analysis Tools- Performance Tracker- Assessment Builder
Accountability Reporting - Assessment Reports - NCLB AYP Status Reports - NH Growth Reports - Combined Reports - Developing NH System for determining
Adequacy that will include NH Accountability School Reports
Statewide System of Support-Technical Assistance (content, data, special education, leadership, RtI,NH-Alt)- Leadership/ PD Institutes- Literacy Action Plan- Numeracy/ Quantitative Literacy Plan- Ongoing PD - DINI support- High School Vision Statement- High School Redesign/ Competencies- Extended Learning Opportunites- Special Education Focused
Monitoring- Root Cause Analysis and other tools for School Improvement- RTI Task Force and Guidance- NH RESPONDS- PBIS
4848
48
April 11,2011NH Department of Education
Contact InformationDeb Wiswell (Accountability & School Improvement))
Merry Fortier (School Improvement and Appeals)[email protected]
Tim Kurtz (NECAP and AYP data)[email protected]
Gaye Fedorchak (NECAP Accommodations, NECAP and NH-Alt Data)
494949