Embed Size (px)
Citation preview


NYC-ZPR00111-002
April 12, 2011
Oliver Wyman report: Assessment of the impact of the Department of Labor’s proposed “fiduciary” definition rule on IRA consumers

Oliver Wyman
NYC-ZPR00111-002
Copyright © 2011 Oliver Wyman Copyright © 2011 Oliver Wyman Inc. All rights reserved. This report may not be reproduced or redistributed, in whole or in part, without the written permission of Oliver Wyman, and Oliver Wyman accepts no liability whatsoever for the actions of third-parties in this respect. This report may not be sold without the written consent of Oliver Wyman. This report is intended to be read and used as a whole and not in parts. Separation or alteration of any section or page from the main body of this report is expressly forbidden and invalidates this report. All opinions, advice and materials provided by Oliver Wyman are included, reflected or summarized herein as the “Oliver Wyman Content”. There are no third-party beneficiaries with respect to the Oliver Wyman Content, and Oliver Wyman disclaims any and all liability to any third-party. In particular, Oliver Wyman shall not have any liability to any third-party in respect of the Oliver Wyman Content or any actions taken or decisions made as a consequence of the results, advice or recommendations set forth herein. The Oliver Wyman Content does not represent investment advice or provide an opinion regarding the fairness of any transaction to any and all parties. The opinions expressed in the Oliver Wyman Content are valid only for the purpose stated herein and as of the date hereof. Information furnished by others, upon which all or portions of the Oliver Wyman Content are based, is believed to be reliable but has not been verified. No warranty is given as to the accuracy of such information. Public information and industry and statistical data are from sources Oliver Wyman deems to be reliable; however, Oliver Wyman makes no representation as to the accuracy or completeness of such information and has accepted the information without further verification. No responsibility is taken for changes in market conditions or laws or regulations and no obligation is assumed to revise the Oliver Wyman Content to reflect changes, events or conditions, which occur subsequent to the date hereof.

Copyright © 2011 Oliver Wyman
NYC-ZPR00111-002
1
About this study On behalf of a group of 12 financial services firms that offer services to retail investors, Davis and Harman LLP engaged Oliver Wyman to analyze the impact on Individual Retirement Account (IRA) investors of the Department of Labor’s proposed change to the rule defining a “fiduciary” for purposes of the Employee Retirement Income Security Act of 1974 (“ERISA”) and section 4975 of the Internal Revenue Code of 1986, as amended (the “Code”). The firms participating in this study collectively represent over 19 million IRA holders who hold $1.79 trillion in assets through 25.3 million IRA accounts. This constitutes approximately 40% of IRAs in the United States and 40% of IRA assets. Due to the highly sensitive nature of firm-specific information, all data is presented in aggregated form in this report. In particular, Oliver Wyman was asked to evaluate the potential impact, if enacted, of the proposed rule change on smaller retail IRA investors with respect to: 1. access to investment help and services from a licensed investment professional, 2. choice of investment professional, relationship model in terms of commission-based
brokerage versus single fee, “wrap” investment advisory accounts, as well as breadth of product choice, and
3. cost impact to IRA holders.

Copyright © 2011 Oliver Wyman
NYC-ZPR00111-002
2
Summary of key findings IRAs are the fastest growing accounts holding retirement savings. IRAs are widely held by small investors. Nearly 40% of IRAs in the study sample had less than $10,000. Small investors overwhelmingly favor brokerage relationships over advisory relationships. 98% of investor accounts with less than $25,000 were in brokerage relationships.
The proposed rule could eliminate access to meaningful investment services for over 7 million IRAs. IRA investors would no longer be able to receive investment services and help from
an investment professional as part of a brokerage relationship. Because of account minimums, 7.2 million current IRAs would not qualify for an
advisory account with any firm in the study. The proposed rule could well result in hundreds of thousands of fewer IRAs opened per year. In 2010, firms in the study sample opened approximately 890,000 brokerage IRA
accounts with assets of less than $10,000. Under the proposed rule, small investors interested in opening an IRA would have
less access to investment professionals for guidance and support, making it less likely that they would open an IRA.
Many IRA holders would have reduced choice of investment professional, as over one-third of client-facing financial professionals in the industry would not be licensed to help retail investors with their IRA account needs under the proposed rule. The brokerage IRA investors who could be served in an advisory model would likely face increased costs as a result of the rule-driven change. In the study sample, estimated direct costs would increase by approximately 75% to
195% for these investors.

Copyright © 2011 Oliver Wyman
NYC-ZPR00111-002
3
1. The outlook for U.S. retirement savings and the role of the IRA Personal retirement savings are an essential part of funding the future retired population As is well documented in numerous studies, the U.S. population is aging. The number of retired Americans aged 65 or over is projected to swell nearly 80% to 72 million by 2030 compared to 40 million today.
Figure 1: The U.S. population is aging
Increase in the 65 and over population, 2010 – 2030
NYC-ZPR00111-002
72 MM
40 MM
2010 2030
19% of total population
13% of total population
The number of individuals aged 65 and older is projected to increase
79% between 2010 and 2030
Source: US Census Bureau 2008 release
NYC-ZPR00111-002
72 MM
40 MM
2010 2030
19% of total population
13% of total population
The number of individuals aged 65 and older is projected to increase
79% between 2010 and 2030
NYC-ZPR00111-002
72 MM
40 MM
2010 2030
19% of total population
13% of total population
The number of individuals aged 65 and older is projected to increase
79% between 2010 and 2030
Source: US Census Bureau 2008 release
At the same time, Americans increasingly need to take on far more proactive personal planning for their own retirement income. Former support mechanisms such as employer-sponsored defined benefit pension plans are disappearing (over 65% of individuals with an employer-sponsored retirement plan were in a defined benefit pension plan at the end of the 1980s, compared with only 36% of individuals by the mid 2000s1). Furthermore, the Social Security system is coming under increasing stress amid U.S. funding and budgetary issues as the population skews towards older individuals in the savings decumulation period of their lives. We estimate total personal financial assets in the U.S. today amount to $53 trillion, of which $40 trillion can be considered investable.2 As Figure 2 shows, the growth outlook for many of the major asset classes is challenged, which we expect will increase the 1 ICI, 2009, EBRI Databook 2 Oliver Wyman analysis, Federal Flow of Funds, Cerulli, American Council of Life Insurers

Copyright © 2011 Oliver Wyman
NYC-ZPR00111-002
4
importance of personal retirement savings. Of the total, approximately $20.4 trillion constitute specific retirement assets in the form of IRAs, pensions, life insurance and annuities.
Figure 2: Retirement assets constitute ~$20 TN of the total $40 TN of investable personal financial assets in the U.S.
U.S. personal retirement assets, year-end 2010
NYC-ZPR00111-002
Source: Oliver Wyman analysis, Federal Flow of Funds, Cerulli, American Council of Life Insurers1. Includes public sector DB plans and DC plans (Taft-Hartley, 403(b), 457), and private sector DB and DC plans (401(k), money purchase plans, profit sharing plans, Keoghs); category excludes those assets invested in annuities to avoid double-count2. Includes Federal DB plans (Civil Service Retirement Systems, FERES, Military Retirement Fund, National Railroad Retirement Trust, Railroad Retirement Board) and DC plans (Federal Thrift Savings Plan); excludes Social Security3. Includes general and segregated funds held on behalf of US policyholders and annuitants; excludes life insurance reserves 4. Includes Corporate equities, Mutual Fund Shares, Money Market Fund Shares, Credit market instruments less IRAs
$53 TNKey trends and outlook
GDP growth forecast cautiously optimistic but remains fragile Sluggish job growth
Declines in home price levels in post-crisis environment
The “lost decade”, flat market growth, and historically low interest rates driving search for return and yield
Fastest growing retirement product IRA assets now higher than DC pension assets
Continued shift from DB to DC and increasing number of plans closing
Core retirement product, especially for smaller investors Strong outlook
DB to DC trend starting to mirror the private sector
Continued post-crisis conservatism Anticipate a shift to other asset classes as investors reallocate
2010E
Private employer-sponsored retirement plans1
18%
IRA8%
3%
Cash and deposits
Life ins. and annuities39%
12%
Federal pensions2
Taxable investments424%
Home equity12%
Business equity13%
$20.4 TNin
retirement assets
$39.6 TNin
investable personal assets
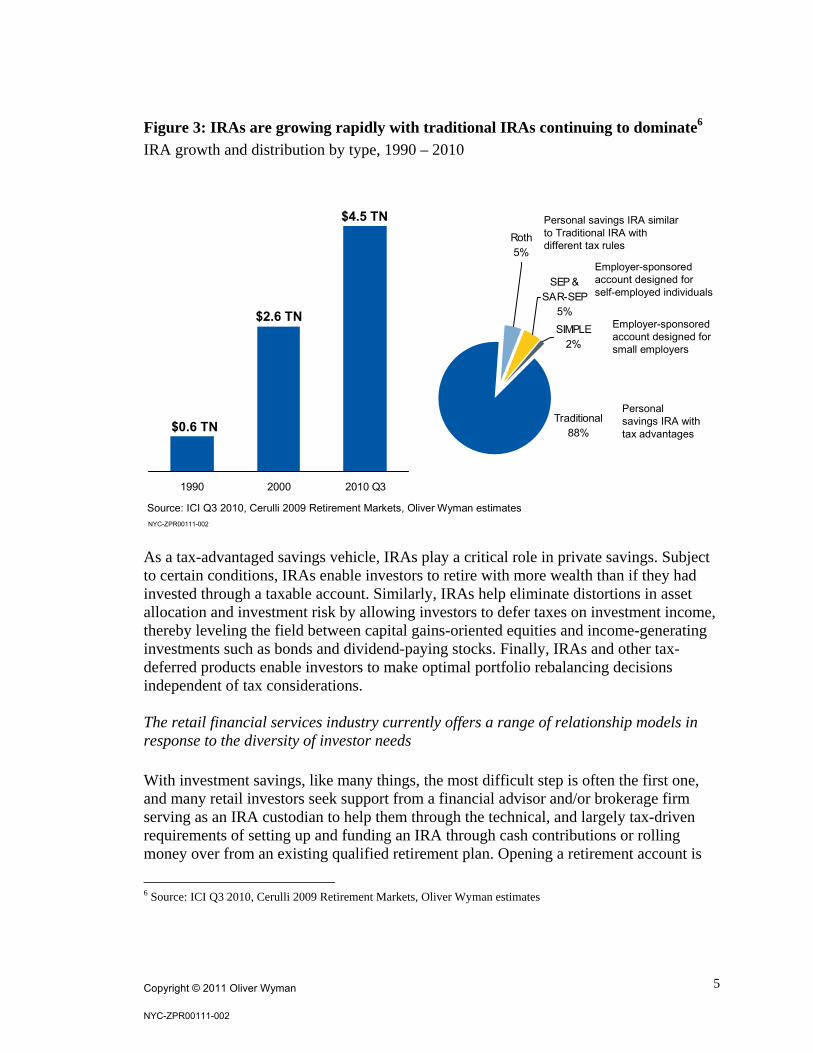
IRAs are a critical and rapidly growing part of U.S. retirement savings Since their introduction in 1974, IRAs have grown to represent around 8% of total personal financial assets in the U.S. today3, representing $4.5 trillion. 49 million U.S. households hold an IRA and for 8% of households IRAs represent the only form of retirement savings.4 IRAs are the fastest growing investment accounts holding retirement savings and have become an ever more important part of U.S. households’ future funding, increasing from 16% of retirement market assets to 27% in the 20 years from 1990 to 2010.5
3 Federal Flow of Funds, Cerulli, American Council of Life Insurers, Oliver Wyman Analysis 4 ICI, Research Fundamentals, 2010 5 ICI, The U.S. Retirement Market for Q3 2010, released 2011
Copyright © 2011 Oliver Wyman
NYC-ZPR00111-002
5
Figure 3: IRAs are growing rapidly with traditional IRAs continuing to dominate6
IRA growth and distribution by type, 1990 – 2010
SIMPLE2%
Roth5%
Traditional88%
SEP & SAR-SEP
5%
1990 2000 2010 Q3
$0.6 TN
$4.5 TN
$2.6 TNEmployer-sponsored account designed for small employers
Personal savings IRA similar to Traditional IRA with different tax rules
Employer-sponsored account designed for self-employed individuals
Personal savings IRA with tax advantages
NYC-ZPR00111-002
Source: ICI Q3 2010, Cerulli 2009 Retirement Markets, Oliver Wyman estimates
As a tax-advantaged savings vehicle, IRAs play a critical role in private savings. Subject to certain conditions, IRAs enable investors to retire with more wealth than if they had invested through a taxable account. Similarly, IRAs help eliminate distortions in asset allocation and investment risk by allowing investors to defer taxes on investment income, thereby leveling the field between capital gains-oriented equities and income-generating investments such as bonds and dividend-paying stocks. Finally, IRAs and other tax-deferred products enable investors to make optimal portfolio rebalancing decisions independent of tax considerations. The retail financial services industry currently offers a range of relationship models in response to the diversity of investor needs With investment savings, like many things, the most difficult step is often the first one, and many retail investors seek support from a financial advisor and/or brokerage firm serving as an IRA custodian to help them through the technical, and largely tax-driven requirements of setting up and funding an IRA through cash contributions or rolling money over from an existing qualified retirement plan. Opening a retirement account is
6 Source: ICI Q3 2010, Cerulli 2009 Retirement Markets, Oliver Wyman estimates

Copyright © 2011 Oliver Wyman
NYC-ZPR00111-002
6
just the beginning, however. It takes personal discipline to remain on track, and investors need to continue to make regular contributions to their account over a long time period in order to benefit from compounded growth of their investment savings. Investors seek a wide range of assistance – from more basic tax information and asset allocation modeling to sophisticated, investment-specific guidance from investment professionals. Two primary IRA business models have evolved to serve all investor types. These two primary channels through which individuals access IRA savings accounts are summarized in Figure 4 and described in further detail below.
Figure 4: There are two main IRA business models today
Key attributes of IRA business models
Investment services needs
Broad financial planning and investment advice
Product-specific investment information, access to principally-traded products and range of third party and proprietary products
Product-specific investment information, access to principally-traded products and range of third party and proprietary products
Level of service Personalized access to an investment professional
Highest ongoing advice and account surveillance
Personalized access to an investment professional
Information to help investors set up an IRA account and select suitable investments
Often offer access to an investment professional through a branch or call center
Online investment information, research, tools and calculators to help investors set up an IRA account and select suitable investments
Cost Tends to be highest cost Balanced cost, with costs based on level of trading activity
Lowest cost, depending on trading activity
Key AttributesFull service Discount
Advisory
NYC-ZPR00111-002
Brokerage
Advisory IRAs offer ongoing advice that may include investment-specific advice, portfolio monitoring, and account surveillance to determine both product-level investment suitability and account make-up. Advisory IRAs involve a relationship with a Registered Investment Adviser (RIA) or dual-registered broker-dealer/RIA. Fees on such IRA accounts are virtually always structured as a “wrap” fee (i.e. an annual client charge of a percentage of account assets).

Copyright © 2011 Oliver Wyman
NYC-ZPR00111-002
7
Brokerage IRAs are offered today in two ways: Full service brokerage IRAs, in which an investor makes investment decisions, and
has regular access to a registered broker representative, plus a range of investment solutions. This typically involves non-continuous, point-in-time help and investment services. In this approach, the brokerage firms are compensated through transaction-specific direct commissions, annual account fees, and various “indirect” sources of compensation (such as marketing and distribution fees paid by mutual funds).
Discount brokerage IRAs, in which an investor makes investment decisions with
more limited personal contact (which may occur at a branch or call center), and which often have a full suite of tools to help investors evaluate investment products and transact online. Discount brokerage relationships often have reduced transaction-specific direct commissions, account fees, and indirect compensation.
These two IRA channels have different service models, with different underlying cost structures. Fee-based advisory IRAs involve a number of services that are not present in either of the brokerage channels, such as: Ongoing fund and manager research Ongoing account surveillance Detailed investment performance modeling Formalized asset allocation modeling Ability for the financial advisor or the firm to utilize discretion with respect to the
accounts (a feature in most advisory programs) Offering these services to advisory investors involves higher costs to the provider, reflecting the required technology investment and compensation for the time financial advisors and support personnel need to spend on each account. In addition, pricing of advisory relationships must reflect the overall liability risk of such relationships. Pricing for the different IRA channels reflects these different underlying cost structures. Accordingly, fee-based advisory IRAs generally represent the highest service level and cost channel for investors.
2. Proposed changes to IRA regulation In October 2010, the U.S. Department of Labor's Employee Benefits Security Administration announced a proposed rule change to the definition of “fiduciary investment advice” for ERISA-covered qualified retirement plans and IRAs. The proposed change would greatly expand the range of conditions under which an individual who merely provides investment services in a brokerage context would be subject to ERISA fiduciary rules. After receiving a significant amount of public commentary about

Copyright © 2011 Oliver Wyman
NYC-ZPR00111-002
8
the proposed change, the Department of Labor held public hearings on March 1 and 2, 2011, and subsequently opened a 15-day window to receive additional comments. Given the magnitude of potential change for both investors and providers, and a lack of sufficiently granular publicly-available data, Davis and Harman LLP engaged Oliver Wyman on behalf of a group of 12 financial services firms offering retail investment services to analyze the potential impact of the proposed rule on IRA investors. The group of firms participating in this study contributed proprietary firm-level data on their IRAs to create a large sample of IRA market participants. In particular, Oliver Wyman was asked to use the aggregated dataset to analyze the proposed rule with respect to its potential impact on investors’ access to investment services and help; investors’ choice of relationship model, advisor, and product set; and investors’ cost of service. The study sample in this report provides a unique window onto today’s IRA investors, as well as the distribution of key account characteristics such as size and type of account The aggregate study sample provides an unprecedented view into the range of IRA account characteristics. The participant group in this study represents 40% of both total IRA assets and number of accounts in the U.S. A comparison with publicly available data suggests that the sample broadly mirrors the entire IRA market in type of IRAs held, age of IRA holders, and asset allocation.

Copyright © 2011 Oliver Wyman
NYC-ZPR00111-002
9
Figure 5: The study sample data appears to be highly representative of the total U.S. IRA investor population
Comparison of study sample data to total U.S. IRA population
NYC-ZPR00111-002
Source: Cerulli 2008, Oliver Wyman study sampleNote: Asset composition follows Cerulli data; for Oliver Wyman study, life insurance includes variable annuities; bank and thrift includes cash and cash equivalents, UITs, REITS, etc.; brokerage includes fixed income and equity individual securities, structured products, and alternatives
Source: Investment Company Institute 2010, Oliver Wyman study sampleNote: Public data indicates age of the sole or co-decision maker for household savings and investment; Oliver Wyman data indicates age of individuals holding IRAs
Source: Investment Company Institute 2010, Oliver Wyman study sample
IRA assets by type of account IRA owners by age segment IRA assets by investment product
89% 85%
7%
5% 6%
7%
Public data Studysample data
Traditional (contributory and rollover)
RothSEP and SIMPLE
21%26%
21%
26%
24%
23%
18%
15%
16%10%
Public data Studysample data
<35 years
35-44 years
45-54 years
54-65 years
>65 years
44% 48%
37% 32%
11% 13%
8% 7%
Public data Studysample data
Mutual funds
Brokerage
Bank and Thrift
Life Insurance
Note that due to limitations in some firms’ data, specific analyses may be based on substantial subsets of the entire study sample.

Copyright © 2011 Oliver Wyman
NYC-ZPR00111-002
10
3. IRA investment behavior of smaller investors As shown in Figure 6, approximately half of IRA investors in the study sample have less than $25,000 in IRA assets, and over a third have less than $10,000.
Figure 6: The majority of IRA account holders have lower asset levels
IRA account holders by total IRA asset size segment, year-end 2010
10K-<25K15%
25K-<50K14%
≥250K9%
100K-<250K13%
50K-<100K13%
<10K36%
Source: Oliver Wyman study sample
NYC-ZPR00111-002

Copyright © 2011 Oliver Wyman
NYC-ZPR00111-002
11
Although some of these small investors are young and therefore only at the beginning of their savings lifetime, a significant number are also in older age brackets, highlighting the importance of the IRA as a savings vehicle to individuals in their peak savings years.
Figure 7: Very small investors are fairly evenly distributed across age brackets
IRA investor age distribution by asset size segment
0%
20%
40%
60%
80%
100%
<10K 10K - <25K 25K - <50K 50K -<100K
100K -<250K
≥250K
NYC-ZPR00111-002
>65 years
55-64 years
45-54 years
35-44 years
<25 years25-34 years
Source: Oliver Wyman study sample
0%
20%
40%
60%
80%
100%
<10K 10K - <25K 25K - <50K 50K -<100K
100K -<250K
≥250K
NYC-ZPR00111-002
>65 years
55-64 years
45-54 years
35-44 years
<25 years25-34 years
Source: Oliver Wyman study sample
Investors represented in the study group overwhelmingly use the brokerage relationship model as opposed to a fee-based advisory model, with 22.4 million or 88% holding brokerage IRAs. Brokerage IRAs are more common across all account sizes analyzed, ranging from a high of 99% for accounts with less than $10,000 to a low of 66% for investors with more than $250,000 in their IRAs.

Copyright © 2011 Oliver Wyman
NYC-ZPR00111-002
12
Figure 8: Investors prefer transactional, commission-based brokerage accounts over asset-based fee advisory models for IRAs
Proportion of IRAs using each relationship model by asset size segment, year-end 2010
0%
10%
20%
30%
40%
50%
60%
70%
80%
90%
100%
<10 K 10 K-<25 K
25 K-<50 K
50 K-<100 K
100K-<250K
≥250K
Brokerage IRAs
Advisory IRAs
Commission based brokerage accounts represent a majority of IRAs, ranging from 66% to
99% depending on investment size
NYC-ZPR00111-002
Source: Oliver Wyman study sample
0%
10%
20%
30%
40%
50%
60%
70%
80%
90%
100%
<10 K 10 K-<25 K
25 K-<50 K
50 K-<100 K
100K-<250K
≥250K
Brokerage IRAs
Advisory IRAs
Commission based brokerage accounts represent a majority of IRAs, ranging from 66% to
99% depending on investment size
NYC-ZPR00111-002
Source: Oliver Wyman study sample
Of the 2.4 million new IRAs opened with study participants in 2010, nearly 1 million contained assets of less than $10,000 by year end. Not surprisingly, these accounts also conducted fewer trades on average than larger accounts. Figure 9 shows a summary of IRA holder activity through the study group firms in 2010.
Figure 9: Summary of IRA account holder activity
Year-end 2010
Source: Oliver Wyman study sample. Some analyses based on a sub-set of participants, depending on data availability
NYC-ZPR00111-002
Investor size segment <$10K 10K-<25K 25K-<50K 50K-<100K 100K-<250K ≥250K Total
Number of IRA accounts (MM)
10.1 4.2 3.4 3.0 2.9 1.6 25.3
Number of new IRA accounts opened in 2010 (MM)
0.9 0.3 0.3 0.3 0.3 0.2 2.4
Average number of trades per account
3 5 8 15 25 36 11
Investor size segment <$10K 10K-<25K 25K-<50K 50K-<100K 100K-<250K ≥250K Total
Number of IRA accounts (MM)
10.1 4.2 3.4 3.0 2.9 1.6 25.3
Number of new IRA accounts opened in 2010 (MM)
0.9 0.3 0.3 0.3 0.3 0.2 2.4
Average number of trades per account
3 5 8 15 25 36 11
For smaller investors with low trading activity, the brokerage model with predominantly per-transaction charges may be more affordable than the advisory model

Copyright © 2011 Oliver Wyman
NYC-ZPR00111-002
13
4. How the rule change will reshape services for IRA investors Under the proposed rule, Oliver Wyman expects retail brokerage firms would presume that current brokerage account and service offerings would create a fiduciary duty, and respond by limiting the provision of help and investment services to the fee-based advisory model only
Figure 10: Expected financial industry response and IRA investor impact
Full service brokerage
Model becomes unsustainable for current providers
Likely need to shift clients to advisory, “low support”brokerage model or exit brokerage IRA market
Discount brokerage
Can offer only a “low support” brokerage model
Would become dominant model for access to an investment professional for IRAs
Fee-based advisory
NYC-ZPR00111-002
Provider implications
Retail investor impact
Reduced access to investment information, research, online tools and calculators
Call center and branch support significantly reduced
Loss of choice of investment provider and range of payment structures
Reduced access to an investment professional
Loss of investment information and product choice
Loss of choice of investment provider and range of payment structures
Only available for accounts meeting minimum balance requirements
Highest cost model
Investors today who have an IRA account through a brokerage relationship receive a range of investment services and help as part of that relationship. However, the proposed rule would appear to make practically every investment-related conversation or interaction with a client subject to fiduciary duty. Interactions that could trigger a broker fiduciary duty to IRA owners under the proposed rule include:
discussion of investments within an IRA account;

Copyright © 2011 Oliver Wyman
NYC-ZPR00111-002
14
discussions that clients have with brokers about other, non-retirement account investments if such discussions "may be considered" by the client in an IRA account as well;
communications regarding firm-wide research on securities;
valuations of hard-to-value assets;
IRA “education” (if the Department of Labor does not amend the proposed rule to bring education for IRA owners clearly in scope as non-fiduciary); and
conversations about rollovers, if the Department of Labor, as discussed in the preamble to the proposed rule, withdraws its prior guidance indicating that such conversations are non-fiduciary.
Because of the broad range of triggering interactions, as a practical matter, firms would need to assume that any IRA investor offered typical brokerage interactions and investment services would be treated as receiving fiduciary services (even if the actions described in the last two bullets do not trigger fiduciary status).7 Indeed, if a registered representative is found to be a fiduciary, any transactions performed on behalf of a client could be transformed into prohibited transactions giving rise to severe sanctions (e.g. requirement that transactions be undone) and penalties to the holder. The risk of such sanctions is not one that financial firms will likely bear. As fiduciaries under the Department of Labor’s proposed rule, firms and their associated representatives may not receive different levels of compensation based on the investment choices of retail investors in protected IRA accounts. However, the current brokerage model that has developed to serve IRA accounts is incompatible with this requirement, often involving both direct and indirect fees, such as shareholder servicing fees, sales and distribution fees, revenue-sharing and other fees. These fees frequently vary by product based on factors such as complexity, advisor time requirements (e.g. to explain the risks and benefits and determine client suitability), and services performed such as shareholder servicing. As it stands, the current IRA market has developed around these pricing and risk assumption structures. It would likely be almost impossible to renegotiate myriad contracts with different product manufacturers and create a new level-fee brokerage paradigm just for IRA accounts. Under the proposed rule, brokerage firms would likely only offer today’s level of investment services and guidance to IRA investors through fee-based advisory accounts, which would also include additional services such as ongoing account surveillance required to satisfy a fiduciary duty relationship. It may be possible for firms to preserve a brokerage IRA option, but this model would likely involve very low support. Such a service model would likely need to involve strict
7 The proposed rule would also apply an ERISA fiduciary standard to any entity that is registered as an investment advisor, generally regardless of whether the entity is actually acting in advisory capacity.

Copyright © 2011 Oliver Wyman
NYC-ZPR00111-002
15
limits on baseline services such as offering investment services. Even interactions which are a common part of many discount brokerage relationships today, such as discussions with call center and branch staff, could be curtailed (so as to avoid inadvertently establishing a fiduciary duty). In addition, some firms without a registered investment advisor may choose to exit the IRA market completely rather than incur the expense involved in setting up an investment advisor and licensing its representatives. (For example, see Figure 13.) For investors with existing IRA accounts within a brokerage relationship model, we therefore see three potential outcomes:
1) Move to an advisory relationship – this will not be feasible for all affected investors, as many may be too small to serve economically as part of an advisory relationship. Indeed smaller IRA holders with low trading activity levels may experience higher fees in this model
2) Move to a “low support” brokerage model – this option may not be suitable or even practical for many investors, given the time and expertise needed to understand tax-advantaged investing without outside support, thus significantly impacting current and future IRA holders
3) Move existing funds out of the tax-advantaged retirement account market – this could have significant impacts on ultimate savings available to support the retirement of affected investors
Beyond the impact on existing IRA investors, the proposed rule would engender major long-term changes to the ways in which investment services and help could be offered to future investors. Brokerages will no longer have an economic incentive to develop relationships with investors who can only fund a small IRA balance. Instead, firms will look to offer investment services and support only to those whose larger account size can be economically served under the advisory model. Below, we examine the number of IRA investors in our study sample that could be affected by the changes in service described above.
5. Impact of the proposed rule change on retail investors in the study sample
The proposed rule change would affect the overwhelming majority of investors who rely on brokerage IRA accounts in terms of access, choice, and affordability – this would notably disadvantage small investors

Copyright © 2011 Oliver Wyman
NYC-ZPR00111-002
16
5.1. Reduced access to a licensed professional advisor In the study sample alone, 7.2 million current retail brokerage IRAs would not qualify for an advisory account with any firm in the study All firms in the study have account minimums for accessing their advisory channels. At today’s account minimums, 10.7 million current retail accounts would have insufficient assets to gain access to an advisory account at their current firm. Of these, 3.5 million would have sizeable enough balances for an advisory relationship but the holders would need to switch firms to find an advisory channel with a lower minimum asset requirement. Finally, 7.2 million accounts would have insufficient assets to qualify for the advisory channel at any firm. Based on studies of consumer behavior in similar situations, we expect significant numbers of these investors would likely drop out of the IRA market. For example, we believe that a large number of small balance investors forced to switch to a new firm to access the advisory channel would be likely to take a cash distribution rather than successfully re-invest in a new IRA. We also believe that only a portion of investors who are not able to access the advisory channel at any firm will open an online IRA, given the extensive restrictions on outreach to these clients under the proposed rule.
Box 1
Example long term investor impact estimation – illustrative only As an example of the potential impact of this proposed rule change, we have estimated a reduction in tax advantaged retirement savings over a 20 year period using high-level assumptions. Clearly, a large number of factors come into play when considering the long term evolution of retirement savings in the U.S., and this example does not attempt to factor in all of these. Rather, it is intended to provide some sense of the potential magnitude of the impacts over time. The assumptions used are clearly stated at each stage. As discussed in Section 4, we believe there are three possible outcomes for the 22.4 million brokerage IRAs that are included in the study sample and that would be impacted in some way by the proposed rule change: 1. We assume that each of the 11.7 million investor accounts that have sufficient assets
to qualify for the advisory channel in their current firm would successfully migrate to this channel with no account holders choosing to take a distribution.
2. Prior consumer behavior studies8 have analyzed investor behavior when individuals leave a workplace sponsored retirement plan. We use these as a proxy for the likely
8 Hewitt 2009: The erosion of retirement security from cash-outs
Copyright © 2011 Oliver Wyman
NYC-ZPR00111-002
17
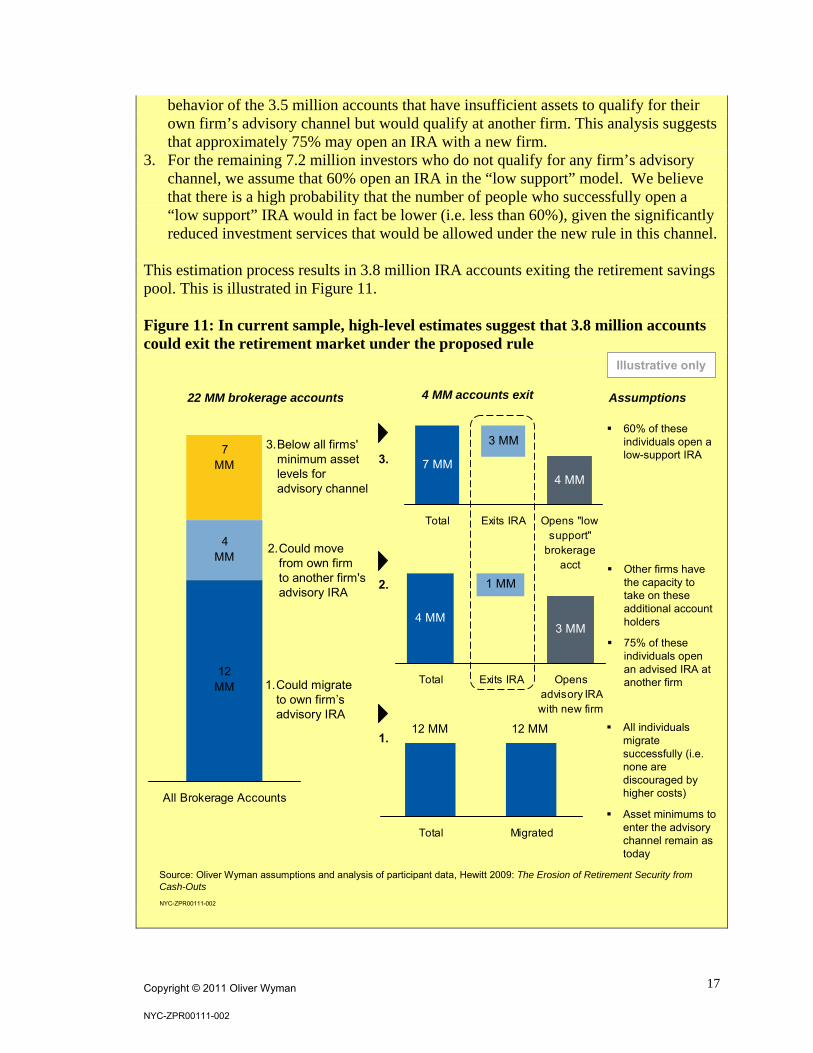
behavior of the 3.5 million accounts that have insufficient assets to qualify for their own firm’s advisory channel but would qualify at another firm. This analysis suggests that approximately 75% may open an IRA with a new firm.
3. For the remaining 7.2 million investors who do not qualify for any firm’s advisory channel, we assume that 60% open an IRA in the “low support” model. We believe that there is a high probability that the number of people who successfully open a “low support” IRA would in fact be lower (i.e. less than 60%), given the significantly reduced investment services that would be allowed under the new rule in this channel.
This estimation process results in 3.8 million IRA accounts exiting the retirement savings pool. This is illustrated in Figure 11. Figure 11: In current sample, high-level estimates suggest that 3.8 million accounts could exit the retirement market under the proposed rule
12 MM
4 MM
7 MM
All Brokerage Accounts
Source: Oliver Wyman assumptions and analysis of participant data, Hewitt 2009: The Erosion of Retirement Security from Cash-Outs
12 MM 12 MM
Total Migrated
3.Below all firms' minimum asset levels for advisory channel
1.Could migrate to own firm’s advisory IRA
1 MM
4 MM3 MM
Total Exits IRA Opensadvisory IRAwith new firm
22 MM brokerage accounts
3 MM
7 MM4 MM
Total Exits IRA Opens "lowsupport"
brokerageacct
4 MM accounts exit
2.Could move from own firm to another firm's advisory IRA
60% of theseindividuals open a low-support IRA
Assumptions
All individuals migrate successfully (i.e. none are discouraged by higher costs)
Asset minimums to enter the advisory channel remain as today
Other firms have the capacity to take on these additional account holders
75% of theseindividuals open an advised IRA at another firm
3.
2.
1.
Illustrative only
NYC-ZPR00111-002

Copyright © 2011 Oliver Wyman
NYC-ZPR00111-002
18
The average assets of each IRA that exits the market would be approximately $8,000 in this scenario. Using baseline assumptions for market appreciation as shown in Figure 12, this amount could grow to $25,500 by 2030, suggesting a reduction of approximately $96 BN across all IRAs that exit the market.
Figure 12: Potential lost retirement savings of $96 BN in accounts that exit the IRA market
$8.0 K $8.0 K
$17.5 K
2010 2030
$25.5 K
Growth
• No annual funding• No distributions• 6% market appreciation
2010 Base
Average assets in each IRA that exits the IRA market
Source: Oliver Wyman study sample, Oliver Wyman analysis
NYC-ZPR00111-002
Illustrative only
$96 BN$30 BNAssets exiting IRA market $96 BN$30 BNAssets exiting IRA market
Finally, it is worth considering the impact of elimination of support from the full service brokerage model on potential future investors. In 2010, firms in the study sample opened approximately 890,000 brokerage IRA accounts with assets of less than $10,000. If the proposed rule change were assumed to take effect at the beginning of the year and were to result in the impacts suggested in this report, we estimate as many as 360,000 brokerage IRAs would potentially no longer be opened in 2011. This estimate uses similar investor behavior assumptions to those employed for the analysis of existing small IRA account holders who would lose access to a full service brokerage model (i.e. 60% of investors would open a “low support” brokerage IRA). Given the lack of support such investors could have in navigating the complexities of opening a new IRA, we believe these are conservative assumptions. Additionally, in future years, we estimate the number of foregone new full service brokerage IRA accounts could grow to a total of approximately 8 million by 2030, assuming the number of IRA holders grows in line with population growth in the 20 plus age group.

Copyright © 2011 Oliver Wyman
NYC-ZPR00111-002
19
5.2. Reduced choice of investment professional, level of investment guidance, and investment products
Investors will likely have reduced access to help and investment guidance as 36% of U.S. financial professionals in contact with clients are not currently licensed to help retail investors with their IRA account needs under the proposed new rule As Figure 13 shows, in the study sample 37,000 current investment professionals (36% of the work force) are currently registered exclusively as registered representatives of a broker dealer, not as investment advisor representatives under the Investment Advisers Act of 1940 or dual-registered9.
Figure 13: Workforce by registration type, year-end 2010
Dual-registered64%
Registered representatives
36%
Investment Advisers
<1%
Source: Oliver Wyman study sample
Investment advisor representatives only<1%
NYC-ZPR00111-002 Existing investors who have a personal relationship with a financial professional could find themselves forced away from this individual, regardless of their preference or relationship history. Without additional training and licensing, registered broker representatives may no longer be able to provide help and investment services to retail investors seeking to open or manage an IRA account. Not all firms have both broker dealers and investment advisor representatives, however, and it may not make sense for them to incur the cost and expense of setting up an advisory channel to support IRA accounts. Nearly 90% of IRA investors will be impacted by the proposed rule
9 Industry-wide this number has been estimated by other studies at 317,000 due to the low number of dual-registered individuals in smaller firms

Copyright © 2011 Oliver Wyman
NYC-ZPR00111-002
20
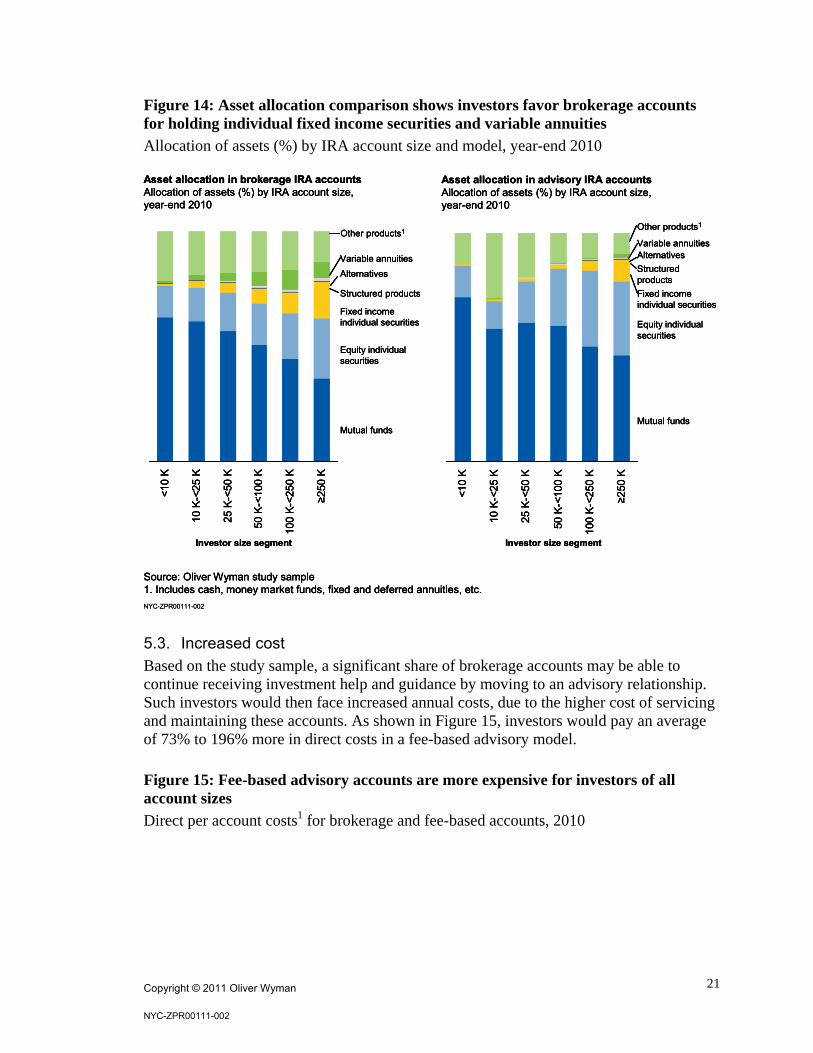
Over 22.4 million accounts and 17.6 million people in our sample have personally elected to save in an IRA account under a brokerage model. As discussed, some would be able to move to an advisory relationship. However, the remainder will lose the benefits of working with a financial professional and be forced to migrate to a purely “low support” brokerage model to continue their IRA retirement savings with little access to investment services, research and tools. Investors will lose access to a range of product types found predominantly in brokerage IRAs today Investors will lose access to principal transactions which they may value to provide liquidity to obtain certain investments at favorable prices. In addition, a range of product choices currently offered predominantly in brokerage IRA relationships may no longer be able to be offered, such as some variable annuities, proprietary products to which clients may want specific access, unique structured products, as well as a wide array of third-party solutions available at those firms.
Copyright © 2011 Oliver Wyman
NYC-ZPR00111-002
21
Figure 14: Asset allocation comparison shows investors favor brokerage accounts for holding individual fixed income securities and variable annuities
Allocation of assets (%) by IRA account size and model, year-end 2010
NYC-ZPR00111-002
Asset allocation in brokerage IRA accountsAllocation of assets (%) by IRA account size, year-end 2010
Source: Oliver Wyman study sample1. Includes cash, money market funds, fixed and deferred annuities, etc.
<10
K
10 K
-<25
K
25 K
-<50
K
50 K
-<10
0 K
100
K-<
250
K
≥250
K
Mutual funds
Alternatives
Fixed income individual securities
Structured products
Variable annuities
Other products1
Equity individualsecurities
Asset allocation in advisory IRA accountsAllocation of assets (%) by IRA account size, year-end 2010
<10
K
10 K
-<25
K
25 K
-<50
K
50 K
-<10
0 K
100
K-<
250
K
≥250
K
Mutual funds
Alternatives
Fixed income individual securities
Structured products
Variable annuities
Other products1
Equity individual securities
Investor size segment Investor size segment
5.3. Increased cost Based on the study sample, a significant share of brokerage accounts may be able to continue receiving investment help and guidance by moving to an advisory relationship. Such investors would then face increased annual costs, due to the higher cost of servicing and maintaining these accounts. As shown in Figure 15, investors would pay an average of 73% to 196% more in direct costs in a fee-based advisory model.
Figure 15: Fee-based advisory accounts are more expensive for investors of all account sizes
Direct per account costs1 for brokerage and fee-based accounts, 2010

Copyright © 2011 Oliver Wyman
NYC-ZPR00111-002
22
10K-<25K 25K-<50K 50K-<100K 100K-<250K ≥250K
Brokerage $80 $135 $230 $455 $1,070
Advisory $135 $275 $555 $1,245 $3,165
% cost difference (advisory – brokerage)
73% 106% 142% 173% 196%
10K-<25K 25K-<50K 50K-<100K 100K-<250K ≥250K
Brokerage $80 $135 $230 $455 $1,070
Advisory $135 $275 $555 $1,245 $3,165
% cost difference (advisory – brokerage)
73% 106% 142% 173% 196%
Source: Oliver Wyman study sample1. Excludes marketing and distribution, shareholder services, and other fees not directly paid by investors
NYC-ZPR00111-002 In addition to direct costs paid by investors, firms may also receive marketing, distribution, shareholder services, and other fees in connection with providing brokerage IRA services not paid directly by investors. Firms vary in whether they receive such fees and how they account for them. If the Department of Labor’s proposal were to be adopted as proposed, such fees would likely be restricted or eliminated for many IRAs. To the extent such fees are considered, the cost difference between the brokerage and advisory IRA models would narrow, though brokerage would continue to be less expensive across all account sizes in the study sample. These increased investment costs would serve as a drag on long-term investment gains, and therefore on the ultimate retirement savings available to impacted account holders. Figure 16 illustrates this point for a hypothetical 40-year old individual with $25,000 in an IRA and 25 years of saving before retiring at age 65.

Copyright © 2011 Oliver Wyman
NYC-ZPR00111-002
23
Figure 16: The impact on retirement savings of the higher-cost advisory model is compounded over time
Comparison of difference in direct fees paid and foregone investment gains over 25 years for a hypothetical investor under brokerage and fee-based advisory models
Advisory Brokerage
$23 K in direct advisory fees
$9 K in in direct brokerage fees
$17 K in foregone investment gains on advisory fees paid
$7 K in foregone investment gains on brokerage fees paid
Key assumptions
Investor is 40 years old today and will save for 25 years before retirement
Initial contribution is $25K, with annual contributions of $4K
Investment gains of 6% per year
There are no distributions or rollovers over the 25 year period
$40 K
$16 K
Source: Oliver Wyman study sample, Oliver Wyman analysisNote: Cost of advisory and brokerage accounts based on actual direct costs observed in study sample, of 0.60%-0.80% for advisory accounts and 0.20%-0.50% for brokerage accounts, varying by wealth segmentCosts exclude marketing and distribution, shareholder services, and other fees not directly paid by the investor – the cost differential between the two models is still significant if these fees are included
By age 65, the brokerage investor would save $311 K, compared to $287K – a differences of $24 K in final savings (8%)
NYC-ZPR00111-002 In this illustrative example, the IRA investor would have an additional $24,000 (8%) of retirement savings available at age 65 under the brokerage model, in comparison to the advisor model.
6. Conclusions The Department of Labor’s proposed rule change is motivated by a laudable objective: to ensure a high standard of care for retirement plan participants and account holders with regard to the receipt of services and investment guidance, amid an increasingly complex financial marketplace. However, we find that the proposed Department of Labor “fiduciary” definition rule is likely to have serious negative and unintended effects on the very individuals the change is supposed to help. Based on the unprecedented collection of data on IRA account holders assembled to support our analysis, we conclude that the proposed rule will disproportionately

Copyright © 2011 Oliver Wyman
NYC-ZPR00111-002
24
negatively affect small balance IRA investors – those individuals most in need of support in reaching their retirement goals. The proposed rule is likely to change an important avenue through which retail investors save for retirement, denying millions of current and future IRA investors access to professional investment help and investment services, limiting choice of how they receive and pay for investment services, and increasing overall costs for such support when available.

Oliver Wyman, Inc.
1166 Avenue of the Americas, 29th floor New York, NY 10036 1 212 541 8100