Embed Size (px)
Citation preview
April 15, 2014
Sustainability Cultural Indicators Program
North Campus Sustainability Initiative
• Background to the Sustainability Cultural Indicators Program (SCIP)
• Overview of Year 1 findings
• Using the Data - Current and Future ideas
• Current Status of SCIP
• Questions and Discussion
Agenda

Background
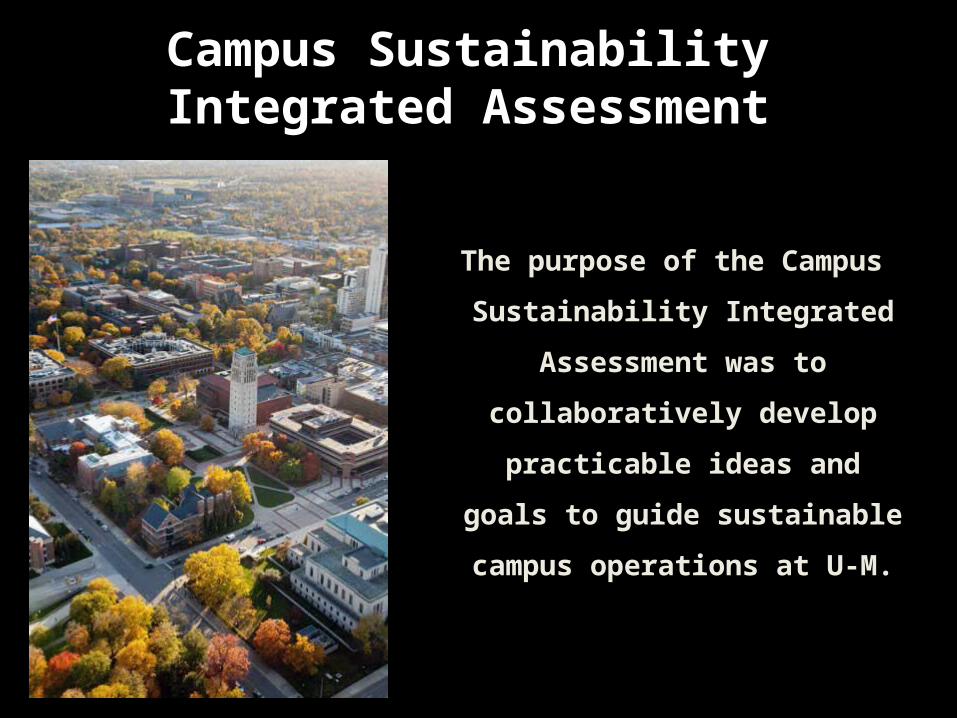
The purpose of the Campus
Sustainability Integrated
Assessment was to
collaboratively develop
practicable ideas and
goals to guide sustainable
campus operations at U-
M.
Campus Sustainability Integrated Assessment
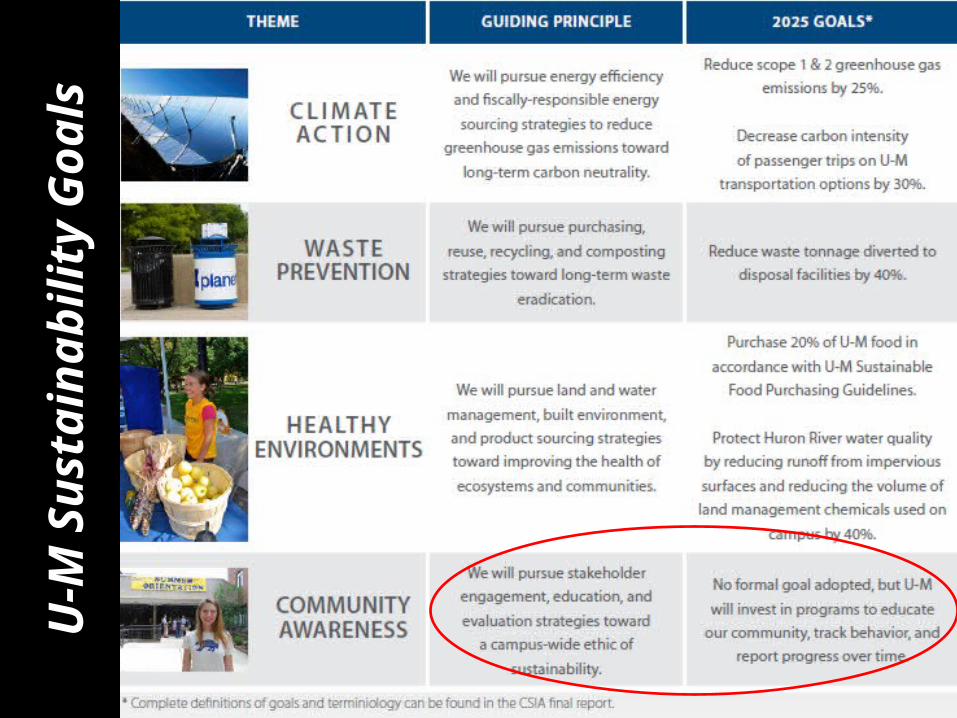
U-M
Su
sta
inab
ilit
y G
oals
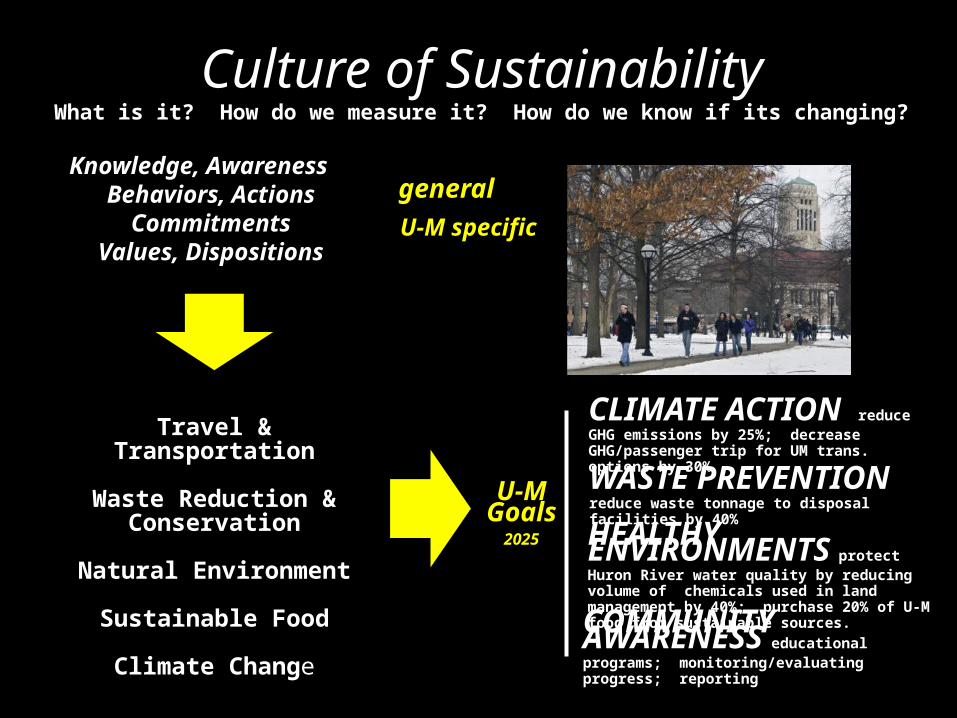
Culture of SustainabilityWhat is it? How do we measure it? How do we know if its changing?
Knowledge, Awareness Behaviors, Actions
CommitmentsValues, Dispositions
Travel & Transportation
Waste Reduction & Conservation
Natural Environment
Sustainable Food
Climate Change
CLIMATE ACTION reduce GHG emissions by 25%; decrease GHG/passenger trip for UM trans. options by 30%
WASTE PREVENTION reduce waste tonnage to disposal facilities by 40%
HEALTHY ENVIRONMENTS protect Huron River water quality by reducing volume of chemicals used in land management by 40%; purchase 20% of U-M food from sustainable sources.
COMMUNITY AWARENESS educational programs; monitoring/evaluating progress; reporting
general
U-MGoals
2025
U-M specific
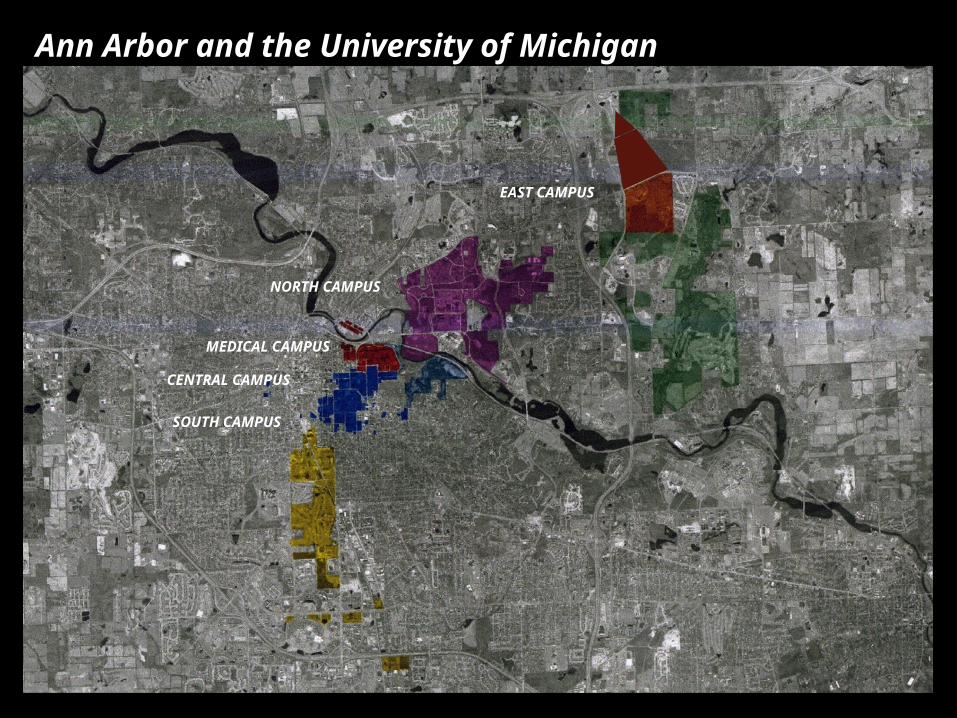
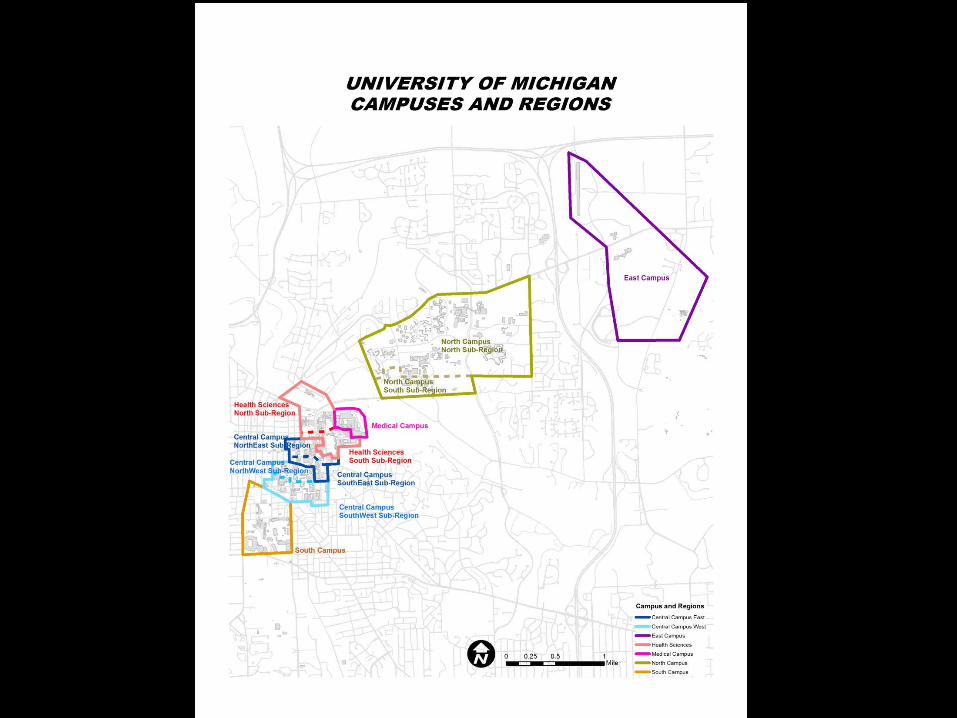
CENTRAL CAMPUS
MEDICAL CAMPUS
SOUTH CAMPUS
NORTH CAMPUS
EAST CAMPUS
Ann Arbor and the University of Michigan

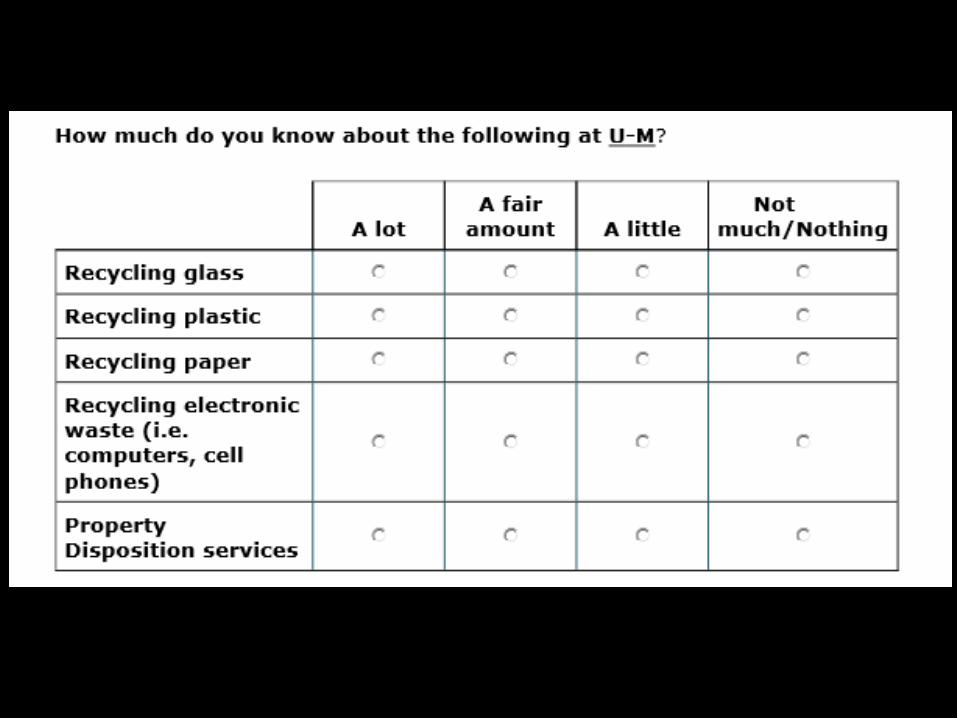
SURVEY MODULE Knowledge Disposition Behavior Other Demographics TotalTransportation 9 10 21 1 0 41Conservation 5 5 33 1 0 44Environment 4 2 9 1 0 16Food 7 6 19 2 0 34Climate 1 2 0 2 0 5Sustainability (general) 0 20 13 3 0 36Univ. of Michigan 8 0 8 8 0 24Demographics 0 0 0 0 42 42Total 34 45 103 18 42 242
QUESTION TYPE
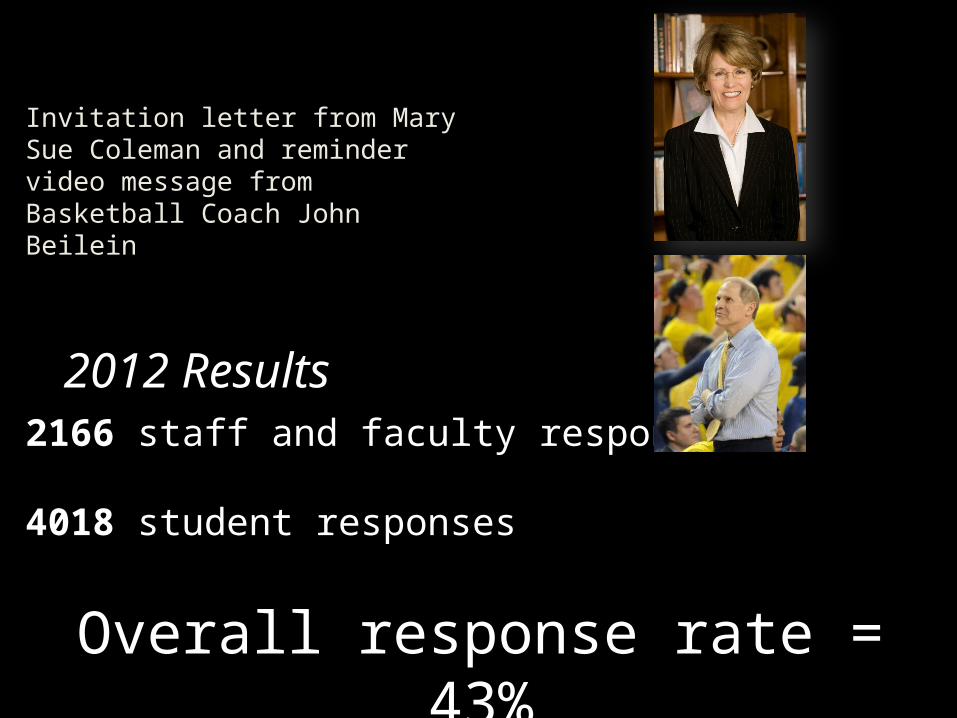
2166 staff and faculty responses
4018 student responses
2012 Results
Overall response rate = 43%
Invitation letter from Mary Sue Coleman and reminder video message from Basketball Coach John Beilein
Overview of Findings
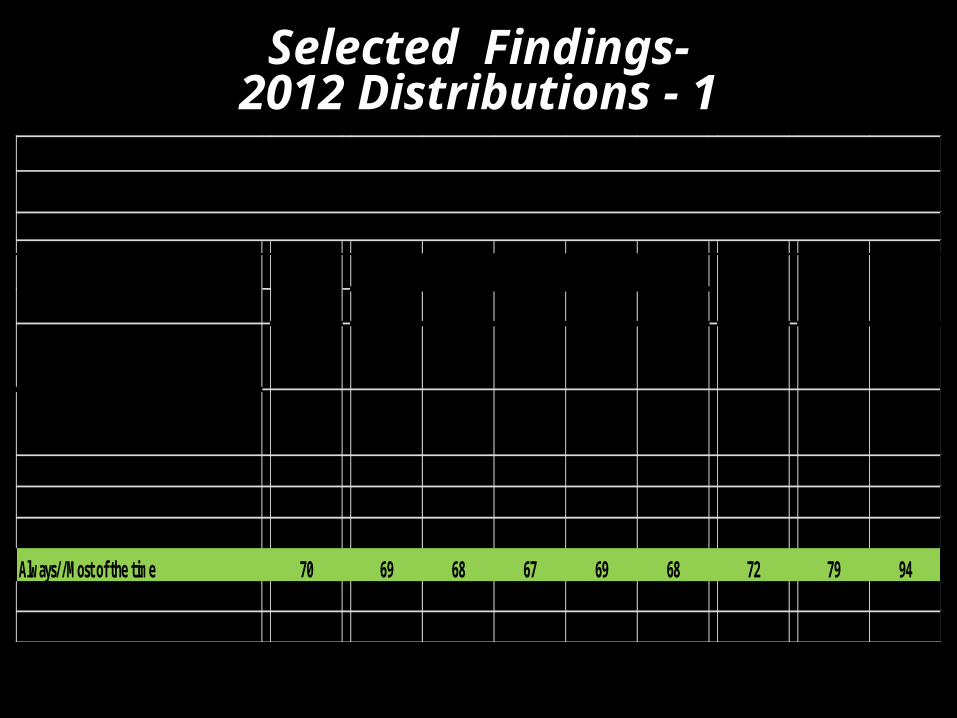
Fresh Soph Junior Senior AllDuring the past year, how often did you do the following ?
Recycle bottles, containers, and paper productsNever 1 1 1 2 1 1 1 3 1Rarely 6 5 4 5 5 5 7 4 1Sometimes 23 24 26 26 25 25 20 13 4Always//Most of the time 70 69 68 67 69 68 72 79 94Not applicable ** 1 1 ** ** 1 ** 1 **Total 100 100 100 100 100 100 100 100 100
Appendix Table 5 (continued)
WASTE PREVENTION & CONSERVATION - BEHAVIOR(percentage distribution)*
2012 All Students
Undergraduate Students Graduate Students
Staff Faculty
Selected Findings-2012 Distributions - 1
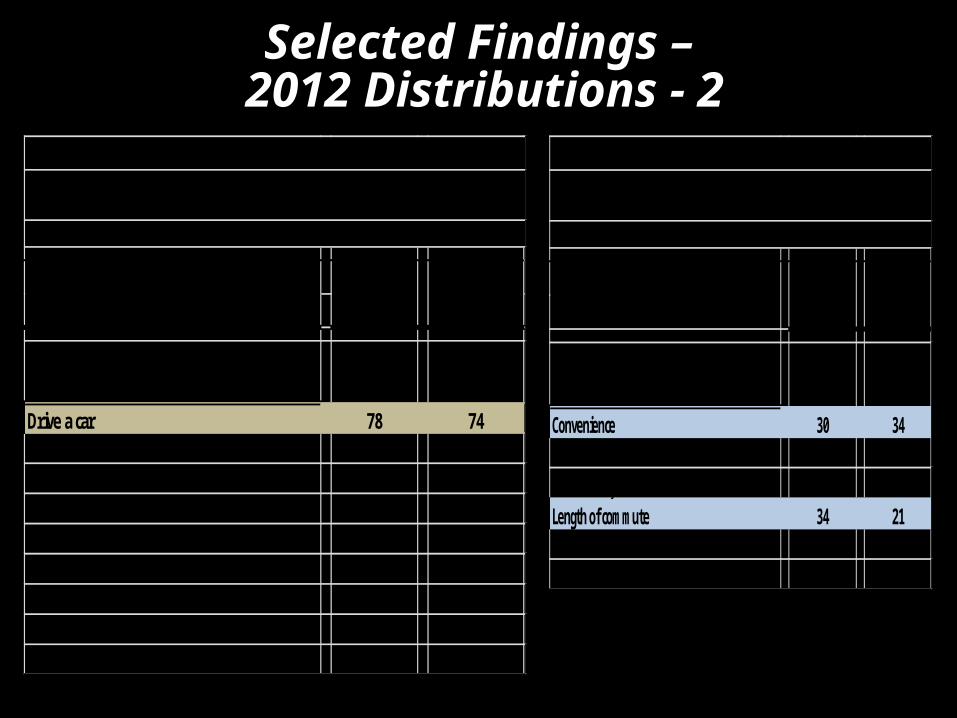
How do you most often travel to/from home to your work place?Drive a car 78 74Walk 5 10Bike 2 7Ride the bus 8 5Ride the bus and bike 1 1Motorcycle, moped, or scooter ** **Park and ride 1 1Other 5 2Total 100 100
Appendix Table 2 (continued)
TRAVEL & TRANSPORATION - BEHAVIOR(percentage distribution)*
2012 Staff Faculty
What is the primary reason you drive a car to work?***Convenience 30 34Work schedule 15 17Home/family schedule 15 19Length of commute 34 21Other 7 9Total 100 100
TRAVEL & TRANSPORATION - OTHER(percentage distribution)*
2012 Staff Faculty
Appendix Table 3 (continued)
Selected Findings – 2012 Distributions - 2
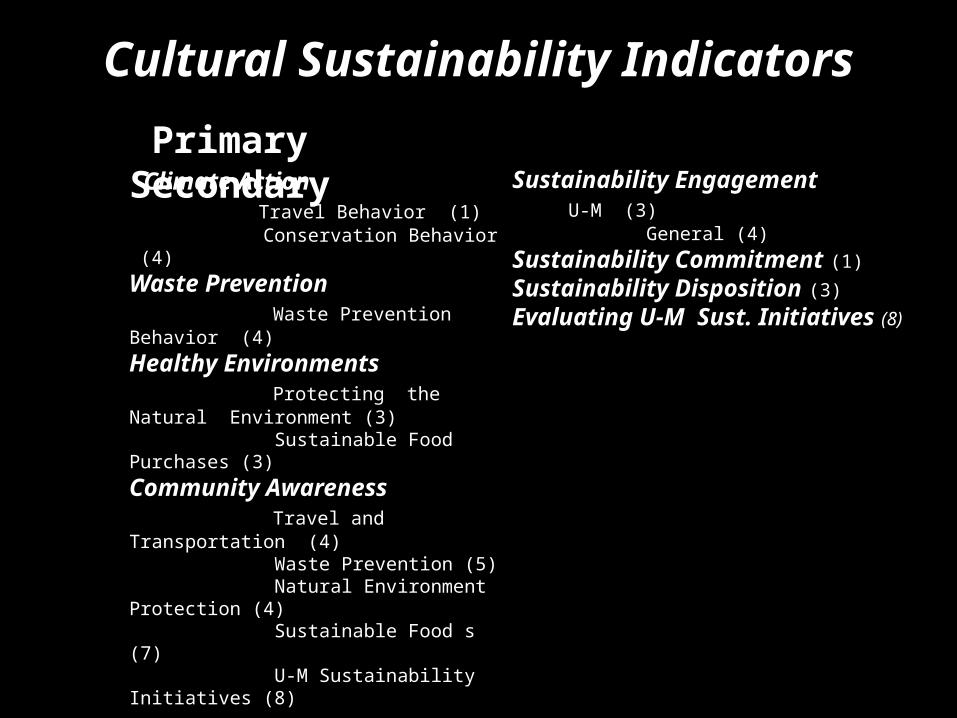
Cultural Sustainability Indicators
Climate Action Travel Behavior (1) Conservation Behavior (4)Waste Prevention Waste Prevention Behavior (4)
Healthy Environments Protecting the Natural Environment (3) Sustainable Food Purchases (3)Community Awareness Travel and Transportation (4) Waste Prevention (5) Natural Environment Protection (4) Sustainable Food s (7) U-M Sustainability Initiatives (8)
Sustainability Engagement U-M (3) General (4)Sustainability Commitment (1)
Sustainability Disposition (3)
Evaluating U-M Sust. Initiatives (8)
Primary Secondary
ConservationBehavior
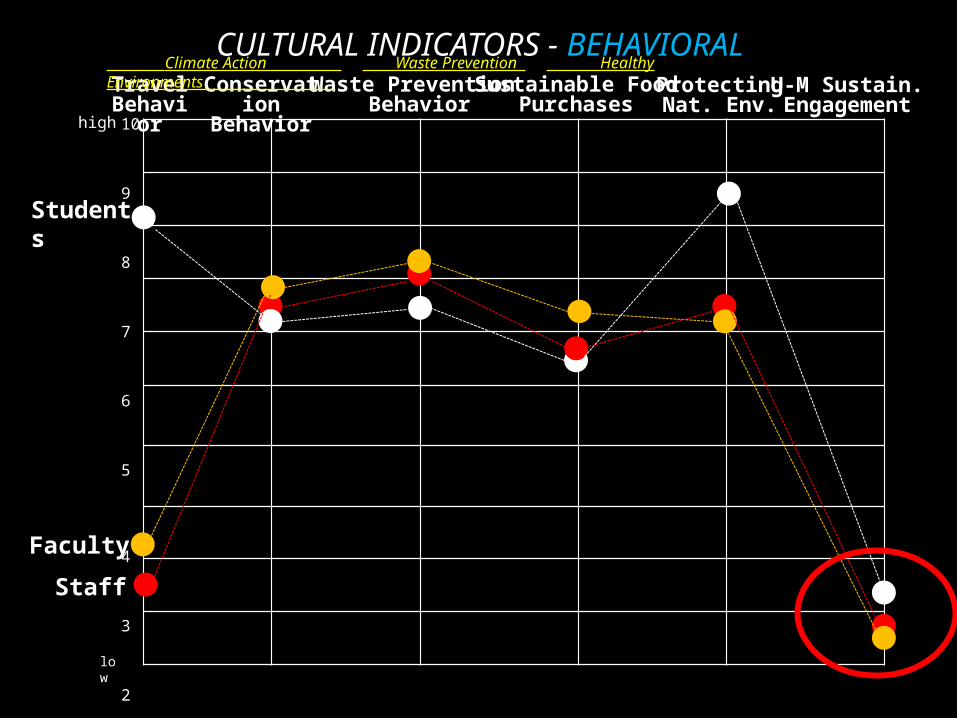
CULTURAL INDICATORS - BEHAVIORAL
Students
Faculty
Staff
Travel Behavior
Waste Prevention Behavior
Sustainable FoodPurchases
ProtectingNat. Env.
U-M Sustain.Engagement
10
9
8
7
6
5
4
3
2
1
0
high
low
Climate Action Waste Prevention Healthy Environments_________
Waste Prevention
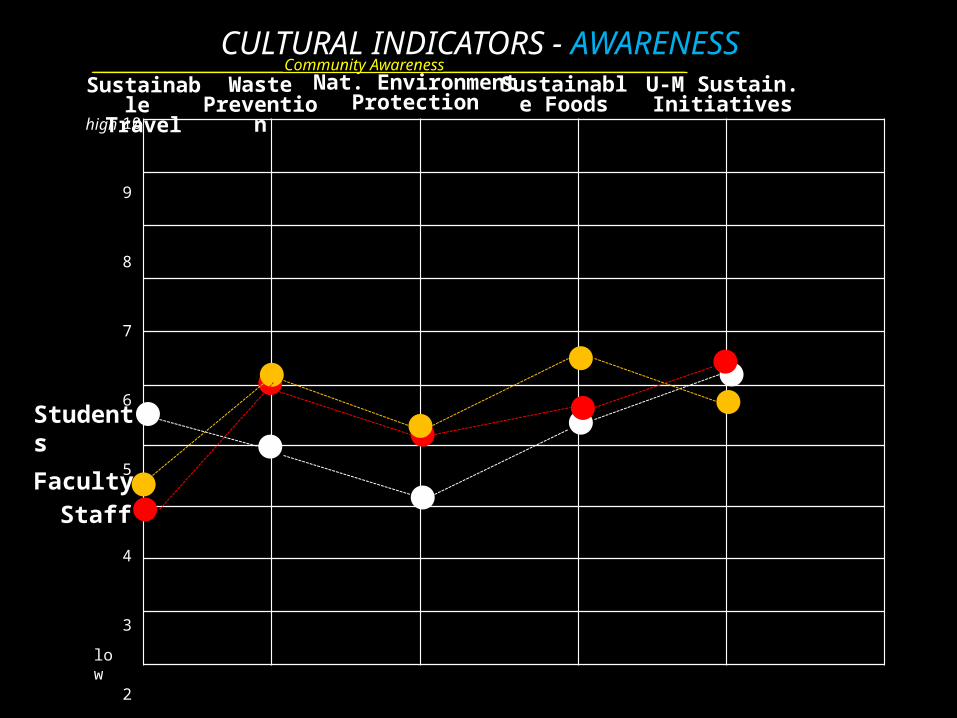
CULTURAL INDICATORS - AWARENESS
Students
FacultyStaff
Sustainable Travel
Nat. EnvironmentProtection
Sustainable Foods
U-M Sustain.Initiatives
10
9
8
7
6
5
4
3
2
1
0
______________________________Community Awareness______________________________________
high
low
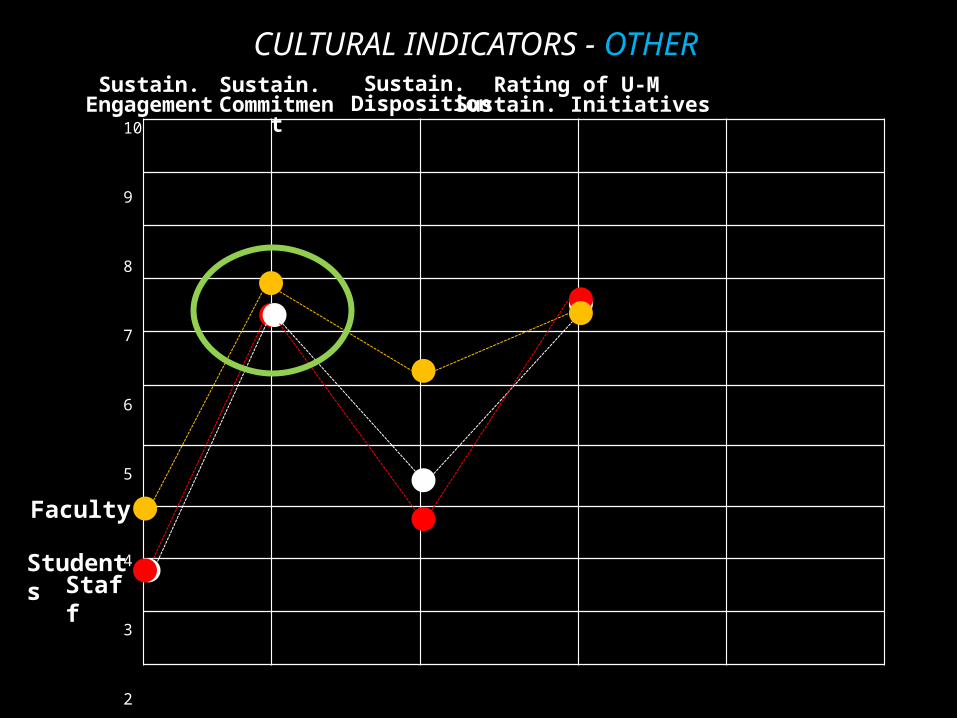
Sustain. Commitment
CULTURAL INDICATORS - OTHER
Students
Faculty
Staff
Sustain.Engagement
Sustain. Disposition
Rating of U-M Sustain. Initiatives
10
9
8
7
6
5
4
3
2
1
0
Central North Medical Health South East
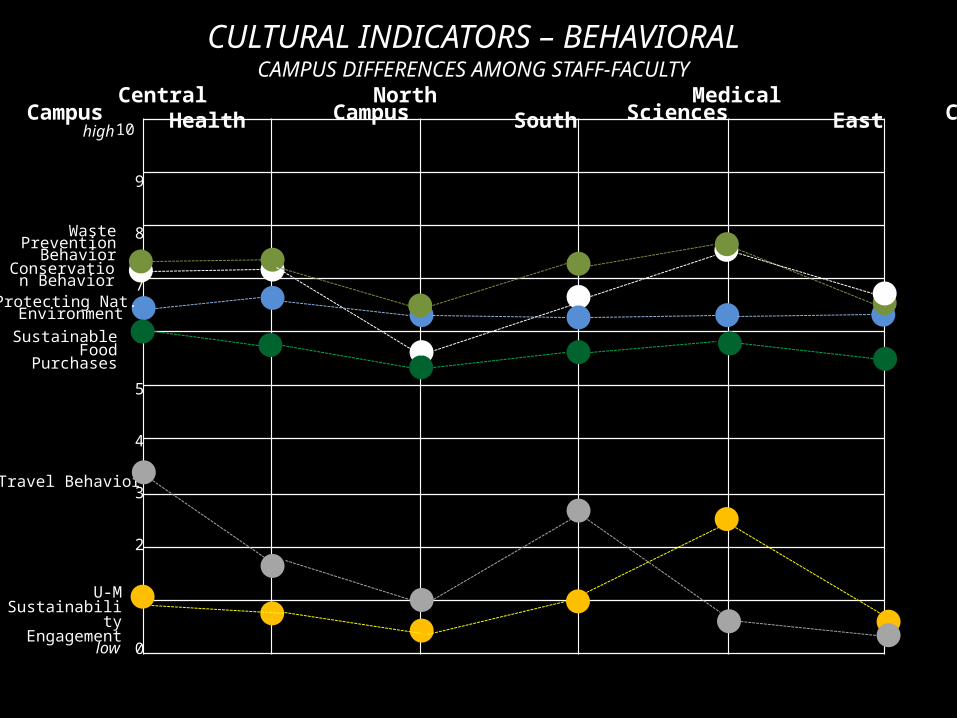
CULTURAL INDICATORS – BEHAVIORALCAMPUS DIFFERENCES AMONG STAFF-FACULTY
Conservation Behavior
Travel Behavior
Waste Prevention Behavior
10
9
8
7
6
5
4
3
2
1
0
Campus Campus Campus Sciences Campus Campus
Sustainable Food Purchases
U-M Sustainability Engagement
Protecting Nat. Environment
high
low
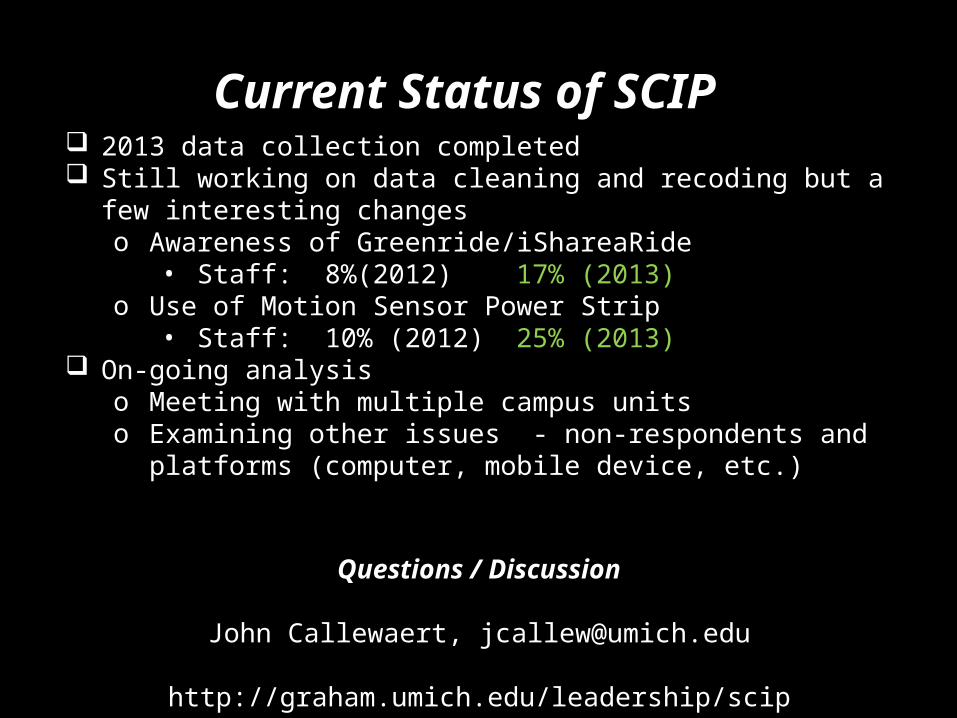
Current Status of SCIP 2013 data collection completed Still working on data cleaning and recoding but a few
interesting changeso Awareness of Greenride/iShareaRide
• Staff: 8%(2012) 17% (2013)o Use of Motion Sensor Power Strip
• Staff: 10% (2012) 25% (2013) On-going analysis
o Meeting with multiple campus unitso Examining other issues - non-respondents and platforms
(computer, mobile device, etc.)
Questions / Discussion
John Callewaert, [email protected]
http://graham.umich.edu/leadership/scip