Embed Size (px)
Citation preview

June 5, 2012 FINAL
April 2012 Update to the Texas Water Quality Management Plan
Prepared by the: Off ice of Water, Water Qual ity Division
TEXAS CO MMI SS ION ON ENV IRON MEN TAL QUAL ITY


April 2012 Update to the Texas Water Quality Management Plan
Compiled and distributed by the Water Quality Assessment Section
Water Quality Division Texas Commission on Environmental Quality
P.O. Box 13087, MC-150 Austin, Texas 78711-3087
June 2012
WQMP updates are also available on the TCEQ web site at:
< www.tceq.texas.gov/waterquality/assessment/WQmanagement_updates.html >
Developed in accordance with Sections 205(j) and 208 of the Federal Clean Water Act
and applicable regulations thereto.
Bryan W. Shaw Ph.D., Chairman Carlos Rubinstein, Commissioner
Toby Baker, Commissioner Zak Covar, Executive Director
Authorization for use or reproduction of any original material contained in this publication—that is, not obtained from other sources—is freely granted. The commission would appreciate
acknowledgement.
The TCEQ is an equal opportunity/affirmative action employer. The agency does not allow discrimination on the basis of race, color, religion, national origin, sex, disability, age, sexual orientation or veteran status. In compliance with the Americans with Disabilities Act, this document may be requested in alternate formats by contacting the TCEQ at (512) 239-0028, Fax 239-4488, or 1-800-RELAY-TX (TDD), or by writing P.O. Box 13087, Austin, TX 78711-3087.
i
Table of Contents
Introduction ...................................................................................................................................... 1
Projected Effluent Limit Updates ..................................................................................................... 3
Planning Information Summary ....................................................................................................... 5
Designated Management Agencies .................................................................................................. 8
Total Maximum Daily Load Updates ............................................................................................... 9
Tables Table 1. Projected Effluent Limit Updates ..................................................................................... 4
Table 2. Service Area Population Updates ..................................................................................... 7
Table 3. Designated Management Agencies Updates .................................................................... 8
Appendixes Appendix I. Eighteen Total Maximum Daily Loads for Bacteria in Buffalo and Whiteoak Bayous
and Tributaries For Segment Numbers 1013, 1013A, 1013C, 1014, 1014A, 1014B,
1014E, 1014H, 1014K, 1014L, 1014M, 1014N, 1014O, 1017, 1017A, 1017B, 1017D,
and 1017E ......................................................................................................................... 10
Appendix II. Addendum Three to Six Total Maximum Daily Loads for Bacteria in Waters of the
Upper Gulf Coast. Two Total Maximum Daily Loads for Bacteria in Bastrop Bay/Oyster
Lake and Christmas Bay For Segment Numbers 2433OW and 24340OW...................... 11

ii

WATER QUALITY MANAGEMENT PLAN 1 APRIL 2012 UPDATE
Introduction The Texas Water Quality Management Plan (WQMP) is the product of a wastewater treatment facility planning process developed and updated in accordance with provisions of Sections 205(j), 208, and 303 of the federal Clean Water Act (CWA), as amended. The WQMP is an important part of the State’s program for accomplishing its clean water goals.1
The Texas Department of Water Resources, a predecessor agency of the Texas Commission on Environmental Quality (TCEQ), prepared the initial WQMP for waste treatment management during the late 1970s. The Clean Water Act mandates that the WQMP be updated as needed to fill information gaps and revise earlier certified and approved plans. Any updates to the plan need involve only the elements of the plan that require modification. The original plan and its subsequent updates are collectively referred to as the State of Texas Water Quality Management Plan. The WQMP is tied to the State’s water quality assessments that identify priority water quality problems. The WQMPs are used to direct planning for implementation measures that control and/or prevent water quality problems. Several elements may be contained in the WQMP, such as effluent limitations of wastewater facilities, total maximum daily loads (TMDLs), nonpoint source management controls, identification of designated management agencies, and ground water and source water protection planning. Some of these elements may be contained in separate documents which are prepared independently of the current WQMP update process, but may be referenced as needed to address planning for water quality control measures. This document, as with previous updates2
, will become part of the WQMP after completion of its public participation process, certification by the TCEQ on behalf of the Governor of Texas, and approval by the Environmental Protection Agency (EPA).
The materials presented in this document revise only the information specifically addressed in the following sections. Previously certified and approved water quality management plans remain in effect.
The April 2012 WQMP update addresses the following topics: 1. Projected Effluent Limits Updates for water quality planning purposes 2. Service Area Population for Municipal Wastewater Facilities 3. Designation of Management Agencies for Municipal Wastewater Facilities 4. Total Maximum Daily Load Updates
The Projected Effluent Limit Update section provides information compiled from
1 A formal definition for a water quality management plan is found in 40 Code of Federal Regulations (CFR) 130.2(k). 2 Fiscal Years 1974, 1975, 1977, 1978, 1979, 1980, 1981, 1982, 1983, 1984/85, 1986/88, 1989, 1990, 1991, 1992, 1993/94, 1995, 1996, 1997/98, 02/1999, 05/1999, 07/1999, 10/1999, 01/2000, 04/2000, 07/2000, 10/2000, 01/2001, 04/2001, 07/2001, 10/2001, 01/2002, 04/2002, 07/2002, 10/2002, 01/2003, 04/2003, 07/2003, 10/2003, 01/2004, 04/2004, 07/2004, 10/2004, 01/2005, 04/2005, 07/2005, 10/2005, 01/2006, 04/2006, 07/2006, 10/2006, 01/2007, 04/2007, 07/2007, 10/2007, 01/2008, 04/2008, 07/2008, 10/2008, 01/2009, 04/2009, 07/2009, 10/2009, 01/2010, 04/2010, 07/2010,10/2010, 01/2011, 04/2011, 07/2011, 10/2011, BPUB 2011, and 01/2012.
WATER QUALITY MANAGEMENT PLAN 2 APRIL 2012 UPDATE
February 1, 2012 through April 30, 2012, and is based on water quality standards, and may be used for water quality planning purposes in Texas Pollutant Discharge Elimination System (TPDES) permit actions. The Service Area Population and Designation of Management Agencies sections for municipal wastewater facilities has been developed and evaluated by the TCEQ in cooperation with the Texas Water Development Board (TWDB) and regional water quality management planning agencies. The Total Maximum Daily Load (TMDL) Update section provides information on proposed waste load allocations for new dischargers and revisions to existing TMDLs and has been developed by the Water Quality Planning Division, TMDL Program.
WATER QUALITY MANAGEMENT PLAN 3 APRIL 2012 UPDATE
Projected Effluent Limit Updates Table 1 reflects proposed effluent limits for new dischargers and preliminary revisions to original proposed effluent limits for preexisting dischargers (MGD-Million Gallons per Day, CBOD5 – 5 Day Carbonaceous Biochemical Oxygen Demand, NH3-N – Ammonia-Nitrogen, BOD5 – 5 Day Biochemical Oxygen Demand and DO – Dissolved Oxygen). Effluent flows indicated in Table 1 reflect future needs and do not reflect current permits for these facilities. These revisions may be useful for water quality management planning purposes. The effluent flows and constituent limits indicated in the table have been preliminarily determined to be appropriate to satisfy the stream standards for dissolved oxygen in their respective receiving waters. These flow volumes and effluent sets may be modified at the time of permit action. These limits are based on water quality standards effective at the time of the TCEQ production of this update. Water Quality Standards are subject to revision on a triennial basis.
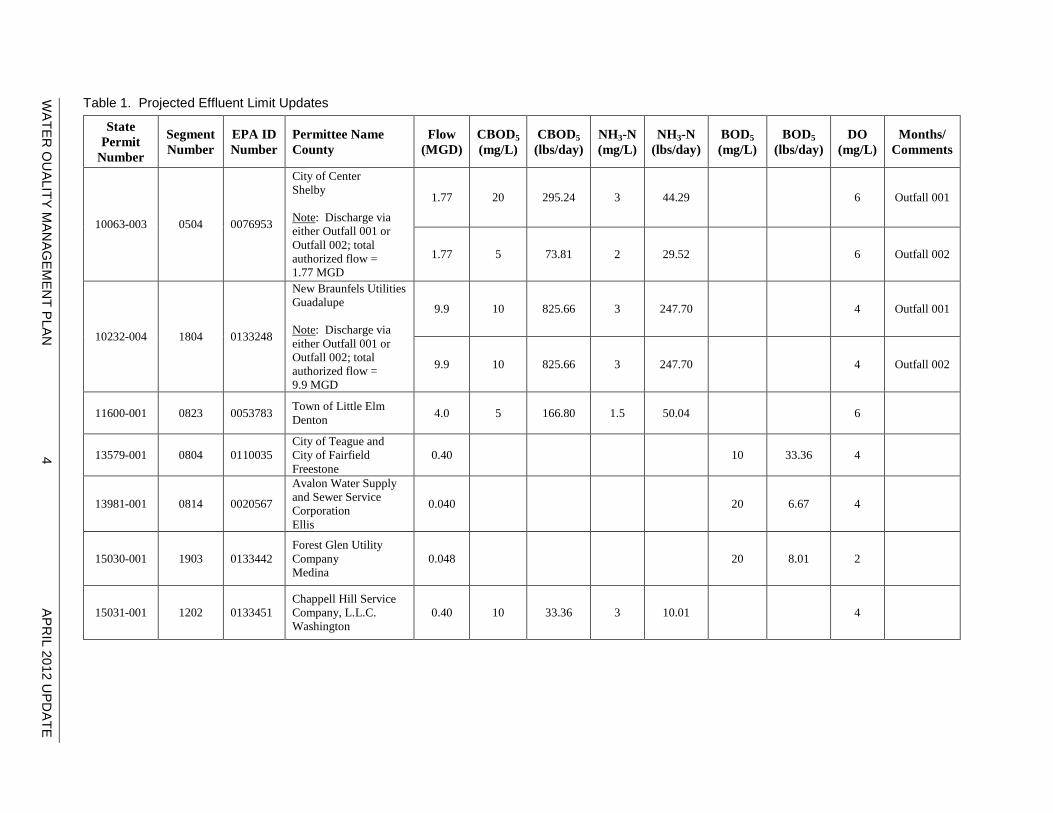
Table 1. Projected Effluent Limit Updates
State Permit
Number
Segment Number
EPA ID Number
Permittee Name County
Flow (MGD)
CBOD5 (mg/L)
CBOD5 (lbs/day)
NH3-N (mg/L)
NH3-N (lbs/day)
BOD5 (mg/L)
BOD5 (lbs/day)
DO (mg/L)
Months/ Comments
10063-003 0504 0076953
City of Center Shelby Note: Discharge via either Outfall 001 or Outfall 002; total authorized flow = 1.77 MGD
1.77 20 295.24 3 44.29 6 Outfall 001
1.77 5 73.81 2 29.52 6 Outfall 002
10232-004 1804 0133248
New Braunfels Utilities Guadalupe Note: Discharge via either Outfall 001 or Outfall 002; total authorized flow = 9.9 MGD
9.9 10 825.66 3 247.70 4 Outfall 001
9.9 10 825.66 3 247.70 4 Outfall 002
11600-001 0823 0053783 Town of Little Elm Denton 4.0 5 166.80 1.5 50.04 6
13579-001 0804 0110035 City of Teague and City of Fairfield Freestone
0.40 10 33.36 4
13981-001 0814 0020567
Avalon Water Supply and Sewer Service Corporation Ellis
0.040 20 6.67 4
15030-001 1903 0133442 Forest Glen Utility Company Medina
0.048 20 8.01 2
15031-001 1202 0133451 Chappell Hill Service Company, L.L.C. Washington
0.40 10 33.36 3 10.01 4
WATER
QU
ALITY MAN
AGEM
ENT P
LAN
4 AP
RIL 2012 U
PDATE
WATER QUALITY MANAGEMENT PLAN 5 APRIL 2012 UPDATE
Planning Information Summary The Water Quality Planning Division of the TCEQ coordinated with the TWDB and regional planning agencies to compile the wastewater facility information in this section. Domestic facility financing decisions under the State Revolving Loan Fund (SRF) program must be consistent with the certified and approved WQMP. The purpose of this section is to present data reflecting facility planning needs, including previous water quality management plan needs requiring revision. Data are also presented to update other plan information for the TWDB’s SRF projects. Table 2 contains the updated Service area population information. The table is organized in alphabetical order and includes the following 10 categories of information: 1. Planning Area
– Area for which facility needs are proposed. The facility planning areas are subject to change during the facility planning process and any such changes will be documented in a later water quality management plan update. All planning areas listed are also designated management agencies (DMAs) unless otherwise noted in the “Comments” column.
2. Service Area
– Area that receives the provided wastewater service.
3. Needs
– A “T” indicates a need for either initial construction of a wastewater treatment plant, additional treatment capacity, or the upgrading of a wastewater treatment plant to meet existing or more stringent effluent requirements. A “C” indicates a need for improvements to, expansion of, rehabilitation of, or the initial construction of a wastewater collection system in the facility planning area. “T/C” indicates a need for both treatment and collection system facilities. More detailed facility planning conducted during a construction project may define additional needs and those needs will be reflected in a future update to the WQMP.
4. Needs Year
– The year in which the needs were identified for the planning area.
5. Basin Name
– The river basin or designated planning area where the entity is located. The seven water quality management planning areas designated by the Governor are Corpus Christi [Coastal Bend Council of Governments (CBCOG)], Killeen-Temple [Central Texas Council of Governments (CTCOG)], Texarkana [Ark-Tex Council of Governments (ATCOG)], Southeast Texas [South East Texas Regional Planning Council (SETRPC)], Lower Rio Grande Valley [Lower Rio Grande Valley Development Council (LRGVDC)], Dallas-Fort Worth [North Central Texas Council of Governments (NCTCOG)] and Houston [Houston-Galveston Area Council (H-GAC)]. Basin names are shown for agencies outside one of these areas.
6. Segment
– The classified stream segment or tributary into which any recommended facility may discharge existing or projected wastewater. In the case of no-discharge facilities, this is the classified stream segment drainage area in which the facilities are located.
7. County
– The county in which the facility planning area is located.
8. Date
– The date the planning information was reviewed by the TCEQ.

WATER QUALITY MANAGEMENT PLAN 6 APRIL 2012 UPDATE
9. Comments
– Additional explanation or other information concerning the facility planning area.
10. Population
– The base year and projected populations for each facility planning area. Population projections presented are consistent with the latest available statewide population projections or represent the most current information obtained from facility planning analyses.
The facility information in this section is intended to be utilized in the preparation of facility plans and the subsequent design and construction of wastewater facilities. Design capacities of the treatment and collection systems will be based upon the population projections contained in this document plus any additional needed capacity established for commercial/industrial flows and documented infiltration/inflow volumes (treatment or rehabilitation). The probable needs shown under the “Needs” heading are preliminary findings; specific needs for an area shall be as established in the completed and certified detailed engineering studies conducted during facility planning under the SRF and other state loan programs. Specific effluent quality for any wastewater discharges resulting from any of the facilities recommended in this document will be in accordance with the rule on the Texas Surface Water Quality Standards in effect at the time of permit issuance for the specific facility.
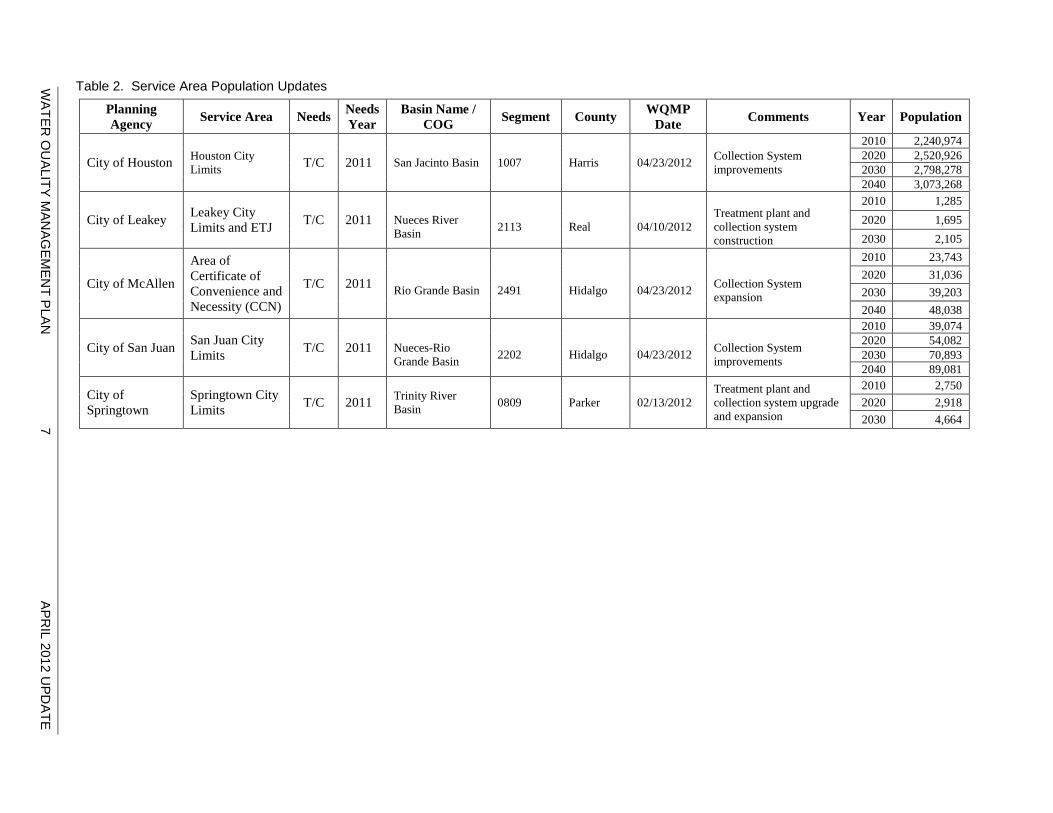
Table 2. Service Area Population Updates
Planning Agency Service Area Needs Needs
Year Basin Name /
COG Segment County WQMP Date Comments Year Population
City of Houston Houston City Limits T/C 2011 San Jacinto Basin 1007 Harris 04/23/2012 Collection System
improvements
2010 2,240,974 2020 2,520,926 2030 2,798,278 2040 3,073,268
City of Leakey Leakey City Limits and ETJ T/C 2011
Nueces River Basin
2113
Real
04/10/2012
Treatment plant and collection system construction
2010 1,285 2020 1,695 2030 2,105
City of McAllen
Area of Certificate of Convenience and Necessity (CCN)
T/C 2011 Rio Grande Basin
2491
Hidalgo
04/23/2012
Collection System expansion
2010 23,743 2020 31,036 2030 39,203 2040 48,038
City of San Juan San Juan City Limits T/C 2011
Nueces-Rio Grande Basin
2202
Hidalgo
04/23/2012
Collection System improvements
2010 39,074 2020 54,082 2030 70,893 2040 89,081
City of Springtown
Springtown City Limits T/C 2011 Trinity River
Basin 0809 Parker 02/13/2012 Treatment plant and collection system upgrade and expansion
2010 2,750 2020 2,918 2030 4,664
WATER
QU
ALITY MAN
AGEM
ENT P
LAN
7
APR
IL 2012 UPD
ATE

WATER QUALITY MANAGEMENT PLAN 8 APRIL 2012 UPDATE
Designated Management Agencies In order to be designated as a management agency for wastewater collection or treatment, an entity must demonstrate the legal, institutional, managerial and financial capability necessary to carry out the entity’s responsibilities in accordance with Section 208 (c) of the Clean Water Act (see below list of requirements). Before an entity can apply for a state revolving fund loan, it must be recommended for designation as the management agency in the approved WQMP. Designation as a management agency does not require the designated entity to provide wastewater services, but enables it to apply for grants and loans to provide the services. The facilities listed in Table 3 have submitted Designated Management Agencies (DMA) resolutions to the TCEQ. The TCEQ submits this DMA information to the EPA for approval as an update to the WQMP.
Section 208 (c) (2) Requirements for Management Agency: 208(c)(2)(A): to carry out portions of an area-wide waste treatment plan. 208(c)(2)(B): to manage waste treatment works. 208(c)(2)(C): directly or by contract to design and construct new works. 208(c)(2)(D): to accept and utilize grants. 208(c)(2)(E): to raise revenues, including assessment of waste treatment charges. 208(c)(2)(F): to incur short and long term indebtedness. 208(c)(2)(G): to assure community pays proportionate cost. 208(c)(2)(H): to refuse to receive waste from non-compliant dischargers. 208(c)(2)(I): to accept for treatment industrial wastes.
Table 3. Designated Management Agencies Updates
Planning Agency Service Area DMA Needs DMA Date DMA Area/Comments
City of McAllen CCN Area T/C 09/09/2011
City of San Juan City Limits/ETJ T/C 02/06/2012
City of Springtown City Limits/ETJ T/C 10/27/2011
WATER QUALITY MANAGEMENT PLAN 9 APRIL 2012 UPDATE
Total Maximum Daily Load Updates The Total Maximum Daily Load (TMDL) Program works to improve water quality in impaired or threatened waters bodies in Texas. The program is authorized by and created to fulfill the requirements of Section 303(d) of the federal Clean Water Act. The goal of a TMDL is to restore the full use of a water body that has limited quality in relation to one or more of its uses. The TMDL defines an environmental target and based on that target, the State develops an implementation plan with waste load allocations for point source dischargers to mitigate anthropogenic (human-caused) sources of pollution within the watershed and restore full use of the water body. The development of TMDLs is a process of intensive data collection and analysis. After adoption by the TCEQ, TMDLs are submitted to the U.S. Environmental Protection Agency for review and approval. The attached appendixes may reflect proposed waste load allocations for new dischargers and revisions to TMDLs. To be consistent, updates will be provided in the same units of measure used in the original TMDL document. And note that for bacteria TMDLs, loads may be expressed in counts for day, organisms per day, colony forming units per day, or similar expressions. These typically reflect different lab methods, but for the purposes of the TMDL program, these terms are considered synonymous.
WATER QUALITY MANAGEMENT PLAN 10 APRIL 2012 UPDATE
Appendix I.
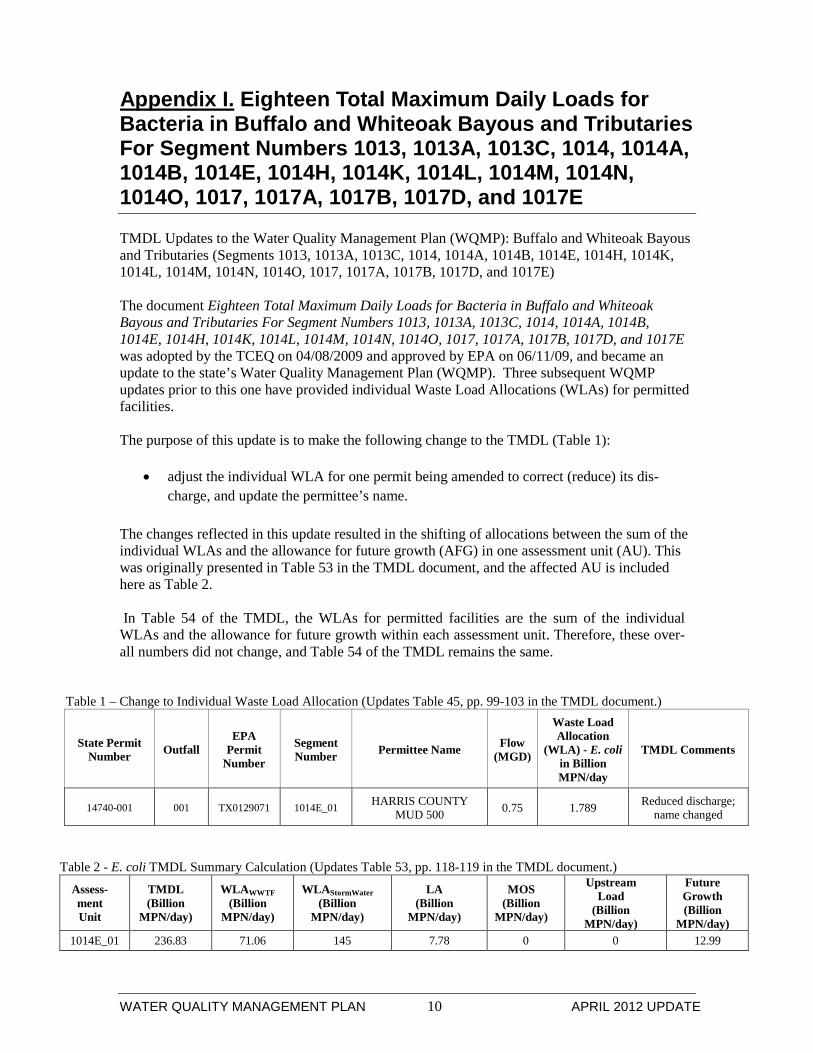
TMDL Updates to the Water Quality Management Plan (WQMP): Buffalo and Whiteoak Bayous and Tributaries (Segments 1013, 1013A, 1013C, 1014, 1014A, 1014B, 1014E, 1014H, 1014K, 1014L, 1014M, 1014N, 1014O, 1017, 1017A, 1017B, 1017D, and 1017E)
Eighteen Total Maximum Daily Loads for Bacteria in Buffalo and Whiteoak Bayous and Tributaries For Segment Numbers 1013, 1013A, 1013C, 1014, 1014A, 1014B, 1014E, 1014H, 1014K, 1014L, 1014M, 1014N, 1014O, 1017, 1017A, 1017B, 1017D, and 1017E
The document Eighteen Total Maximum Daily Loads for Bacteria in Buffalo and Whiteoak Bayous and Tributaries For Segment Numbers 1013, 1013A, 1013C, 1014, 1014A, 1014B, 1014E, 1014H, 1014K, 1014L, 1014M, 1014N, 1014O, 1017, 1017A, 1017B, 1017D, and 1017E was adopted by the TCEQ on 04/08/2009 and approved by EPA on 06/11/09, and became an update to the state’s Water Quality Management Plan (WQMP). Three subsequent WQMP updates prior to this one have provided individual Waste Load Allocations (WLAs) for permitted facilities. The purpose of this update is to make the following change to the TMDL (Table 1):
• adjust the individual WLA for one permit being amended to correct (reduce) its dis-charge, and update the permittee’s name.
The changes reflected in this update resulted in the shifting of allocations between the sum of the individual WLAs and the allowance for future growth (AFG) in one assessment unit (AU). This was originally presented in Table 53 in the TMDL document, and the affected AU is included here as Table 2. In Table 54 of the TMDL, the WLAs for permitted facilities are the sum of the individual WLAs and the allowance for future growth within each assessment unit. Therefore, these over-all numbers did not change, and Table 54 of the TMDL remains the same.
Table 1 – Change to Individual Waste Load Allocation (Updates Table 45, pp. 99-103 in the TMDL document.)
State Permit Number Outfall
EPA Permit
Number
Segment Number Permittee Name Flow
(MGD)
Waste Load Allocation
(WLA) - E. coli in Billion MPN/day
TMDL Comments
14740-001 001 TX0129071 1014E_01 HARRIS COUNTY MUD 500 0.75 1.789 Reduced discharge;
name changed
Table 2 - E. coli TMDL Summary Calculation (Updates Table 53, pp. 118-119 in the TMDL document.)
Assess-ment Unit
TMDL (Billion
MPN/day)
WLAWWTF (Billion
MPN/day)
WLAStormWater (Billion
MPN/day)
LA (Billion
MPN/day)
MOS (Billion
MPN/day)
Upstream Load
(Billion MPN/day)
Future Growth (Billion
MPN/day) 1014E_01 236.83 71.06 145 7.78 0 0 12.99
WATER QUALITY MANAGEMENT PLAN 11 APRIL 2012 UPDATE
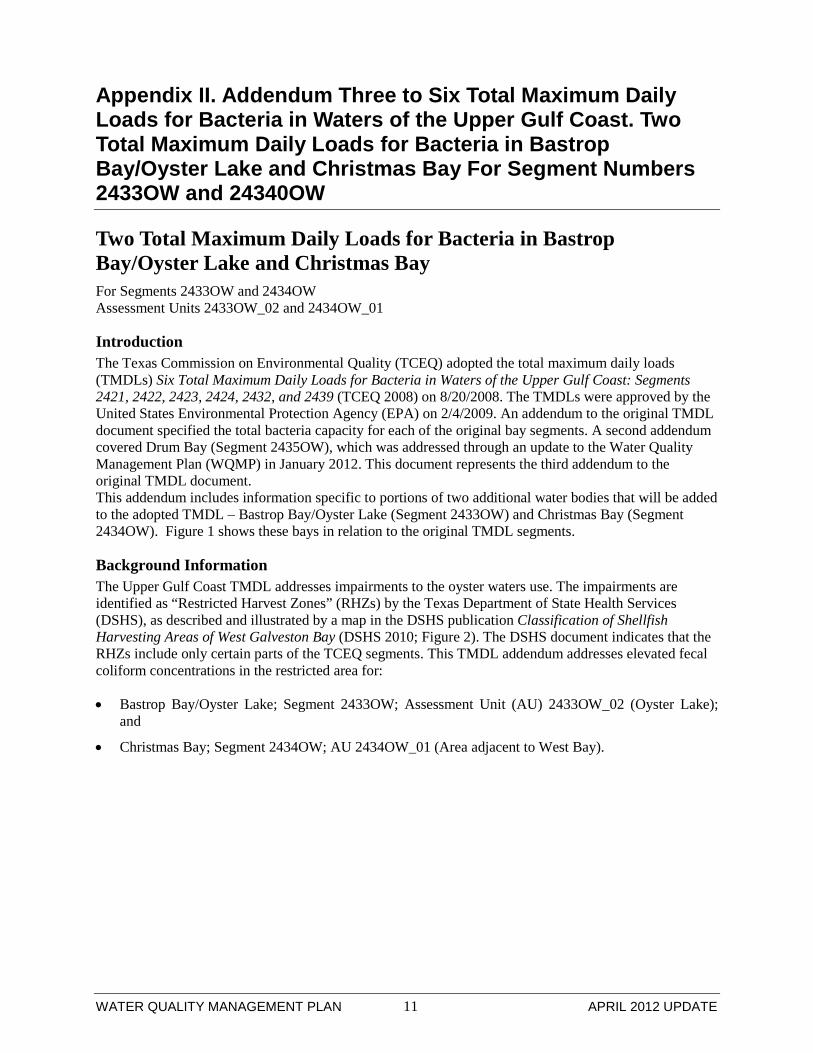
Appendix II. Addendum Three to Six Total Maximum Daily Loads for Bacteria in Waters of the Upper Gulf Coast. Two Total Maximum Daily Loads for Bacteria in Bastrop Bay/Oyster Lake and Christmas Bay For Segment Numbers 2433OW and 24340OW
Two Total Maximum Daily Loads for Bacteria in Bastrop Bay/Oyster Lake and Christmas Bay For Segments 2433OW and 2434OW Assessment Units 2433OW_02 and 2434OW_01
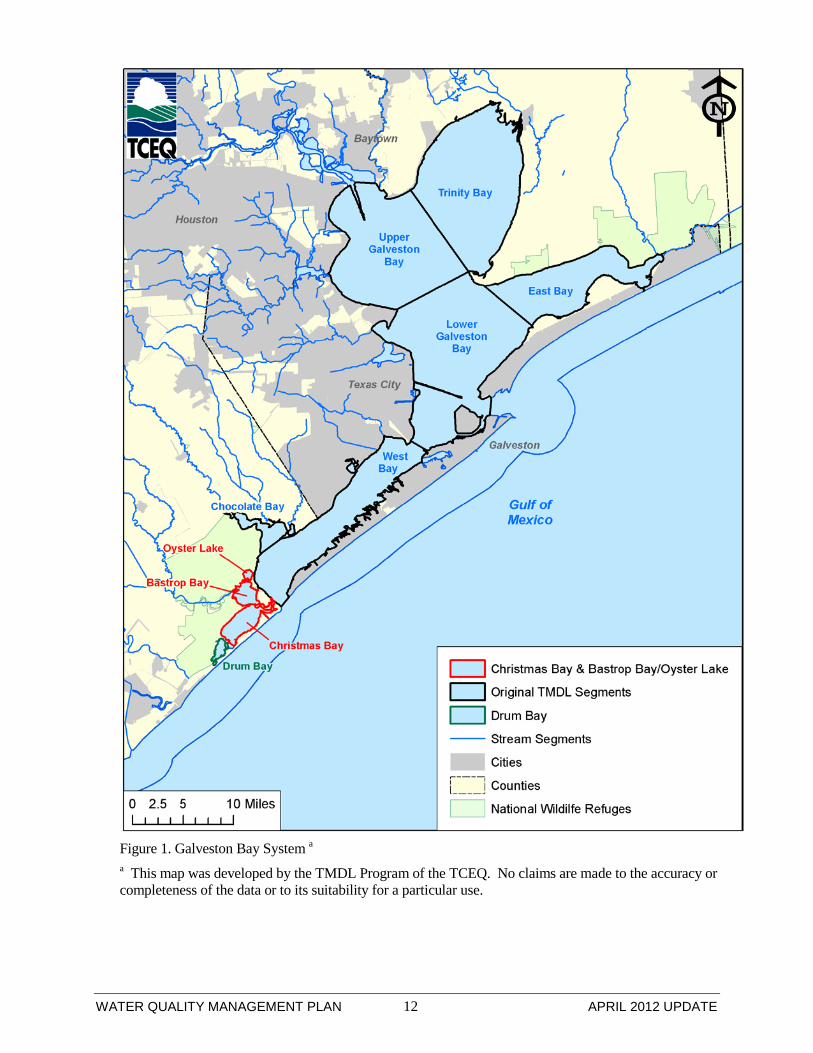
Introduction The Texas Commission on Environmental Quality (TCEQ) adopted the total maximum daily loads (TMDLs) Six Total Maximum Daily Loads for Bacteria in Waters of the Upper Gulf Coast: Segments 2421, 2422, 2423, 2424, 2432, and 2439 (TCEQ 2008) on 8/20/2008. The TMDLs were approved by the United States Environmental Protection Agency (EPA) on 2/4/2009. An addendum to the original TMDL document specified the total bacteria capacity for each of the original bay segments. A second addendum covered Drum Bay (Segment 2435OW), which was addressed through an update to the Water Quality Management Plan (WQMP) in January 2012. This document represents the third addendum to the original TMDL document. This addendum includes information specific to portions of two additional water bodies that will be added to the adopted TMDL – Bastrop Bay/Oyster Lake (Segment 2433OW) and Christmas Bay (Segment 2434OW). Figure 1 shows these bays in relation to the original TMDL segments.
Background Information The Upper Gulf Coast TMDL addresses impairments to the oyster waters use. The impairments are identified as “Restricted Harvest Zones” (RHZs) by the Texas Department of State Health Services (DSHS), as described and illustrated by a map in the DSHS publication Classification of Shellfish Harvesting Areas of West Galveston Bay (DSHS 2010; Figure 2). The DSHS document indicates that the RHZs include only certain parts of the TCEQ segments. This TMDL addendum addresses elevated fecal coliform concentrations in the restricted area for:
• Bastrop Bay/Oyster Lake; Segment 2433OW; Assessment Unit (AU) 2433OW_02 (Oyster Lake); and
• Christmas Bay; Segment 2434OW; AU 2434OW_01 (Area adjacent to West Bay).
WATER QUALITY MANAGEMENT PLAN 12 APRIL 2012 UPDATE
Figure 1. Galveston Bay System a a This map was developed by the TMDL Program of the TCEQ. No claims are made to the accuracy or completeness of the data or to its suitability for a particular use.
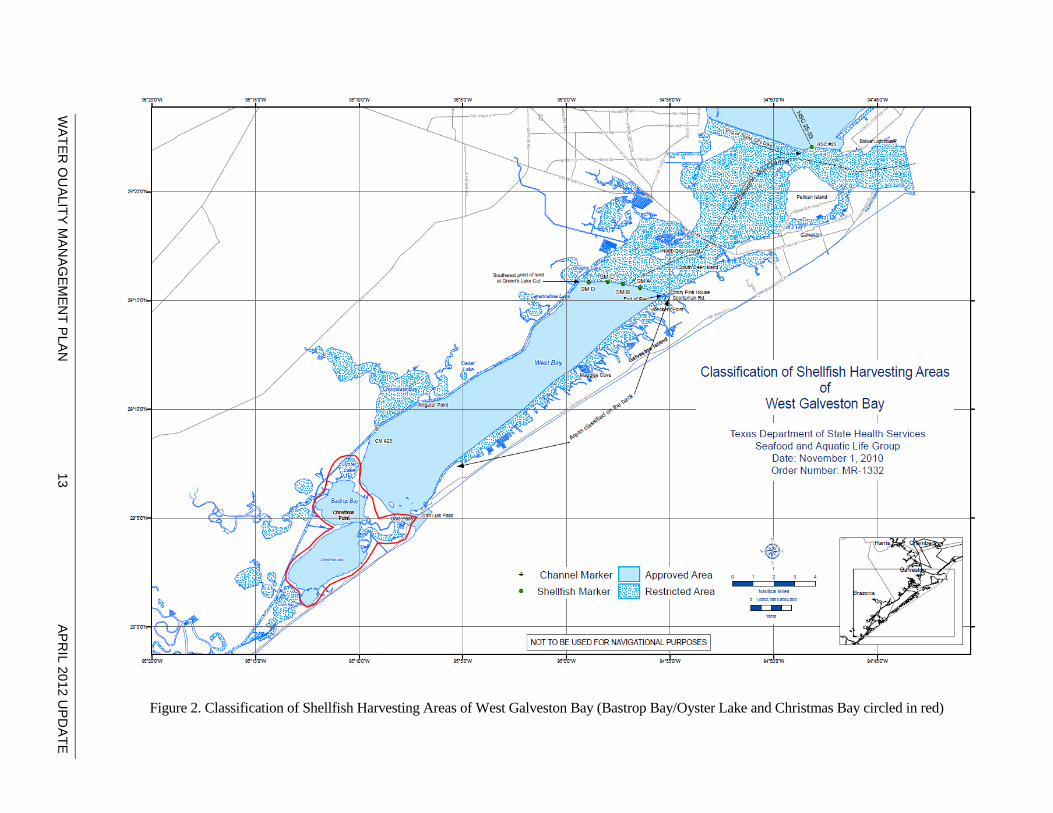
Figure 2. Classification of Shellfish Harvesting Areas of West Galveston Bay (Bastrop Bay/Oyster Lake and Christmas Bay circled in red)
WATER
QU
ALITY MAN
AGEM
ENT P
LAN
13 AP
RIL 2012 U
PDATE
WATER QUALITY MANAGEMENT PLAN 14 APRIL 2012 UPDATE
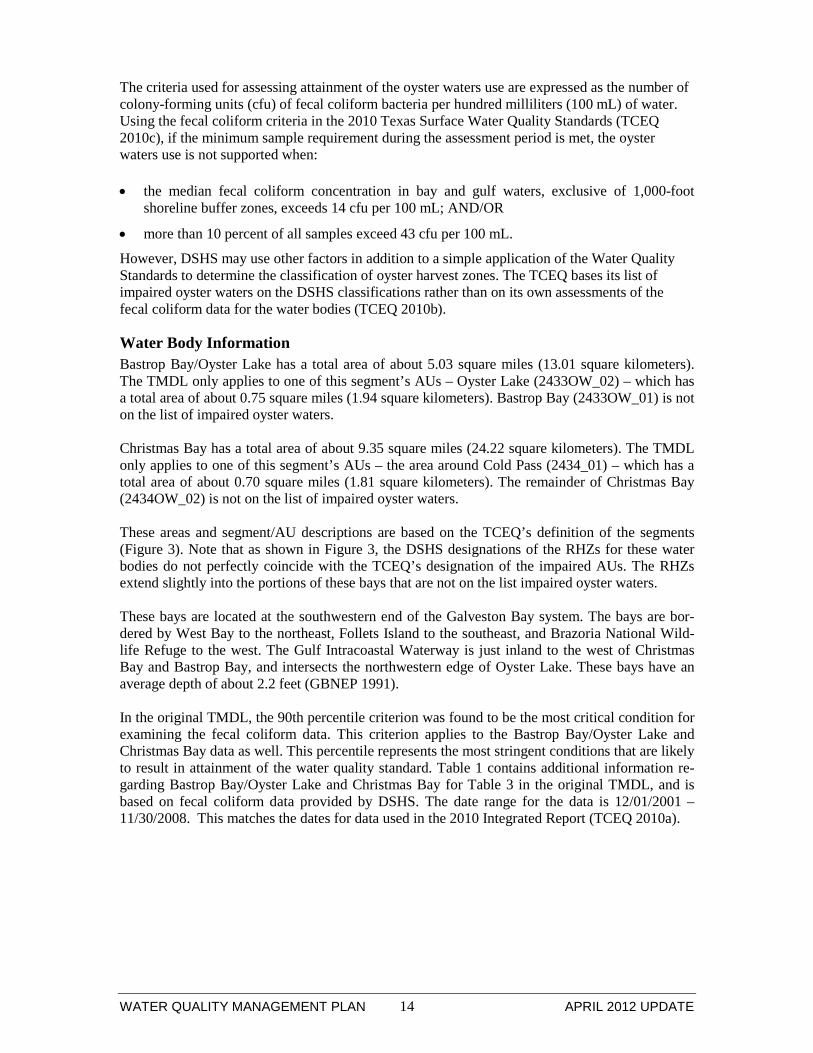
The criteria used for assessing attainment of the oyster waters use are expressed as the number of colony-forming units (cfu) of fecal coliform bacteria per hundred milliliters (100 mL) of water. Using the fecal coliform criteria in the 2010 Texas Surface Water Quality Standards (TCEQ 2010c), if the minimum sample requirement during the assessment period is met, the oyster waters use is not supported when:
• the median fecal coliform concentration in bay and gulf waters, exclusive of 1,000-foot shoreline buffer zones, exceeds 14 cfu per 100 mL; AND/OR
• more than 10 percent of all samples exceed 43 cfu per 100 mL.
However, DSHS may use other factors in addition to a simple application of the Water Quality Standards to determine the classification of oyster harvest zones. The TCEQ bases its list of impaired oyster waters on the DSHS classifications rather than on its own assessments of the fecal coliform data for the water bodies (TCEQ 2010b).
Water Body Information Bastrop Bay/Oyster Lake has a total area of about 5.03 square miles (13.01 square kilometers). The TMDL only applies to one of this segment’s AUs – Oyster Lake (2433OW_02) – which has a total area of about 0.75 square miles (1.94 square kilometers). Bastrop Bay (2433OW_01) is not on the list of impaired oyster waters. Christmas Bay has a total area of about 9.35 square miles (24.22 square kilometers). The TMDL only applies to one of this segment’s AUs – the area around Cold Pass (2434_01) – which has a total area of about 0.70 square miles (1.81 square kilometers). The remainder of Christmas Bay (2434OW_02) is not on the list of impaired oyster waters. These areas and segment/AU descriptions are based on the TCEQ’s definition of the segments (Figure 3). Note that as shown in Figure 3, the DSHS designations of the RHZs for these water bodies do not perfectly coincide with the TCEQ’s designation of the impaired AUs. The RHZs extend slightly into the portions of these bays that are not on the list impaired oyster waters. These bays are located at the southwestern end of the Galveston Bay system. The bays are bor-dered by West Bay to the northeast, Follets Island to the southeast, and Brazoria National Wild-life Refuge to the west. The Gulf Intracoastal Waterway is just inland to the west of Christmas Bay and Bastrop Bay, and intersects the northwestern edge of Oyster Lake. These bays have an average depth of about 2.2 feet (GBNEP 1991). In the original TMDL, the 90th percentile criterion was found to be the most critical condition for examining the fecal coliform data. This criterion applies to the Bastrop Bay/Oyster Lake and Christmas Bay data as well. This percentile represents the most stringent conditions that are likely to result in attainment of the water quality standard. Table 1 contains additional information re-garding Bastrop Bay/Oyster Lake and Christmas Bay for Table 3 in the original TMDL, and is based on fecal coliform data provided by DSHS. The date range for the data is 12/01/2001 – 11/30/2008. This matches the dates for data used in the 2010 Integrated Report (TCEQ 2010a).
WATER QUALITY MANAGEMENT PLAN 15 APRIL 2012 UPDATE
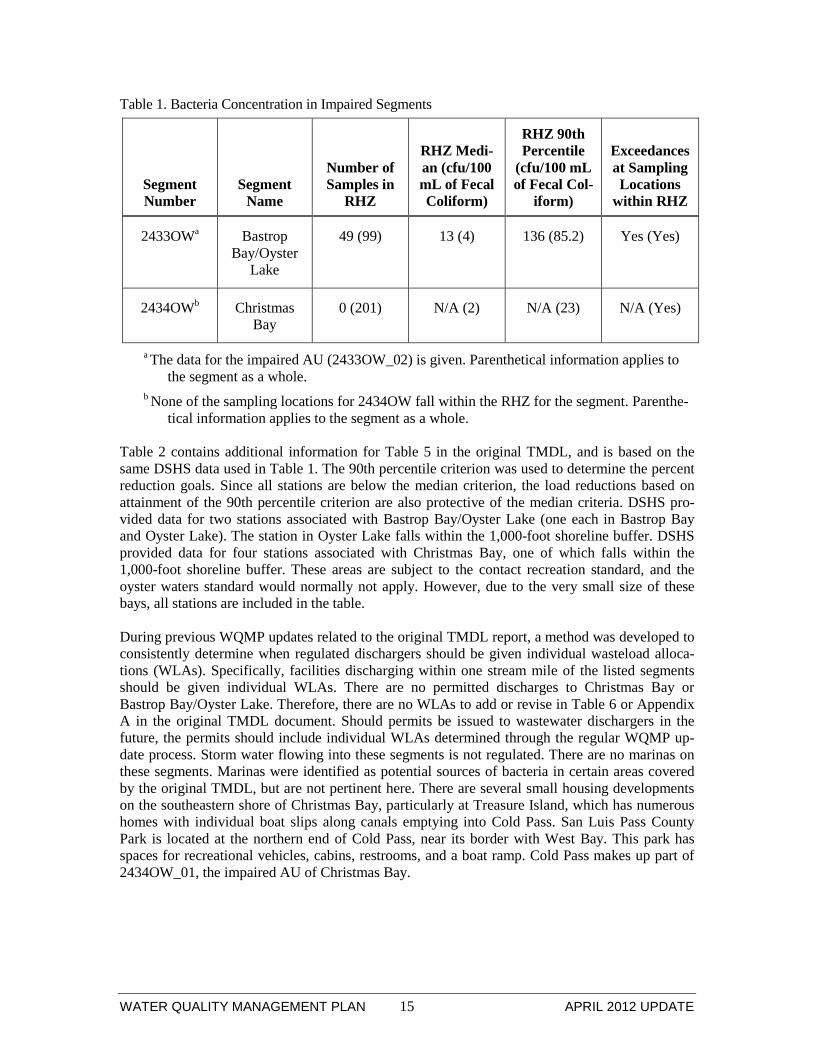
Table 1. Bacteria Concentration in Impaired Segments
Segment Number
Segment Name
Number of Samples in
RHZ
RHZ Medi-an (cfu/100 mL of Fecal Coliform)
RHZ 90th Percentile
(cfu/100 mL of Fecal Col-
iform)
Exceedances at Sampling Locations
within RHZ
2433OWa Bastrop Bay/Oyster
Lake
49 (99) 13 (4) 136 (85.2) Yes (Yes)
2434OWb Christmas Bay
0 (201) N/A (2) N/A (23) N/A (Yes)
a The data for the impaired AU (2433OW_02) is given. Parenthetical information applies to the segment as a whole.
b None of the sampling locations for 2434OW fall within the RHZ for the segment. Parenthe-tical information applies to the segment as a whole.
Table 2 contains additional information for Table 5 in the original TMDL, and is based on the same DSHS data used in Table 1. The 90th percentile criterion was used to determine the percent reduction goals. Since all stations are below the median criterion, the load reductions based on attainment of the 90th percentile criterion are also protective of the median criteria. DSHS pro-vided data for two stations associated with Bastrop Bay/Oyster Lake (one each in Bastrop Bay and Oyster Lake). The station in Oyster Lake falls within the 1,000-foot shoreline buffer. DSHS provided data for four stations associated with Christmas Bay, one of which falls within the 1,000-foot shoreline buffer. These areas are subject to the contact recreation standard, and the oyster waters standard would normally not apply. However, due to the very small size of these bays, all stations are included in the table. During previous WQMP updates related to the original TMDL report, a method was developed to consistently determine when regulated dischargers should be given individual wasteload alloca-tions (WLAs). Specifically, facilities discharging within one stream mile of the listed segments should be given individual WLAs. There are no permitted discharges to Christmas Bay or Bastrop Bay/Oyster Lake. Therefore, there are no WLAs to add or revise in Table 6 or Appendix A in the original TMDL document. Should permits be issued to wastewater dischargers in the future, the permits should include individual WLAs determined through the regular WQMP up-date process. Storm water flowing into these segments is not regulated. There are no marinas on these segments. Marinas were identified as potential sources of bacteria in certain areas covered by the original TMDL, but are not pertinent here. There are several small housing developments on the southeastern shore of Christmas Bay, particularly at Treasure Island, which has numerous homes with individual boat slips along canals emptying into Cold Pass. San Luis Pass County Park is located at the northern end of Cold Pass, near its border with West Bay. This park has spaces for recreational vehicles, cabins, restrooms, and a boat ramp. Cold Pass makes up part of 2434OW_01, the impaired AU of Christmas Bay.
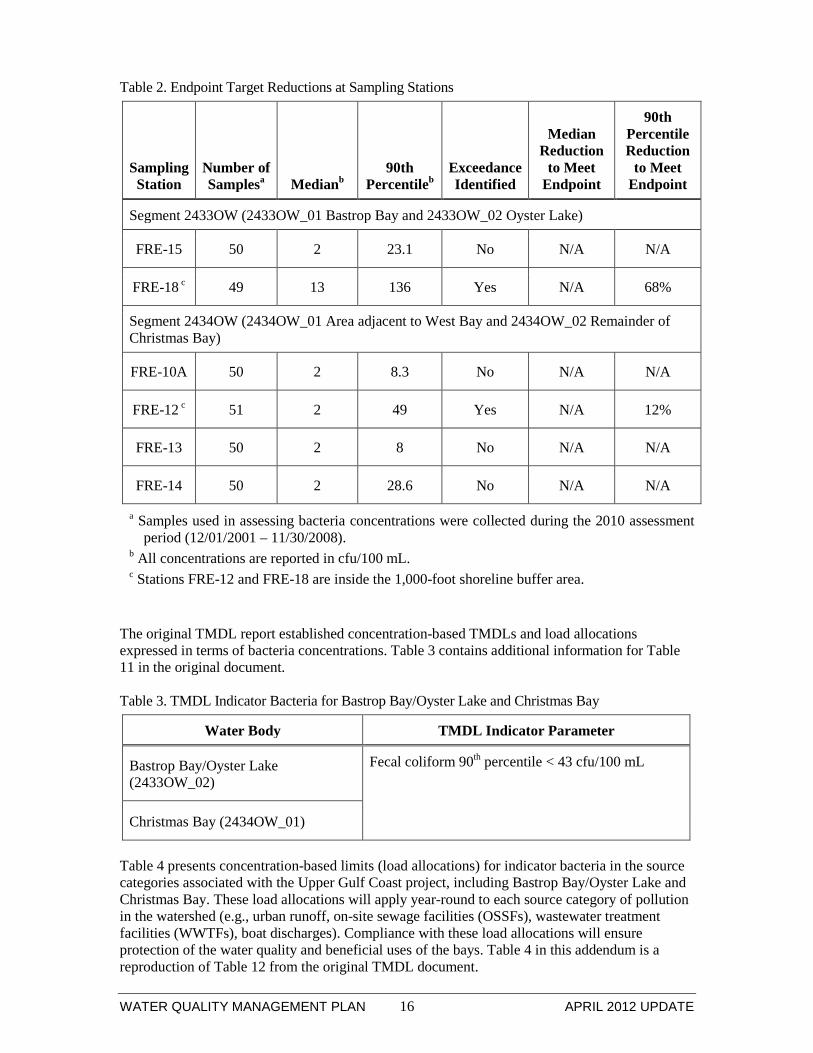
WATER QUALITY MANAGEMENT PLAN 16 APRIL 2012 UPDATE
Table 2. Endpoint Target Reductions at Sampling Stations
Sampling Station
Number of Samplesa Medianb
90th Percentileb
Exceedance Identified
Median Reduction
to Meet Endpoint
90th Percentile Reduction
to Meet Endpoint
Segment 2433OW (2433OW_01 Bastrop Bay and 2433OW_02 Oyster Lake)
FRE-15 50 2 23.1 No N/A N/A
FRE-18 c 49 13 136 Yes N/A 68%
Segment 2434OW (2434OW_01 Area adjacent to West Bay and 2434OW_02 Remainder of Christmas Bay)
FRE-10A 50 2 8.3 No N/A N/A
FRE-12 c 51 2 49 Yes N/A 12%
FRE-13 50 2 8 No N/A N/A
FRE-14 50 2 28.6 No N/A N/A
a Samples used in assessing bacteria concentrations were collected during the 2010 assessment period (12/01/2001 – 11/30/2008).
b All concentrations are reported in cfu/100 mL. c Stations FRE-12 and FRE-18 are inside the 1,000-foot shoreline buffer area.
The original TMDL report established concentration-based TMDLs and load allocations expressed in terms of bacteria concentrations. Table 3 contains additional information for Table 11 in the original document. Table 3. TMDL Indicator Bacteria for Bastrop Bay/Oyster Lake and Christmas Bay
Water Body TMDL Indicator Parameter
Bastrop Bay/Oyster Lake (2433OW_02)
Fecal coliform 90th percentile < 43 cfu/100 mL
Christmas Bay (2434OW_01)
Table 4 presents concentration-based limits (load allocations) for indicator bacteria in the source categories associated with the Upper Gulf Coast project, including Bastrop Bay/Oyster Lake and Christmas Bay. These load allocations will apply year-round to each source category of pollution in the watershed (e.g., urban runoff, on-site sewage facilities (OSSFs), wastewater treatment facilities (WWTFs), boat discharges). Compliance with these load allocations will ensure protection of the water quality and beneficial uses of the bays. Table 4 in this addendum is a reproduction of Table 12 from the original TMDL document.
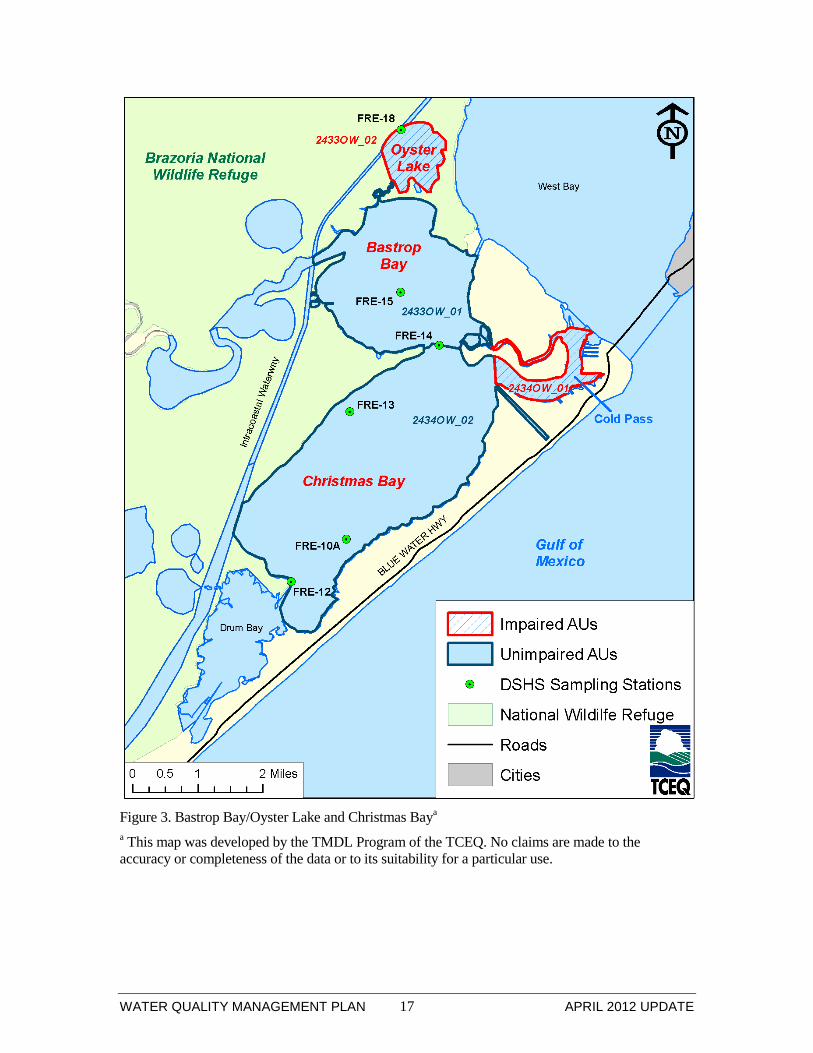
WATER QUALITY MANAGEMENT PLAN 17 APRIL 2012 UPDATE
Figure 3. Bastrop Bay/Oyster Lake and Christmas Baya a This map was developed by the TMDL Program of the TCEQ. No claims are made to the accuracy or completeness of the data or to its suitability for a particular use.

WATER QUALITY MANAGEMENT PLAN 18 APRIL 2012 UPDATE
Table 4. Concentration-Based Pollutant Wasteload and Load Allocations for Upper Gulf Coast Segmentsa
Discharge Type Fecal coliform densities for
Discharges to the RHZ For Discharges to Adjacent Water-
sheds and the 1,000 foot Buffer Zoneb
Wasteload Allocations
Mechanical WWTFsc
Discharges directly to the RHZ are not possibled
Fecal Coliform 200 per 100 mL OR E. coli 126 per 100 mL OR Enterococcus 35 per 100 mL
Wetland WWTFs Discharges directly to the RHZ are not possibled
Wetland systems are measured based on detention time. Human waste must be detained for at least 21 days in sun light before reaching the bay system, unless individual permit requires additional time.
Municipal Separate Storm Sewer Sys-tems (MS4s)c
Discharges directly to the RHZ are not possiblee
Numerical concentrations requirements are unreasonable for storm water runoff. This TMDL will require MS4s to follow implementation of bacteria reduction ef-forts and best management practices.
Load Allocations
OSSFs Discharges directly to the RHZ are not possiblee
0 per 100 mL
Recreational Boat and Ship Dis-charges
0 per 100 mL 0 per 100 mL
Marina Discharges directly to the RHZ are not possibled
0 per 100 mL
Non-Regulated Municipal Runoff
Discharges directly to the RHZ are not possiblee
Numerical concentrations requirements are unreasonable for storm water runoff. Incentive based options will be developed for municipalities with non-regulated runoff. Bacteria reductions will be achieved through the implementation of the resulting implementation plan.
Direct Deposition into Segmentf
The reduction of wildlife or changing natural background conditions is not the intended goal of a TMDL.
The reduction of wildlife or changing natural background conditions is not the intended goal of a TMDL.
a. Allocations are applicable year-round. WLAs apply to any sources (existing or future) subject to regulation by a Texas Pollutant Discharge Elimination System (TPDES) permit.
b. All concentrations limits within the 1,000-foot buffer zone will be based on the geometric means of the applicable indicator bacteria.
c. Regulated entities may use indicator bacteria other than fecal coliform, as listed in individual TPDES permits. Indicator bacteria concentrations for each permit must be consistent with the
WATER QUALITY MANAGEMENT PLAN 19 APRIL 2012 UPDATE
applicable water quality standard for the receiving water. Dischargers releasing effluent into a segment buffer zone shall meet those water quality standards.
d. Discharges to RHZ are not possible for WWTFs and Marinas because DSHS implements safety perimeters known as Prohibited Harvest Zones around this source to protect against any unauthorized discharges of raw sewage.
e. Discharges to RHZ are not possible because TCEQ implements a 1,000-foot buffer zone around this source designated as contact recreation.
f. The listed segments contain wildlife and unmanaged animals and are therefore potential sources.
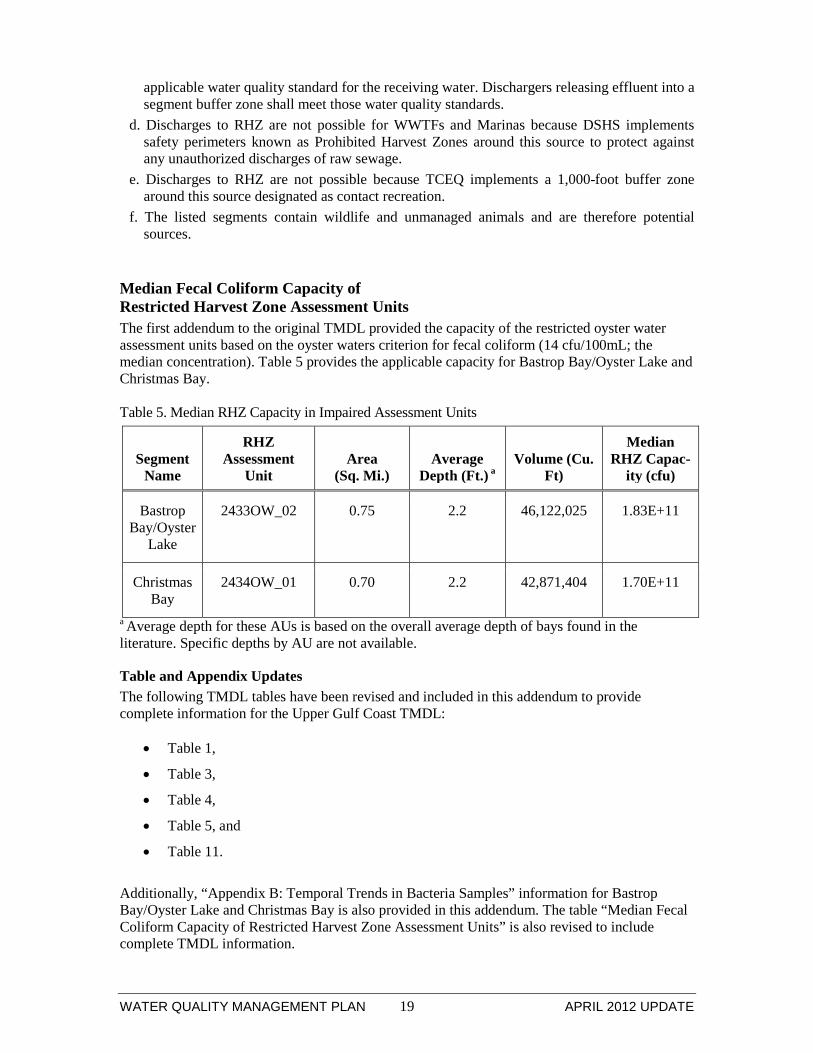
Median Fecal Coliform Capacity of Restricted Harvest Zone Assessment Units The first addendum to the original TMDL provided the capacity of the restricted oyster water assessment units based on the oyster waters criterion for fecal coliform (14 cfu/100mL; the median concentration). Table 5 provides the applicable capacity for Bastrop Bay/Oyster Lake and Christmas Bay. Table 5. Median RHZ Capacity in Impaired Assessment Units
Segment Name
RHZ Assessment
Unit Area
(Sq. Mi.) Average
Depth (Ft.) a Volume (Cu.
Ft)
Median RHZ Capac-
ity (cfu)
Bastrop Bay/Oyster
Lake
2433OW_02 0.75 2.2 46,122,025 1.83E+11
Christmas Bay
2434OW_01 0.70 2.2 42,871,404 1.70E+11
a Average depth for these AUs is based on the overall average depth of bays found in the literature. Specific depths by AU are not available.
Table and Appendix Updates The following TMDL tables have been revised and included in this addendum to provide complete information for the Upper Gulf Coast TMDL:
• Table 1,
• Table 3,
• Table 4,
• Table 5, and
• Table 11.
Additionally, “Appendix B: Temporal Trends in Bacteria Samples” information for Bastrop Bay/Oyster Lake and Christmas Bay is also provided in this addendum. The table “Median Fecal Coliform Capacity of Restricted Harvest Zone Assessment Units” is also revised to include complete TMDL information.
WATER QUALITY MANAGEMENT PLAN 20 APRIL 2012 UPDATE
References DSHS 2010. Classification of Shellfish Harvesting Areas of West Galveston Bay. Texas Depart-
ment of State Health Services. <www.dshs.state.tx.us/Work Area/linkit.aspx? Link Identifi-er=id&ItemID=8589935647>.
GBNEP 1991. An Environmental Inventory of the Christmas Bay Coastal Preserve. Publication GBNEP-7. Galveston Bay National Estuary Program. <http://gbic.tamug.edu/gbeppubs/7/gbnep-7.html>.
TCEQ 2008. Six Total Maximum Daily Loads for Bacteria in Waters of the Upper Gulf Coast: Segments 2421, 2422, 2423, 2424, 2432, and 2439. Texas Commission on Environmental Quality. <www.tceq.state.tx.us/assets/public /implementation/water/ tmdl/74uppercoast/74-uppercoast_tmdlapproved.pdf>.
TCEQ 2010a. 2010 Texas Integrated Report for Clean Water Act Sections 305(b) and 303(d). Texas Commission on Environmental Quality. <www.tceq.texas.gov/water quali-ty/assessment/10twqi/10twqi>.
TCEQ 2010b. Guidance for Assessing and Reporting Surface Water Quality in Texas. Texas Commission on Environmental Quality. <www.tceq.texas.gov/ as-sets/public/compliance/monops/water/10twqi/2010_guidance.pdf>.
TCEQ 2010c. Texas Surface Water Quality Standards. Texas Commission on Environmental Quality. <www.tceq.texas.gov/waterquality/standards/ 2010standards.html>.

WATER QUALITY MANAGEMENT PLAN 21 APRIL 2012 UPDATE
Revised Tables Tables and table numbers from the original TMDL report, revised based on the information in this addendum: Revised Table 1. Characteristics of Impaired Segments of Galveston Bay
Segment Name Segment Number Year Listed
Area (square
kilometers) Percent Area in the RHZ
Upper Galveston Bay 2421 1996 299.1 47%
Trinity Bay 2422 2000 317.5 48%
East Bay 2423 1998 148.9 25%
West Bay 2424 1996 195.3 37%
Chocolate Bay 2432 1996 21.1 100%
Bastrop Bay/Oyster Lake
2433OW 2006 1.9 b 100% b
Christmas Bay 2434OW 2006 1.8 b 100% b
Drum Bay1 2435OW 2010 5.1 100%
Lower Galveston Bay
2439 1996 362.4 27%
1 Inadvertently not included in the first published 2010 Integrated Report. b These numbers are based on the impaired AUs, not the segments as a whole.
Revised Table 3. Bacteria Concentrations in Impaired Segments of Galveston Bay
Segment Number Segment Name
Number of Samples in
RHZ
RHZ Medi-an (cfu/100 mL of Fecal Coliform)
RHZ 90th Percentile
(cfu/100 mL of Fecal
Coliform)
Exceedances at Sampling Locations
within RHZ
2421 Upper Galveston Bay
947 8.0 130.0 Yes
2422 Trinity Bay 376 2.0 33.0 Yes
2423 East Bay 199 2.0 36.2 Yes
2424 West Bay 515 5.0 49.0 Yes
2432 Chocolate Bay 37 5.0 61.0 Yes
2433OWa Bastrop Bay/Oyster Lake
49 (99) 13 (4) 136 (85.2) Yes (Yes)

WATER QUALITY MANAGEMENT PLAN 22 APRIL 2012 UPDATE
Segment Number Segment Name
Number of Samples in
RHZ
RHZ Medi-an (cfu/100 mL of Fecal Coliform)
RHZ 90th Percentile
(cfu/100 mL of Fecal
Coliform)
Exceedances at Sampling Locations
within RHZ
2434OWb Christmas Bay 0 (201) N/A (2) N/A (23) N/A (Yes)
2435OW Drum Bay 245 8 79 Yes
2439 Lower Galveston Bay
707 2.0 49.0 Yes
a The data for the impaired AU (2433OW_02) is given. Parenthetical information applies to the segment as a whole.
b None of the sampling locations for 2434OW fall within the RHZ for the segment. Parenthe-tical information applies to the segment as a whole.
Revised Table 4. Use Attainment of Segments of Galveston Bay
Segment Number Segment Name
Recreational Use Oyster Use
Parame-ter
2421 Upper Galveston Bay
Fully Supporting Dependent upon specific lo-cation
Bacteria
2422 Trinity Bay Fully Supporting Dependent upon specific lo-cation
Bacteria
2423 East Bay Fully Supporting Dependent upon specific lo-cation
Bacteria
2424 West Bay Fully Supporting Dependent upon specific lo-cation
Bacteria
2432 Chocolate Bay Fully Supporting Non-Supporting Bacteria
2433OW Bastrop Bay/Oyster Lake Fully Supporting Non-Supporting a Bacteria
2434OW Christmas Bay Fully Supporting Non-Supporting b Bacteria
2435OW Drum Bay Fully Supporting Non-Supporting Bacteria
2439 Lower Galveston Bay
Fully Supporting Dependent upon specific lo-cation
Bacteria
a AU 2433OW_02 only b AU 2434OW_01 only
WATER QUALITY MANAGEMENT PLAN 23 APRIL 2012 UPDATE
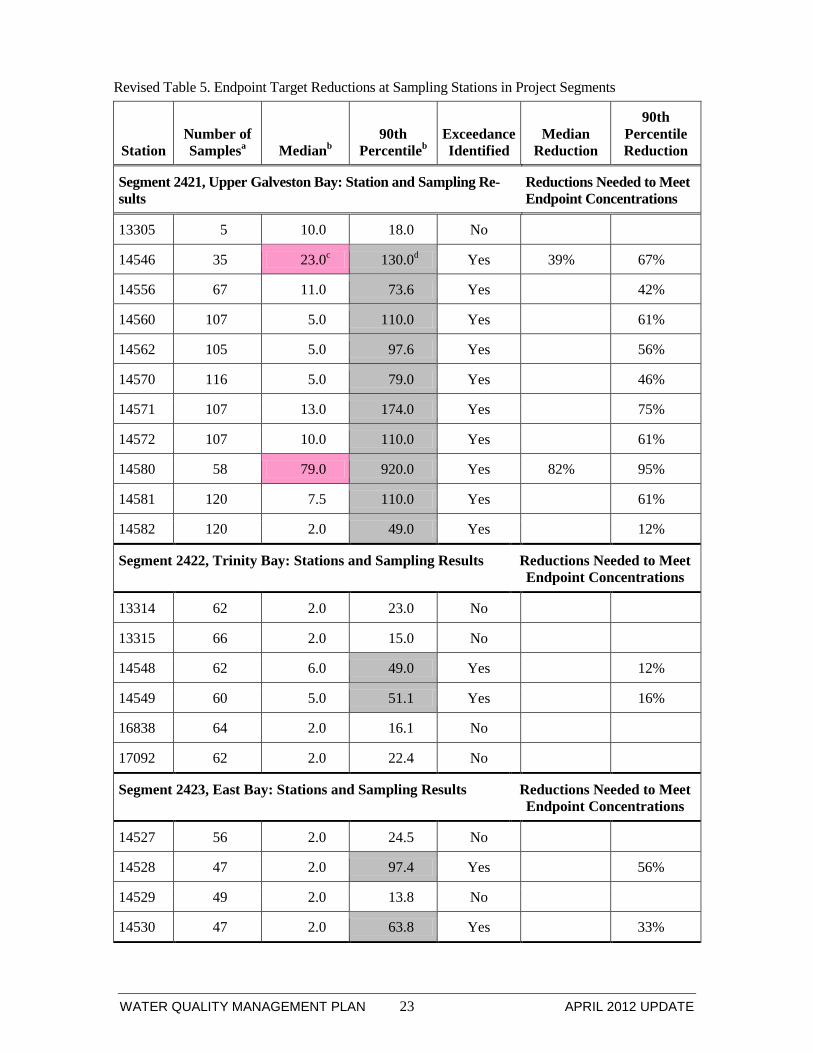
Revised Table 5. Endpoint Target Reductions at Sampling Stations in Project Segments
Station Number of Samplesa Medianb
90th Percentileb
Exceedance Identified
Median Reduction
90th Percentile Reduction
Segment 2421, Upper Galveston Bay: Station and Sampling Re-sults
Reductions Needed to Meet Endpoint Concentrations
13305 5 10.0 18.0 No
14546 35 23.0c 130.0d Yes 39% 67%
14556 67 11.0 73.6 Yes 42%
14560 107 5.0 110.0 Yes 61%
14562 105 5.0 97.6 Yes 56%
14570 116 5.0 79.0 Yes 46%
14571 107 13.0 174.0 Yes 75%
14572 107 10.0 110.0 Yes 61%
14580 58 79.0 920.0 Yes 82% 95%
14581 120 7.5 110.0 Yes 61%
14582 120 2.0 49.0 Yes 12%
Segment 2422, Trinity Bay: Stations and Sampling Results Reductions Needed to Meet Endpoint Concentrations
13314 62 2.0 23.0 No
13315 66 2.0 15.0 No
14548 62 6.0 49.0 Yes 12%
14549 60 5.0 51.1 Yes 16%
16838 64 2.0 16.1 No
17092 62 2.0 22.4 No
Segment 2423, East Bay: Stations and Sampling Results Reductions Needed to Meet Endpoint Concentrations
14527 56 2.0 24.5 No
14528 47 2.0 97.4 Yes 56%
14529 49 2.0 13.8 No
14530 47 2.0 63.8 Yes 33%

WATER QUALITY MANAGEMENT PLAN 24 APRIL 2012 UPDATE
Station Number of Samplesa Medianb
90th Percentileb
Exceedance Identified
Median Reduction
90th Percentile Reduction
Segment 2424, West Bay: Stations and Sampling Results Reductions Needed to Meet Endpoint Concentrations
13321 37 13.0 33.0 No
14607 37 2.0 3.2 No
14608 37 11.0 49.0 Yes 12%
14618 36 2.0 17.0 No
14620 37 11.0 49.0 Yes 12%
14621 37 5.0 33.0 No
14622 36 13.5 94.5 Yes 54%
14623 37 11.0 73.6 Yes 42%
16839 37 8.0 99.4 Yes 57%
16840 37 2.0 9.2 No
16841 37 2.0 19.4 No
16842 37 5.0 73.6 Yes 42%
16844 37 5.0 33.0 No
Segment 2439, Lower Galveston Bay: Stations and Sampling Results
Reductions Needed to Meet Endpoint Concentrations
14576 120 4.0 79.0 Yes 46%
14577 122 8.0 79.0 Yes 46%
14584 122 2.0 49.0 Yes 12%
14594 54 4.0 20.5 No
14595 53 5.0 49.0 Yes 12%
14597 57 2.0 10.0 No
Segment 2432 Chocolate Bay: Stations and Sampling Results Reductions Needed to Meet Endpoint Concentrations
14610 37 5.0 61.0 Yes 30%
Segment 2433OW Bastrop Bay/Oyster Lake: Stations and Sampling Results
Reductions Needed to Meet Endpoint Concentrations
FRE-15 50 2.0 23.1 No

WATER QUALITY MANAGEMENT PLAN 25 APRIL 2012 UPDATE
Station Number of Samplesa Medianb
90th Percentileb
Exceedance Identified
Median Reduction
90th Percentile Reduction
FRE-18 49 13.0 136 Yes 68%
Segment 2434OW Christmas Bay: Stations and Sampling Results
Reductions Needed to Meet Endpoint Concentrations
FRE-10A
50 2.0 8.3 No
FRE-12 51 2.0 49 Yes 12%
FRE-13 50 2.0 8 No
FRE-14 50 2.0 28.6 No
Segment 2435OW Drum Bay: Stations and Sampling Results Reductions Needed to Meet Endpoint Concentrations
FRE-11c
49 10.0 55 Yes 22%
FRE-24 49 11.0 79 Yes 46%
FRE-25 49 7.0 47 Yes 8%
FRE-26 49 11.0 49 Yes 12%
FRE-31 49 8.0 616 Yes 93%
a. Samples used in assessing bacteria concentrations were collected during the years 2001 through 2008 (varies by station).
b. All concentrations are reported in cfu/100 mL. c. Pink shading indicates concentrations exceed the median criterion. d. Gray shading indicates concentrations exceed the 90th percentile criterion.
Revised Table 11. Total Maximum Daily Loads of Indicator Bacteria for
Galveston Bay System Segments
Segment Name TMDL Indicator Parameter
Upper Galveston Bay Trinity Bay East Bay West Bay Chocolate Bay Lower Galveston Bay Drum Bay Bastrop Bay/Oyster Lake Christmas Bay
Fecal coliform 90th Percentile < 43 cfu/100 mL
WATER QUALITY MANAGEMENT PLAN 26 APRIL 2012 UPDATE
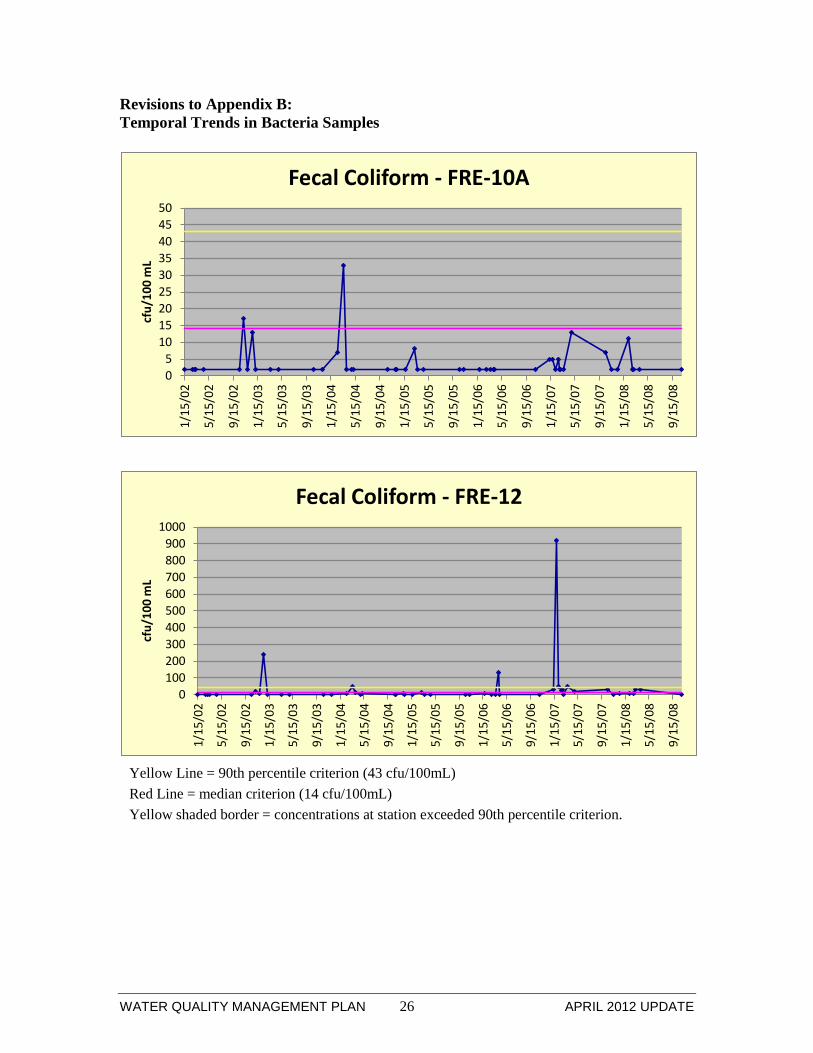
Revisions to Appendix B: Temporal Trends in Bacteria Samples
Yellow Line = 90th percentile criterion (43 cfu/100mL) Red Line = median criterion (14 cfu/100mL) Yellow shaded border = concentrations at station exceeded 90th percentile criterion.
0 5
10 15 20 25 30 35 40 45 50
1/15
/02
5/15
/02
9/15
/02
1/15
/03
5/15
/03
9/15
/03
1/15
/04
5/15
/04
9/15
/04
1/15
/05
5/15
/05
9/15
/05
1/15
/06
5/15
/06
9/15
/06
1/15
/07
5/15
/07
9/15
/07
1/15
/08
5/15
/08
9/15
/08
cfu/
100
mL
Fecal Coliform - FRE-10A
0 100 200 300 400 500 600 700 800 900
1000
1/15
/02
5/15
/02
9/15
/02
1/15
/03
5/15
/03
9/15
/03
1/15
/04
5/15
/04
9/15
/04
1/15
/05
5/15
/05
9/15
/05
1/15
/06
5/15
/06
9/15
/06
1/15
/07
5/15
/07
9/15
/07
1/15
/08
5/15
/08
9/15
/08
cfu/
100
mL
Fecal Coliform - FRE-12
WATER QUALITY MANAGEMENT PLAN 27 APRIL 2012 UPDATE
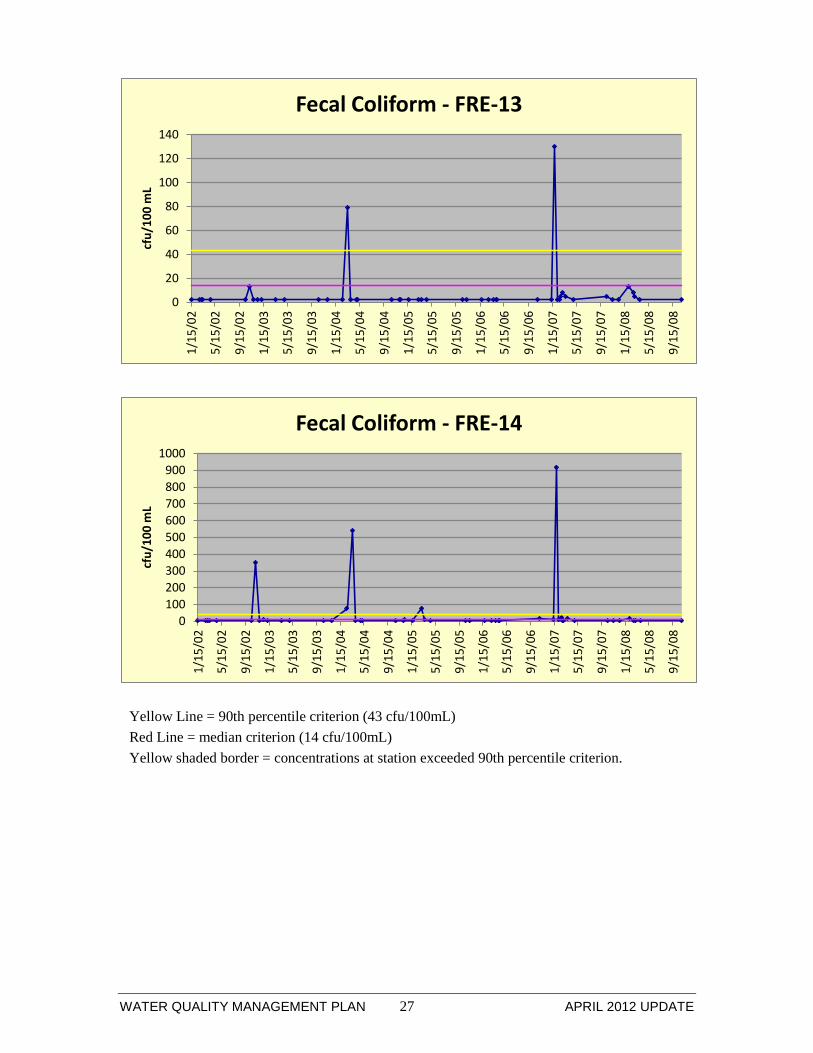
Yellow Line = 90th percentile criterion (43 cfu/100mL) Red Line = median criterion (14 cfu/100mL) Yellow shaded border = concentrations at station exceeded 90th percentile criterion.
0
20
40
60
80
100
120
140
1/15
/02
5/15
/02
9/15
/02
1/15
/03
5/15
/03
9/15
/03
1/15
/04
5/15
/04
9/15
/04
1/15
/05
5/15
/05
9/15
/05
1/15
/06
5/15
/06
9/15
/06
1/15
/07
5/15
/07
9/15
/07
1/15
/08
5/15
/08
9/15
/08
cfu/
100
mL
Fecal Coliform - FRE-13
0 100 200 300 400 500 600 700 800 900
1000
1/15
/02
5/15
/02
9/15
/02
1/15
/03
5/15
/03
9/15
/03
1/15
/04
5/15
/04
9/15
/04
1/15
/05
5/15
/05
9/15
/05
1/15
/06
5/15
/06
9/15
/06
1/15
/07
5/15
/07
9/15
/07
1/15
/08
5/15
/08
9/15
/08
cfu/
100
mL
Fecal Coliform - FRE-14

WATER QUALITY MANAGEMENT PLAN 28 APRIL 2012 UPDATE
Yellow Line = 90th percentile criterion (43 cfu/100mL) Red Line = median criterion (14 cfu/100mL) Yellow shaded border = concentrations at station exceeded 90th percentile criterion.
0 200 400 600 800
1000 1200 1400 1600 1800
1/15
/02
5/15
/02
9/15
/02
1/15
/03
5/15
/03
9/15
/03
1/15
/04
5/15
/04
9/15
/04
1/15
/05
5/15
/05
9/15
/05
1/15
/06
5/15
/06
9/15
/06
1/15
/07
5/15
/07
9/15
/07
1/15
/08
5/15
/08
9/15
/08
cfu/
100
mL
Fecal Coliform - FRE-15
0 200 400 600 800
1000 1200 1400 1600 1800
1/15
/02
5/15
/02
9/15
/02
1/15
/03
5/15
/03
9/15
/03
1/15
/04
5/15
/04
9/15
/04
1/15
/05
5/15
/05
9/15
/05
1/15
/06
5/15
/06
9/15
/06
1/15
/07
5/15
/07
9/15
/07
1/15
/08
5/15
/08
9/15
/08
cfu/
100
mL
Fecal Coliform - FRE-18
WATER QUALITY MANAGEMENT PLAN 29 APRIL 2012 UPDATE
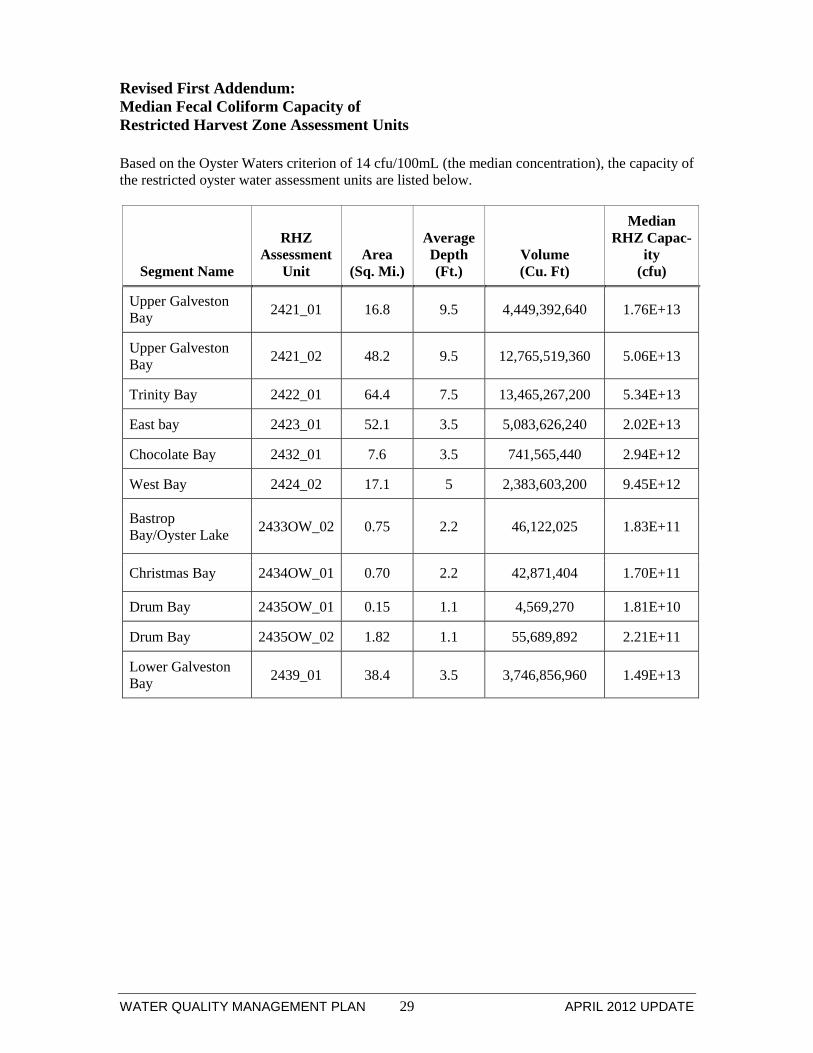
Revised First Addendum: Median Fecal Coliform Capacity of Restricted Harvest Zone Assessment Units
Based on the Oyster Waters criterion of 14 cfu/100mL (the median concentration), the capacity of the restricted oyster water assessment units are listed below.
Segment Name
RHZ Assessment
Unit Area
(Sq. Mi.)
Average Depth (Ft.)
Volume (Cu. Ft)
Median RHZ Capac-
ity (cfu)
Upper Galveston Bay 2421_01 16.8 9.5 4,449,392,640 1.76E+13
Upper Galveston Bay 2421_02 48.2 9.5 12,765,519,360 5.06E+13
Trinity Bay 2422_01 64.4 7.5 13,465,267,200 5.34E+13
East bay 2423_01 52.1 3.5 5,083,626,240 2.02E+13
Chocolate Bay 2432_01 7.6 3.5 741,565,440 2.94E+12
West Bay 2424_02 17.1 5 2,383,603,200 9.45E+12
Bastrop Bay/Oyster Lake 2433OW_02 0.75 2.2 46,122,025 1.83E+11
Christmas Bay 2434OW_01 0.70 2.2 42,871,404 1.70E+11
Drum Bay 2435OW_01 0.15 1.1 4,569,270 1.81E+10
Drum Bay 2435OW_02 1.82 1.1 55,689,892 2.21E+11
Lower Galveston Bay 2439_01 38.4 3.5 3,746,856,960 1.49E+13