Embed Size (px)
Citation preview
April 21, 2014
Initiating Coverage
ICICI Securities Ltd | Retail Equity Research
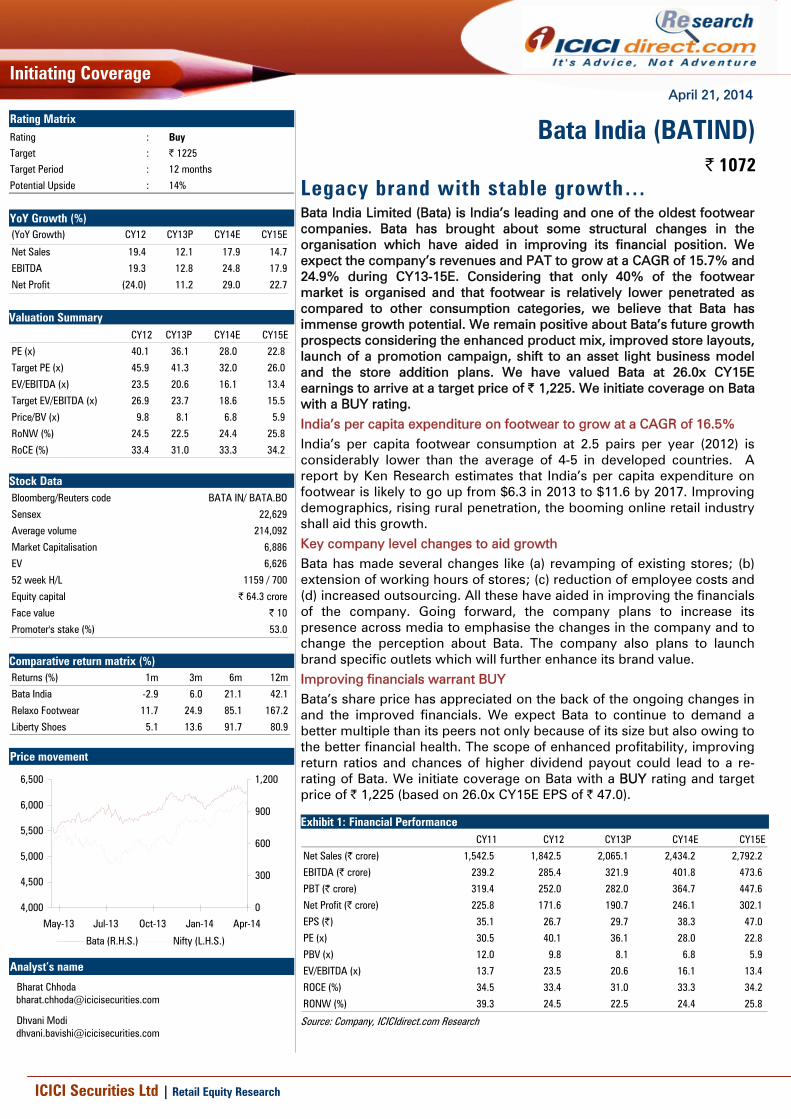
Legacy brand with stable growth… Bata India Limited (Bata) is India’s leading and one of the oldest footwear companies. Bata has brought about some structural changes in the organisation which have aided in improving its financial position. We expect the company’s revenues and PAT to grow at a CAGR of 15.7% and 24.9% during CY13-15E. Considering that only 40% of the footwear market is organised and that footwear is relatively lower penetrated as compared to other consumption categories, we believe that Bata has immense growth potential. We remain positive about Bata’s future growth prospects considering the enhanced product mix, improved store layouts, launch of a promotion campaign, shift to an asset light business model and the store addition plans. We have valued Bata at 26.0x CY15E earnings to arrive at a target price of | 1,225. We initiate coverage on Bata with a BUY rating. India’s per capita expenditure on footwear to grow at a CAGR of 16.5% India’s per capita footwear consumption at 2.5 pairs per year (2012) is considerably lower than the average of 4-5 in developed countries. A report by Ken Research estimates that India’s per capita expenditure on footwear is likely to go up from $6.3 in 2013 to $11.6 by 2017. Improving demographics, rising rural penetration, the booming online retail industry shall aid this growth. Key company level changes to aid growth Bata has made several changes like (a) revamping of existing stores; (b) extension of working hours of stores; (c) reduction of employee costs and (d) increased outsourcing. All these have aided in improving the financials of the company. Going forward, the company plans to increase its presence across media to emphasise the changes in the company and to change the perception about Bata. The company also plans to launch brand specific outlets which will further enhance its brand value. Improving financials warrant BUY Bata’s share price has appreciated on the back of the ongoing changes in and the improved financials. We expect Bata to continue to demand a better multiple than its peers not only because of its size but also owing to the better financial health. The scope of enhanced profitability, improving return ratios and chances of higher dividend payout could lead to a re-rating of Bata. We initiate coverage on Bata with a BUY rating and target price of | 1,225 (based on 26.0x CY15E EPS of | 47.0).
Exhibit 1: Financial Performance CY11 CY12 CY13P CY14E CY15E
Net Sales (| crore) 1,542.5 1,842.5 2,065.1 2,434.2 2,792.2
EBITDA (| crore) 239.2 285.4 321.9 401.8 473.6
PBT (| crore) 319.4 252.0 282.0 364.7 447.6
Net Profit (| crore) 225.8 171.6 190.7 246.1 302.1
EPS (|) 35.1 26.7 29.7 38.3 47.0
PE (x) 30.5 40.1 36.1 28.0 22.8
PBV (x) 12.0 9.8 8.1 6.8 5.9
EV/EBITDA (x) 13.7 23.5 20.6 16.1 13.4
ROCE (%) 34.5 33.4 31.0 33.3 34.2
RONW (%) 39.3 24.5 22.5 24.4 25.8
Source: Company, ICICIdirect.com Research
Bata India (BATIND)| 1072
Rating Matrix Rating : Buy
Target : | 1225
Target Period : 12 months
Potential Upside : 14%
YoY Growth (%) (YoY Growth) CY12 CY13P CY14E CY15E
Net Sales 19.4 12.1 17.9 14.7
EBITDA 19.3 12.8 24.8 17.9
Net Profit (24.0) 11.2 29.0 22.7
Valuation Summary CY12 CY13P CY14E CY15E
PE (x) 40.1 36.1 28.0 22.8
Target PE (x) 45.9 41.3 32.0 26.0
EV/EBITDA (x) 23.5 20.6 16.1 13.4
Target EV/EBITDA (x) 26.9 23.7 18.6 15.5
Price/BV (x) 9.8 8.1 6.8 5.9
RoNW (%) 24.5 22.5 24.4 25.8
RoCE (%) 33.4 31.0 33.3 34.2
Stock Data Bloomberg/Reuters code BATA IN/ BATA.BO
Sensex 22,629
Average volume 214,092
Market Capitalisation 6,886
EV 6,626
52 week H/L 1159 / 700
Equity capital | 64.3 crore
Face value | 10
Promoter's stake (%) 53.0
Comparative return matrix (%) Returns (%) 1m 3m 6m 12m
Bata India -2.9 6.0 21.1 42.1
Relaxo Footwear 11.7 24.9 85.1 167.2
Liberty Shoes 5.1 13.6 91.7 80.9 Price movement
0
300
600
900
1,200
Apr-14Jan-14Oct-13Jul-13May-13
4,000
4,500
5,000
5,500
6,000
6,500
Bata (R.H.S.) Nifty (L.H.S.)
Analyst’s name
Bharat Chhoda [email protected]
Dhvani Modi [email protected]
Page 2ICICI Securities Ltd | Retail Equity Research
Company Background Bata India Ltd (Bata) is India’s oldest, largest as well as one of the fastest growing shoe retailers. The company was promoted by Leader AG, a member of the Bata Shoe Organisation. The Bata Shoe Organisation, founded in 1894, is a family-owned footwear and fashion accessory manufacturer and retailer. It was one of the world’s first shoe manufacturers; a team of stitchers and shoemakers creating footwear not just for neighbours but for distant retail merchants. Today, it has a presence in 70 countries over five continents.
Bata’s India operations commenced in 1931 when it was incorporated as Bata Shoe Company Pvt Ltd for manufacturing and marketing all types of footwear, footwear components, leather and products allied to the footwear trade. The company initially set up a small operation unit at Konnagar (near Kolkata) in 1932. The company went public in 1973 and the name was then changed to ‘Bata India Ltd’. Bata manufactures footwear for men, women and children. Its product portfolio includes leather, rubber, canvas and PVC shoes.
The Bata Shoe Organisation provides an important interchange of new manufacturing technologies, machine design, factory layout plans advertising market forecasts, fashion trends, modern marketing techniques and new material testing. Apart from this, it provides information on the most advanced machinery and technology for production of shoes to the Bata group of companies, including Bata India.
Over the years, the company has tied up with various brands and currently owns brands like Hush Puppies, Dr Scholl’s, Marie Claire, Northstar, Power, Sparx, Weinbrenner, Naturalizer and Sundrops. Apart from these, the company has in-house brands like Bata Industrials, Mocassino, Ambassador and Bata Comfit.
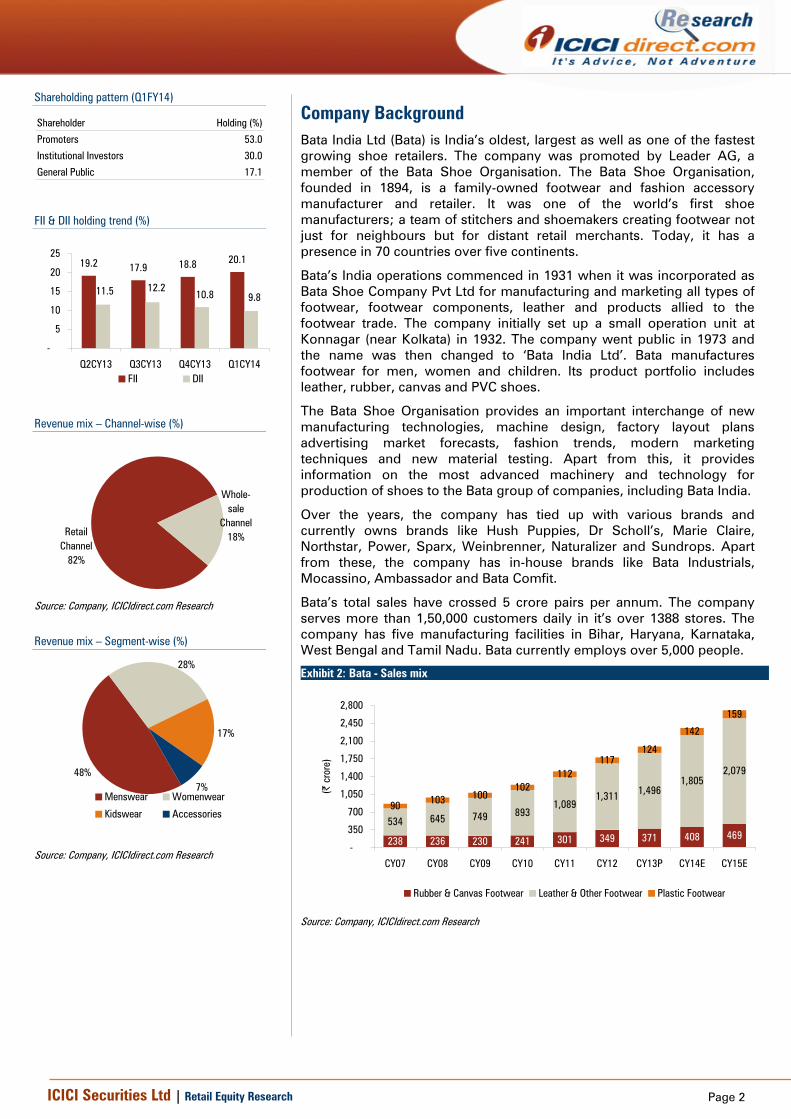
Bata’s total sales have crossed 5 crore pairs per annum. The company serves more than 1,50,000 customers daily in it’s over 1388 stores. The company has five manufacturing facilities in Bihar, Haryana, Karnataka, West Bengal and Tamil Nadu. Bata currently employs over 5,000 people.
Exhibit 2: Bata - Sales mix
238 236 230 241 301 349 371 408 469534 645 749 893
1,0891,311 1,496
1,8052,079
90 103 100102
112117
124
142
159
-
350
700
1,050
1,400
1,750
2,100
2,450
2,800
CY07 CY08 CY09 CY10 CY11 CY12 CY13P CY14E CY15E
(| c
rore
)
Rubber & Canvas Footwear Leather & Other Footwear Plastic Footwear
Source: Company, ICICIdirect.com Research
Shareholding pattern (Q1FY14)
Shareholder Holding (%)
Promoters 53.0
Institutional Investors 30.0
General Public 17.1
FII & DII holding trend (%)
19.2 17.9 18.8 20.1
9.810.812.211.5
-
5
10
15
20
25
Q2CY13 Q3CY13 Q4CY13 Q1CY14FII DII
Revenue mix – Channel-wise (%)
Retail Channel
82%
Whole-sale
Channel18%
Source: Company, ICICIdirect.com Research Revenue mix – Segment-wise (%)
48%
17%
7%
28%
Menswear Womenwear
Kidswear Accessories
Source: Company, ICICIdirect.com Research
Page 3ICICI Securities Ltd | Retail Equity Research
Exhibit 3: Bata's journey thus far...
es
Timeline1894 The Bata Shoe Organisation was founded by Tomas J. Bata, a ninth generation shoe maker
1931 The Bata Shoe Company Pvt Ltd was incorporated in India
1933The production of footwear commenced in rented premises at Konnagar, a few miles away fromKolkata, where for the first time rubber and canvas shoes were manufactured in India
1934 The first manufactuing unit was set up in the outskirts of Kolkata (now known as Batanagar)
1936The factory operation shifted from Konnagar to Batanagar. Towards the end of 1936, thefactory produced leather footwear for the first time.
1937 Batanagar tannery became operational towards the end of 1937
1942A footwear manufacture plant, a machinery department was set up at Batanagar, which produced thefirst India-made major shoe machine. Simultaneously, several auxiliary departments were started.Thereafter, another factory was set up at Bataganj, Bihar
1950 Bata launched the brand 'Hawai'
1951 The rubber/canvas factory was set up at Faridabad, Haryana
1952 One of Asia’s largest tanneries was set up at Mokemehghat, Bihar
1973With the public issue , Leader AG St Moritz, Switzerland offered for sale 5,00,000 shares out of theirholdings at a premium of | 20 per share
1977 Leader AG St Moritz, Switzerland further reduced its stake to 40%
1979 Bonus issue in the ratio 1:4
1984 Bonus issue in the ratio 2:5
1987 Bonus issue in the ratio 1:1
1988
(i) The Bata factory was set up in Peenya, Bangalore; (ii) Signed an agreement with Adidas, WestGermany for manufacture and marketing of sports and special applicationfootwear, sports goods and sportswear in India; (iii) started marketing 'Star' clothings, US; (iv) A new
brand of shoe, `Tigre' was introduced1989 The company sucessfully launched `Adidas' collection of hi-tech sports footwear
1992The workers at Batanagar factory went on strike from January 3 to May 23, thereby affectingproduction for six months
1993(i) Batanagar factory became the first Indian shoe-manufacturing unit to receive the ISO 9001certification; (ii) came out with rights issue in the ratio of 1:1
1994The company’s factory at Hosur in Tamil Nadu became operational. This was originally an exportoriented unit but now caters to the domestic Indian market
1997 Entered into a marketing tie-up with Nike to offer Nike's products at select Bata outlets
1998 Agreed to sell Hush Puppies and Marie Claire brand of shoes
1999 Launched the 'Sundrops' brand
2002 Shareholders approved transfer of tannery & footwear division to separate companies
2003 Forged an agreement with Lee Cooper Shoes to retail their shoes
2005 Came out with rights issue in the ratio of 1:4
Source: Company, ICICIdirect.com Research
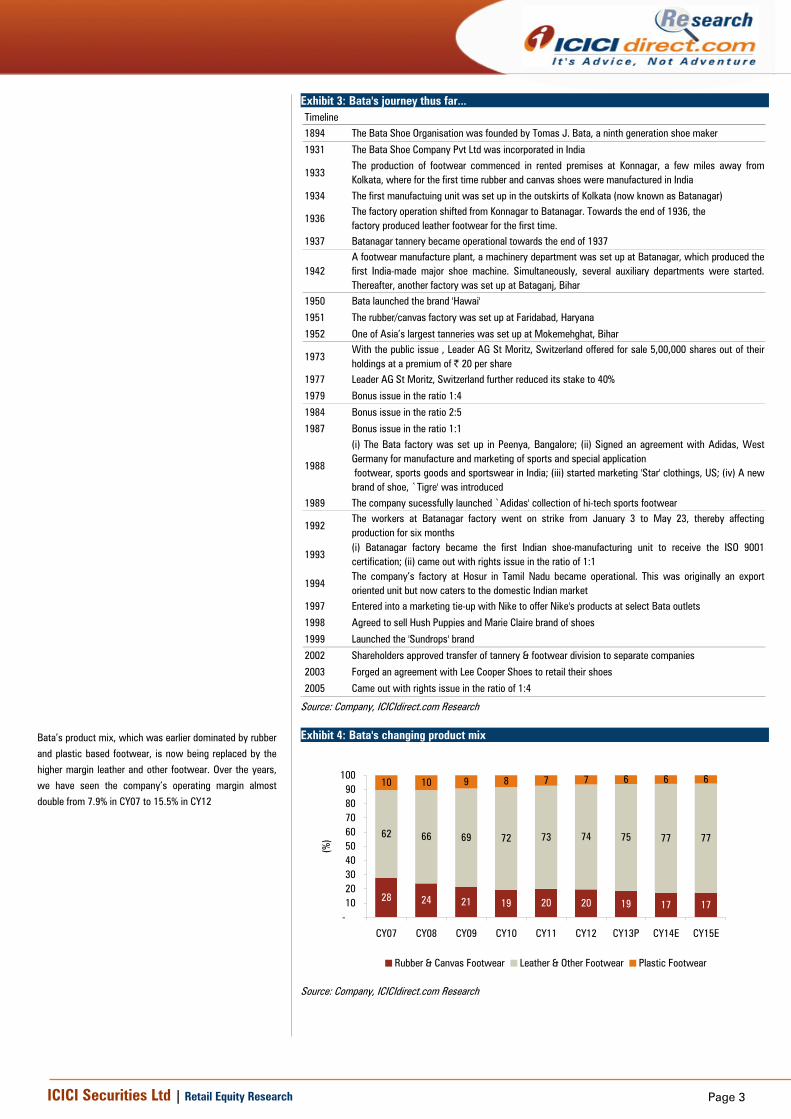
Exhibit 4: Bata's changing product mix
28 24 21 19 20 20 19 17 17
62 66 69 72 73 74 75 77 77
10 10 9 8 7 7 6 6 6
-102030405060708090
100
CY07 CY08 CY09 CY10 CY11 CY12 CY13P CY14E CY15E
(%)
Rubber & Canvas Footwear Leather & Other Footwear Plastic Footwear
Source: Company, ICICIdirect.com Research
Bata’s product mix, which was earlier dominated by rubber
and plastic based footwear, is now being replaced by the
higher margin leather and other footwear. Over the years,
we have seen the company’s operating margin almost
double from 7.9% in CY07 to 15.5% in CY12
Page 4ICICI Securities Ltd | Retail Equity Research
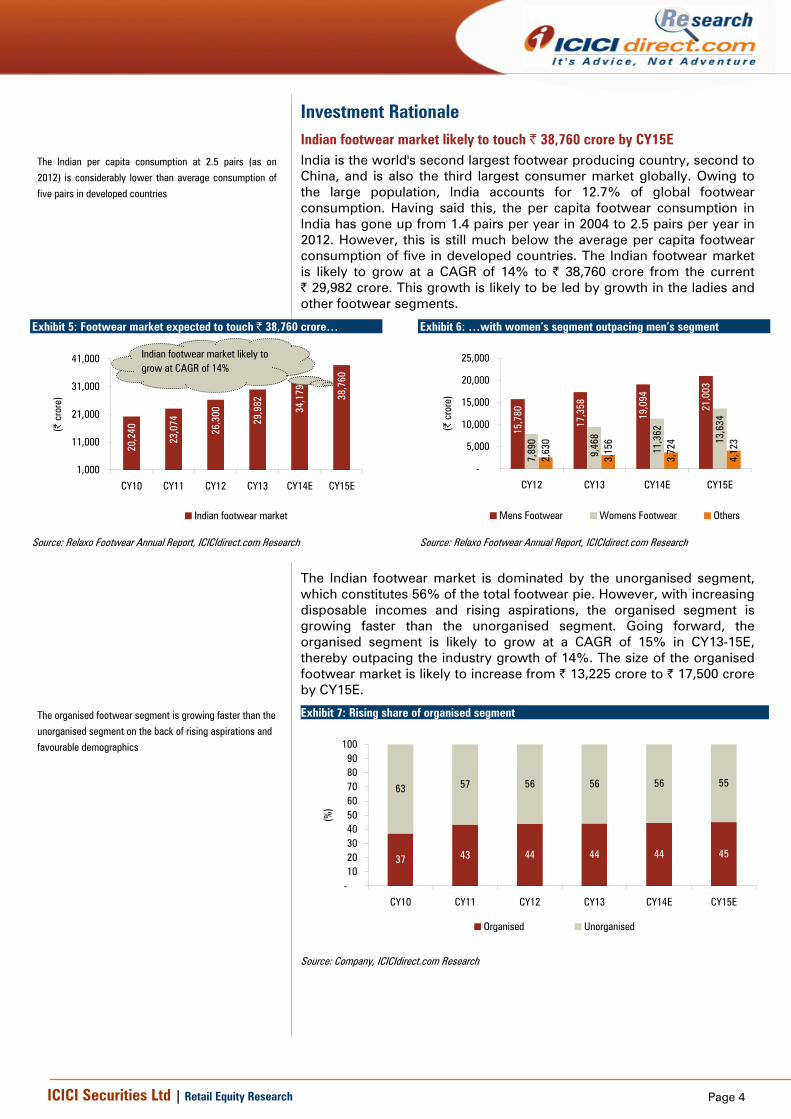
Investment Rationale Indian footwear market likely to touch | 38,760 crore by CY15E India is the world's second largest footwear producing country, second to China, and is also the third largest consumer market globally. Owing to the large population, India accounts for 12.7% of global footwear consumption. Having said this, the per capita footwear consumption in India has gone up from 1.4 pairs per year in 2004 to 2.5 pairs per year in 2012. However, this is still much below the average per capita footwear consumption of five in developed countries. The Indian footwear market is likely to grow at a CAGR of 14% to | 38,760 crore from the current | 29,982 crore. This growth is likely to be led by growth in the ladies and other footwear segments.
Exhibit 5: Footwear market expected to touch | 38,760 crore…
20,2
40
23,0
74
26,3
00
29,9
82 34,1
79 38,7
60
1,000
11,000
21,000
31,000
41,000
CY10 CY11 CY12 CY13 CY14E CY15E
(| c
rore
)
Indian footwear market
Indian footwear market likely to grow at CAGR of 14%
Source: Relaxo Footwear Annual Report, ICICIdirect.com Research
Exhibit 6: …with women’s segment outpacing men’s segment
15,7
80
17,3
58
19,0
94
21,0
03
7,89
0
9,46
8
11,3
62
13,6
34
2,63
0
3,15
6
3,72
4
4,12
3
-
5,000
10,000
15,000
20,000
25,000
CY12 CY13 CY14E CY15E
(| c
rore
)
Mens Footwear Womens Footwear Others
Source: Relaxo Footwear Annual Report, ICICIdirect.com Research
The Indian footwear market is dominated by the unorganised segment, which constitutes 56% of the total footwear pie. However, with increasing disposable incomes and rising aspirations, the organised segment is growing faster than the unorganised segment. Going forward, the organised segment is likely to grow at a CAGR of 15% in CY13-15E, thereby outpacing the industry growth of 14%. The size of the organised footwear market is likely to increase from | 13,225 crore to | 17,500 crore by CY15E.
Exhibit 7: Rising share of organised segment
37 43 44 44 44 45
63 57 56 56 56 55
-102030405060708090
100
CY10 CY11 CY12 CY13 CY14E CY15E
(%)
Organised Unorganised
Source: Company, ICICIdirect.com Research
The Indian per capita consumption at 2.5 pairs (as on
2012) is considerably lower than average consumption of
five pairs in developed countries
The organised footwear segment is growing faster than the
unorganised segment on the back of rising aspirations and
favourable demographics
Page 5ICICI Securities Ltd | Retail Equity Research
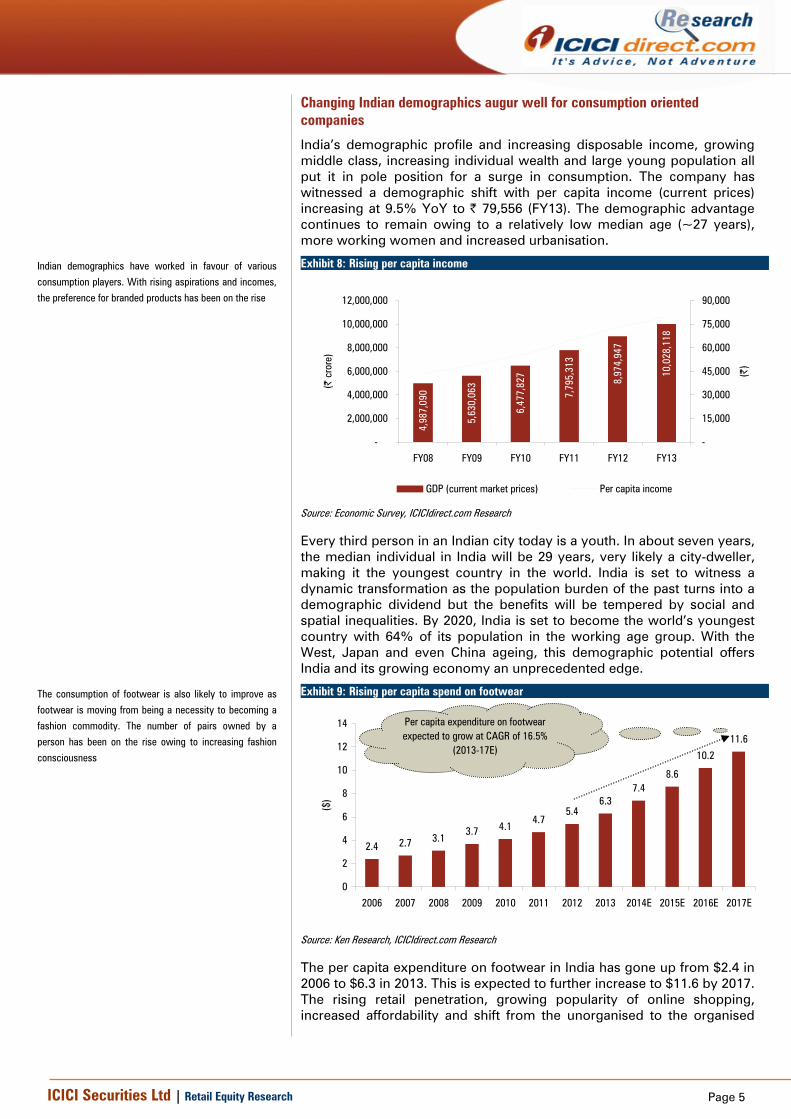
Changing Indian demographics augur well for consumption oriented companies
India’s demographic profile and increasing disposable income, growing middle class, increasing individual wealth and large young population all put it in pole position for a surge in consumption. The company has witnessed a demographic shift with per capita income (current prices) increasing at 9.5% YoY to | 79,556 (FY13). The demographic advantage continues to remain owing to a relatively low median age (~27 years), more working women and increased urbanisation.
Exhibit 8: Rising per capita income
4,98
7,09
0
5,63
0,06
3
6,47
7,82
7
7,79
5,31
3
8,97
4,94
7
10,0
28,1
18
-
2,000,000
4,000,000
6,000,000
8,000,000
10,000,000
12,000,000
FY08 FY09 FY10 FY11 FY12 FY13
(| c
rore
)
-
15,000
30,000
45,000
60,000
75,000
90,000
(|)
GDP (current market prices) Per capita income
Source: Economic Survey, ICICIdirect.com Research
Every third person in an Indian city today is a youth. In about seven years, the median individual in India will be 29 years, very likely a city-dweller, making it the youngest country in the world. India is set to witness a dynamic transformation as the population burden of the past turns into a demographic dividend but the benefits will be tempered by social and spatial inequalities. By 2020, India is set to become the world’s youngest country with 64% of its population in the working age group. With the West, Japan and even China ageing, this demographic potential offers India and its growing economy an unprecedented edge.
Exhibit 9: Rising per capita spend on footwear
2.4 2.7 3.13.7 4.1
4.75.4
6.37.4
8.6
10.2
11.6
0
2
4
6
8
10
12
14
2006 2007 2008 2009 2010 2011 2012 2013 2014E 2015E 2016E 2017E
($)
Per capita expenditure on footwear expected to grow at CAGR of 16.5%
(2013-17E)
Source: Ken Research, ICICIdirect.com Research
The per capita expenditure on footwear in India has gone up from $2.4 in 2006 to $6.3 in 2013. This is expected to further increase to $11.6 by 2017. The rising retail penetration, growing popularity of online shopping, increased affordability and shift from the unorganised to the organised
Indian demographics have worked in favour of various
consumption players. With rising aspirations and incomes,
the preference for branded products has been on the rise
The consumption of footwear is also likely to improve as
footwear is moving from being a necessity to becoming a
fashion commodity. The number of pairs owned by a
person has been on the rise owing to increasing fashion
consciousness
Page 6ICICI Securities Ltd | Retail Equity Research
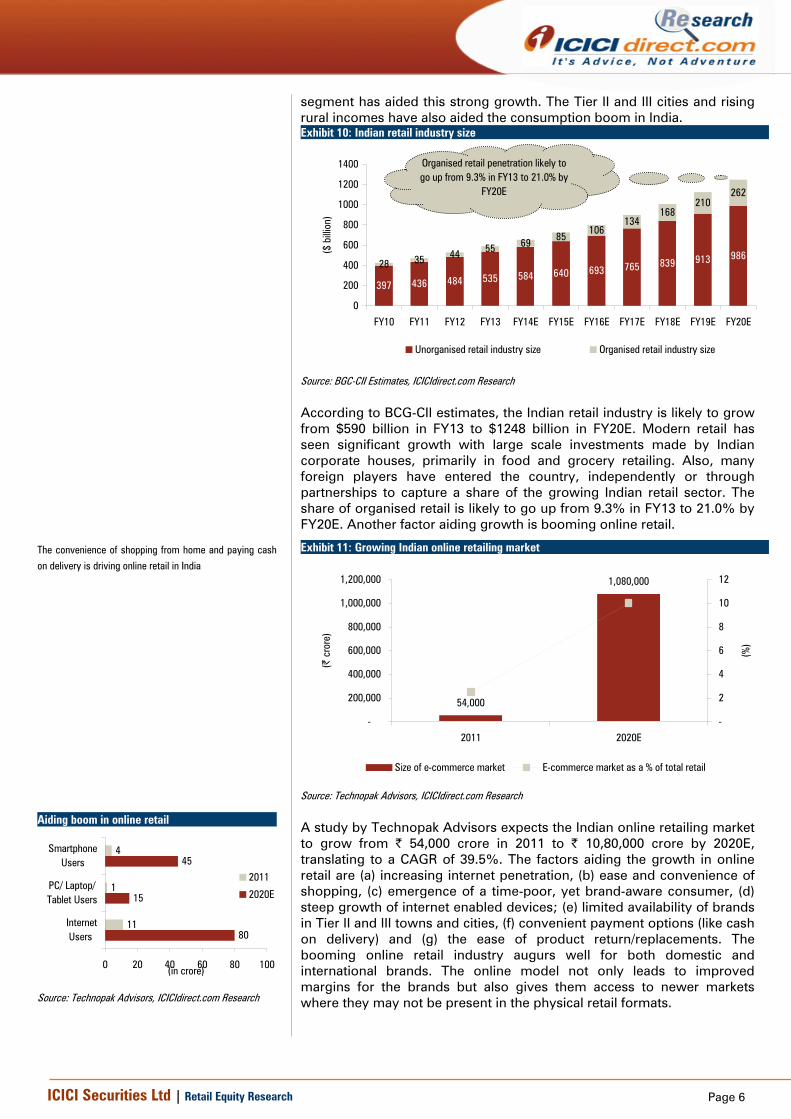
segment has aided this strong growth. The Tier II and III cities and rising rural incomes have also aided the consumption boom in India. Exhibit 10: Indian retail industry size
397 436 484 535 584 640 693 765 839 913 98628 35 44 55 69 85
106134
168210
262
0
200
400
600
800
1000
1200
1400
FY10 FY11 FY12 FY13 FY14E FY15E FY16E FY17E FY18E FY19E FY20E($
billi
on)
Unorganised retail industry size Organised retail industry size
Organised retail penetration likely to go up from 9.3% in FY13 to 21.0% by
FY20E
Source: BGC-CII Estimates, ICICIdirect.com Research
According to BCG-CII estimates, the Indian retail industry is likely to grow from $590 billion in FY13 to $1248 billion in FY20E. Modern retail has seen significant growth with large scale investments made by Indian corporate houses, primarily in food and grocery retailing. Also, many foreign players have entered the country, independently or through partnerships to capture a share of the growing Indian retail sector. The share of organised retail is likely to go up from 9.3% in FY13 to 21.0% by FY20E. Another factor aiding growth is booming online retail.
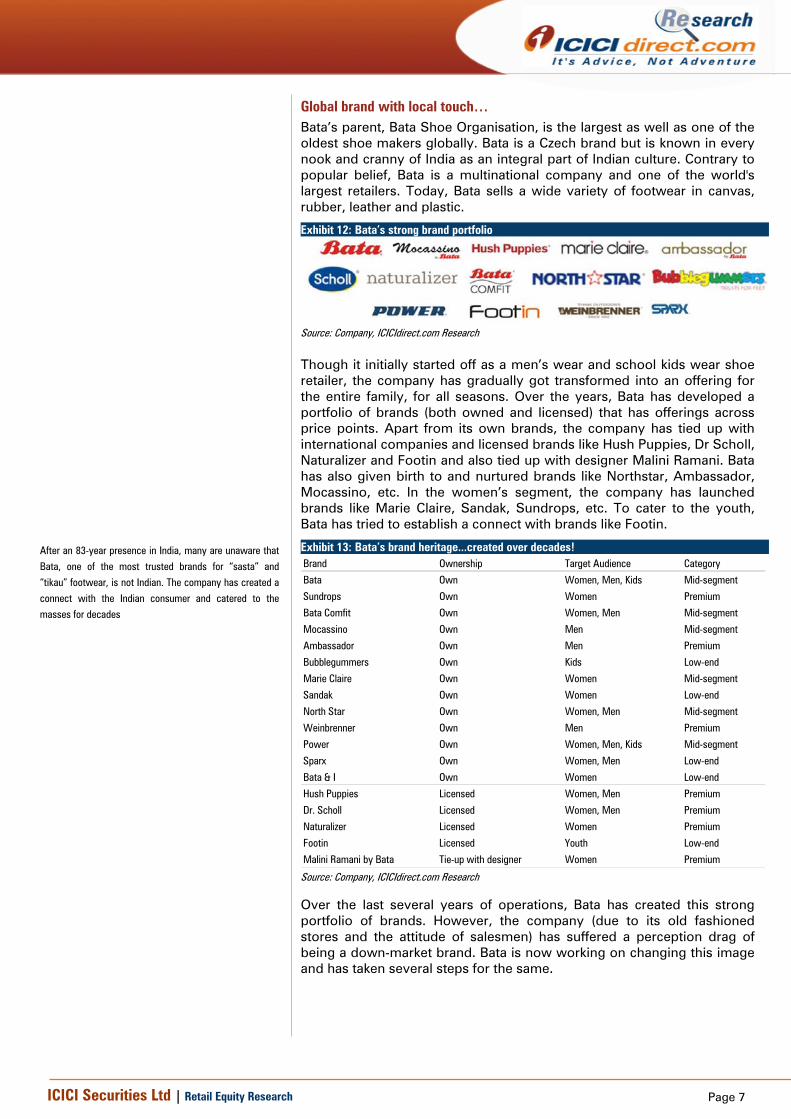
Exhibit 11: Growing Indian online retailing market
54,000
1,080,000
-
200,000
400,000
600,000
800,000
1,000,000
1,200,000
2011 2020E
(| c
rore
)
-
2
4
6
8
10
12
(%)
Size of e-commerce market E-commerce market as a % of total retail
Source: Technopak Advisors, ICICIdirect.com Research
A study by Technopak Advisors expects the Indian online retailing market to grow from | 54,000 crore in 2011 to | 10,80,000 crore by 2020E, translating to a CAGR of 39.5%. The factors aiding the growth in online retail are (a) increasing internet penetration, (b) ease and convenience of shopping, (c) emergence of a time-poor, yet brand-aware consumer, (d) steep growth of internet enabled devices; (e) limited availability of brands in Tier II and III towns and cities, (f) convenient payment options (like cash on delivery) and (g) the ease of product return/replacements. The booming online retail industry augurs well for both domestic and international brands. The online model not only leads to improved margins for the brands but also gives them access to newer markets where they may not be present in the physical retail formats.
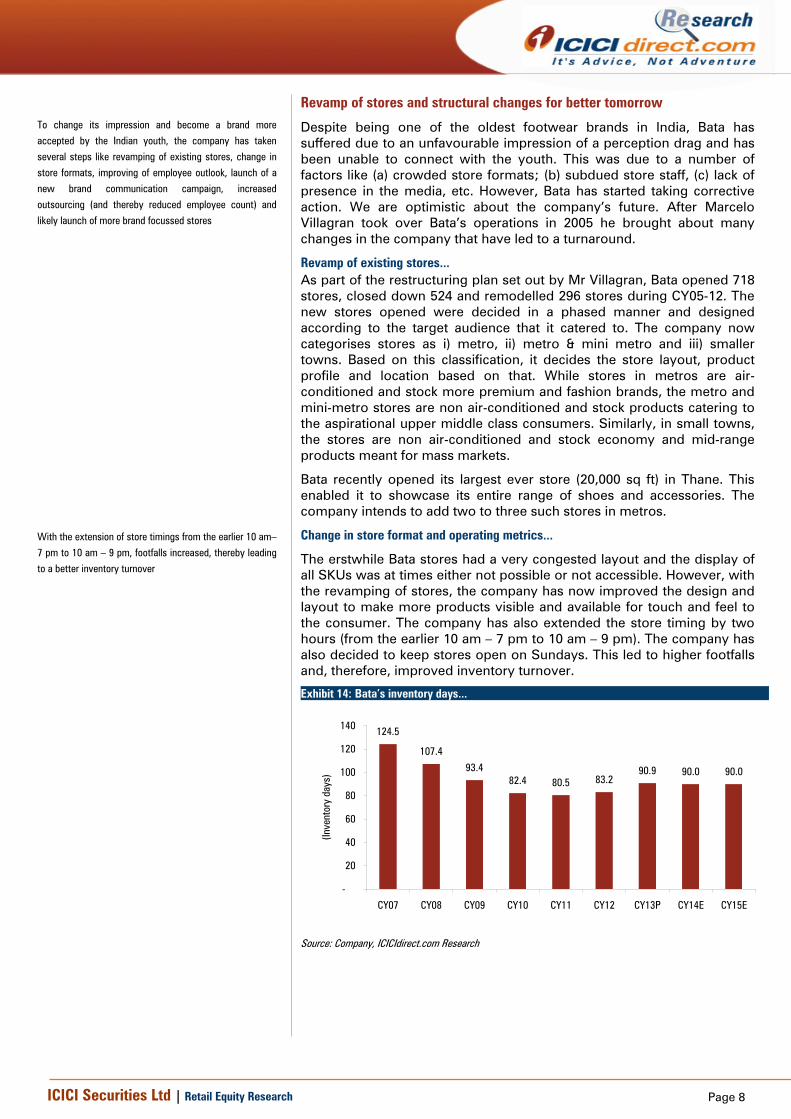
The convenience of shopping from home and paying cash
on delivery is driving online retail in India
Aiding boom in online retail
80
15
45
11
1
4
0 20 40 60 80 100
InternetUsers
PC/ Laptop/Tablet Users
SmartphoneUsers
(in crore)
2011
2020E
Source: Technopak Advisors, ICICIdirect.com Research
Page 7ICICI Securities Ltd | Retail Equity Research
Global brand with local touch… Bata’s parent, Bata Shoe Organisation, is the largest as well as one of the oldest shoe makers globally. Bata is a Czech brand but is known in every nook and cranny of India as an integral part of Indian culture. Contrary to popular belief, Bata is a multinational company and one of the world's largest retailers. Today, Bata sells a wide variety of footwear in canvas, rubber, leather and plastic.
Exhibit 12: Bata’s strong brand portfolio
Source: Company, ICICIdirect.com Research
Though it initially started off as a men’s wear and school kids wear shoe retailer, the company has gradually got transformed into an offering for the entire family, for all seasons. Over the years, Bata has developed a portfolio of brands (both owned and licensed) that has offerings across price points. Apart from its own brands, the company has tied up with international companies and licensed brands like Hush Puppies, Dr Scholl, Naturalizer and Footin and also tied up with designer Malini Ramani. Bata has also given birth to and nurtured brands like Northstar, Ambassador, Mocassino, etc. In the women’s segment, the company has launched brands like Marie Claire, Sandak, Sundrops, etc. To cater to the youth, Bata has tried to establish a connect with brands like Footin.
Exhibit 13: Bata’s brand heritage...created over decades! Brand Ownership Target Audience Category
Bata Own Women, Men, Kids Mid-segment
Sundrops Own Women Premium
Bata Comfit Own Women, Men Mid-segment
Mocassino Own Men Mid-segment
Ambassador Own Men Premium
Bubblegummers Own Kids Low-end
Marie Claire Own Women Mid-segment
Sandak Own Women Low-end
North Star Own Women, Men Mid-segment
Weinbrenner Own Men Premium
Power Own Women, Men, Kids Mid-segment
Sparx Own Women, Men Low-end
Bata & I Own Women Low-end
Hush Puppies Licensed Women, Men Premium
Dr. Scholl Licensed Women, Men Premium
Naturalizer Licensed Women Premium
Footin Licensed Youth Low-end
Malini Ramani by Bata Tie-up with designer Women Premium
Source: Company, ICICIdirect.com Research
Over the last several years of operations, Bata has created this strong portfolio of brands. However, the company (due to its old fashioned stores and the attitude of salesmen) has suffered a perception drag of being a down-market brand. Bata is now working on changing this image and has taken several steps for the same.
After an 83-year presence in India, many are unaware that
Bata, one of the most trusted brands for “sasta” and
“tikau” footwear, is not Indian. The company has created a
connect with the Indian consumer and catered to the
masses for decades
Page 8ICICI Securities Ltd | Retail Equity Research
Revamp of stores and structural changes for better tomorrow
Despite being one of the oldest footwear brands in India, Bata has suffered due to an unfavourable impression of a perception drag and has been unable to connect with the youth. This was due to a number of factors like (a) crowded store formats; (b) subdued store staff, (c) lack of presence in the media, etc. However, Bata has started taking corrective action. We are optimistic about the company’s future. After Marcelo Villagran took over Bata’s operations in 2005 he brought about many changes in the company that have led to a turnaround.
Revamp of existing stores... As part of the restructuring plan set out by Mr Villagran, Bata opened 718 stores, closed down 524 and remodelled 296 stores during CY05-12. The new stores opened were decided in a phased manner and designed according to the target audience that it catered to. The company now categorises stores as i) metro, ii) metro & mini metro and iii) smaller towns. Based on this classification, it decides the store layout, product profile and location based on that. While stores in metros are air-conditioned and stock more premium and fashion brands, the metro and mini-metro stores are non air-conditioned and stock products catering to the aspirational upper middle class consumers. Similarly, in small towns, the stores are non air-conditioned and stock economy and mid-range products meant for mass markets.
Bata recently opened its largest ever store (20,000 sq ft) in Thane. This enabled it to showcase its entire range of shoes and accessories. The company intends to add two to three such stores in metros.
Change in store format and operating metrics...
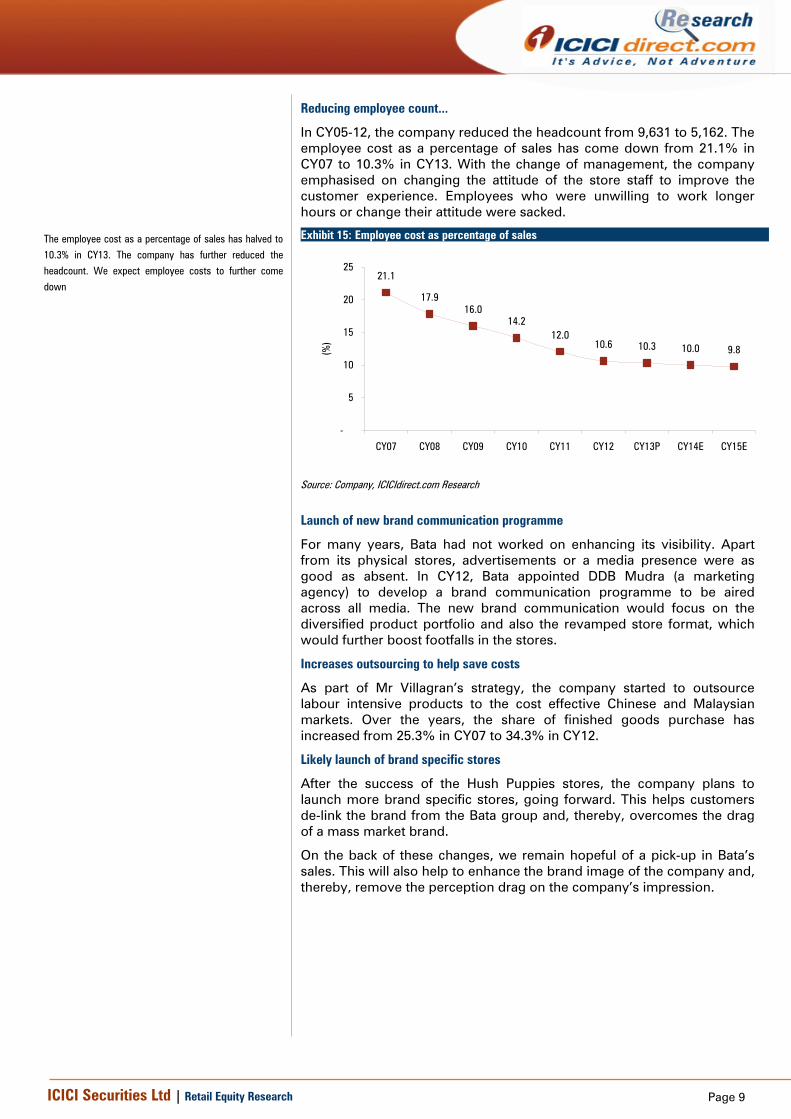
The erstwhile Bata stores had a very congested layout and the display of all SKUs was at times either not possible or not accessible. However, with the revamping of stores, the company has now improved the design and layout to make more products visible and available for touch and feel to the consumer. The company has also extended the store timing by two hours (from the earlier 10 am – 7 pm to 10 am – 9 pm). The company has also decided to keep stores open on Sundays. This led to higher footfalls and, therefore, improved inventory turnover.
Exhibit 14: Bata’s inventory days...
124.5
107.4
93.482.4 80.5 83.2
90.9 90.0 90.0
-
20
40
60
80
100
120
140
CY07 CY08 CY09 CY10 CY11 CY12 CY13P CY14E CY15E
(Inve
ntor
y da
ys)
Source: Company, ICICIdirect.com Research
To change its impression and become a brand more
accepted by the Indian youth, the company has taken
several steps like revamping of existing stores, change in
store formats, improving of employee outlook, launch of a
new brand communication campaign, increased
outsourcing (and thereby reduced employee count) and
likely launch of more brand focussed stores
With the extension of store timings from the earlier 10 am–
7 pm to 10 am – 9 pm, footfalls increased, thereby leading
to a better inventory turnover
Page 9ICICI Securities Ltd | Retail Equity Research
Reducing employee count...
In CY05-12, the company reduced the headcount from 9,631 to 5,162. The employee cost as a percentage of sales has come down from 21.1% in CY07 to 10.3% in CY13. With the change of management, the company emphasised on changing the attitude of the store staff to improve the customer experience. Employees who were unwilling to work longer hours or change their attitude were sacked.
Exhibit 15: Employee cost as percentage of sales
21.1
17.916.0
14.212.0
10.6 10.3 10.0 9.8
-
5
10
15
20
25
CY07 CY08 CY09 CY10 CY11 CY12 CY13P CY14E CY15E
(%)
Source: Company, ICICIdirect.com Research
Launch of new brand communication programme
For many years, Bata had not worked on enhancing its visibility. Apart from its physical stores, advertisements or a media presence were as good as absent. In CY12, Bata appointed DDB Mudra (a marketing agency) to develop a brand communication programme to be aired across all media. The new brand communication would focus on the diversified product portfolio and also the revamped store format, which would further boost footfalls in the stores.
Increases outsourcing to help save costs
As part of Mr Villagran’s strategy, the company started to outsource labour intensive products to the cost effective Chinese and Malaysian markets. Over the years, the share of finished goods purchase has increased from 25.3% in CY07 to 34.3% in CY12.
Likely launch of brand specific stores
After the success of the Hush Puppies stores, the company plans to launch more brand specific stores, going forward. This helps customers de-link the brand from the Bata group and, thereby, overcomes the drag of a mass market brand.
On the back of these changes, we remain hopeful of a pick-up in Bata’s sales. This will also help to enhance the brand image of the company and, thereby, remove the perception drag on the company’s impression.
The employee cost as a percentage of sales has halved to
10.3% in CY13. The company has further reduced the
headcount. We expect employee costs to further come
down
Page 10ICICI Securities Ltd | Retail Equity Research
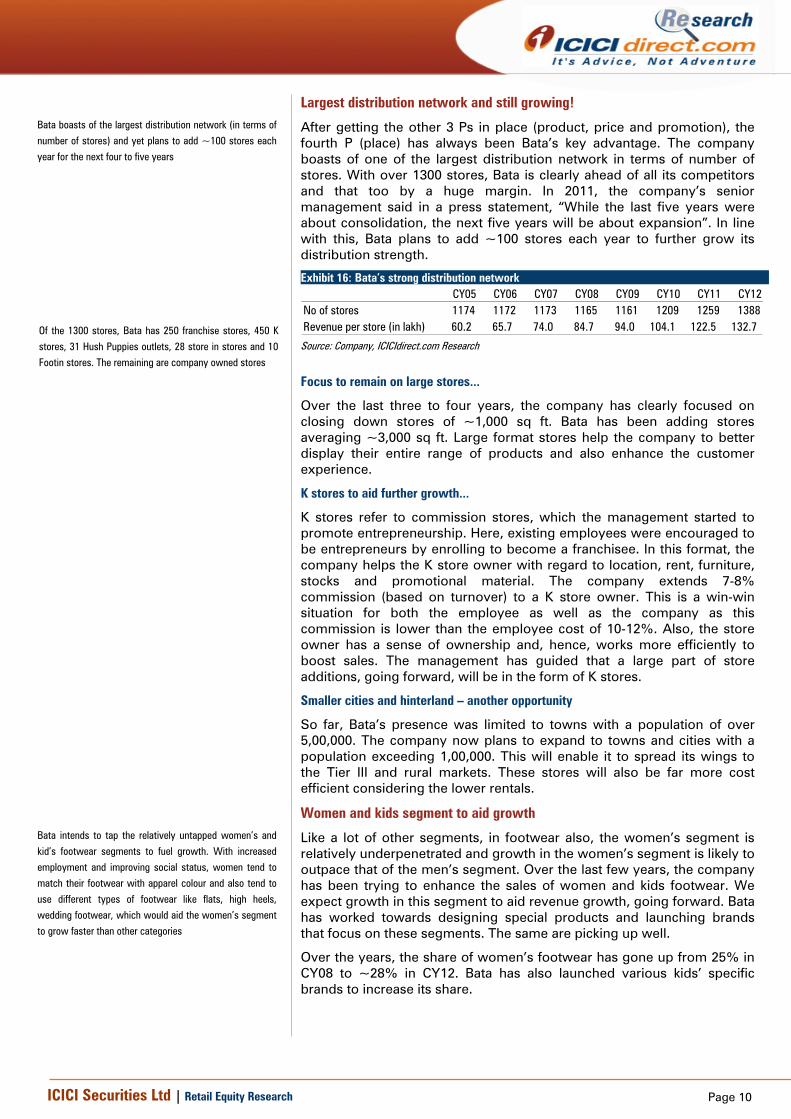
Largest distribution network and still growing!
After getting the other 3 Ps in place (product, price and promotion), the fourth P (place) has always been Bata’s key advantage. The company boasts of one of the largest distribution network in terms of number of stores. With over 1300 stores, Bata is clearly ahead of all its competitors and that too by a huge margin. In 2011, the company’s senior management said in a press statement, “While the last five years were about consolidation, the next five years will be about expansion”. In line with this, Bata plans to add ~100 stores each year to further grow its distribution strength.
Exhibit 16: Bata’s strong distribution network CY05 CY06 CY07 CY08 CY09 CY10 CY11 CY12
No of stores 1174 1172 1173 1165 1161 1209 1259 1388Revenue per store (in lakh) 60.2 65.7 74.0 84.7 94.0 104.1 122.5 132.7
Source: Company, ICICIdirect.com Research
Focus to remain on large stores...
Over the last three to four years, the company has clearly focused on closing down stores of ~1,000 sq ft. Bata has been adding stores averaging ~3,000 sq ft. Large format stores help the company to better display their entire range of products and also enhance the customer experience.
K stores to aid further growth...
K stores refer to commission stores, which the management started to promote entrepreneurship. Here, existing employees were encouraged to be entrepreneurs by enrolling to become a franchisee. In this format, the company helps the K store owner with regard to location, rent, furniture, stocks and promotional material. The company extends 7-8% commission (based on turnover) to a K store owner. This is a win-win situation for both the employee as well as the company as this commission is lower than the employee cost of 10-12%. Also, the store owner has a sense of ownership and, hence, works more efficiently to boost sales. The management has guided that a large part of store additions, going forward, will be in the form of K stores.
Smaller cities and hinterland – another opportunity
So far, Bata’s presence was limited to towns with a population of over 5,00,000. The company now plans to expand to towns and cities with a population exceeding 1,00,000. This will enable it to spread its wings to the Tier III and rural markets. These stores will also be far more cost efficient considering the lower rentals.
Women and kids segment to aid growth
Like a lot of other segments, in footwear also, the women’s segment is relatively underpenetrated and growth in the women’s segment is likely to outpace that of the men’s segment. Over the last few years, the company has been trying to enhance the sales of women and kids footwear. We expect growth in this segment to aid revenue growth, going forward. Bata has worked towards designing special products and launching brands that focus on these segments. The same are picking up well.
Over the years, the share of women’s footwear has gone up from 25% in CY08 to ~28% in CY12. Bata has also launched various kids’ specific brands to increase its share.
Bata boasts of the largest distribution network (in terms of
number of stores) and yet plans to add ~100 stores each
year for the next four to five years
Of the 1300 stores, Bata has 250 franchise stores, 450 K
stores, 31 Hush Puppies outlets, 28 store in stores and 10
Footin stores. The remaining are company owned stores
Bata intends to tap the relatively untapped women’s and
kid’s footwear segments to fuel growth. With increased
employment and improving social status, women tend to
match their footwear with apparel colour and also tend to
use different types of footwear like flats, high heels,
wedding footwear, which would aid the women’s segment
to grow faster than other categories
Page 11ICICI Securities Ltd | Retail Equity Research
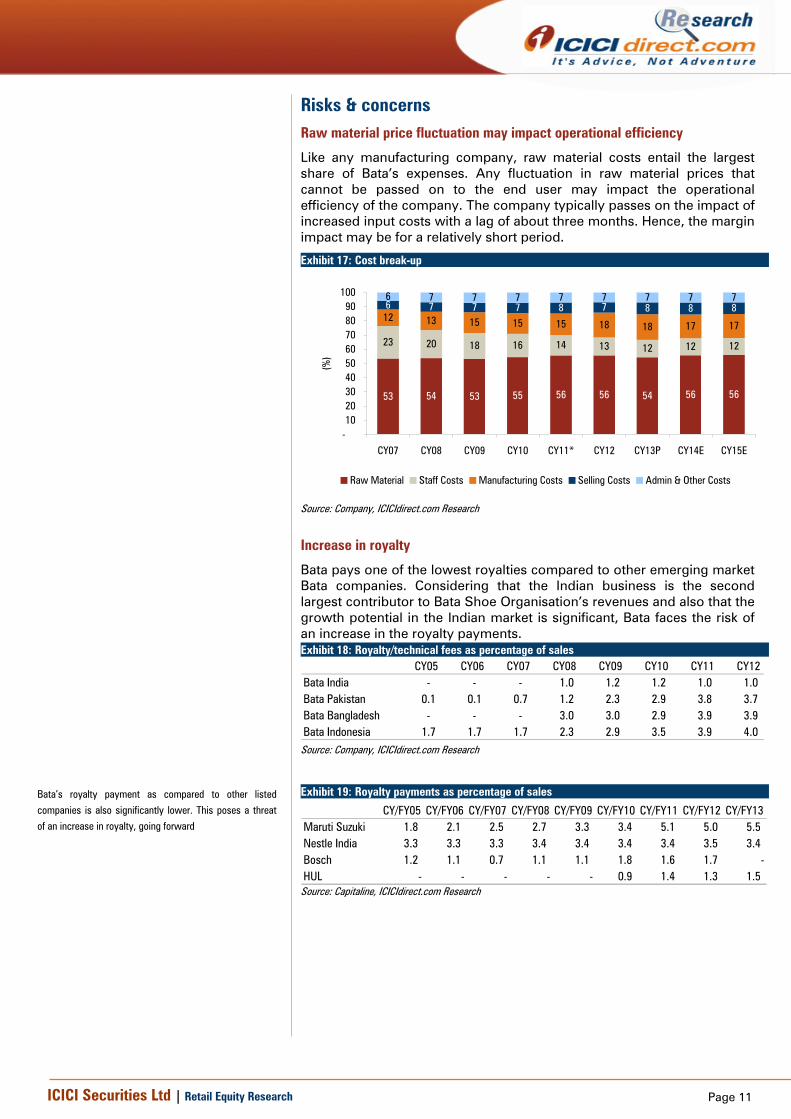
Risks & concerns Raw material price fluctuation may impact operational efficiency
Like any manufacturing company, raw material costs entail the largest share of Bata’s expenses. Any fluctuation in raw material prices that cannot be passed on to the end user may impact the operational efficiency of the company. The company typically passes on the impact of increased input costs with a lag of about three months. Hence, the margin impact may be for a relatively short period.
Exhibit 17: Cost break-up
53 54 53 55 56 56 54 56 56
23 20 18 16 14 13 12 12 12
12 13 15 15 15 18 18 17 17
6 7 7 7 8 7 8 8 86 7 7 7 7 7 7 7 7
-102030405060708090
100
CY07 CY08 CY09 CY10 CY11* CY12 CY13P CY14E CY15E
(%)
Raw Material Staff Costs Manufacturing Costs Selling Costs Admin & Other Costs
Source: Company, ICICIdirect.com Research
Increase in royalty
Bata pays one of the lowest royalties compared to other emerging market Bata companies. Considering that the Indian business is the second largest contributor to Bata Shoe Organisation’s revenues and also that the growth potential in the Indian market is significant, Bata faces the risk of an increase in the royalty payments. Exhibit 18: Royalty/technical fees as percentage of sales
CY05 CY06 CY07 CY08 CY09 CY10 CY11 CY12Bata India - - - 1.0 1.2 1.2 1.0 1.0 Bata Pakistan 0.1 0.1 0.7 1.2 2.3 2.9 3.8 3.7 Bata Bangladesh - - - 3.0 3.0 2.9 3.9 3.9 Bata Indonesia 1.7 1.7 1.7 2.3 2.9 3.5 3.9 4.0
Source: Company, ICICIdirect.com Research
Exhibit 19: Royalty payments as percentage of sales
CY/FY05 CY/FY06 CY/FY07 CY/FY08 CY/FY09 CY/FY10 CY/FY11 CY/FY12 CY/FY13Maruti Suzuki 1.8 2.1 2.5 2.7 3.3 3.4 5.1 5.0 5.5 Nestle India 3.3 3.3 3.3 3.4 3.4 3.4 3.4 3.5 3.4 Bosch 1.2 1.1 0.7 1.1 1.1 1.8 1.6 1.7 -HUL - - - - - 0.9 1.4 1.3 1.5
Source: Capitaline, ICICIdirect.com Research
Bata’s royalty payment as compared to other listed
companies is also significantly lower. This poses a threat
of an increase in royalty, going forward
Page 12ICICI Securities Ltd | Retail Equity Research
Increased threat of competition
The unorganised footwear market is fairly large in India, especially at lower price points. Apart from this, Bata is also likely to face competition from imported Chinese products as they are priced competitively. Also, with the government opening up FDI in single brand retail, more and more foreign players are likely to tap the Indian markets where the growth potential is high. All these factors could pose a threat to Bata’s sales and growth plans.
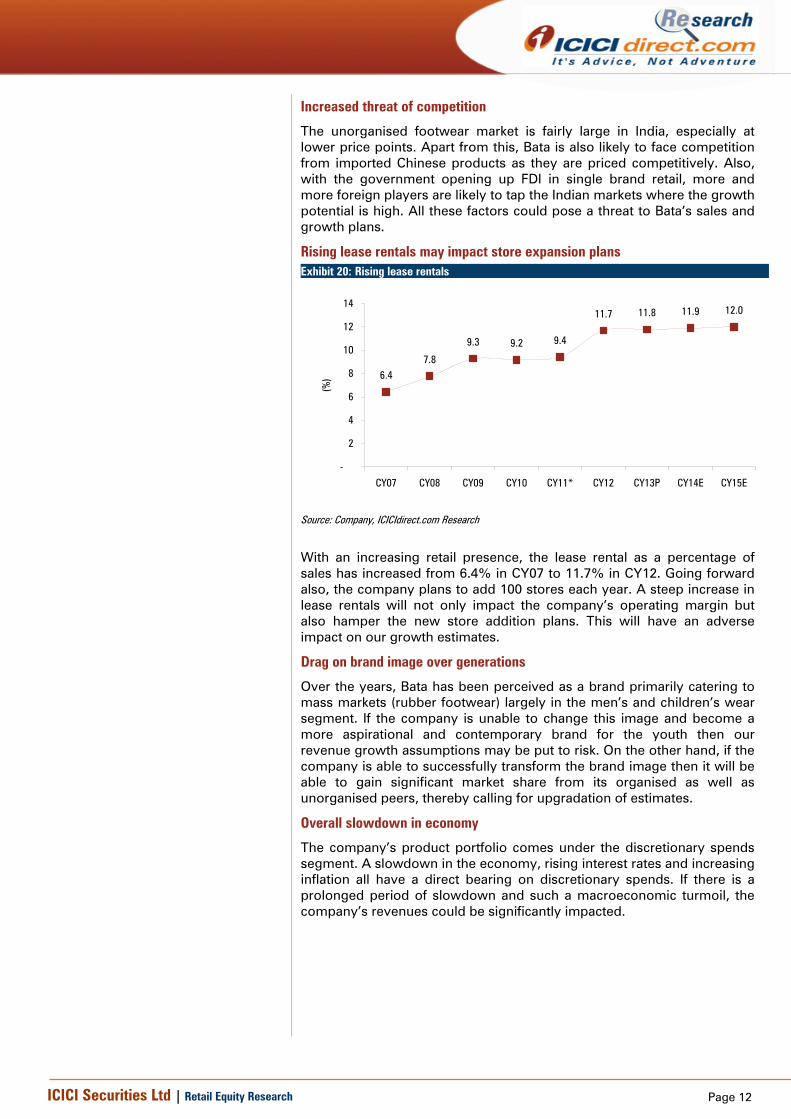
Rising lease rentals may impact store expansion plans Exhibit 20: Rising lease rentals
6.47.8
9.3 9.2 9.4
11.7 11.8 11.9 12.0
-
2
4
6
8
10
12
14
CY07 CY08 CY09 CY10 CY11* CY12 CY13P CY14E CY15E
(%)
Source: Company, ICICIdirect.com Research
With an increasing retail presence, the lease rental as a percentage of sales has increased from 6.4% in CY07 to 11.7% in CY12. Going forward also, the company plans to add 100 stores each year. A steep increase in lease rentals will not only impact the company’s operating margin but also hamper the new store addition plans. This will have an adverse impact on our growth estimates.
Drag on brand image over generations
Over the years, Bata has been perceived as a brand primarily catering to mass markets (rubber footwear) largely in the men’s and children’s wear segment. If the company is unable to change this image and become a more aspirational and contemporary brand for the youth then our revenue growth assumptions may be put to risk. On the other hand, if the company is able to successfully transform the brand image then it will be able to gain significant market share from its organised as well as unorganised peers, thereby calling for upgradation of estimates.
Overall slowdown in economy
The company’s product portfolio comes under the discretionary spends segment. A slowdown in the economy, rising interest rates and increasing inflation all have a direct bearing on discretionary spends. If there is a prolonged period of slowdown and such a macroeconomic turmoil, the company’s revenues could be significantly impacted.
Page 13ICICI Securities Ltd | Retail Equity Research
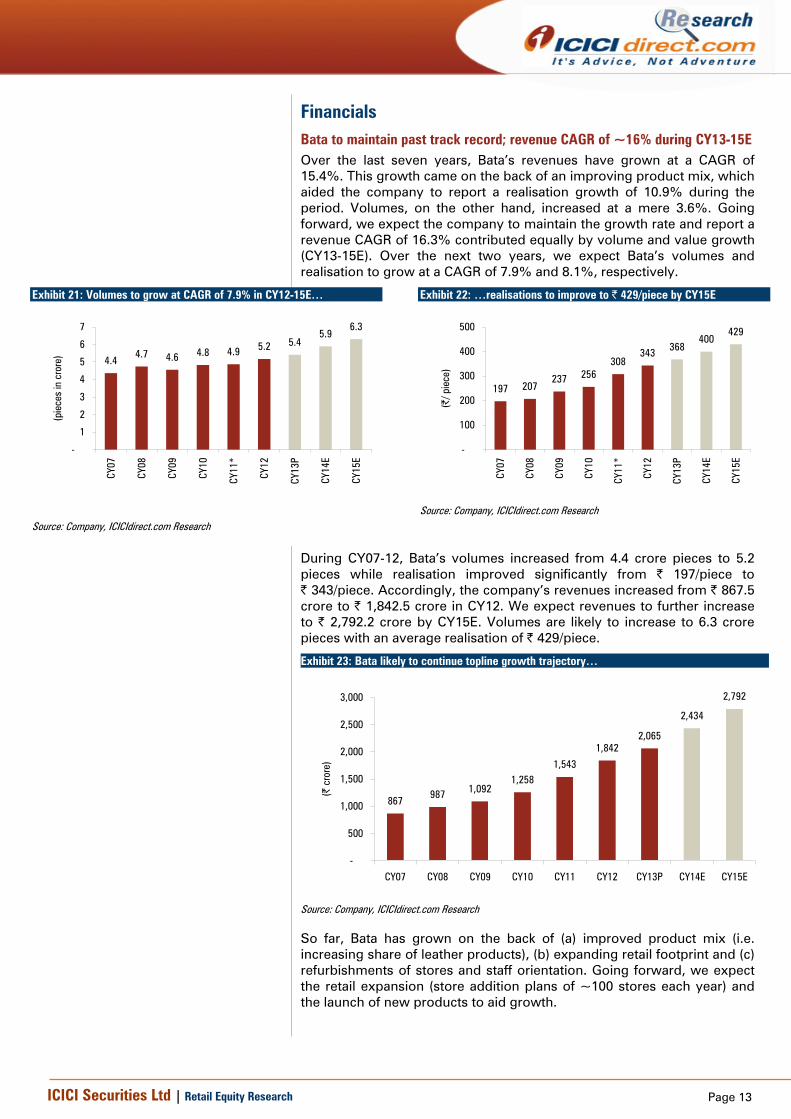
Financials Bata to maintain past track record; revenue CAGR of ~16% during CY13-15E Over the last seven years, Bata’s revenues have grown at a CAGR of 15.4%. This growth came on the back of an improving product mix, which aided the company to report a realisation growth of 10.9% during the period. Volumes, on the other hand, increased at a mere 3.6%. Going forward, we expect the company to maintain the growth rate and report a revenue CAGR of 16.3% contributed equally by volume and value growth (CY13-15E). Over the next two years, we expect Bata’s volumes and realisation to grow at a CAGR of 7.9% and 8.1%, respectively.
Exhibit 21: Volumes to grow at CAGR of 7.9% in CY12-15E…
4.44.7 4.6 4.8 4.9 5.2 5.4
5.96.3
-
1
2
3
4
5
6
7
CY07
CY08
CY09
CY10
CY11
*
CY12
CY13
P
CY14
E
CY15
E
(pie
ces
in c
rore
)
Source: Company, ICICIdirect.com Research
Exhibit 22: …realisations to improve to | 429/piece by CY15E
197 207237 256
308343 368
400429
-
100
200
300
400
500
CY07
CY08
CY09
CY10
CY11
*
CY12
CY13
P
CY14
E
CY15
E
(|/ p
iece
)
Source: Company, ICICIdirect.com Research
During CY07-12, Bata’s volumes increased from 4.4 crore pieces to 5.2 pieces while realisation improved significantly from | 197/piece to | 343/piece. Accordingly, the company’s revenues increased from | 867.5 crore to | 1,842.5 crore in CY12. We expect revenues to further increase to | 2,792.2 crore by CY15E. Volumes are likely to increase to 6.3 crore pieces with an average realisation of | 429/piece.
Exhibit 23: Bata likely to continue topline growth trajectory…
867987 1,092
1,2581,543
1,8422,065
2,434
2,792
-
500
1,000
1,500
2,000
2,500
3,000
CY07 CY08 CY09 CY10 CY11 CY12 CY13P CY14E CY15E
(| c
rore
)
Source: Company, ICICIdirect.com Research
So far, Bata has grown on the back of (a) improved product mix (i.e. increasing share of leather products), (b) expanding retail footprint and (c) refurbishments of stores and staff orientation. Going forward, we expect the retail expansion (store addition plans of ~100 stores each year) and the launch of new products to aid growth.
Page 14ICICI Securities Ltd | Retail Equity Research
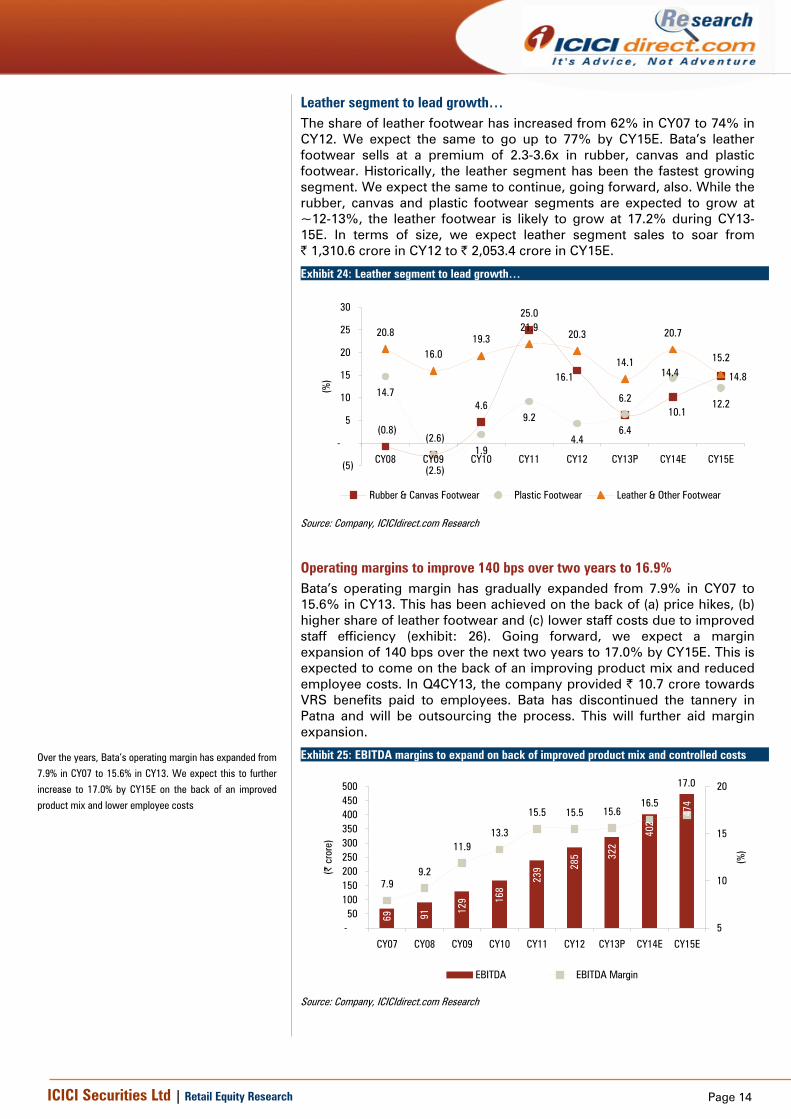
Leather segment to lead growth… The share of leather footwear has increased from 62% in CY07 to 74% in CY12. We expect the same to go up to 77% by CY15E. Bata’s leather footwear sells at a premium of 2.3-3.6x in rubber, canvas and plastic footwear. Historically, the leather segment has been the fastest growing segment. We expect the same to continue, going forward, also. While the rubber, canvas and plastic footwear segments are expected to grow at ~12-13%, the leather footwear is likely to grow at 17.2% during CY13-15E. In terms of size, we expect leather segment sales to soar from | 1,310.6 crore in CY12 to | 2,053.4 crore in CY15E.
Exhibit 24: Leather segment to lead growth…
(0.8)(2.6)
4.6
25.0
6.214.7
(2.5)
1.9
9.2
4.46.4
12.2
20.8
16.019.3
21.920.3
14.1
20.7
15.2
14.8
10.1
16.1 14.4
(5)
-
5
10
15
20
25
30
CY08 CY09 CY10 CY11 CY12 CY13P CY14E CY15E
(%)
Rubber & Canvas Footwear Plastic Footwear Leather & Other Footwear
Source: Company, ICICIdirect.com Research
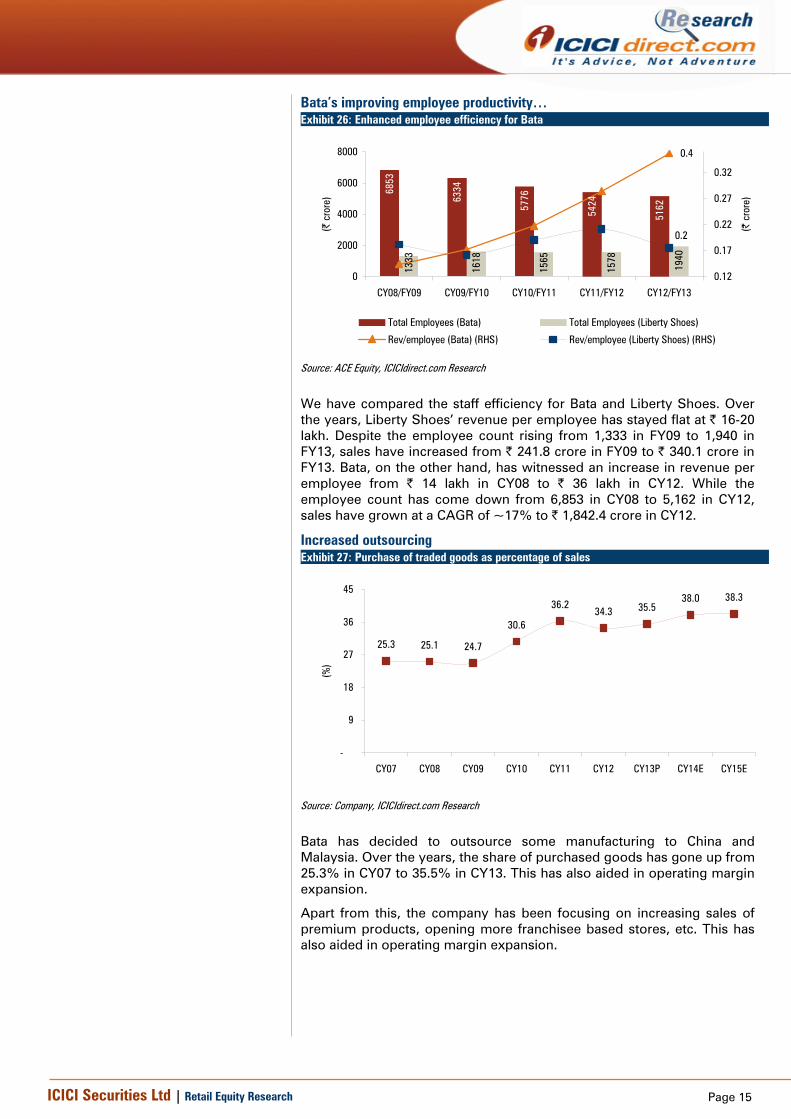
Operating margins to improve 140 bps over two years to 16.9% Bata’s operating margin has gradually expanded from 7.9% in CY07 to 15.6% in CY13. This has been achieved on the back of (a) price hikes, (b) higher share of leather footwear and (c) lower staff costs due to improved staff efficiency (exhibit: 26). Going forward, we expect a margin expansion of 140 bps over the next two years to 17.0% by CY15E. This is expected to come on the back of an improving product mix and reduced employee costs. In Q4CY13, the company provided | 10.7 crore towards VRS benefits paid to employees. Bata has discontinued the tannery in Patna and will be outsourcing the process. This will further aid margin expansion.
Exhibit 25: EBITDA margins to expand on back of improved product mix and controlled costs
69 91 129 16
8
239 28
5 322
402
474
7.99.2
11.913.3
15.5 15.5 15.616.5
17.0
-50
100150200250300350400450500
CY07 CY08 CY09 CY10 CY11 CY12 CY13P CY14E CY15E
(| c
rore
)
5
10
15
20
(%)
EBITDA EBITDA Margin
Source: Company, ICICIdirect.com Research
Over the years, Bata’s operating margin has expanded from
7.9% in CY07 to 15.6% in CY13. We expect this to further
increase to 17.0% by CY15E on the back of an improved
product mix and lower employee costs
Page 15ICICI Securities Ltd | Retail Equity Research
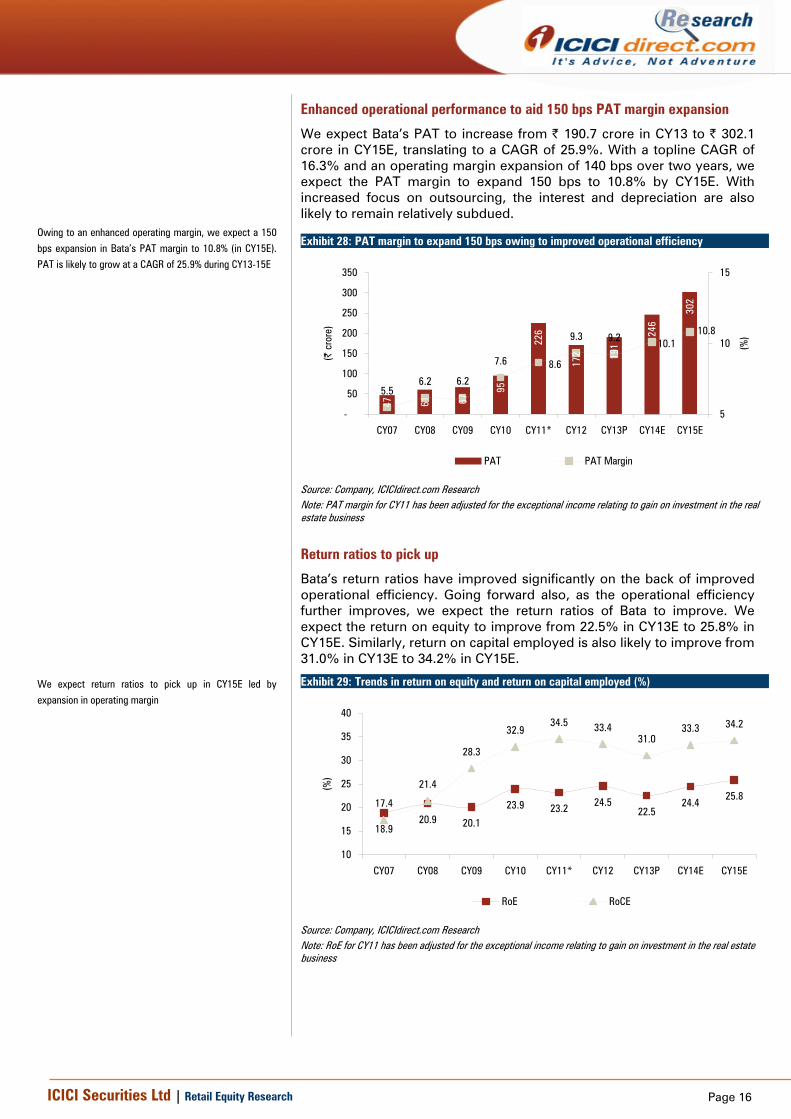
Bata’s improving employee productivity… Exhibit 26: Enhanced employee efficiency for Bata
6853
6334
5776
5424
5162
1333
1618
1565
1578
1940
0.4
0.2
0
2000
4000
6000
8000
CY08/FY09 CY09/FY10 CY10/FY11 CY11/FY12 CY12/FY13
(| c
rore
)
0.12
0.17
0.22
0.27
0.32
(| c
rore
)
Total Employees (Bata) Total Employees (Liberty Shoes)
Rev/employee (Bata) (RHS) Rev/employee (Liberty Shoes) (RHS)
Source: ACE Equity, ICICIdirect.com Research
We have compared the staff efficiency for Bata and Liberty Shoes. Over the years, Liberty Shoes’ revenue per employee has stayed flat at | 16-20 lakh. Despite the employee count rising from 1,333 in FY09 to 1,940 in FY13, sales have increased from | 241.8 crore in FY09 to | 340.1 crore in FY13. Bata, on the other hand, has witnessed an increase in revenue per employee from | 14 lakh in CY08 to | 36 lakh in CY12. While the employee count has come down from 6,853 in CY08 to 5,162 in CY12, sales have grown at a CAGR of ~17% to | 1,842.4 crore in CY12.
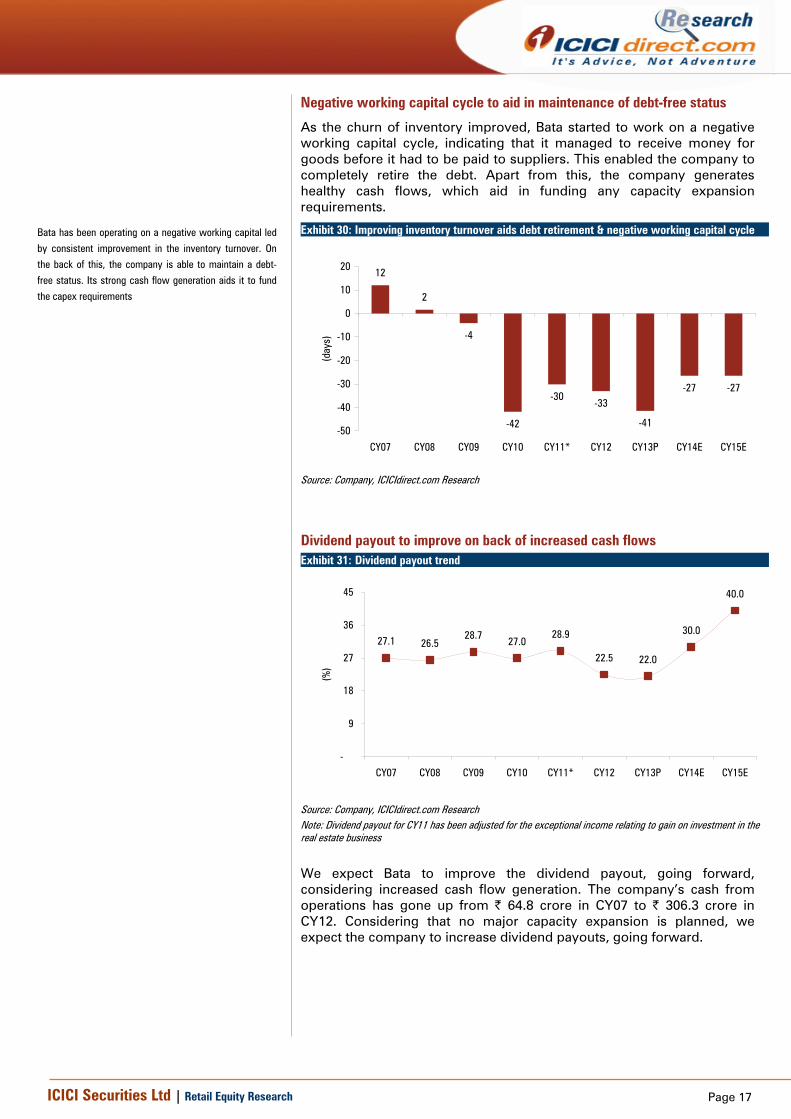
Increased outsourcing Exhibit 27: Purchase of traded goods as percentage of sales
25.3 25.1 24.7
30.6
36.234.3 35.5
38.0 38.3
-
9
18
27
36
45
CY07 CY08 CY09 CY10 CY11 CY12 CY13P CY14E CY15E
(%)
Source: Company, ICICIdirect.com Research
Bata has decided to outsource some manufacturing to China and Malaysia. Over the years, the share of purchased goods has gone up from 25.3% in CY07 to 35.5% in CY13. This has also aided in operating margin expansion.
Apart from this, the company has been focusing on increasing sales of premium products, opening more franchisee based stores, etc. This has also aided in operating margin expansion.
Page 16ICICI Securities Ltd | Retail Equity Research
Enhanced operational performance to aid 150 bps PAT margin expansion
We expect Bata’s PAT to increase from | 190.7 crore in CY13 to | 302.1 crore in CY15E, translating to a CAGR of 25.9%. With a topline CAGR of 16.3% and an operating margin expansion of 140 bps over two years, we expect the PAT margin to expand 150 bps to 10.8% by CY15E. With increased focus on outsourcing, the interest and depreciation are also likely to remain relatively subdued.
Exhibit 28: PAT margin to expand 150 bps owing to improved operational efficiency
47 61 67
95
226
172 19
1
246
302
5.56.2 6.2
7.6
9.3 9.210.8
8.6
10.1
-
50
100
150
200
250
300
350
CY07 CY08 CY09 CY10 CY11* CY12 CY13P CY14E CY15E
(| c
rore
)
5
10
15
(%)
PAT PAT Margin
Source: Company, ICICIdirect.com Research Note: PAT margin for CY11 has been adjusted for the exceptional income relating to gain on investment in the real estate business
Return ratios to pick up
Bata’s return ratios have improved significantly on the back of improved operational efficiency. Going forward also, as the operational efficiency further improves, we expect the return ratios of Bata to improve. We expect the return on equity to improve from 22.5% in CY13E to 25.8% in CY15E. Similarly, return on capital employed is also likely to improve from 31.0% in CY13E to 34.2% in CY15E.
Exhibit 29: Trends in return on equity and return on capital employed (%)
18.920.9 20.1
23.9 23.2 24.522.5
24.425.8
17.4
21.4
28.3
32.934.5 33.4
31.033.3 34.2
10
15
20
25
30
35
40
CY07 CY08 CY09 CY10 CY11* CY12 CY13P CY14E CY15E
(%)
RoE RoCE
Source: Company, ICICIdirect.com Research Note: RoE for CY11 has been adjusted for the exceptional income relating to gain on investment in the real estate business
Owing to an enhanced operating margin, we expect a 150
bps expansion in Bata’s PAT margin to 10.8% (in CY15E).
PAT is likely to grow at a CAGR of 25.9% during CY13-15E
We expect return ratios to pick up in CY15E led by
expansion in operating margin
Page 17ICICI Securities Ltd | Retail Equity Research
Negative working capital cycle to aid in maintenance of debt-free status
As the churn of inventory improved, Bata started to work on a negative working capital cycle, indicating that it managed to receive money for goods before it had to be paid to suppliers. This enabled the company to completely retire the debt. Apart from this, the company generates healthy cash flows, which aid in funding any capacity expansion requirements.
Exhibit 30: Improving inventory turnover aids debt retirement & negative working capital cycle
12
2
-4
-42
-30-33
-41
-27 -27
-50
-40
-30
-20
-10
0
10
20
CY07 CY08 CY09 CY10 CY11* CY12 CY13P CY14E CY15E
(day
s)
Source: Company, ICICIdirect.com Research
Dividend payout to improve on back of increased cash flows Exhibit 31: Dividend payout trend
27.1 26.528.7 27.0
28.9
22.5 22.0
30.0
40.0
-
9
18
27
36
45
CY07 CY08 CY09 CY10 CY11* CY12 CY13P CY14E CY15E
(%)
Source: Company, ICICIdirect.com Research Note: Dividend payout for CY11 has been adjusted for the exceptional income relating to gain on investment in the real estate business
We expect Bata to improve the dividend payout, going forward, considering increased cash flow generation. The company’s cash from operations has gone up from | 64.8 crore in CY07 to | 306.3 crore in CY12. Considering that no major capacity expansion is planned, we expect the company to increase dividend payouts, going forward.
Bata has been operating on a negative working capital led
by consistent improvement in the inventory turnover. On
the back of this, the company is able to maintain a debt-
free status. Its strong cash flow generation aids it to fund
the capex requirements
Page 18ICICI Securities Ltd | Retail Equity Research
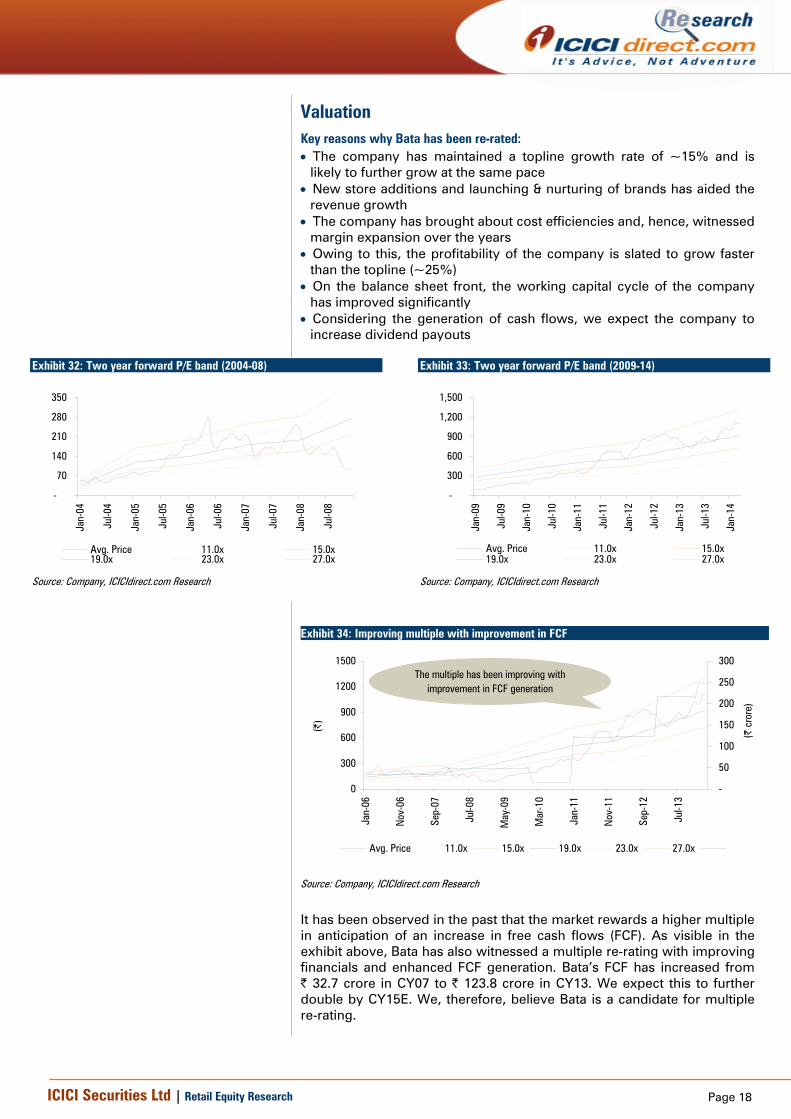
Valuation Key reasons why Bata has been re-rated: • The company has maintained a topline growth rate of ~15% and is
likely to further grow at the same pace • New store additions and launching & nurturing of brands has aided the
revenue growth • The company has brought about cost efficiencies and, hence, witnessed
margin expansion over the years • Owing to this, the profitability of the company is slated to grow faster
than the topline (~25%) • On the balance sheet front, the working capital cycle of the company
has improved significantly • Considering the generation of cash flows, we expect the company to
increase dividend payouts
Exhibit 32: Two year forward P/E band (2004-08)
-
70
140
210
280
350
Jan-
04
Jul-0
4
Jan-
05
Jul-0
5
Jan-
06
Jul-0
6
Jan-
07
Jul-0
7
Jan-
08
Jul-0
8
Avg. Price 11.0x 15.0x19.0x 23.0x 27.0x
Source: Company, ICICIdirect.com Research
Exhibit 33: Two year forward P/E band (2009-14)
-
300
600
900
1,200
1,500
Jan-
09
Jul-0
9
Jan-
10
Jul-1
0
Jan-
11
Jul-1
1
Jan-
12
Jul-1
2
Jan-
13
Jul-1
3
Jan-
14
Avg. Price 11.0x 15.0x19.0x 23.0x 27.0x
Source: Company, ICICIdirect.com Research
Exhibit 34: Improving multiple with improvement in FCF
0
300
600
900
1200
1500
Jan-
06
Nov
-06
Sep-
07
Jul-0
8
May
-09
Mar
-10
Jan-
11
Nov
-11
Sep-
12
Jul-1
3
(|)
-
50
100
150
200
250
300
(| c
rore
)
Avg. Price 11.0x 15.0x 19.0x 23.0x 27.0x
The multiple has been improving with improvement in FCF generation
Source: Company, ICICIdirect.com Research
It has been observed in the past that the market rewards a higher multiple in anticipation of an increase in free cash flows (FCF). As visible in the exhibit above, Bata has also witnessed a multiple re-rating with improving financials and enhanced FCF generation. Bata’s FCF has increased from | 32.7 crore in CY07 to | 123.8 crore in CY13. We expect this to further double by CY15E. We, therefore, believe Bata is a candidate for multiple re-rating.
Page 19ICICI Securities Ltd | Retail Equity Research
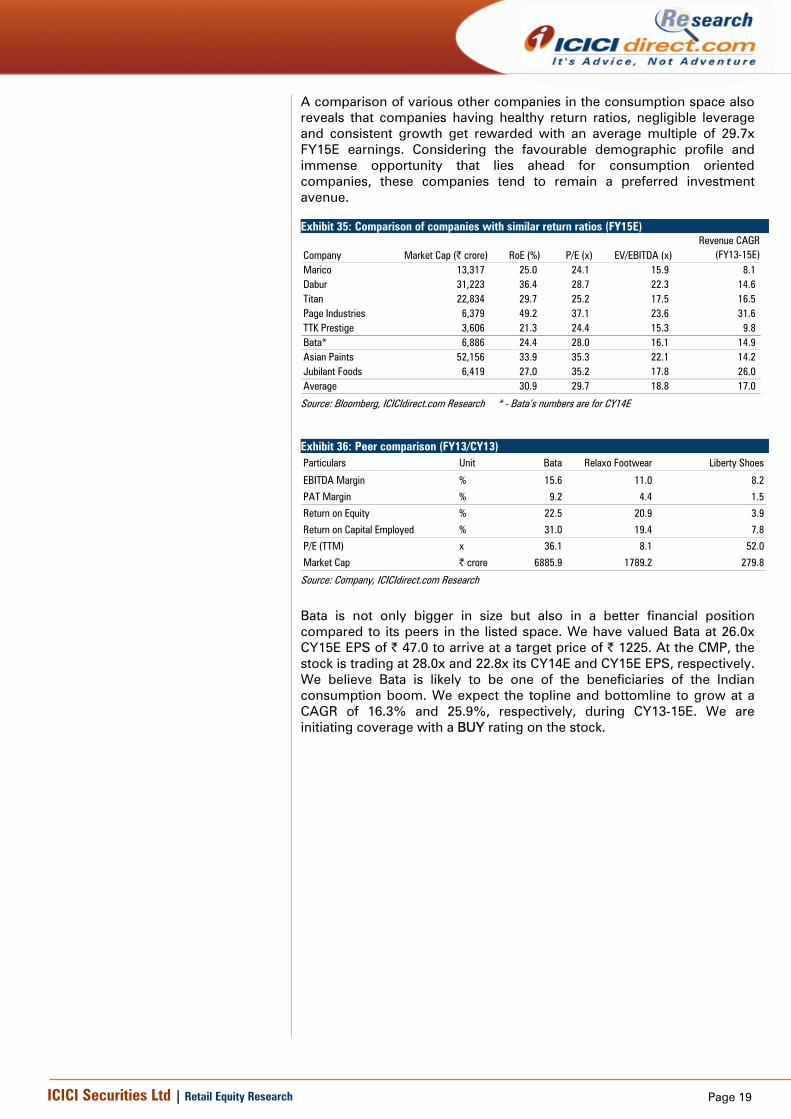
A comparison of various other companies in the consumption space also reveals that companies having healthy return ratios, negligible leverage and consistent growth get rewarded with an average multiple of 29.7x FY15E earnings. Considering the favourable demographic profile and immense opportunity that lies ahead for consumption oriented companies, these companies tend to remain a preferred investment avenue.
Exhibit 35: Comparison of companies with similar return ratios (FY15E)
Company Market Cap (| crore) RoE (%) P/E (x) EV/EBITDA (x)Revenue CAGR
(FY13-15E)Marico 13,317 25.0 24.1 15.9 8.1 Dabur 31,223 36.4 28.7 22.3 14.6 Titan 22,834 29.7 25.2 17.5 16.5 Page Industries 6,379 49.2 37.1 23.6 31.6 TTK Prestige 3,606 21.3 24.4 15.3 9.8 Bata* 6,886 24.4 28.0 16.1 14.9 Asian Paints 52,156 33.9 35.3 22.1 14.2 Jubilant Foods 6,419 27.0 35.2 17.8 26.0 Average 30.9 29.7 18.8 17.0
Source: Bloomberg, ICICIdirect.com Research * - Bata’s numbers are for CY14E
Exhibit 36: Peer comparison (FY13/CY13) Particulars Unit Bata Relaxo Footwear Liberty Shoes
EBITDA Margin % 15.6 11.0 8.2
PAT Margin % 9.2 4.4 1.5
Return on Equity % 22.5 20.9 3.9
Return on Capital Employed % 31.0 19.4 7.8
P/E (TTM) x 36.1 8.1 52.0
Market Cap | crore 6885.9 1789.2 279.8
Source: Company, ICICIdirect.com Research
Bata is not only bigger in size but also in a better financial position compared to its peers in the listed space. We have valued Bata at 26.0x CY15E EPS of | 47.0 to arrive at a target price of | 1225. At the CMP, the stock is trading at 28.0x and 22.8x its CY14E and CY15E EPS, respectively. We believe Bata is likely to be one of the beneficiaries of the Indian consumption boom. We expect the topline and bottomline to grow at a CAGR of 16.3% and 25.9%, respectively, during CY13-15E. We are initiating coverage with a BUY rating on the stock.
Page 20ICICI Securities Ltd | Retail Equity Research
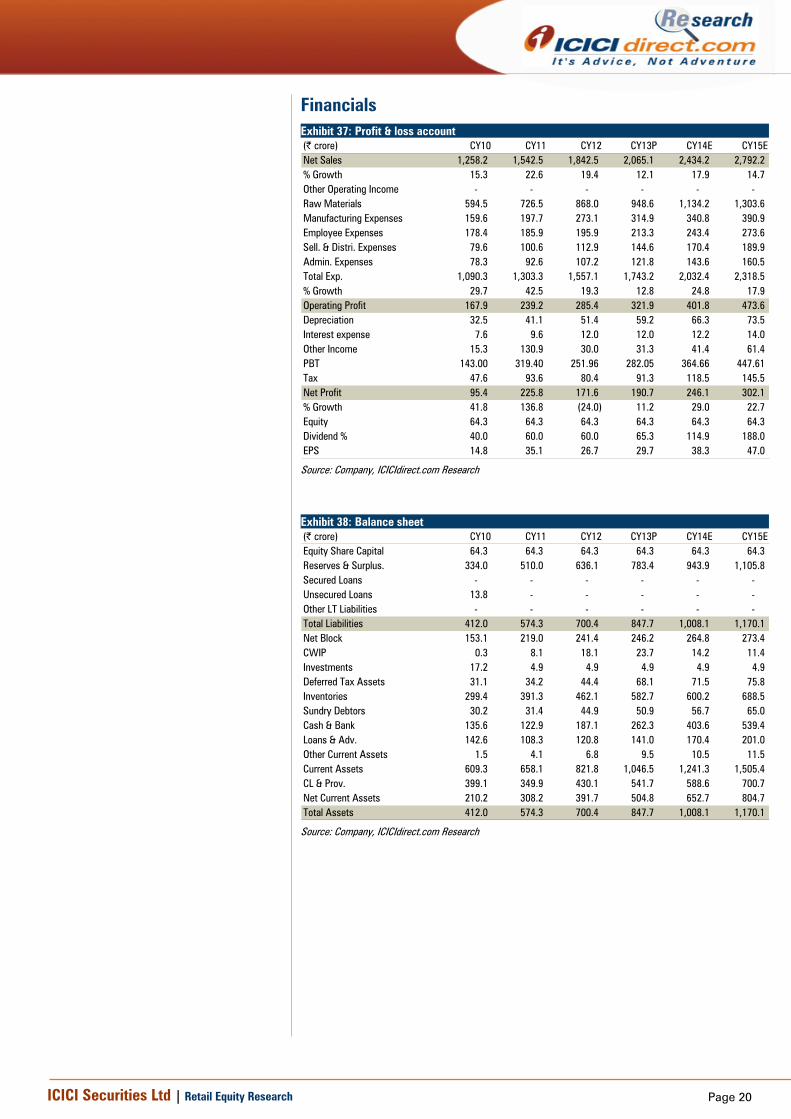
Financials Exhibit 37: Profit & loss account (| crore) CY10 CY11 CY12 CY13P CY14E CY15ENet Sales 1,258.2 1,542.5 1,842.5 2,065.1 2,434.2 2,792.2 % Growth 15.3 22.6 19.4 12.1 17.9 14.7 Other Operating Income - - - - - - Raw Materials 594.5 726.5 868.0 948.6 1,134.2 1,303.6 Manufacturing Expenses 159.6 197.7 273.1 314.9 340.8 390.9 Employee Expenses 178.4 185.9 195.9 213.3 243.4 273.6 Sell. & Distri. Expenses 79.6 100.6 112.9 144.6 170.4 189.9 Admin. Expenses 78.3 92.6 107.2 121.8 143.6 160.5 Total Exp. 1,090.3 1,303.3 1,557.1 1,743.2 2,032.4 2,318.5 % Growth 29.7 42.5 19.3 12.8 24.8 17.9 Operating Profit 167.9 239.2 285.4 321.9 401.8 473.6 Depreciation 32.5 41.1 51.4 59.2 66.3 73.5 Interest expense 7.6 9.6 12.0 12.0 12.2 14.0 Other Income 15.3 130.9 30.0 31.3 41.4 61.4 PBT 143.00 319.40 251.96 282.05 364.66 447.61 Tax 47.6 93.6 80.4 91.3 118.5 145.5 Net Profit 95.4 225.8 171.6 190.7 246.1 302.1 % Growth 41.8 136.8 (24.0) 11.2 29.0 22.7 Equity 64.3 64.3 64.3 64.3 64.3 64.3 Dividend % 40.0 60.0 60.0 65.3 114.9 188.0 EPS 14.8 35.1 26.7 29.7 38.3 47.0
Source: Company, ICICIdirect.com Research
Exhibit 38: Balance sheet (| crore) CY10 CY11 CY12 CY13P CY14E CY15EEquity Share Capital 64.3 64.3 64.3 64.3 64.3 64.3 Reserves & Surplus. 334.0 510.0 636.1 783.4 943.9 1,105.8 Secured Loans - - - - - - Unsecured Loans 13.8 - - - - - Other LT Liabilities - - - - - - Total Liabilities 412.0 574.3 700.4 847.7 1,008.1 1,170.1 Net Block 153.1 219.0 241.4 246.2 264.8 273.4 CWIP 0.3 8.1 18.1 23.7 14.2 11.4 Investments 17.2 4.9 4.9 4.9 4.9 4.9 Deferred Tax Assets 31.1 34.2 44.4 68.1 71.5 75.8 Inventories 299.4 391.3 462.1 582.7 600.2 688.5 Sundry Debtors 30.2 31.4 44.9 50.9 56.7 65.0 Cash & Bank 135.6 122.9 187.1 262.3 403.6 539.4 Loans & Adv. 142.6 108.3 120.8 141.0 170.4 201.0 Other Current Assets 1.5 4.1 6.8 9.5 10.5 11.5 Current Assets 609.3 658.1 821.8 1,046.5 1,241.3 1,505.4 CL & Prov. 399.1 349.9 430.1 541.7 588.6 700.7 Net Current Assets 210.2 308.2 391.7 504.8 652.7 804.7 Total Assets 412.0 574.3 700.4 847.7 1,008.1 1,170.1
Source: Company, ICICIdirect.com Research
Page 21ICICI Securities Ltd | Retail Equity Research
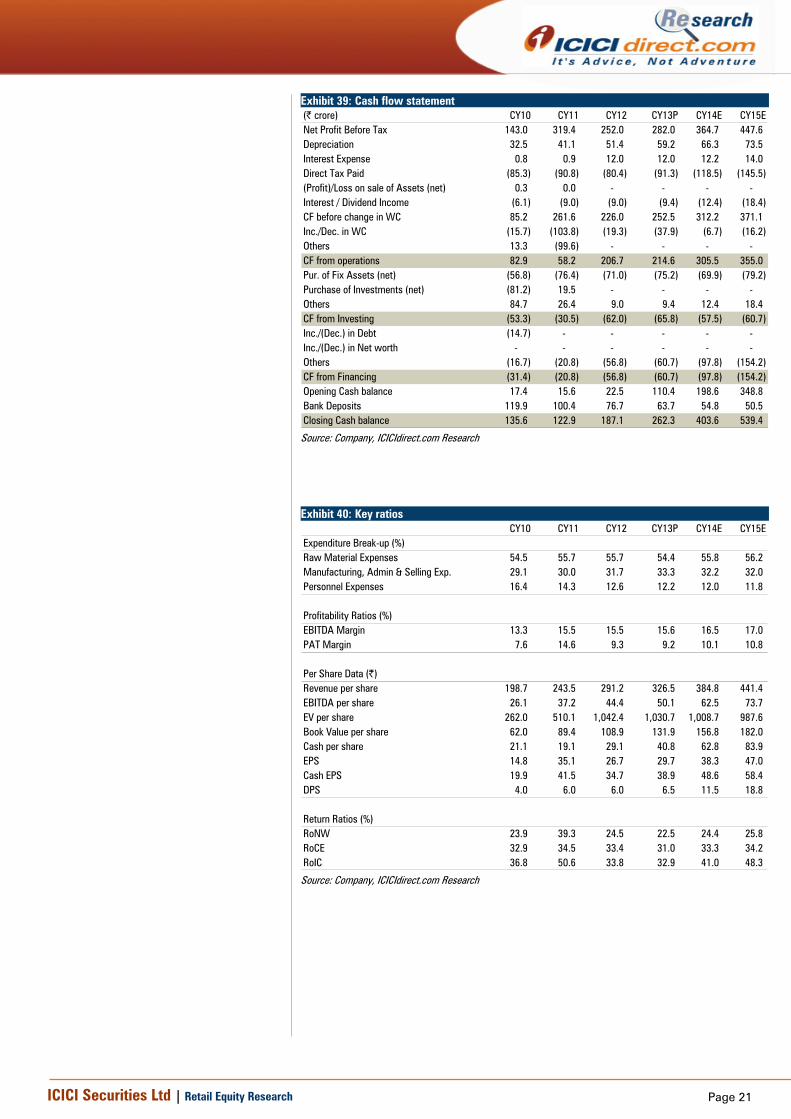
Exhibit 39: Cash flow statement (| crore) CY10 CY11 CY12 CY13P CY14E CY15ENet Profit Before Tax 143.0 319.4 252.0 282.0 364.7 447.6 Depreciation 32.5 41.1 51.4 59.2 66.3 73.5 Interest Expense 0.8 0.9 12.0 12.0 12.2 14.0 Direct Tax Paid (85.3) (90.8) (80.4) (91.3) (118.5) (145.5) (Profit)/Loss on sale of Assets (net) 0.3 0.0 - - - - Interest / Dividend Income (6.1) (9.0) (9.0) (9.4) (12.4) (18.4) CF before change in WC 85.2 261.6 226.0 252.5 312.2 371.1 Inc./Dec. in WC (15.7) (103.8) (19.3) (37.9) (6.7) (16.2) Others 13.3 (99.6) - - - - CF from operations 82.9 58.2 206.7 214.6 305.5 355.0 Pur. of Fix Assets (net) (56.8) (76.4) (71.0) (75.2) (69.9) (79.2) Purchase of Investments (net) (81.2) 19.5 - - - - Others 84.7 26.4 9.0 9.4 12.4 18.4 CF from Investing (53.3) (30.5) (62.0) (65.8) (57.5) (60.7) Inc./(Dec.) in Debt (14.7) - - - - - Inc./(Dec.) in Net worth - - - - - - Others (16.7) (20.8) (56.8) (60.7) (97.8) (154.2) CF from Financing (31.4) (20.8) (56.8) (60.7) (97.8) (154.2) Opening Cash balance 17.4 15.6 22.5 110.4 198.6 348.8 Bank Deposits 119.9 100.4 76.7 63.7 54.8 50.5 Closing Cash balance 135.6 122.9 187.1 262.3 403.6 539.4
Source: Company, ICICIdirect.com Research
Exhibit 40: Key ratios
CY10 CY11 CY12 CY13P CY14E CY15EExpenditure Break-up (%)Raw Material Expenses 54.5 55.7 55.7 54.4 55.8 56.2 Manufacturing, Admin & Selling Exp. 29.1 30.0 31.7 33.3 32.2 32.0 Personnel Expenses 16.4 14.3 12.6 12.2 12.0 11.8
Profitability Ratios (%)EBITDA Margin 13.3 15.5 15.5 15.6 16.5 17.0 PAT Margin 7.6 14.6 9.3 9.2 10.1 10.8
Per Share Data (|)Revenue per share 198.7 243.5 291.2 326.5 384.8 441.4 EBITDA per share 26.1 37.2 44.4 50.1 62.5 73.7 EV per share 262.0 510.1 1,042.4 1,030.7 1,008.7 987.6 Book Value per share 62.0 89.4 108.9 131.9 156.8 182.0 Cash per share 21.1 19.1 29.1 40.8 62.8 83.9 EPS 14.8 35.1 26.7 29.7 38.3 47.0 Cash EPS 19.9 41.5 34.7 38.9 48.6 58.4 DPS 4.0 6.0 6.0 6.5 11.5 18.8
Return Ratios (%)RoNW 23.9 39.3 24.5 22.5 24.4 25.8 RoCE 32.9 34.5 33.4 31.0 33.3 34.2 RoIC 36.8 50.6 33.8 32.9 41.0 48.3
Source: Company, ICICIdirect.com Research
Page 22ICICI Securities Ltd | Retail Equity Research
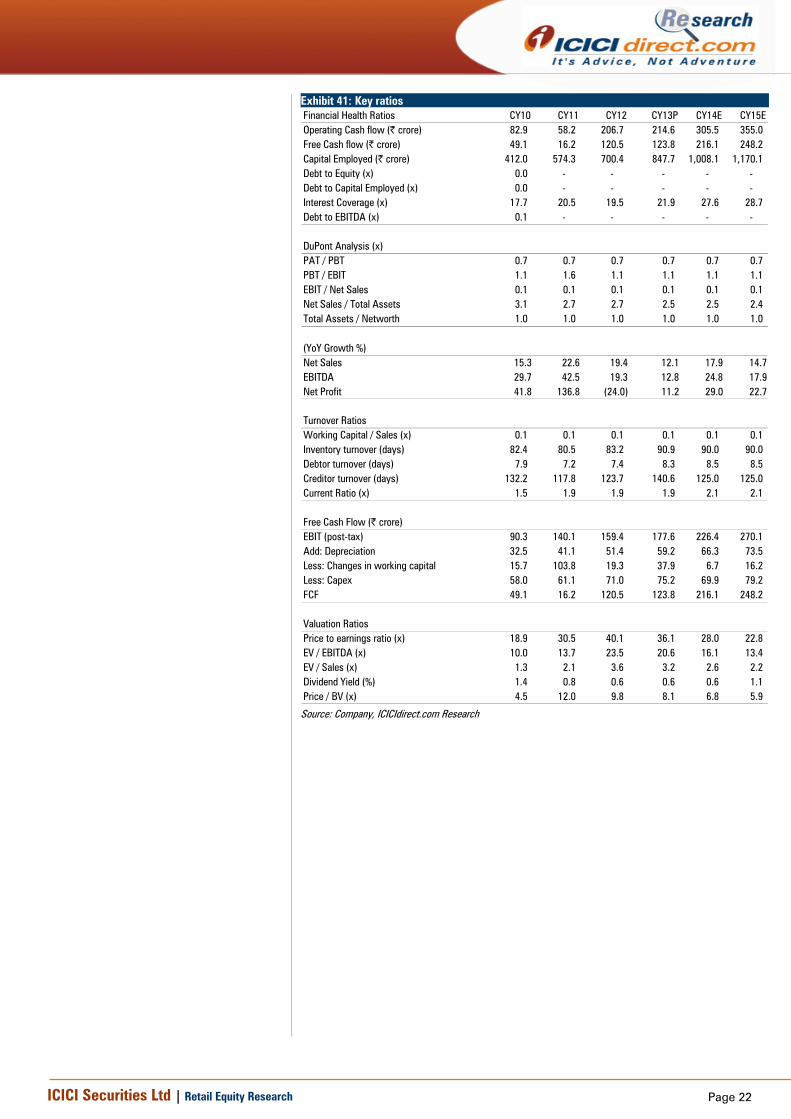
Exhibit 41: Key ratios Financial Health Ratios CY10 CY11 CY12 CY13P CY14E CY15EOperating Cash flow (| crore) 82.9 58.2 206.7 214.6 305.5 355.0 Free Cash flow (| crore) 49.1 16.2 120.5 123.8 216.1 248.2 Capital Employed (| crore) 412.0 574.3 700.4 847.7 1,008.1 1,170.1 Debt to Equity (x) 0.0 - - - - - Debt to Capital Employed (x) 0.0 - - - - - Interest Coverage (x) 17.7 20.5 19.5 21.9 27.6 28.7 Debt to EBITDA (x) 0.1 - - - - -
DuPont Analysis (x)PAT / PBT 0.7 0.7 0.7 0.7 0.7 0.7 PBT / EBIT 1.1 1.6 1.1 1.1 1.1 1.1 EBIT / Net Sales 0.1 0.1 0.1 0.1 0.1 0.1 Net Sales / Total Assets 3.1 2.7 2.7 2.5 2.5 2.4 Total Assets / Networth 1.0 1.0 1.0 1.0 1.0 1.0
(YoY Growth %)Net Sales 15.3 22.6 19.4 12.1 17.9 14.7 EBITDA 29.7 42.5 19.3 12.8 24.8 17.9 Net Profit 41.8 136.8 (24.0) 11.2 29.0 22.7
Turnover Ratios Working Capital / Sales (x) 0.1 0.1 0.1 0.1 0.1 0.1 Inventory turnover (days) 82.4 80.5 83.2 90.9 90.0 90.0 Debtor turnover (days) 7.9 7.2 7.4 8.3 8.5 8.5 Creditor turnover (days) 132.2 117.8 123.7 140.6 125.0 125.0 Current Ratio (x) 1.5 1.9 1.9 1.9 2.1 2.1
Free Cash Flow (| crore)EBIT (post-tax) 90.3 140.1 159.4 177.6 226.4 270.1 Add: Depreciation 32.5 41.1 51.4 59.2 66.3 73.5 Less: Changes in working capital 15.7 103.8 19.3 37.9 6.7 16.2 Less: Capex 58.0 61.1 71.0 75.2 69.9 79.2 FCF 49.1 16.2 120.5 123.8 216.1 248.2
Valuation RatiosPrice to earnings ratio (x) 18.9 30.5 40.1 36.1 28.0 22.8 EV / EBITDA (x) 10.0 13.7 23.5 20.6 16.1 13.4 EV / Sales (x) 1.3 2.1 3.6 3.2 2.6 2.2 Dividend Yield (%) 1.4 0.8 0.6 0.6 0.6 1.1 Price / BV (x) 4.5 12.0 9.8 8.1 6.8 5.9
Source: Company, ICICIdirect.com Research
Page 23ICICI Securities Ltd | Retail Equity Research
RATING RATIONALE ICICIdirect.com endeavours to provide objective opinions and recommendations. ICICIdirect.com assigns ratings to its stocks according to their notional target price vs. current market price and then categorises them as Strong Buy, Buy, Hold and Sell. The performance horizon is two years unless specified and the notional target price is defined as the analysts' valuation for a stock. Strong Buy: >15%/20% for large caps/midcaps, respectively, with high conviction; Buy: > 10%/ 15% for large caps/midcaps, respectively; Hold: Up to +/-10%; Sell: -10% or more;
Pankaj Pandey Head – Research [email protected]
ICICIdirect.com Research Desk, ICICI Securities Limited, 1st Floor, Akruti Trade Centre, Road No. 7, MIDC, Andheri (East) Mumbai – 400 093
ANALYST CERTIFICATION We /I, Bharat Chhoda M.B.A.(FINANCE) Dhvani Modi M.B.A.(FINANCE) research analysts, authors and the names subscribed to this report, hereby certify that all of the views expressed in this research report accurately reflect our personal views about any and all of the subject issuer(s) or securities. We also certify that no part of our compensation was, is, or will be directly or indirectly related to the specific recommendation(s) or view(s) in this report. Analysts aren't registered as research analysts by FINRA and might not be an associated person of the ICICI Securities Inc.
Disclosures: ICICI Securities Limited (ICICI Securities) and its affiliates are a full-service, integrated investment banking, investment management and brokerage and financing group. We along with affiliates are leading underwriter of securities and participate in virtually all securities trading markets in India. We and our affiliates have investment banking and other business relationship with a significant percentage of companies covered by our Investment Research Department. Our research professionals provide important input into our investment banking and other business selection processes. ICICI Securities generally prohibits its analysts, persons reporting to analysts and their dependent family members from maintaining a financial interest in the securities or derivatives of any companies that the analysts cover.
The information and opinions in this report have been prepared by ICICI Securities and are subject to change without any notice. The report and information contained herein is strictly confidential and meant solely for the selected recipient and may not be altered in any way, transmitted to, copied or distributed, in part or in whole, to any other person or to the media or reproduced in any form, without prior written consent of ICICI Securities. While we would endeavour to update the information herein on reasonable basis, ICICI Securities, its subsidiaries and associated companies, their directors and employees (“ICICI Securities and affiliates”) are under no obligation to update or keep the information current. Also, there may be regulatory, compliance or other reasons that may prevent ICICI Securities from doing so. Non-rated securities indicate that rating on a particular security has been suspended temporarily and such suspension is in compliance with applicable regulations and/or ICICI Securities policies, in circumstances where ICICI Securities is acting in an advisory capacity to this company, or in certain other circumstances.
This report is based on information obtained from public sources and sources believed to be reliable, but no independent verification has been made nor is its accuracy or completeness guaranteed. This report and information herein is solely for informational purpose and may not be used or considered as an offer document or solicitation of offer to buy or sell or subscribe for securities or other financial instruments. Though disseminated to all the customers simultaneously, not all customers may receive this report at the same time. ICICI Securities will not treat recipients as customers by virtue of their receiving this report. Nothing in this report constitutes investment, legal, accounting and tax advice or a representation that any investment or strategy is suitable or appropriate to your specific circumstances. The securities discussed and opinions expressed in this report may not be suitable for all investors, who must make their own investment decisions, based on their own investment objectives, financial positions and needs of specific recipient. This may not be taken in substitution for the exercise of independent judgment by any recipient. The recipient should independently evaluate the investment risks. The value and return of investment may vary because of changes in interest rates, foreign exchange rates or any other reason. ICICI Securities and affiliates accept no liabilities for any loss or damage of any kind arising out of the use of this report. Past performance is not necessarily a guide to future performance. Investors are advised to see Risk Disclosure Document to understand the risks associated before investing in the securities markets. Actual results may differ materially from those set forth in projections. Forward-looking statements are not predictions and may be subject to change without notice.
ICICI Securities and its affiliates might have managed or co-managed a public offering for the subject company in the preceding twelve months. ICICI Securities and affiliates might have received compensation from the companies mentioned in the report during the period preceding twelve months from the date of this report for services in respect of public offerings, corporate finance, investment banking or other advisory services in a merger or specific transaction. It is confirmed that Bharat Chhoda M.B.A.(FINANCE) Dhvani Modi M.B.A.(FINANCE) research analysts and the authors of this report have not received any compensation from the companies mentioned in the report in the preceding twelve months. Our research professionals are paid in part based on the profitability of ICICI Securities, which include earnings from Investment Banking and other business.
ICICI Securities or its subsidiaries collectively do not own 1% or more of the equity securities of the Company mentioned in the report as of the last day of the month preceding the publication of the research report.
It is confirmed that Bharat Chhoda M.B.A.(FINANCE) Dhvani Modi M.B.A.(FINANCE) research analysts and the authors of this report or any of their family members does not serve as an officer, director or advisory board member of the companies mentioned in the report.
ICICI Securities may have issued other reports that are inconsistent with and reach different conclusion from the information presented in this report. ICICI Securities and affiliates may act upon or make use of information contained in the report prior to the publication thereof.
This report is not directed or intended for distribution to, or use by, any person or entity who is a citizen or resident of or located in any locality, state, country or other jurisdiction, where such distribution, publication, availability or use would be contrary to law, regulation or which would subject ICICI Securities and affiliates to any registration or licensing requirement within such jurisdiction. The securities described herein may or may not be eligible for sale in all jurisdictions or to certain category of investors. Persons in whose possession this document may come are required to inform themselves of and to observe such restriction.