Embed Size (px)
Citation preview

Project ID: MR1 - 1601
Equine Lung Function Testing Device
A Major Qualifying Project Report submitted to the faculty of
WORCESTER POLYTECHNIC INSTITUTE
In partial fulfillment of the requirements for the degree of Bachelor of Science
Submitted by:
______________________
Lucy Garvey
______________________
Lubna Hassan
______________________
Kyla Nichols
______________________
Allison Paquin
April 27, 2017
________________________________
Professor Marsha Rolle, Advisor
Department of Biomedical Engineering
_________________________________
Professor Robert Daniello, Advisor
Department of Mechanical Engineering

ii
Abstract
Up to 80 percent of horses experience respiratory disorders in their lifetime due to their
living environment (Kusano, Ishikawa, Kazuhiro, & Kusunose, 2008). Current diagnostic
methods are invasive and expensive. Cummings School of Veterinary Medicine at Tufts
University is the only facility in New England with a non-invasive equine respiratory testing
device. However, this device poses a risk to operators because it is not well attached, weighs 3
pounds, and protrudes 12 inches from the horse’s muzzle, causing it to disconnect and harm the
operator if the horse moves suddenly. Seeking improvements, our team designed a safer, less
expensive, non-invasive device to measure equine lung function to improve testing availability
and market potential. This small, lightweight device uses a thermistor-based sensor to measure
airflow at low flow speeds. A unique LabVIEW program displays the airflow in a way that is
easy for the veterinarian to use for diagnoses.

iii
Acknowledgments
We would like to thank our project advisors, Professor Marsha Rolle and Professor
Robert Daniello, and our project sponsor, Dr. Melissa Mazan, for their help and support
throughout the project. We also would like to thank Lisa Wall, Elyse Favreau, Professor Brian
Savilonis, Professor David Olinger, Peter Hefti, and Randy Robinson for providing testing
equipment, knowledge, and assistance throughout the project.

iv
Executive Summary
Introduction
Equine lung function disorders caused by poor air quality in stables are common
(Robinson, 2003). Horses cannot be tested using the same methods as humans because of
physiological differences, including their noncompliant nature. Horses cannot respond to verbal
requests resulting in most current diagnostic methods, such as endoscopy, being invasive and
expensive. Thus, veterinarians only test lung function as a last resort, which is detrimental
because if not diagnosed early, permanent damage of pulmonary tissue can occur. Cummings
School of Veterinary Medicine at Tufts University performs equine lung function testing with
non-invasive devices that measure pressure drop using a Fleisch pneumotachograph (Figure i.1).
The pneumotachograph data is converted to flow rate and displayed with data measured by
Respiratory Inductance Plethysmography (RIP) bands placed around the horse’s abdomen and
thorax. Variations between the pneumotachograph and RIP band signals indicate pulmonary
disorders. Although functional, the current device has several drawbacks, including danger due
to its size (12 inches), weight (3 lbs.), and unpredictability of horses’ movement, cost ($18,000),
resistance to breathing, and limited accuracy. We were tasked with developing a device to
measure equine lung function that improves the overall device. It must also be compatible with
typical equine breathing patterns. Based on our sponsor’s needs, we created functional blocks for
our design including: calibration, measuring airflow, signal processing, and device exterior
development (Figure i.1).
Figure i.1: Current device labeled with functional blocks

v
Materials and methods
Concept selection
Four alternative design concepts were developed. To select the best design for our
application, we reviewed research papers, consulted our advisors, and developed a design matrix
to rank each design. To assess feasibility, SolidWorks’ Flow Simulation was used to produce
velocity and pressure cut plots, identifying significant eddying or resistance. Calculations were
completed to determine the inertial impact on overspeeding, the deflection caused by a breath,
and the pressure drop through the capillaries.
Wind sensor calibration
Zero-point testing was conducted with Modern Device’s Rev C Wind Sensor to find the
adjustment factor for the sensor’s reading at 0 MPH that is incorporated into the sensor’s
calibration equation. The sensor was placed under a glass bowl to restrict airflow, and was
connected to LabVIEW via a USB-6000 data acquisition (DAQ) box (National Instruments). The
LabVIEW program acquired voltage signals and converted them to wind speeds.
Wind sensor verification
The sensor was tested in WPI’s Aerospace department’s wind tunnel to verify
functionality at high speeds. The sensor was tested at 20, 35, and 50 MPH and data was collected
using LabVIEW. To verify the sensor’s function at lower speeds, it was tested in a low flow
wind tunnel constructed from PVC pipe, PVC reducers, a ¼-in. NPT ball valve, a regulator, a
compressed airline, a flow straightener, and a rotameter and Testo hot wire probe for
comparison. To verify the sensor’s response to cyclic flow, it was compared to the
pneumotachograph using a combination of syringe and human breathing tests. We created a 4.07
L syringe using a 4-in. diameter 2 ft. PVC pipe, a machined aluminum piston, a wooden dowel
handle, and 2-240 O-rings for sealing. This syringe was used to calibrate the pneumotachograph
with a cyclic flow of a known volume. After calibration, a team member breathed through the
pneumotachograph and the new sensor, simultaneously. Data was collected for the sensor in
LabVIEW and the pneumotachograph in Open Pleth (a proprietary software). The raw data for
each was then overlaid on a graph in EXCEL.

vi
Results
Final concept selection
SolidWorks models of our four alternative designs and flow simulations were created
(Figure i.2 and Figure i.3).
a. b. c. d.
Figure i.2: a. Improved Fleisch Pneumotachograph; b. Three-cup anemometer; c. Strain gauge
on hair like structures; d. Hot-wire anemometer concept (arrow indicates sensor).
Figure i.3: Velocity cut plot for three-cup anemometer
Constructing a smaller, safer, less expensive Fleisch pneumotachograph proved infeasible
because of the manufacturing requirements and associated cost. The size is also difficult to
reduce without drastically increasing resistance, as determined by our flow simulations.
Experimental results from the three-cup anemometer model showed that the device’s inertia
causes overspeeding, resulting in a 2 second response time (Chen, 2016). The breathing rate of a
horse (5 seconds per breath) is too fast for this response time to be accurate. Significant eddying
was also seen in the velocity plot which adds resistance to breathing (Figure i.3). The strain

vii
gauges on hair-like structures could work at faster wind speeds, but for a horse’s breath (0.2
MPH) the structures would only deflect approximately 0.308 nm which is too small for a strain
gauge to measure accurately. Based on simulations and research, the team determined that the
hot-wire concept was the most feasible. To remove concerns of fragility and response to
moisture, thermistor-based sensors that work similarly to hot-wire anemometry were acquired.
Our prototype incorporated a Rev C Wind Sensor that is accurate at low wind speeds.
Wind sensor calibration
An adjustment factor of approximately 0.35 was determined for a 5 V excitation voltage.
A LabVIEW calibration program was developed to automatically find the adjustment factor
before performing a test.
Wind sensor verification
In order to verify functionality a calibrated wind tunnel was used. The sensor read values
similar to the wind tunnel with an R2 value of 0.9963 (Figure i.4).
Figure i.4: High speed wind tunnel test results
To confirm the sensor’s function at low flows, a low flow wind tunnel constructed by the
team was used and the sensor’s readings were compared to the readings of a Testo 405i hot wire
probe. The readings of both were not significantly different proven by the low P-value found
with a T-test (Figure i.5).
R² = 0.9963
0
10
20
30
40
50
60
0 10 20 30 40 50 60
Set
win
d t
un
nel
sp
eed
(M
PH
)
Rev C sensor's readings (MPH)
High speed wind tunnel test

viii
Figure i.5: Rev C compared to Testo 405i hot wire probe in low flow wind tunnel
To confirm the sensor responded to cyclic flow, like that produced by a horse’s breath,
breathing tests from human subjects were also completed. Figure i.6 shows the comparison of the
pneumotachograph and Rev C. The results closely overlapped.
Figure i.6: Pneumotachograph and Rev C sensor data overlaid after human breathing test
Wind sensor validation
After verifying the sensors functionality at low, cyclic flows it was determined ready for
clinical tests. These clinical tests were performed to validate that the sensor accurately measured
equine lung function and met the objectives of the project. The device was tested on three
different horses. Two of these horses were unsedated and the last was mildly sedated because of
another procedure. The results produced similar maximum flow rates to past tests conducted with
the Fleisch pneumotachograph in Open Pleth. Figure i.7 shows a representative data sample of
these clinical tests.
0
0.1
0.2
0.3
0.4
0.5
0 10 20 30 40 50 60W
ind
sp
eed
(m
/s)
Data points
Low speed wind tunnel test
Rev C Hotwire probe
P-value = 4.37x10⁻⁴
-0.3
-0.2
-0.1
0
0.1
0 5 10 15 20 25 30
Vo
lum
etri
c fl
ow
rat
e (L
/s)
Time (s)
Breathing test of current vs Rev C sensor
Rev C Pneumotach

ix
Figure i.7: Sample data from clinical tests conducted at Cummings School
Discussion and conclusion
We successfully evaluated the feasibility of a new design to test equine lung function.
The design met our objectives of being non-invasive and compatible with non-compliant
breathing. It also minimizes resistance to the horse’s breathing, is less expensive, and is reduced
significantly in size (2.5 in.) and weight (0.32 lbs.) to minimize the risk of injury for the user.
We also improved our data acquisition program. Most anemometry devices that measure flow in
both directions require multiple sensing elements. Therefore, we developed a LabVIEW program
that acquires and displays the flow and volume data and we developed a MATLAB program that
accounts for the flow in both directions, using a single sensor. Once these programs were
completed and a housing was created for the sensing element, our design met all of our
functional blocks and was tested clinically on horses. The results of these clinical tests closely
matched results from past tests with the pneumotachograph. These clinical tests also proved our
device was improved from the pneumotachograph because it was used on unsedated horses with
only one veterinarian whereas, the pneumotachograph requires horses to be slightly sedated and
have multiple veterinarians present to perform the test.
-2
0
2
4
6
15 25 35 45 55 65 75 85 95 105 115 125
Flo
w r
ate
(L/s
)
Time (s)
Sample Data

x
Authorship
Lucy Garvey Chapter 1
Chapter 2: 2.1, 2.4
Chapter 3: 3.2, 3.5
Chapter 4: 4.2, 4.3, 4.4
Chapter 5: 5.2
Chapter 6: 6.2
Chapter 7
Chapter 8
Lubna Hassan Chapter 1
Chapter 2: 2.7, 2.8
Chapter 3: 3.1, 3.5
Chapter 4: 4.2, 4.3, 4.4
Chapter 5: 5.2
Chapter 6: 6.2
Chapter 7
Chapter 8
Kyla Nichols Chapter 1
Chapter 2: 2.3, 2.6, 2.9
Chapter 3: 3.2, 3.3, 3.5
Chapter 4
Chapter 5: 5.2
Chapter 6
Chapter 7
Chapter 8
Allison Paquin Chapter 1
Chapter 2: 2.0, 2.2, 2.5,
Chapter 3: 3.1, 3.2, 3.4, 3.5
Chapter 4: 4.2, 4.3, 4.4
Chapter 5:
Chapter 6: 6.2
Chapter 7
Chapter 8
Each team member contributed equally to the editing of the report.

xi
Table of Contents
Abstract ............................................................................................................................................ i
Acknowledgments.......................................................................................................................... iii Executive Summary ....................................................................................................................... iv
Introduction ................................................................................................................................ iv Materials and methods ................................................................................................................ v
Concept selection .................................................................................................................... v
Wind sensor calibration .......................................................................................................... v Wind sensor verification ......................................................................................................... v
Results ........................................................................................................................................ vi Final concept selection ........................................................................................................... vi Wind sensor calibration ........................................................................................................ vii
Wind sensor verification ....................................................................................................... vii Wind sensor validation ........................................................................................................ viii
Discussion and conclusion ......................................................................................................... ix Authorship....................................................................................................................................... x
Table of Contents ........................................................................................................................... xi List of Figures ............................................................................................................................... xv
List of Tables ................................................................................................................................ xx 1.0 Introduction ............................................................................................................................... 1 2.0 Literature Review...................................................................................................................... 6
2.1 Equine respiratory system ..................................................................................................... 6 2.1.1 Respiratory system: horse versus human ....................................................................... 7
2.2 Respiratory disorders of horses ............................................................................................. 9
2.2.1 Recurrent airway obstruction (RAO) ............................................................................. 9
2.2.2 Inflammatory airway disease (IAD) ............................................................................ 10 2.2.3 Other disorders ............................................................................................................. 10
2.3 Diagnosing disorders .......................................................................................................... 11 2.4 Pulmonary function tests..................................................................................................... 12 2.5 Equine pulmonary function tests ........................................................................................ 13
2.5.1 Imaging ........................................................................................................................ 13 2.5.2 Sampling ...................................................................................................................... 15
2.5.3 Special laboratory diagnostics ..................................................................................... 17 2.5.4 Additional methods ...................................................................................................... 18
2.6 Cummings School gold standard ........................................................................................ 20 2.7 Complications when dealing with horses ........................................................................... 25
2.8 Significance of developing devices for horses.................................................................... 26 2.9 Conclusion .......................................................................................................................... 27
3.0 Project strategy........................................................................................................................ 28
3.1 Initial client statement ......................................................................................................... 28 3.1.1 Stakeholders ................................................................................................................. 28
3.2 Technical design requirements ........................................................................................... 28 3.2.1 Objectives .................................................................................................................... 29

xii
3.2.1.1 Accurately obtain equine lung function signals (± 0.33%) ................................... 30
3.2.1.2 Minimize resistance to the horse’s breathing ........................................................ 30 3.2.1.3 Cannot require compliant breathing ...................................................................... 30
3.2.1.4 Minimize risk for the human user ......................................................................... 30 3.2.1.5 Less expensive than the current device preferably less than $1000 ..................... 31 3.2.1.6 Compatible with LabVIEW software ................................................................... 31 3.2.1.7 Portable ................................................................................................................. 31 3.2.1.8 Meets veterinary standards ................................................................................... 31
3.2.2 Constraints ................................................................................................................... 32 3.2.3 Functions and means .................................................................................................... 32 3.2.4 Specifications ............................................................................................................... 35
3.3 Design requirement standards and specifications ............................................................... 35 3.4 Revised client statement ..................................................................................................... 36
3.5 Management approach ........................................................................................................ 37 3.5.1 Identify ......................................................................................................................... 37
3.5.2 Invent ........................................................................................................................... 37 3.5.3 Implementation ............................................................................................................ 39
3.5.4 Management tools ........................................................................................................ 39 3.5.5 Financial tools .............................................................................................................. 41
4.0 Design process ........................................................................................................................ 42 4.1 Needs analysis ..................................................................................................................... 42 4.2 Concept of designs and further testing................................................................................ 44
4.2.1 Concept map ................................................................................................................ 44 4.2.2 Advisor feedback ......................................................................................................... 46
4.2.3 Literature and research ................................................................................................. 48
4.2.3.1 Improved Fleisch Pneumotachograph................................................................... 48
4.2.3.2 Three-cup anemometer ......................................................................................... 48 4.2.3.3 Hot-wire anemometry ........................................................................................... 48
4.2.3.4 Mesh strain gauge ................................................................................................. 49 4.2.3.5 Venturi meter ........................................................................................................ 49 4.2.3.6 Chemical marker chip ........................................................................................... 49
4.2.3.7 Pitot tubes.............................................................................................................. 50 4.2.3.8 Silicon airflow sensor ........................................................................................... 50
4.2.4 Final alternative design selection ................................................................................. 51 4.2.5 Predictive models ......................................................................................................... 51
4.3 Alternative designs.............................................................................................................. 51 4.3.1 Improved Fleisch pneumotachograph .......................................................................... 51
4.3.2 Hot-wire anemometry .................................................................................................. 54 4.3.3 Three-cup anemometer with tachometer ..................................................................... 57 4.3.4 Strain gauge on hair-like structures ............................................................................. 61
4.4 Final Design Selection ........................................................................................................ 63 4.4.1 Aluminum Fleisch pneumotachograph ........................................................................ 64
4.4.1.1 Cost ....................................................................................................................... 64 4.4.1.2 Accuracy ............................................................................................................... 65

xiii
4.4.1.3 Feasibility .............................................................................................................. 67
4.4.1.4 Prototype ............................................................................................................... 67 4.4.2 Hot-wire anemometry .................................................................................................. 67
4.4.2.1 Cost ....................................................................................................................... 67 4.4.2.2 Accuracy ............................................................................................................... 68 4.4.2.3 Feasibility .............................................................................................................. 70
4.4.3 Three-cup anemometer ................................................................................................ 70 4.4.3.1 Cost ....................................................................................................................... 70
4.4.3.2 Modeling ............................................................................................................... 71 4.4.3.3 Feasibility .............................................................................................................. 72
4.4.4 Strain gauges on hair-like structures ............................................................................ 73 4.4.4.1 Cost ....................................................................................................................... 73 4.4.4.2 Accuracy ............................................................................................................... 74
4.4.4.3 Feasibility .............................................................................................................. 75 4.4.5 Overall sensor selection ............................................................................................... 76
4.4.6 Final Design ................................................................................................................. 77 4.4.6.1 Housing ................................................................................................................. 77
4.4.6.2 Attachment to facemask ........................................................................................ 78 4.4.7 Software ....................................................................................................................... 79
5.0 Design Verification ................................................................................................................. 81 5.1 Calibration of the thermal sensors ...................................................................................... 81
5.1.1 Arduino to LabVIEW .................................................................................................. 81
5.1.2 Zero-point test .............................................................................................................. 81 5.2 Sensor function verification ................................................................................................ 83
5.2.1 High speed wind tunnel test ......................................................................................... 84
5.2.2 Low flow wind tunnel test ........................................................................................... 87
5.2.3 Syringe test................................................................................................................... 90 5.2.4 Human breathing test ................................................................................................... 92
5.3 Clinical testing on horses .................................................................................................... 93 6.0 Final Design and Validation ................................................................................................... 97
6.1 Design validation ................................................................................................................ 97
6.1.1 Calibration of the sensors............................................................................................. 97 6.1.2 Measuring airflow from breathing horse ..................................................................... 97
6.1.3 Displaying the lung function data ................................................................................ 98 6.1.4 Attachment of the device to the horse.......................................................................... 99
6.2 Impact of Device ................................................................................................................. 99 6.2.1 Economics .................................................................................................................... 99
6.2.2 Environmental Impact ................................................................................................ 100 6.2.3 Societal Influence....................................................................................................... 100 6.2.4 Political Ramifications ............................................................................................... 100
6.2.5 Ethical Concerns ........................................................................................................ 101 6.2.6 Health and Safety Issues ............................................................................................ 101 6.2.7 Manufacturability ....................................................................................................... 102 6.2.8 Sustainability.............................................................................................................. 102

xiv
7.0 Discussion ............................................................................................................................. 103
7.1 Choosing an appropriate sensing element......................................................................... 103 7.2 Sensor calibration.............................................................................................................. 103
7.3 Sensor function verification .............................................................................................. 104 7.4 Clinical testing .................................................................................................................. 106 7.5 Limitations ........................................................................................................................ 106
8.0 Conclusions and Recommendations ..................................................................................... 108 8.1 Conclusions ....................................................................................................................... 108
8.2 Recommendations ............................................................................................................. 109 8.2.1 Improved sensor housing ........................................................................................... 109 8.2.2 Improved mask design ............................................................................................... 110 8.2.3 Improved signal processing ....................................................................................... 110 8.2.4 Incorporating RIP bands ............................................................................................ 111
8.2.5 Wireless sensing......................................................................................................... 111 8.2.6 Improved test program ............................................................................................... 111
8.2.7 Continued clinical testing .......................................................................................... 112 8.2.8 Humidity/moisture study ........................................................................................... 112
8.2.9 Veterinarian feedback ................................................................................................ 112 References ................................................................................................................................... 113
Appendix A: Gantt charts for each seven-week project segment ............................................... 119 Appendix B: MQP project expenses and budget ........................................................................ 122 Appendix C: Rev P wind sensor original LabVIEW program ................................................... 124
Appendix D: Rev C wind sensor original LabVIEW program ................................................... 125 Appendix E: LabVIEW program to find zero wind correction factor ........................................ 126
Appendix F: Five different calibration LabVIEW programs tested in wind tunnel for Rev P ... 128
Appendix G: Graphical results of Rev P wind tunnel testing ..................................................... 133
Appendix H: Low flow wind tunnel SOP ................................................................................... 136 Appendix I: SOP for Hold Peak handheld anemometer ............................................................. 139
Appendix J: SOP for Testo 405i hot wire smart probe ............................................................... 141 Appendix K: Single calibration final LabVIEW program for Rev C sensor .............................. 145 Appendix L: SOP for single calibration LabVIEW program ..................................................... 149
Appendix M: Double calibration final LabVIEW program for Rev C sensor ............................ 156 Appendix N: SOP for double calibration LabVIEW program.................................................... 162
Appendix O: Horse owner questionnaire on veterinary care ...................................................... 169 Appendix P: Veterinary questionnaire on veterinary care .......................................................... 174 Appendix Q: Overall results from horse owner survey .............................................................. 178 Appendix R: Overall results from veterinarian survey ............................................................... 181
Appendix S: Veterinarian survey data by United States’ region ................................................ 183

xv
List of Figures
Figure i.1: Current device labeled with functional blocks ............................................................. iv Figure i.2: a. Improved Fleisch Pneumotachograph; b. Three-cup anemometer; c. Strain gauge
on hair like structures; d. Hot-wire anemometer concept (arrow indicates sensor)................. vi Figure i.3: Velocity cut plot for three-cup anemometer ................................................................ vi Figure i.4: High speed wind tunnel test results ............................................................................. vii Figure i.5: Rev C compared to Testo 405i hot wire probe in low flow wind tunnel ................... viii Figure i.6: Pneumotachograph and Rev C sensor data overlaid after human breathing test ....... viii
Figure i.7: Sample data from clinical tests conducted at Cummings School................................. ix Figure 1.1: A) Schematic of the two components of the current device on a horse, B) Fleisch
pneumotachograph current component with parts and limitations labeled .............................. 3 Figure 2.1: Airflow into the horse during inspiration ..................................................................... 7 Figure 2.2: Comparison of airflow through a horse and a human .................................................. 8
Figure 2.3: A) A horse being tested with the passive Fleisch pneumotachograph device, B) A
schematic of the current device and how it works .................................................................. 20
Figure 2.4: Placement of abdominal and thoracic RIP bands (Howell, 2011) ............................. 21 Figure 2.5: Examples of graphs used for diagnosis ...................................................................... 22
Figure 2.6: Representative data from the RIP bands and the Fleisch pneumotachograph in Open
Pleth ........................................................................................................................................ 23
Figure 2.7: A) Cummings School of Veterinary Medicine FOM device, B) Schematic of FOM
method where sinusoidal air waves are forced through the pneumotachograph to the horse’s
respiratory system ................................................................................................................... 24
Figure 3.1: Limitations of the current device................................................................................ 29 Figure 3.2: Functional blocks ....................................................................................................... 33
Figure 3.3: Exploded view of the SolidWorks calibration syringe model .................................... 38
Figure 3.4: A) Disassembled syringe with the body on the left and the piston and handle on the
right; B) Assembled and depressed syringe ............................................................................ 39 Figure 3.5: Work breakdown structure ......................................................................................... 40
Figure 4.1: Concept map based on the functions of the design .................................................... 45 Figure 4.2: SolidWorks model of an improved Fleisch pneumotachograph ................................ 52 Figure 4.3: Basic hot-wire anemometry circuit including a Wheatstone bridge (Advanced
Thermal Solutions Inc., 2007). ............................................................................................... 55 Figure 4.4: Basic schematic of a hot-wire anemometer device. ................................................... 56
Figure 4.5: SolidWorks model of the three-cup anemometer component of the design .............. 58 Figure 4.6: SolidWorks model of the housing for the three-cup anemometer design .................. 59 Figure 4.7: Schematic of strain gauges on hair-like structures design ......................................... 62 Figure 4.8: SolidWorks flow trajectory pressure profile for a circular capillary .......................... 65
Figure 4.9: SolidWorks flow simulation velocity cut plot for a circular capillary ....................... 65 Figure 4.10: SolidWorks flow trajectory pressure profile for a triangular capillary .................... 66 Figure 4.11: SolidWorks flow simulation velocity cut plot for a triangular capillary .................. 66
Figure 4.12: SolidWorks flow simulation pressure cut plot for the hot-wire anemometry concept
................................................................................................................................................. 68 Figure 4.13: SolidWorks flow simulation velocity cut plot for the hot-wire anemometry concept
................................................................................................................................................. 69

xvi
Figure 4.14: A) Modern Device Rev P Wind Sensor; B) Modern Device Rev C Wind Sensor .. 69
Figure 4.15 SolidWorks cut plot of flow velocity profile for the three-cup anemometer design . 71 Figure 4.16: SolidWorks flow simulation pressure cut plot for the three-cup anemometer design
................................................................................................................................................. 72 Figure 4.17: SolidWorks flow simulation velocity cut plot for the strain gauge design .............. 74 Figure 4.18: SolidWorks flow simulation pressure cut plot for the strain gauge design .............. 75 Figure 4.19: Current facemask used for testing ............................................................................ 78 Figure 4.20: Final housing and Rev C sensor in current facemask .............................................. 79
Figure 5.1: Rev C sensor covered by a glass bowl to simulate a known zero-wind environment 82 Figure 5.2: Graphical representation of the results of the 9 V zero-point test with the Rev P
sensor ...................................................................................................................................... 82 Figure 5.3: Graphical representation of the results of the Rev C zero-point test at 4.7 V ............ 83 Figure 5.4: Laser cut acrylic fixture for holding Rev P and Rev C sensors for high speed wind
tunnel testing with a slot for wire insertion and hole for screw connection to the metal fixture
(Figure 5.5) ............................................................................................................................. 84
Figure 5.5: Common fixture for attaching the test object in the high-speed wind tunnel ............ 85 Figure 5.6: Rev P sensor held in flow stream by the laser cut acrylic piece ................................ 85
Figure 5.7: High speed wind tunnel test of the Rev P wind sensor with linear regression ........... 86 Figure 5.8: High speed wind tunnel test results of the Rev C wind sensor with linear regression87
Figure 5.9: Low flow wind tunnel test setup showing the Rev C wind sensor wires connected at
the end of the tunnel (left), the Testo 405i hot wire probe held at the open space at the end
(left), and the rotameter (right) used to determine the set pressure of the ball valve ............. 88
Figure 5.10: Overlaid signal from the Rev C and Testo 405i hot wire probe ............................... 89 Figure 5.11: Linear regression analysis of the Rev C wind sensor compared to the Testo 405i hot
wire probe in low flow wind tunnel test ................................................................................. 89
Figure 5.12: Rev C wind speed readings of cyclic flow produced by team created 4.07 L syringe
................................................................................................................................................. 91 Figure 5.13: Graphical comparison of corrected Rev C data and Fleisch pneumotachograph data
during syringe testing with the team designed 4.07 L syringe ............................................... 91 Figure 5.14: Overlaid pneumotachograph and corrected Rev C data for a human breathing test 93 Figure 5.15: Final device being used during clinical testing ........................................................ 94
Figure 5.16: A) Oliver clinical test results after manipulation in MATLAB; B) Missy test results
after manipulation in MATLAB; C) Ginger test results after manipulation in MATLAB .... 95
Figure A.1: Aterm Gantt chart .................................................................................................... 119 Figure A.2: BTerm Gantt chart ................................................................................................... 120 Figure A.3: CTerm Gantt Chart .................................................................................................. 121 Figure C.1: Rev P original LabVIEW program .......................................................................... 124
Figure D.1: Rev C original LabVIEW program ......................................................................... 125 Figure E.1: Block diagram of zero wind correction factor program........................................... 126 Figure E.2: Front panel of zero wind calibration factor program ............................................... 127
Figure F.1: Rev P first linear equation ........................................................................................ 128 Figure F.2: Rev P second linear equation ................................................................................... 129 Figure F.3: Rev P first polynomial equation ............................................................................... 130 Figure F.4: Rev P second polynomial equation .......................................................................... 131

xvii
Figure F.5: Rev P power equation .............................................................................................. 132
Figure G.1: Wind tunnel test with Eq. 4.16 ................................................................................ 133 Figure G.2: Wind tunnel test with first linear equation .............................................................. 133
Figure G.3: Wind tunnel test with second linear equation .......................................................... 134 Figure G.4: Wind tunnel test with first polynomial equation ..................................................... 134 Figure G.5: Wind tunnel test with second polynomial equation ................................................ 135 Figure G.6: Wind tunnel test with power equation ..................................................................... 135 Figure H.1: A) reducers unattached from reducing coupling; B) Reducers attached ................. 136
Figure H.2: threaded nipple and airline hose attached to rotameter ........................................... 136 Figure H.3: Ball valve attached to rotameter via airline hose ..................................................... 136 Figure H.4: Ball valve connected to regulator via airline hose ................................................... 137 Figure H.5: A) Regulator in closed position; B) Ball valve in closed position .......................... 137 Figure H.6: Male quick disconnect of regulator that interfaces with compressed airline .......... 137
Figure H.7: Rev C sensor secured at end of wind tunnel ............................................................ 138 Figure H.8: Ball valve completely open ..................................................................................... 138
Figure I.1: A) Side cover on digital anemometer; B) Side cover open on digital anemometer; C)
Flow anemometer attached to USB of digital anemometer .................................................. 139
Figure I.2: Digital anemometer screen display and keypad used for operation .......................... 139 Figure I.3: Flow anemometer positioned for flow coming out of the page, in the direction of the
arrow ..................................................................................................................................... 139 Figure I.4: Closeup image of the keypad of the device to better show the power, unit and
temperature control buttons .................................................................................................. 140
Figure I.5: Device powered off and in case for storage .............................................................. 140 Figure J.1: Icon for the smart probes app used for the Testo 405i hot wire probe ..................... 141
Figure J.2: IPhone menu pulled up from the bottom used to quickly turn on Bluetooth ............ 141
Figure J.3: A) Testo 405i probe folded and wrapped for storage; B) Testo 405i probe unwrapped
and unfolded for use.............................................................................................................. 141 Figure J.4: Testo 405i probe on, but not connected to the app as signified by the orange light . 141
Figure J.5: Testo 405i probe connected to the app as signified by the green light ..................... 141 Figure J.6: A) Black cover closed to protect the hot wire sensor; B) Black cover opened to allow
for testing with the hot wire sensor ....................................................................................... 142
Figure J.7: Home screen of the app showing list measurements ................................................ 142 Figure J.8: A) Trending view of standard app set up; B) The menu used to restart data collection
that comes up when the center button at the bottom is clicked ............................................ 143 Figure J.9: A) Trending view of standard app setup; B) Export option menu that allows the user
to choose a file type to export the data to ............................................................................. 143 Figure J.10: Email message with file attached that opens when file type is chosen ................... 144
Figure K.1: Zero wind calibration factor portion of final program ............................................ 145 Figure K.2: Front panel of final zero wind calibration program ................................................. 146 Figure K.3: Final single calibration LabVIEW test program block diagram ............................. 147
Figure K.4: Final single calibration LabVIEW test program front panel ................................... 148 Figure L.1: DAQ box used with the system; wires insert into the side below screws................ 149 Figure L.2: A) DAQ box ports with labels; B) Sensor with pins on left; C) Schematic of Rev C
sensor with labeled pins to corresponding DAQ box ports .................................................. 150

xviii
Figure L.3: Housing for the sensor ............................................................................................. 151
Figure L.4: Sensor in housing in mask ....................................................................................... 151 Figure L.5: Wall wart plugged into electrical outlet ................................................................... 151
Figure L.6: DAQ box connected to computer via USB .............................................................. 152 Figure L.7: A) Ringer used to choose which program is running; B) Programs that can be chosen
............................................................................................................................................... 152 Figure L.8: Run arrow on upper left of screen when in LabVIEW ............................................ 152 Figure L.9: Desired start conditions for the zero-calibration program ....................................... 152
Figure L.10: Example of a desired end condition (zerowindadjustment factor will vary with test
environment) ......................................................................................................................... 153 Figure L.11: Ringer setting for testing ........................................................................................ 153 Figure L.12: Define file path or choose a file by browsing ........................................................ 153 Figure L.13: Click this button to stop or start saving (currently not saving, light changes to
brighter green when saving) .................................................................................................. 154 Figure L.14: Use this button to stop the test program; it will not stop on its own...................... 154
Figure L.15: Excel warning message .......................................................................................... 154 Figure M.1: First calibration program to find zero wind correction factor ................................ 156
Figure M.2: Zero wind calibration factor program front panel .................................................. 157 Figure M.3: Second calibration program to find shift factor ...................................................... 158
Figure M.4: Shift factor calibration program front panel and ringer .......................................... 159 Figure M.5: Final test program for double calibration program ................................................. 160 Figure M.6: Final test program front panel for double calibration program .............................. 161
Figure N.1: DAQ box used with the system; wires insert into the side below screws ............... 162 Figure N.2: A) DAQ box ports with labels; B) Sensor with pins on left; C) Schematic of Rev C
sensor with labeled pins to corresponding DAQ box ports .................................................. 163
Figure N.3: Housing for the sensor ............................................................................................. 164
Figure N.4: Sensor in housing in mask ....................................................................................... 164 Figure N.5: Wall wart plugged into electrical outlet .................................................................. 164
Figure N.6: DAQ box connected to computer via USB ............................................................. 165 Figure N.7: A) Ringer used to choose which program is running; B) Programs that can be chosen
............................................................................................................................................... 165
Figure N.8: Run arrow on upper left of screen when in LabVIEW ............................................ 165 Figure N.9: Desired start conditions for the zero-calibration program ....................................... 165
Figure N.10: Example of a desired end condition (zerowindadjustment factor will vary with test
environment) ......................................................................................................................... 166 Figure N.11: Ringer setting for second calibration ..................................................................... 166 Figure N.12: Ringer setting for testing ....................................................................................... 166
Figure N.13: Define file path or choose a file by browsing ........................................................ 167 Figure N.14: Click this button to stop or start saving (currently not saving, light changes to
brighter green when saving) .................................................................................................. 167
Figure N.15: Use this button to stop the test program; it will not stop on its own ..................... 167 Figure N.16: Excel warning message ......................................................................................... 167 Figure O.1: Page 1 of 4 of horse owner survey .......................................................................... 169 Figure O.2: Page 2 of 4 of horse owner survey .......................................................................... 170

xix
Figure O.3: Page 3 of 4 of horse owner survey .......................................................................... 171
Figure O.4: Page 4 of 4 part 1 of horse owner survey ................................................................ 172 Figure O.5: Page 4 of 4 part 2 of horse owner survey ................................................................ 173
Figure P.1: Page 1 of 4 of veterinarian survey ............................................................................ 174 Figure P.2: Page 2 of 4 of veterinarian survey ............................................................................ 175 Figure P.3: Page 3 of 4 of veterinarian survey ............................................................................ 176 Figure P.4: Page 4 of 4 of veterinarian survey ............................................................................ 177 Figure Q.1: Horse owner response to having a horse with a respiratory disorder ...................... 178
Figure Q.2: Horse owner response of if their horse was tested for a respiratory disorder ......... 178 Figure Q.3: Gauging knowledge of horse owners on prevalence of respiratory disorders......... 178 Figure Q.4: How much horse owners are willing to pay for respiratory function ...................... 179 Figure Q.5: How far horse owners currently travel for care ....................................................... 179 Figure Q.6: How much horse owners believe they would pay for lung function testing ........... 179
Figure Q.7: How far horse owners will travel for lung function testing..................................... 180 Figure R.1: Displays how frequently equine vets see equine lung function disorders ............... 181
Figure R.2: Veterinarians that perform vs. Don’t perform equine lung function ....................... 181 Figure R.3: How frequently veterinarians perform equine lung function testing ....................... 182
Figure R.4: Veterinarians interest in purchasing a non-invasive equine lung function testing
device .................................................................................................................................... 182
Figure R.5: How much veterinarians are willing to spend on an equine lung function testing
device .................................................................................................................................... 182 Figure S.1: Veterinarian survey results from the Northeast ....................................................... 183
Figure S.2: Veterinarian survey results from the Southeast ....................................................... 184 Figure S.3: Veterinarian survey results from the Midwest ......................................................... 185
Figure S.4: Veterinarian survey results from the Southwest ...................................................... 186
Figure S.5: Veterinarian survey results from the West ............................................................... 187

xx
List of Tables
Table 2.1: Horses’ vs. Humans’ Respiratory System ..................................................................... 8 Table 2.2: Air-fluid patterns common in horses and what disorders they represent .................... 14
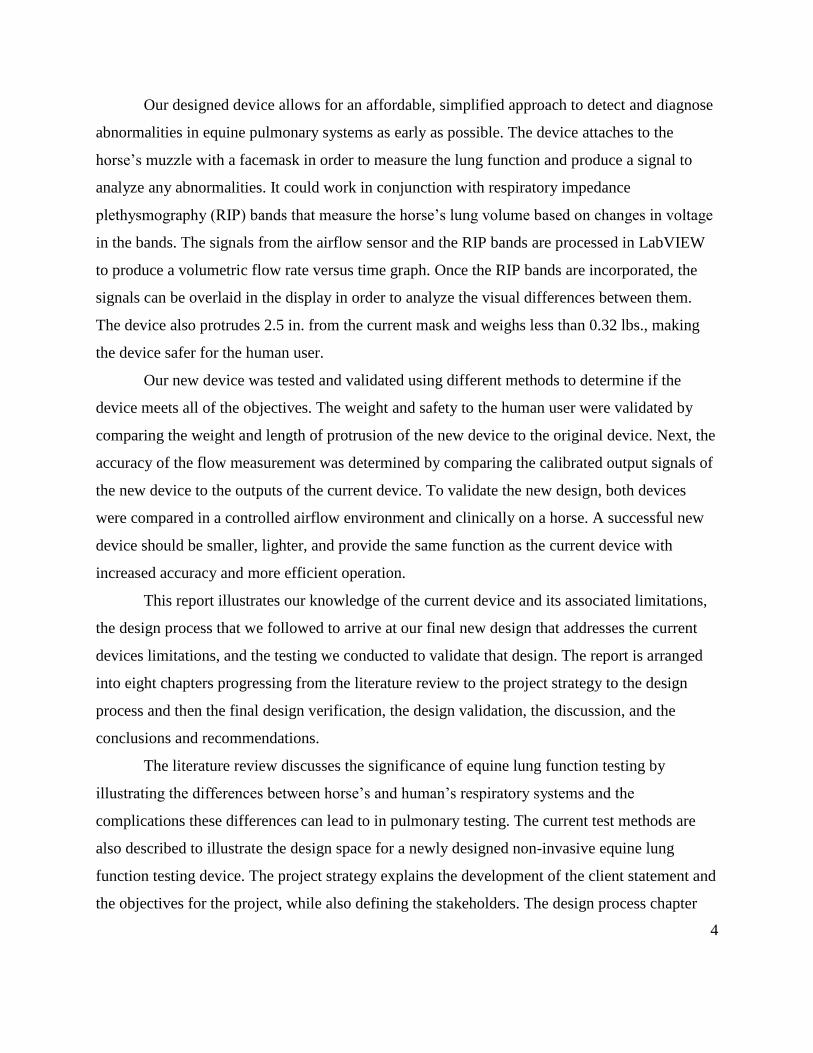
Table 2.3: Cells present in disorders ............................................................................................. 15 Table 2.4: Airway Reactivity based on Histamine ....................................................................... 19 Table 3.1: Summary of our design objectives. ............................................................................. 29 Table 3.2: Functions and means chart ........................................................................................... 33 Table 4.1: List of project objectives ............................................................................................. 42
Table 4.2: Objective rank comparison .......................................................................................... 43 Table 4.3: Pairwise objective comparison .................................................................................... 43 Table 4.4: Needs and wants .......................................................................................................... 44 Table 4.5: List of conceptual designs ........................................................................................... 45 Table 4.6: Pros and cons of the improved Fleisch pneumotachograph design ............................. 53
Table 4.7: Pros and cons of using a hot-wire anemometer in our lung function testing device. .. 56 Table 4.8: Pros and cons of the three-cup anemometer with tachometer design .......................... 60
Table 4.9: Pros and cons of hair-like structures on strain gauges ................................................. 63 Table 4.10: Design matrix of alternative designs ......................................................................... 64
Table B.1: Detailed MQP budget................................................................................................ 122

1
1.0 Introduction
Equine lung function disorders are a more common occurrence than one might expect. As
many as 80% of stabled horses can suffer from inflammatory airway disease due to the
environment in which they live (Cummings Veterinary Medical Center, 2016). A majority of
horses are housed in stables with poor air quality due to hay, dirt, and dust. Even sport horses
kept in athletic facilities experience pulmonary disorders, with at least 70% affected (Robinson,
2003). Horses are part of a well-established industry; the horse racing industry generates an
average of $1.2 million dollars from bets for each race in the United States (McManus, Albrecht,
& Graham 2013). Activities like horse racing, pulling, or driving rely heavily on a functional
respiratory system. This makes identifying and treating pulmonary disorders exceptionally
critical.
Veterinarians traditionally use two invasive methods to test an equine’s lung function.
The first is considered the conventional method, which uses an esophageal balloon to collect
pressure data in order to analyze muscle work, resistance, and lung volume. Once the analysis is
complete a disorder can be diagnosed. The second common method is a sampling method called
Bronchoalveolar Lavage (BAL). In this method, a sample of fluid is retrieved from the distal
airways and alveoli using an endoscope and is then prepared and analyzed to determine the
infection type. These procedures are highly invasive, time consuming, and cause stress for the
horse. Complex, invasive testing procedures are also expensive and often delayed until
symptoms are severe. Late diagnosis of respiratory disorders can lead to permanent damage of
the horse’s pulmonary tissue, making early diagnosis critical.
Dr. Melissa Mazan, a veterinarian at Cummings School of Veterinary Medicine at Tufts
University, specializes in equine lung function analysis. She currently performs lung function
testing with either a passive airflow device or a forced oscillatory mechanics (FOM) device that
both use a Fleisch pneumotachograph to measure lung pressure, flow, and volume. These
procedures are non-invasive and allow for the early detection of subclinical respiratory disorders.
The data collected is processed by a virtual interface, so signals can be analyzed for
abnormalities in the horse’s pulmonary function. Both devices were developed by her colleague,
Dr. Andrew Hoffman, another equine lung function expert at Cummings School of Veterinary
Medicine.

2
The passive device is used more frequently than the FOM device because it is simpler to
operate and can be used with horses of all ages. Whereas, the FOM device can only be used on
young racehorses and sport horses because older horses or severely affected horse’s breathing
rate too closely matches the frequency of the sine waves to be distinguishable. Although the
passive device has proven to be an effective testing mechanism, it poses some concerns that need
to be addressed. The Fleisch pneumotachograph used for the current device is no longer in
production, making it difficult to replace. The current device is also extremely expensive and has
limited accuracy. The Fleisch pneumotachograph itself cost $8,000 and can only be calibrated to
an accuracy of ± 3.33%. The remaining system components cost approximately $10,000
resulting in a total system cost of approximately $18,000 (Mazan, Personal Communication,
September 9, 2016). The current device is also heavy, approximately 3 lbs., and protrudes from
the horse’s muzzle, approximately 12 in., posing risk of injury to human operators. Head injuries
to the human operator occurred when horses swung their head while wearing the device. The
costs, risks, and inconveniences of using the device in the field makes the Fleisch
pneumotachograph inaccessible to other veterinarians. Thus, Cummings School of Veterinary
Medicine at Tufts is the only location in the Northeast that uses the Fleisch pneumotachograph
(Mazan, Personal Communication, September 9, 2016).
Our team was tasked with developing an improved, non-invasive, device to measure
equine lung function. Based on our sponsor’s needs, the device must be able to accurately
measure equine lung function (ideally calibrated to ± 0.33%), the device cannot require
compliant breathing or add resistance to the horse’s normal breathing, and lastly, the device must
minimize the risk for the human user. Some additional goals of our project are a lighter,
compatible with LabVIEW, and portable device that meets veterinary standards. Our sponsor
would also like our device to have a final cost of $1,000 or less. By having the device cost
$1,000, rather than the current $18,000, the market for the device increases because more
veterinarians would be able to afford the device. The device needs to be lighter and shorter to
remove the need to hold it during testing. This will also reduce the risk to the human user
because they will not need to stand near the horse’s swinging head while performing the test,
thus reducing the likelihood of direct physical injuries. Dr. Mazan would like the data collected
by the device to be processed with LabVIEW because Open Pleth, the current software program,

3
is difficult to use and LabVIEW allows output customization. A schematic that displays the
overall devices is shown in Figure 1.1A and Figure 1.1B. It summarizes the current devices
limitations that we hope to address with our new device.
A.
B.
Figure 1.1: A) Schematic of the two components of the current device on a horse, B) Fleisch
pneumotachograph current component with parts and limitations labeled
4
Our designed device allows for an affordable, simplified approach to detect and diagnose
abnormalities in equine pulmonary systems as early as possible. The device attaches to the
horse’s muzzle with a facemask in order to measure the lung function and produce a signal to
analyze any abnormalities. It could work in conjunction with respiratory impedance
plethysmography (RIP) bands that measure the horse’s lung volume based on changes in voltage
in the bands. The signals from the airflow sensor and the RIP bands are processed in LabVIEW
to produce a volumetric flow rate versus time graph. Once the RIP bands are incorporated, the
signals can be overlaid in the display in order to analyze the visual differences between them.
The device also protrudes 2.5 in. from the current mask and weighs less than 0.32 lbs., making
the device safer for the human user.
Our new device was tested and validated using different methods to determine if the
device meets all of the objectives. The weight and safety to the human user were validated by
comparing the weight and length of protrusion of the new device to the original device. Next, the
accuracy of the flow measurement was determined by comparing the calibrated output signals of
the new device to the outputs of the current device. To validate the new design, both devices
were compared in a controlled airflow environment and clinically on a horse. A successful new
device should be smaller, lighter, and provide the same function as the current device with
increased accuracy and more efficient operation.
This report illustrates our knowledge of the current device and its associated limitations,
the design process that we followed to arrive at our final new design that addresses the current
devices limitations, and the testing we conducted to validate that design. The report is arranged
into eight chapters progressing from the literature review to the project strategy to the design
process and then the final design verification, the design validation, the discussion, and the
conclusions and recommendations.
The literature review discusses the significance of equine lung function testing by
illustrating the differences between horse’s and human’s respiratory systems and the
complications these differences can lead to in pulmonary testing. The current test methods are
also described to illustrate the design space for a newly designed non-invasive equine lung
function testing device. The project strategy explains the development of the client statement and
the objectives for the project, while also defining the stakeholders. The design process chapter

5
discusses four alternative design ideas and the steps that were taken to choose our final design. A
final design was chosen based on a concept similar to hot-wire anemometry. The final design
verification chapter includes our raw data and results from calibrating and testing the final
design. The final design validation chapter explains attributes of our final design and the
objectives that it meets. The discussion chapter includes the significance of the project and
compares our final design to current methods. The conclusions and recommendations chapter
summarizes our successes and future work that still needs to be completed to improve upon the
design.

6
2.0 Literature Review
This literature review was written to give the reader an overview of the equine respiratory
system, the prevalence of equine respiratory disease, and the current testing methods available
for these diseases. There are many differences present between the respiratory system of horses
compared to humans, so the testing methods applied need to be different than those used for
humans. These differences and the methods for detecting disorders are explained in detail in this
chapter.
2.1 Equine respiratory system
The respiratory system’s, or pulmonary system’s, main purpose is to provide the pathway
into the body for air to transfer oxygen and carbon dioxide into and out of the blood respectively
(Davis, 2013; Marieb & Hoehn, 2012). The entire process of inhaling oxygen and exhaling
carbon dioxide is called respiration (Marieb & Hoehn, 2012). Airflow travels through the horse’s
pulmonary system first though the upper respiratory tract (URT) and then the lower respiratory
tract (LRT) (Davis, 2013; Crabbe, 2007). The URT consists of nostrils, nasal passages, the
pharynx, the larynx, and the trachea. The LRT consists of the structures in the lung including the
bronchi, bronchioles, and alveoli (Davis, 2013).
The inhaling of air begins at the start of the URT, the nostrils (Davis, 2013; The British
Horse Society, 2011; Crabbe, 2007). There are cartilage rings inside the opening of the nostrils
that can expand and allow for increased airflow, which is necessary during exercise (Crabbe,
2007). Air continues through the nostrils and nasal passages to the pharynx. The pharynx in a
horse has two purposes; to facilitate airflow to the larynx and to transport food to the esophagus
from the oral cavity (Davis, 2013; Crabbe, 2007). The soft palate separates the oral cavity from
the pharynx and only allows airflow through the oral cavity when the horse is swallowing
(Davis, 2013). The epiglottis also assists in keeping food from entering the larynx by separating
the trachea and esophagus. When air is flowing into the trachea the epiglottis blocks the
esophagus by lying flat over the esophagus. When the horse is swallowing food, the epiglottis
blocks the trachea using the same mechanism (Crabbe, 2007). Together the soft palate and
epiglottis cause horses to be obligatory nose breathers (Davis, 2013; Crabbe, 2007). Figure 2.1
shows airflow into the horse as it inhales. It clearly displays that the horse is an obligatory nose
breather because the soft palate’s location does not allow airflow from the mouth to the trachea.

7
Figure 2.1: Airflow into the horse during inspiration
As air flows through the trachea, it will leave the URT at body temperature and enter the
LRT through two bronchi (Davis, 2013; The British Horse Society, 2011; Crabbe, 2007). One
bronchi branch goes into the left lung and the other bronchi branch goes into the right lung.
However, the internal structures of the lungs are not completely divided, which results in a risk
of respiratory disease in both lungs (Crabbe, 2007). The two bronchi branches proceed to branch
further forming into bronchioles. At the end of the bronchioles are alveoli, also known as
alveolar sacs. In the alveoli, oxygen in the air diffuses into the pulmonary capillary circulation to
be absorbed by the blood and carbon dioxide diffuses into the alveoli (Davis, 2013; The British
Horse Society, 2011). This process of diffusing oxygen from the air into the blood is called
oxygen exchange (Raven & Rashmir-Raven, 1996). The carbon dioxide in the alveoli is then
exhaled out of the horse, which concludes one breath of airflow through the respiratory system
(Davis, 2013).
2.1.1 Respiratory system: horse versus human
The capacity of the respiratory system of a horse is drastically different than that of a
human. An average adult horse’s total lung capacity is around 50 L, with most of the capacity
due to the LRT (Raven & Rashmir-Raven, 1996). In comparison, the average adult human’s total
lung capacity is around 6 L (American Lung Association, 2016). A horse at rest can have a
respiratory rate, amount of air inspired during breathing, as high as 75 L/min with each breath
averaging approximately 7.5 L (Raven & Rashmir-Raven, 1996). A human at rest maintains a
respiratory rate of 7.5 L/min; the equivalent volume of one horse breath (Molecular Products
Ltd, n.d.; Raven & Rashmir-Raven, 1996). Horses running or galloping do not voluntarily

8
breathe, instead horses sync their stride to their respiratory rate. This means the horse’s
respiratory cycle is timed so it exhales as its hooves land because the forward force of landing
assists by forcibly pushing air out of the lungs. Therefore, adult horses drastically increase their
respiratory rates from rest at 75 L/min up to 1500 L/min while galloping (Raven & Rashmir-
Raven, 1996). A human under max exertion can only reach respiratory rates of 65 L/min and the
stride and respiratory rate of a human are not synched (Molecular Products Ltd, n.d.). The
differences between the horse’s and human’s respiratory system are summarized in Table 2.1.
The differences are important to understand when analyzing testing methods for lung function.
Table 2.1: Horses’ vs. Humans’ Respiratory System
Horses Humans
Breathing Method Obligatory nose breathers Nose and mouth breathers
Lung Capacity 50 L 6 L
Maximum Respiratory Rate 1500 L/min 65 L/min
Patient Type Non-compliant Compliant
To better illustrate the difference in airflow through the horse’s and human’s respiratory
system Figure 2.2 was created.
Figure 2.2: Comparison of airflow through a horse and a human
As seen in Figure 2.2 the human can breathe through both their nasal passages and their
mouth. This flow of air meets in the trachea and then flows into the lungs, but for the horse it can
only breathe through its nose because it's mouth does not connect to the trachea.

9
The horse’s and human’s respiratory systems may be different in terms of size and
physiology, but they have a variety of similar defense mechanisms to protect from disease. The
process of heating inspired air to body temperature filters large particles from entering the LRT
(Davis, 2013; The British Horse Society, 2011; Crabbe, 2007). Smaller particles, such as viruses,
bacteria, and dust, are able to bypass the heat filter and continue down the respiratory tract as far
as the alveoli (The British Horse Society, 2011). Most of the respiratory system has a protective
lining formed from secreted mucus that creates a liquid barrier (The British Horse Society,
2011). The protective mucus lining also supports millions of cilia, microscopic projections,
directed upward and away from the LRT. The cilia have two functions, one is to catch dust and
move the dust away from the LRT and toward the back of the throat (The British Horse Society,
2011; Crabbe, 2007). The other is to prepare the air before it enters the lungs (Crabbe, 2007).
Horses’ grazing posture of directing the head downwards naturally clears their airways.
However, even with the horse’s natural defense mechanisms, they are still susceptible to diseases
caused by bacteria, viruses, and inflammation from dust.
2.2 Respiratory disorders of horses
Equine respiratory disorders are more common than one may think. Horses can have a
number of disorders including recurrent airway obstruction, inflammatory airway disease, and
other less common disorders. It is often difficult to diagnose a specific disorder because it is
challenging to differentiate between them. Unlike with other animals, the symptoms and results
of specific tests do not lead to one specific diagnosis. Veterinarians have to stay up to date with
frequently changing disorder definitions. A correct diagnosis is also difficult because the
disorders are often subclinical, so the horse may suffer for extended periods of time before a test
is performed or a clinical level disorder is detected. Wrong diagnoses can be extremely serious
because different treatment methods are used for each disorder. Incorrect treatment can cause the
actual disorder to drastically worsen.
2.2.1 Recurrent airway obstruction (RAO)
Recurrent airway obstruction (RAO) is commonly seen in older horses that are
experiencing airway obstruction, inflammation, mucus accumulation, or tissue remodeling. RAO
is the most commonly diagnosed lower airway disease in horses and is very similar to
noneosinophilic asthma in humans. RAO is believed to be caused primarily by an allergic

10
reaction to inhaled molds. Many horses live in closed barns where hay is stored. It is very
common for this hay to produce a dusty and moldy living environment, which aggravates the
respiratory system of horses causing diseases such as RAO. The most common sign of RAO is
frequent labored breathing. Fortunately, RAO is completely reversible if diagnosed early and
correctly. The most common steps that can be taken to reverse the effects of RAO are to reduce
the dust in the horses living environment and administer a bronchodilator (Kutasi, Balogh, Lajos,
Nagy, & Szenci, 2011).
2.2.2 Inflammatory airway disease (IAD)
RAO and inflammatory airway disease (IAD) are very similar, but they can be
differentiated at the clinical level. IAD is a nonseptic inflammation of the lower airways that is
common in young sport horses and can be caused by many different factors. These factors can
include dust and mold spores in their living environment, immunological factors, and infectious
agents. If IAD is left undiagnosed and untreated it can progress into RAO. IAD is commonly left
untreated because most cases have subclinical symptoms that go unrecognized by the owner.
IAD is the most commonly diagnosed disorder in the racehorse and sport horse community and
is the second most diagnosed disorder for all horses behind RAO (Kutasi, et al., 2011).
2.2.3 Other disorders
It is much less common than RAO and IAD, but horses can get pulmonary disorders
caused by infections. These disorders can be caused by bacterial, viral, fungal, or parasitic
agents. Infections are typically seen in older horses that have been subjected to increased stresses
including long distance travel or strenuous exercise (Kutasi, et al., 2011).
Exercise-induced pulmonary hemorrhage is common in racehorses and sport horses, but
most commonly in racehorses who have to over exert themselves for short periods of time. This
most commonly occurs because of inflammation in the upper and lower airways that applies
excessive stress to the pulmonary circulatory system. These hemorrhages can be very serious and
should be treated immediately, but they do not have significant symptoms, so they often go
undetected for a long period of time. This is the second most common disorder diagnosed in
young racehorses after IAD. Lastly, it is very rare, but horses can be diagnosed with
granulomatous, neoplastic disease, or pneumonia (Kutasi, et al., 2011).

11
2.3 Diagnosing disorders
Veterinarians commonly encounter horses with lung function disorders. One of the first
tasks a veterinarian will complete is checking the contagious nature of the disorder. Horses often
live closely with other animals and the risk of any contagious infections spreading should be
minimized. A detailed history of the patient is often established. This helps the veterinarian learn
about potential causes of the disorder and the severity. The horse’s age, breed, sex, origin,
environment, herd or group history, vaccination, deworming, and medical history are all required
information the veterinarian will ask the client (Kutasi et al., 2011). These questions provide
insight into the potential causes behind any disorders. For example, a horse living in a barn
storing damp hay will be more susceptible to respiratory infections (Robinson, 2003). The
veterinarian will also inquire about any symptoms the horse might be displaying. These include:
● Cough
● Nasal and or ocular discharge
● Exercise intolerance
● Respiratory distress
● Sneezing
● Abnormal respiratory noise
● Elevated breathing rate
● Abnormal respiration pattern
● Depression
● Fever
● Anorexia
The veterinarian could also ask about previous medications used or other horses the
patient has been exposed to. Before any further testing, the condition of the horse will be
examined. This includes noting the manner of movement, demeanor, body condition, abdominal
movement, presence of nostril flare, and respiratory rate. Adult horses breathe 12-20 times per
minute, foals can be up to 40 times a minute (Katusi et al., 2011). The horse will be further
examined, looking at mucus membranes, any swelling, abnormal nasal discharge, signs of pain,
or swollen glands. A stethoscope is then used to see if any abnormal breathing sounds can be
heard. If a brown bag is placed over the horse’s nose, the horse has to breathe deeper and the
veterinarian can hear better. During the bag rebreathing exam, wheezes and crackles could be a
sign of an obstruction and tracheal rattling could be mucus accumulation in the lower airways.

12
Coughing while the bag is on or prolonged recovery time after the bag is removed are signs of a
respiratory disorder (Katusi et al, 2011). For IAD, oftentimes the blood chemistry is completely
normal, but accumulation of bacteria in the trachea could be a sign of the disease (Robinson,
2003). After understanding the horse’s past, further testing can be completed to determine if a
lung function disorder is present.
2.4 Pulmonary function tests
Pulmonary function tests (PFTs), or lung function tests, are tests employed to determine
the quality of the respiratory system’s performance (U.S. National Library of Medicine, 2015).
Most tests focus on measuring lung function through defining lung capacity, respiratory rate, and
proficiency of oxygen exchange to the blood (U.S. National Library of Medicine, 2015).
A diagnosis process for humans includes different PFTs to help determine the presence of
a pulmonary disorder. Often the first step is a physical examination with a stethoscope (Myers &
Bass, 2010). Doctors listen with a stethoscope for any abnormal respiratory sounds (Myers &
Bass, 2010; Yu, Tsai, Huang, & Lin, 2013). Wheezing, a sound commonly associated with
asthma, through a stethoscope produces a high-pitched whistling sound (Myers & Bass, 2010;
Yu, et al., 2013). When wheezing becomes severe enough, it is heard without a stethoscope
(Myers & Bass, 2010). However, wheezing can be mild to the point of only being recognized
when a person is instructed to forcibly exhale while a doctor listens with a stethoscope to hear
the whistling sound (Myers & Bass, 2010). Hearing wheezing through a stethoscope is not
enough to provide a diagnosis of asthma, instead other PFTs must be conducted to fully
determine the presence of asthma or other pulmonary disorders.
Spirometry is a common PFT to determine the presence of different lung diseases. It
measures the amount of air a person exhales and the speed of exhalation (U.S. National Library
of Medicine, 2015). This test is dependent on compliant breathing, a person’s ability to follow
directions to breath at a specific time with a certain amount of effort (U.S. National Library of
Medicine, 2015). Often spirometry is conducted with a person postured in a sitting position with
a mouthpiece to breathe in (U.S. National Library of Medicine, 2015).
Methacholine challenge tests use spirometry to determine lung function while breathing
in specific agents such as methacholine or histamine (American Thoracic Society, 2009). When
people with asthma breathe in methacholine, their airways begin to tighten and restrict breathing

13
in a measurable way (American Thoracic Society, 2009). The methacholine challenge test is
more useful in disproving a diagnosis of asthma because if a person’s airways do not tighten with
methacholine they cannot have asthma (Scope, Contraindications, & Training, 1999).
Spirometry and spirometry with methacholine challenge tests require compliant
breathing. Human infants and animals are unable to follow directions to provide maximum
exhalation (Rozanski & Hoffman, 1999). Tidal breathing flow-volume loops, a pulmonary
function test that does not require complaint breathing, was initially designed for human infants,
but was determined useful for pulmonary disorders in animals such as dogs and cats (Rozanski &
Hoffman, 1999). As the infant or animal breathes into this device, it measures respiratory rates
through a pneumotachograph with a pressure transducer (Rozanski & Hoffman, 1999). This
process takes several minutes because the flow-volume loops require time to appear consistent in
shape and there needs to be breathing patterns without crying, purring, or panting (Rozanski &
Hoffman, 1999).
As described in section 2.3, many other tests and questionnaires are completed before a
non-compliant animal is tested for a lung function disorder. Lung function testing is only
performed as a last resort if no other testing methods such as x-rays, heartworm, fecal, blood, and
urine tests did not provide a clear diagnosis (PetWave, 2015). Once all of these methods are
exhausted and a diagnosis is not identified, lung function testing is considered. Typically, lung
function testing is invasive, expensive, and has many limitations as described in section 2.5.
2.5 Equine pulmonary function tests
There are many different techniques for testing lung function in horses including
imaging, taking samples, laboratory diagnostic techniques, and newer methods that focus on the
actual breathing patterns of the horse. Each one of these techniques has different advantages and
disadvantages, so they are used in different situations.
2.5.1 Imaging
Imaging is typically used for horses that have clear symptoms of a pulmonary disorder.
Most of these techniques are invasive, but they can provide a proper diagnosis. The key imaging
techniques that are used currently include endoscopy, radiography, and thoracic ultrasonography.
Respiratory tract endoscopy is commonly used for diagnosing horses who are
experiencing abnormal nasal discharge, coughs, or poor performance during exercise. Endoscopy

14
allows for imaging of the upper respiratory tract and the proximal lower respiratory tract. This
procedure is performed by inserting an endoscope through the nares (nostrils) of the horse into
the upper respiratory system (Pusterla, Watson, & Wilson, 2006). RT Endoscopy is
advantageous because it provides an accurate diagnosis and it does not always require sedation,
but is disadvantageous because it is an invasive procedure (Kutasi, et al., 2011).
Radiography is another common imaging method used for diagnosing lung function
disorders in horses. Radiography is key to locating the cause of a disease because it identifies
fluid-air lines in the lung. This equipment is advantageous because it can image the small areas
of the lung including the paranasal sinuses, the guttural pouches, and the retropharyngeal area
that the other imaging technologies cannot access. A major disadvantage with radiography is that
it has very limited usage due to the fact that it is not readily available (Pusterla, et al., 2006).
When analyzing a horse using radiography veterinarians are looking for one of four
common patterns, which include the alveolar pattern, the interstitial pattern, the reticular pattern,
and the bronchial pattern. These are typical patterns to look for in any species when using
radiography, but unlike in other species, horses do not have one diagnosis that matches with each
distinct pattern. For horses, each pattern represents a range of possible diagnoses that often
overlap with each other. The major limitation of diagnosing by fluid-air line patterns is that the
most common pattern, the interstitial pattern, does not clearly define any specific disorders.
Table 2.2 illustrates the overlapping and ever changing definitions that veterinarians need to be
aware of when caring for a horse with a pulmonary disease.
Table 2.2: Air-fluid patterns common in horses and what disorders they represent
Pattern Disorders
Alveolar Pulmonary edema, hemorrhage, lung consolidation, or neoplastic infiltration
Interstitial Variety of diseases, has no clear definition of diagnosed disorders
Reticular Most common with viral, bacterial, and fungal infections
Also, present in horses with pulmonary edema, interstitial pneumonia, and
pulmonary fibrosis
Bronchial Bronchitis or bronchiolitis

15
Thoracic ultrasonography is more readily available than radiography, so it is used more
often especially if pleural effusion, pulmonary consolidation, pulmonary or mediastinal
abscesses, tumors or granulomata are being detected. The main limitations of ultrasonography
are the lengthy process to prepare the horse and the ease of doing something improperly. These
limitations combined can lead to an inefficient and frustrating test. Ultrasonography also has a
very limited number of disorders that it can diagnosis (Pusterla, et al., 2006).
2.5.2 Sampling
There are many sampling methods that can be used to diagnose equine respiratory
disorders. These diagnostic techniques include tracheal wash, bronchoalveolar lavage (BAL)
fluid cytology and culture, thoracentesis, and percutaneous lung biopsy. Similar to imaging, each
one of these techniques is invasive.
Tracheal washes can detect many different disorders by collecting a sample from the
distal trachea. This can be done using an endoscope or a percutaneous tracheal wash. The
percutaneous tracheal wash requires surgical skin preparation and has a risk of infection at the
insertion site, but if the sample needs to be cultivated for diagnosis, this method is required.
Endoscopy can acquire the sample, but it will be contaminated by the nasopharyngeal bacteria,
so it can only be used for cytological examination. Acute inflammation, bacterial pneumonia,
credence, fungal infections, viral infection, and nonsepetic inflammation can be detected with
this method of sampling. Table 2.3 below shows what cells are present during the different
disorders that can be diagnosed (Pusterla et al., 2006).
Table 2.3: Cells present in disorders
Disorder Cells Present
Acute inflammation Neutrophils
Bacterial pneumonia Neutrophils showing signs of degeneration
Credence Intracellular bacteria
Fungal infection Neutrophilic infiltration, large number of eosinophils and macrophages
Viral Infection Increase in lymphocytes and epithelial cell injury
Nonseptic inflammation Nondegenerative inflammatory cells with no evidence of etiologic agents

16
BAL is the most common sampling method used by veterinarians when testing for
diffuse inflammatory disorders in horses. In this method, an endoscope is used to retrieve a
sample of the fluid lining in the distal airways in the alveoli. This sample is then used in
cytological examination or quantitative culture techniques. Quantitative culture techniques must
be used so that contamination due to the nasopharyngeal bacteria can be ignored. The BAL
sample cell distribution is compared to a normal cell distribution to determine the disorder
(Pusterla et al., 2006). Veterinarians can use a similar method to diagnose the disease using the
cell types listed in Table 2.3.
Thoracentesis can be completed quickly and easily with very little equipment, so it is a
preferred method for many veterinarians. Once the sample is collected both culture and cytology
analyses can be conducted. Additionally, the odor, color, and consistency of the sample is
analyzed. A normal sample should be odorless, transparent, and slightly yellow. If the sample
taken does not appear normal then there is an abnormal cell present, which means that culture
and cytology examinations should be conducted. This sampling method can be used to easily and
quickly diagnose disorders such as; pulmonary abscesses, pneumonia, chronic obstructive lung
disease, pulmonary granulomata, equine infectious anemia, systemic mycosis, traumatic
penetration of the thorax, and primary and secondary thoracic neoplasms. There are a few risks
because it is an invasive procedure. These risks include the chance of pneumothorax, cardiac
puncture, intercostal artery or vein laceration, and patient collapse due to rapid removal of large
amounts of fluid. Although these results are very uncommon, they can occur, so this method is
typically only used if other diagnostic methods do not work (Pusterla et al., 2006).
The last sampling technique used is the percutaneous lung biopsy. This procedure is
extremely invasive and there are many complications that can be observed. These complications
include epistaxis, pulmonary hemorrhage, tachypnea, respiratory distress, pneumothorax,
collapse, and death. Since there is such a high risk for this procedure, it is typically a last resort
and is only used when all less invasive diagnostic methods have failed to provide an accurate
diagnosis. This procedure can be conducted in unsedated, standing horses, but it is much more
commonly done on a chemically restrained horse in the stock. To try to reduce the risk of the
complications, ultrasonographic evaluations are conducted before the procedure to map the
major organs to avoid puncture while accessing the desired location. The percutaneous lung

17
biopsy is typically used to diagnose diffuse lung disease or undetermined etiology (Pusterla et
al., 2006).
It is clear that sampling techniques allow for both sensitive and accurate results if
contamination is taken into account, but all of the sampling techniques are invasive and have a
risk of very serious complications, so veterinarians are trying to move towards less invasive
methods that are just as sensitive and accurate. They do have some special laboratory diagnostic
techniques that they can use, but they are only used for very specific disorders.
2.5.3 Special laboratory diagnostics
Special laboratory diagnostics are less commonly used than imaging and sampling, but
they can be used when trying to diagnose very specific disorders or when imaging and sampling
do not provide a clear diagnosis. The laboratory techniques commonly used with horses include
hematology, immunodiagnostic testing, and molecular diagnostics.
Hematology is a very sensitive and time dependent method of determining if the disorder
is infectious or noninfectious. This is determined by increases and decreases of cell types over
time, but the changes are very small unless it is a chronic infection, so it is very hard to
determine if the disorder is infectious from this analysis. It can be used to detect inflammation
quite accurately though because inflammation is dependent on plasma concentration, which is
easier to quantify than the small changes in the different cell types. Inflammation is present if
there is an increase in plasma concentration. Based on this, hematology is commonly only used
to determine if inflammation is present, but if records are kept well and the test is conducted very
cautiously, information on the infectious versus noninfectious nature of the disorder can be
determined (Pusterla et al., 2006).
Immunodiagnostic testing is a serologic test that is conducted to determine the presence
of specific antibodies. The antibodies present are detected by using either enzyme-linked
immunosorbent assay (ELISA), radioimmuno-assay, or immunofluorescence methods. This type
of testing can be used to determine the disease progression, detect if the patient is a carrier of a
disease, and to distinguish between vaccination, exposure, and disease. A limitation of this test is
the veterinarian needs to have a good understanding of what the results mean. A positive test can
mean an active disease, but it often does not. A negative result does not mean that the horse does
not have the disease. Veterinarians need a strong understanding of the sensitivity and specificity

18
of the test to interpret results correctly. Another limitation is the age of the horse can affect the
results. Since the test does not give clear results, it is difficult to use for accurate diagnoses and is
not reliably repeatable (Pusterla et al., 2006).
Lastly, molecular diagnostics can be used to diagnose infections caused by pathogens that
are difficult to cultivate. For this method, Polymerase Chain Reaction (PCR) is used to amplify
the sample and ELISA is used to determine if antigens are present. This method is still in the
development phase, but its applications have been increasing. For it to be widely used the ease of
use, safety, cost efficiency, sensitivity, reproducibility, and automation need to be improved. The
speed and reliability of molecular diagnostics are advantageous to other diagnostic methods, but
the limitations currently outweigh the positives. The test often produces false positives because
of PCR contamination. Once this is improved it will be more widely used.
These special laboratory diagnostic techniques are used primarily for infectious disease
diagnostics. Infectious disease only makes up a very small portion of all pulmonary disorders in
horses, so these methods are not used often, but if they are made easier and more reliable they
may be applied more frequently in the future to determine if a horse is suffering from an
infectious disease before testing for other disorders.
2.5.4 Additional methods
Many veterinarians have begun to use other less invasive methods for diagnosing equine
lung function disorders. Some of these additional methods have become the gold standard for
specific clinics. These methods can include conventional mechanics, flowmetric
plethysmography, histamine challenge, bronchodilator challenge, and forced oscillatory
mechanics.
The conventional mechanics method is considered the gold standard for lung function
testing, but it is an invasive method. In this method, a balloon-tipped esophageal catheter is
placed in the thoracic esophagus to measure the pleural pressure. This pleural pressure is
measured at the same time as the flow at the nostrils. The flow at the nostrils is measured with a
pneumotachograph. Software is used to find the resistance, dynamic compliance, and end
expiratory work from the measured airflow, pressure, and respiratory rate. One limitation of this
device is the invasiveness causes the horse to swallow frequently, causing pressure readings to
be inaccurate. It also has low sensitivity, making it difficult to detect small airway obstructions.
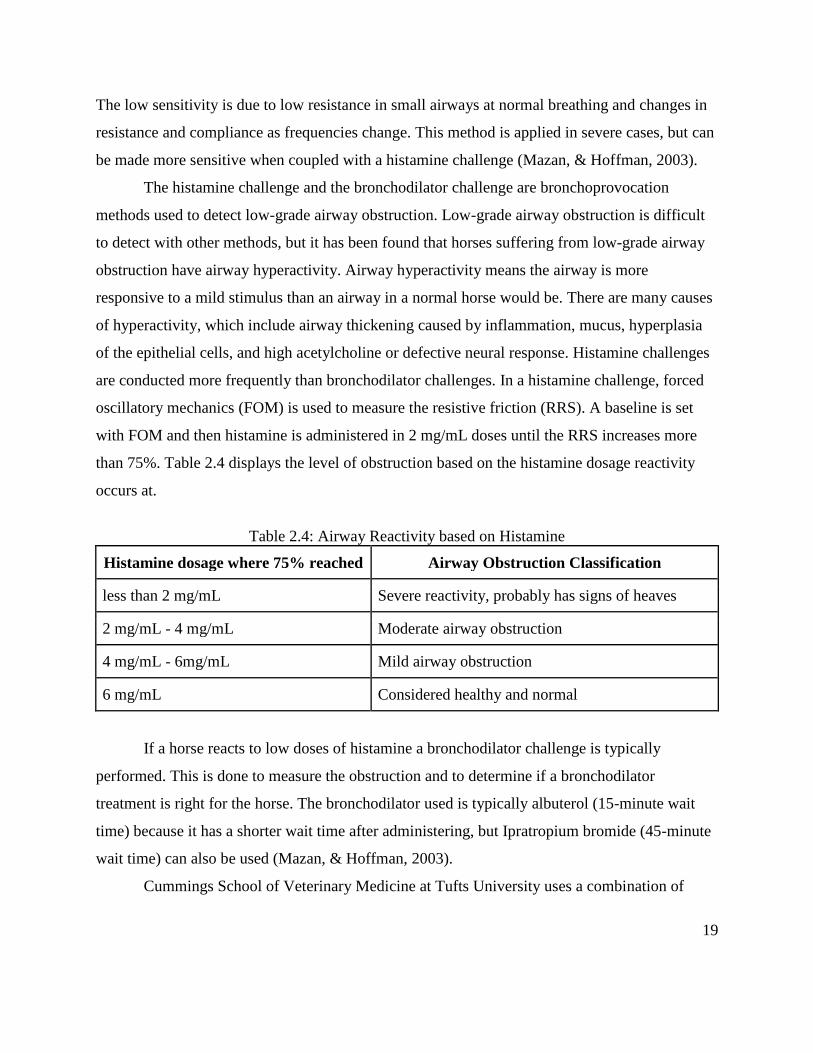
19
The low sensitivity is due to low resistance in small airways at normal breathing and changes in
resistance and compliance as frequencies change. This method is applied in severe cases, but can
be made more sensitive when coupled with a histamine challenge (Mazan, & Hoffman, 2003).
The histamine challenge and the bronchodilator challenge are bronchoprovocation
methods used to detect low-grade airway obstruction. Low-grade airway obstruction is difficult
to detect with other methods, but it has been found that horses suffering from low-grade airway
obstruction have airway hyperactivity. Airway hyperactivity means the airway is more
responsive to a mild stimulus than an airway in a normal horse would be. There are many causes
of hyperactivity, which include airway thickening caused by inflammation, mucus, hyperplasia
of the epithelial cells, and high acetylcholine or defective neural response. Histamine challenges
are conducted more frequently than bronchodilator challenges. In a histamine challenge, forced
oscillatory mechanics (FOM) is used to measure the resistive friction (RRS). A baseline is set
with FOM and then histamine is administered in 2 mg/mL doses until the RRS increases more
than 75%. Table 2.4 displays the level of obstruction based on the histamine dosage reactivity
occurs at.
Table 2.4: Airway Reactivity based on Histamine
Histamine dosage where 75% reached Airway Obstruction Classification
less than 2 mg/mL Severe reactivity, probably has signs of heaves
2 mg/mL - 4 mg/mL Moderate airway obstruction
4 mg/mL - 6mg/mL Mild airway obstruction
6 mg/mL Considered healthy and normal
If a horse reacts to low doses of histamine a bronchodilator challenge is typically
performed. This is done to measure the obstruction and to determine if a bronchodilator
treatment is right for the horse. The bronchodilator used is typically albuterol (15-minute wait
time) because it has a shorter wait time after administering, but Ipratropium bromide (45-minute
wait time) can also be used (Mazan, & Hoffman, 2003).
Cummings School of Veterinary Medicine at Tufts University uses a combination of

20
flowmetric plethysmography and a Fleisch Pneumotachograph to quantify obstructions
experienced by the horse. The benefit of this method is that it is a sensitive, non-invasive test
method that provides an accurate diagnosis. This method and a similar forced oscillatory
mechanics (FOM) method are described in significant detail in section 2.6.
2.6 Cummings School gold standard
Cummings School currently measures equine lung function with devices utilizing a
Fleisch pneumotachograph. This is a flowmeter that makes accurate, linear flow measurements.
The pneumotachograph is based off of Poiseuille's Law which states that under capillary
conditions in a rigid tube, the flow is proportional to the pressure lost per unit length. Figure 2.3
shows a Fleisch pneumotachograph device during testing and a schematic of the current device.
A.
B.
Figure 2.3: A) A horse being tested with the passive Fleisch pneumotachograph device, B) A
schematic of the current device and how it works

21
The arrows in 2.3 C represent the flow of air through the device. The red arrow
represents the warmed exhaled breath of the horse. The blue arrow represents the flow of the
room temperature into the horse as it inhales. Lastly, the orange arrows represent the flow of air
to the pressure transducer. Air flows to the pressure transducer from before and after the
capillary bed, so the pressure drop can be measured between these two locations. The
pneumotachograph is calibrated by using a 3 L syringe to force a known amount of air through
the system. The pressure loss, or difference in pressure between two points, creates a curve that
represents velocity of the air flowing (Vitalograph, 2016). Several capillary tubes are added to
prevent turbulent flow in the tube. A transducer is included in the device which collects a voltage
signal from the pressure drop and converts it to a visible signal that is displayed using a software,
Open Pleth, designed for the particular transducer used in the device. Along with the
pneumotachograph, RIP elastic bands are wrapped around the thorax and abdomen to collect
lung volume data as shown in Figure 2.4.
Figure 2.4: Placement of abdominal and thoracic RIP bands (Howell, 2011)

22
These bands are calibrated to the horse using the Fleisch pneumotachograph data and are
at a voltage of zero when not moving. The bands will increase in voltage as the horse’s body
expands during breathing. The data from the pneumotachograph and the bands are collected
simultaneously by a transducer, processed, and displayed on the same screen. The two signals
are then compared to diagnose pulmonary disorders (Hoffman, 2002). An example of graphs
used to diagnose disorders are shown in Figure 2.5, where the graph on top represents normal
lung function and the one below it represents abnormal lung function.
Figure 2.5: Examples of graphs used for diagnosis
The slight peak in the pneumotach flow in the lower image of Figure 2.5 represents a
lower respiratory obstruction. A series of graphs displaying the data of both the RIP bands and
the Fleisch pneumotachograph measurements are displayed in Figure 2.6.

23
Figure 2.6: Representative data from the RIP bands and the Fleisch pneumotachograph in Open
Pleth
The first graph is the voltage readings from the RIP bands. The second graph includes the
conversion of the voltage data to volumetric flow data for the RIP bands, red, overlaid with the
volumetric flow of the Fleisch pneumotachograph, green. The third graph is the difference
between the volumetric flow rate data of the Fleisch pneumotachograph and the RIP bands.
An advantage of the Fleisch pneumotachograph is the minimum resistance to the horse's
breathing during rest. This is beneficial because added resistance can result in less accurate
results and larger pressure swings. However, the Fleisch pneumotachograph still provides too
much resistance to breathing for a horse to use while exercising. Fleisch pneumotachographs are
also capable of displaying collected data as a graph with a linear output. This makes analyzing
the results and making diagnoses more efficient for the operator.
The device is attached to the horse using a facemask. For young horses or less affected
horses, FOM is used when collecting data to show how the air moves through the respiratory
system. From a compressed air tank, sinusoidal waves of air are directed into the horse’s nostrils
and through the system which also creates sinusoidal pressure waves. The natural fluctuations
from breathing are filtered out and the amplitudes of the FOM waves are analyzed as the lung
function (Hoffman & Mazan, 1999). The main output of FOM is impedance which is the ratio of
driving pressure to flow; the lesser the flow, the higher the impedance. Impedance signals will
change based on resistance, elastance, and inertance. Elastance tends to contribute to impedance
24
at low FOM frequencies, whereas, inertance dominates at higher frequencies. In between
frequencies is often solely resistance. There is also a revealing frequency value that can signify
lung function abnormalities. A horse’s normal revealing frequency is around 2.5 Hertz and will
increase if there are obstructions (Hoffman & Mazan, 1999). FOM is advantageous because
testing is not time consuming or invasive. Figure 2.7A shows the FOM device that Cummings
School of Veterinary Medicine uses and a Figure 2.7B is a schematic depicting how it works.
A.
B.
Figure 2.7: A) Cummings School of Veterinary Medicine FOM device, B) Schematic of FOM
method where sinusoidal air waves are forced through the pneumotachograph to the horse’s
respiratory system

25
If the horse is older or has a severe breathing disorder, the respiratory rate too closely
matches the FOM signals. In this case, a similar device is used without any added sinusoidal air.
The passive device can be used with healthy horses as well, but nebulized histamine is given to
the horse to restrict the airways and increase the flow velocity so that the acquired signal can be
read more clearly (M. Mazan, Personal Communication, September 30, 2016). This method is
the most commonly used at Cummings School.
The device does have some disadvantages. Some problems with the current setup is
saliva accumulating in the device, interfering with the working parts and altering the calibration,
imbalance of the flow transducer, and small amounts of added resistance from the
pneumotachograph (Hoffman, 2002). Another disadvantage with any signal collecting device is
the potential for noisy data. To determine which breaths to actually analyze, inclusion criteria
were developed by Dr. Andrew Hoffman to determine unusable data that is caused by things like
sniffing or coughing. For example, if FOM is used, the data will filter out frequencies that are not
between 5 and 30 Hz per minute, and inspiratory to expiratory volume ratios that are not between
0.7 - 1.3. Criteria can also be included that removes tidal volumes below 2 L and inspiratory
flows less than 1 L/sec. The criteria will not filter out every unusable data point and some is still
removed manually. The facemasks used on the horse can also cause irregular breathing and
pressure swings. The application of the facemask and the testing process also causes a lot of
anxiety for horses, often requiring sedation. A minimal amount of Xylazine must be used to
avoid affecting the horse’s tidal volume and ventilation (Hoffman, 2002).
2.7 Complications when dealing with horses
Horses are very large animals that can have behavioral problems such as crib biting,
weaving, chewing wood, box-walking, and various other aggressive behaviors (Moore, Millar,
Matsuda, & Buckley, 2003). Horses, when in human contact, can pose a serious threat due to
these aggressive behaviors. Any humans dealing with horses, regardless of experience, can
become victims of injuries such as bites and kicks because they can occur unexpectedly. Horse
bites can be very serious as muscle rupture, fat necrosis, and severe hematoma can result (Moore
et al., 2003). In a survey completed by 216 Swiss veterinarians, 75% of them were kicked by a
horse at least once every year (Hausberger, Roche, Henry, Visser, 2008). A horse’s instinctive
response to new stimuli is random movements. These movements typically include stepping

26
sideways, swinging its head, or moving backwards. Being under sedation is a new environment
for most horses, so they typically respond with these random unpredictable movements (McCall,
1990). This causes a dangerous situation for anyone in range of the horse’s head or the device
itself if it becomes a projectile during testing. Aside from their behavioral issues and
unpredictable nature, horses are non-compliant, and thus will not breathe when told to do so.
Therefore, invasive methods are more commonly used to measure lung function compared to
non-invasive methods.
2.8 Significance of developing devices for horses
Horses that live in the northern hemisphere are usually fed hay that is preserved in humid
environments during the summer (Robinson, Derksen, Olszewski, & Buechner-Maxwell, 1996).
Moisture levels exceeding 20% promote microbial activity in hay, and therefore dry winters do
not pose a concern in stimulating antigen growth (Knapp, Holt, & Lechtenberg, 1975). However,
in the winter, dust is a concern as it worsens respiratory conditions and diseases. Hay is usually
stored off the ground in stables in the winter, and over long periods, dust accumulates that can
affect the surrounding environment. The humidity in the summer causes antigens such as
thermophilic molds and actinomycetes to grow in the hay, and when horses breathe in these
antigens, neutrophils attack the lung causing an inflammatory response. Specifically, both
histamine levels in the bronchoalveolar lavage fluid and plasma levels of inflammatory
mediators are increased. Chronic obstructive pulmonary disease (COPD) is therefore caused by
the delayed hypersensitivity response that is caused from these antigens as the airways become
obstructed and exhibit nonspecific hyper responses. Additionally, mucus accumulates in the
airway, causing stabled horses to heave and cough (Robinson et al., 1996).
Equine lung function disorders are prevalent, as up to 80% of stable horses can be
suffering from inflammatory airway disease (IAD) (Cumming Veterinary Medical Center, 2016).
It is important to provide an early diagnosis and therapy treatment for young horses with IAD
because it can lead to coughing, heaving, or even permanent tissue damage, especially in
racehorses (Wood, Newton, Chanter, & Mumford, 2005). The performance levels of race horses
with pulmonary disorders, especially in younger horses, significantly decreases (Sanchez,
Couetil, Ward, & Clark, 2005). The race horsing industry is expensive, not only in the USA, but
worldwide. Additionally, equine veterinary care is also costly; performance racehorses require

27
annual care that costs approximately $500 to $1,400 per horse (Gordon, 2009). In the state of
Kentucky, the amount of money that is bet daily on horse races can rise up to $1.2 million, if not
higher, for a single race track. As of 2009, a tax of 3.5% was issued on horse races, and therefore
the government receives a significant revenue. Additionally, in 2010, Australian governments
earned more than $289 million due to a 4% tax placed on gambling turnovers (McManus,
Albrecht, & Graham 2013). Gambling turnover revenues are significant as they support
governments, the racing industry, and charities. For example, the Hong Kong Jockey Club
(HKJC), is a non-profit organization that donates a portion of their annual surplus to various
charities, such as ones that support Autism disorders, and community projects (McManus,
Albrecht, & Graham 2013). If horses are unable to perform at their best performance levels due
to pulmonary disorders, a significant amount of money will be lost in the horseracing industry.
2.9 Conclusion
IAD and other pulmonary disorders can greatly impact the performance and health of all horses.
Current diagnosis methods are complex, invasive, and expensive, making it challenging for horse
owners to receive adequate diagnosis and treatment for their horses suffering from subclinical
lung function disorders. The Cummings School of Veterinary Medicine at Tufts developed a
non-invasive method to test for lung function abnormalities. This device has proven to be
successful, but has some disadvantages as well. The device is heavy and protrudes far off the
face of the horse, causing a risk of injury to the operator. The device also uses a Fleisch
pneumotachograph component that is expensive and no longer produced. Our team was tasked
with developing an improved method of measuring lung function of horses. In the following
chapter, we discuss our design process to develop an improved method for measuring equine
lung function.

28
3.0 Project strategy
3.1 Initial client statement
After speaking with our sponsor, Dr. Mazan, and reviewing literature on the topic of
equine lung function testing, it was noted that lung function testing in horses is very difficult, and
that there is no universal gold standard in place. Cummings School of Veterinary Medicine at
Tufts’ gold standard is the passive airflow device incorporating a Fleisch pneumotachograph.
There are some concerns with this device including the risk to the human user, the cost, the
accuracy, and the resistance it adds to the horse’s normal breathing. Based on these concerns and
the need for accurate equine lung function testing equipment, it was determined that the overall
goal of the project was to develop a way to measure airflow in horses with inflammatory airway
disease or other subclinical pulmonary obstruction disorders in order to detect and develop a
treatment strategy in the early stages of the disease.
3.1.1 Stakeholders
The stakeholders of our project include equine patients that will be tested with the device,
their owners, our team, Dr. Mazan, and other veterinarians who will use the device. Because the
device will be directly used on horses, it is important that the device does not harm them. The
horses and their owners, the clients, will benefit from the device because it will allow for early
diagnosis of lung function disorders. When disorders are diagnosed early, treatment is often
more successful and less expensive. In addition to the horses and clients, the veterinarians that
will use the device are stakeholders. Dr. Mazan is the primary stakeholder because the device
was designed specifically around her needs, but other large animal veterinarians’ needs were also
important to keep in mind during the design process. The critical thing to keep in mind was that
many large animal veterinarians travel to their clients. Finally, our team is a stakeholder because
we designed the device to successfully meet the needs of our sponsor and were ultimately
responsible for its ability to meet her needs.
3.2 Technical design requirements
Our first task was determining the limitations of the current device. Figure 3.1 shows the
current device labelled with its identified limitations.

29
Figure 3.1: Limitations of the current device
With these limitations in mind we developed a list of objectives that we wanted our
design to meet. These objectives are explained in detail in the following section.
3.2.1 Objectives
Table 3.1 displays the objectives for our new lung function testing design. The rest of the
section explains the objectives in more detail.
Table 3.1: Summary of our design objectives.
Objective
Number
Objective Description
1 Accurately obtain lung function signals
2 Minimize resistance to horse’s breathing
3 Cannot require compliant breathing
4 Minimize risk for human user
5 Less expensive than current device
6 Compatible with LabVIEW
7 Portable
8 Meets veterinary standards

30
3.2.1.1 Accurately obtain equine lung function signals (± 0.33%)
Currently, calibration of the device relies on a three-liter calibration syringe that provides
a set volume. This is the standard way to calibrate an equine lung function testing device, but the
particular syringe used can only calibrate the device to an accuracy of ± 3.33%. Our sponsor
wanted an improved accuracy to better distinguish the signal differences between the flow rate
measured by the RIP bands and airflow measured by the sensor.
3.2.1.2 Minimize resistance to the horse’s breathing
Resistance causes inaccuracies in measurements and potentially results in discomfort for
the horse. Increased resistance caused by the device can limit the amount of airflow measured by
the sensors and therefore misrepresent the lung function of the horse. Also, if the resistance is
high enough to physically impede the horse’s ability to breathe, then the device would become
hazardous to the horse’s health. Dr. Mazan would like to perform tests while the horse is
exercising. This is not possible with the current device because it is cumbersome to use with a
moving horse and adds too much resistance, making it difficult for the horse to breathe. When
resistance is sufficiently minimized, the device can be used during exercise. Resistance can be
minimized by avoiding designs that create obstructions to airflow and/or block sensors from
gathering measurements.
3.2.1.3 Cannot require compliant breathing
Currently, lung function testing in humans requires the patient to follow directions of
when to forcibly exhale with maximum effort, which is considered compliant breathing. A horse
is unable to follow these directions; therefore, the device must acquire measurements of airflow
without compliant breathing.
3.2.1.4 Minimize risk for the human user
The current device is heavy, 3 lbs., and protrudes out from the horse’s facemask
approximately 12 in. This increases the risk to the human user because they need to be close to
the horse during testing to support the device and horses often shake their heads. There have
been documented cases of the current device causing harm to human users, such as concussion
and sutured head wounds. Dr. Mazan felt that the risk of harm was an important issue to address
with the new design of the device. Reducing this risk involved reducing the weight and the
length of the device. One way to reduce the weight was to use lighter materials for the internal

31
components. The housing of the new device consists of a softer, more flexible material that
reduces the risk of harm to the operator upon impact.
3.2.1.5 Less expensive than the current device preferably less than $1000
All the components required for the current device total $18,000. A less expensive device
that is able to accurately measure lung function increases its accessibility for veterinary clinics.
Dr. Mazan would like to standardize equine lung function testing, and in order to do that, small
traveling veterinarian practices need to be able to afford the equipment. Based on this, and our
available budget, it was determined that the newly designed device should cost no more than
$1,000.
3.2.1.6 Compatible with LabVIEW software
Cummings School of Veterinary Medicine at Tufts uses the current device in conjunction
with proprietary software that was designed for the transducer used in the system. The
proprietary software, Open Pleth, provides data and graphs obtained from the current device, but
the display is small and difficult to read. Our sponsor has access to LabVIEW software and is
interested in the idea of developing a way to process the data through LabVIEW. LabVIEW
allows more customization and provides an interface that is easier to understand. A clearer
interface makes it easier for Dr. Mazan to explain the process to her clients.
3.2.1.7 Portable
The limitations of the current device include a setup that requires a lab space and multiple
operators, making it difficult to be used in other locations, such as at a client’s home or at the
track. By creating a device that is able to be used onsite, access to lung function testing is
increased. The key to making the device portable involved making a small device that required
fewer operators.
3.2.1.8 Meets veterinary standards
The device was intended to be used on horses and should meet the veterinary standards
required for medical devices. It was imperative to consider the safety and well-being of the horse
when designing a device and conducting tests. Various standards exist in the medical device
industry to ensure human safety, so it was important to research any parallel standards for
veterinary medical devices.

32
3.2.2 Constraints
When developing a design to meet the objectives, there were many constraints that
needed to be taken into consideration. One of the largest constraints on this project was the
overall budget. Working within a budget of $1,000 limited what could be spent on prototyping
and testing. Other constraints considered when designing the device were the veterinary
standards for veterinary medical devices. Anything that is designed needs to meet these standards
for it to be applied in equine clinical tests. Working with horses was also a constraint because
they are large, non-compliant, and unpredictable animals which can cause a dangerous work
environment and can lead to many complications during device development. The horse cannot
give feedback on the device, so every component of the device needed to be tested to ensure
compatibility and comfort for the horse. An additional constraint was the time frame of the
project. A device needed to be designed, prototyped, tested, and validated in nine months. Lastly,
a constraint for this project was the physical location of the current device and where we
completed our design work on the device. Since Cummings School is the only location in the
North East that owns the Fleisch pneumotachograph and uses the device frequently for research
and clinical testing; the device had to stay on site at all times. The travel time between
Cummings School and Worcester Polytechnic Institute (WPI) had to be factored in for all
meetings and reduced the amount of time spent with the current device. In order to address these
constraints, we planned our purchases carefully and used a lot of resources available to us at
WPI. We researched veterinary standards ourselves and checked in frequently with our
veterinarian sponsor to ensure our ideas were compliant with any standards. In order to work
efficiently, we developed a timeline of different tasks and established deadlines. Several tasks
could be completed on campus for when traveling to Cummings School was not possible.
3.2.3 Functions and means
Our new design was divided into four functional blocks to help ensure that we met the
necessary objectives for our sponsor. Figure 3.2 displays the functional blocks we created. Table
3.2 elaborates on the functions given in Figure 3.2 by stating the different methods we
brainstormed that can be used to complete each function.

33
Figure 3.2: Functional blocks
Table 3.2: Functions and means chart
Functions Means
Calibrate Device
● 3 L syringe is the current lung function testing standard for calibrating
volume
○ Accurate to ± 3.33%
● Improve accuracy of syringe ± 0.33%
○ Could use linear encoder
● Have known flows to test with devices that measure flow rate directly
○ Use a calibrated flowmeter
○ Use a wind tunnel
Measure airflow
of horse’s breath
● Measuring pressure drop
○ Fleisch pneumotachograph
○ Lilly pneumotachograph
○ Venturi meter
● Measure temperature
○ Hot-wire anemometer
○ Silicon airflow sensor
● Measure RPMs
○ Three-cup anemometer with tachometer
● Measure deflection
○ Strain gauge
Display voltage
signals into a
readable display
● Graphical display
● Open Pleth software for equine lung function testing
● LabVIEW
● Arduino
● Transducers
Device exterior/
attachment to
horse
● Facemask
● Nose inserts
● Adjustable straps
● Consider pressure points of horses
Calibrate for accuracy
• Calibrate the device to make accurate readings for determining lung function
Acquiring lung function data
• Compare air speed measurements at the nose to flow rates calculated from the volume measured by RIP bands at the abdomen and thorax
Visually display results
• Create a visual comparison of the abdomen and thorax RIP band voltage signals and the airflow measurement signals using a software program
Development of device exterior
• Design an adjustable, lightweight fixture for the device that is safer for the human user and is compatible with the current facemask

34
The first functional block focuses on the calibration of the device. Having a method to
accurately calibrate the device is key to the device functioning accurately, so this was a critical
component of the project. The standard calibration device is a 3 L syringe. The syringe on the
market is $250-$400. Our team designed our own, inexpensive, calibration syringe using PVC
piping and an aluminum piston that is 4.07 L. For sensors that measure airflow directly, volume
will not suffice to calibrate the device. In this case, known flow rates must be used to create a
calibration curve. Handheld flowmeters or a wind tunnel can be used for this application.
The second block includes various measurements that could be collected from the horse
patient to measure their lung function. We had to choose a type of sensor to best collect these
measurements and determined airflow within the desired accuracy. Various sensors or methods
of measuring airflow directly or indirectly are given in Table 3.1 as the means for meeting the
airflow measurement function. To complete this functional block, it was determined which
sensors or combination of sensors would best measure the data we need. The advantages and
disadvantages of different device concepts are further analyzed throughout Chapter 4, where we
discuss the process used to determine our final design.
The visual display component of the design is the next block. This was done using
software to collect voltage signals from a transducer and display it on a virtual interface. There
ideally should be a linear relationship between the inputs and the voltage signals. It should also
be clear to understand so veterinarians can explain the testing process to their clients. LabVIEW
and Arduino are two options that can be used to acquire data from a sensor.
The fourth and final functional block is the device exterior. We wanted to design the
housing of our device to be adjustable so that it can be stable and comfortable when attached to
the horse. The material should minimize risk to the horse, the operator, and all personnel present
in the testing room. To minimize this risk, the housing should be lightweight, no more than 1.5
lbs., and not protrude more than 6 in. from the horse’s face. These dimensions decrease the size
of the device by 50%. We also considered how and where the device will attach, so that accurate
measurements can be made and to ensure comfort, particularly avoiding pressure points that may
irritate the horse if the device directly contacts them. The nose and lips are the most sensitive
areas on a horse's face, so when designing a mask, direct contact with these areas needs to be
avoided (Preuschoft, Witte, Recknagel, Bär, Lesch, & Wüthrich, 1999).

35
3.2.4 Specifications
Our design must meet certain specifications in order to provide accurate and useful data.
Currently, the device is calibrated with a 3 L syringe that provides an accuracy of ± 3.33%. Our
sponsor would like the new device to be calibrated to ± 0.33%, or the equivalent percentage of
error, if possible. Not all sensor types can be calibrated with only a known volume, so depending
on the sensor used, an alternative calibration technique will need to be determined. The device
must also measure volume measurements from the horse. A horse’s resting volume is
approximately 5 L. The resting flow rate of a horse is 60 L/min and the galloping flow rate is
1,500 L/min. The device must accommodate these parameters. The device must also convert the
collected measurements into a visible signal in order to analyze lung function. Visible signals
include flow/volume loops and breaths over time. The weight of the entire new device should be
less than the current device, which is approximately 3 lbs.
3.3 Design requirement standards and specifications
Different standards must be met for the design and operation of various components of
our device. This includes standards related to the biocompatibility, the flow output, and the use
of animals during testing.
The device design must consider the safety and comfort of the horses it will be used on.
The material should be nontoxic and not cause any allergic reactions. Also, the device cannot
prevent airflow in or out of the nose because horses are obligatory nose breathers. Methods to
research and evaluate the effects of different materials should be developed to ensure the device
meets the ISO 10993-2:2006 Biological Evaluation of Medical Devices standard (International
Organization of Standardization, n.d.). Ideally, the device should also be designed to meet the
ISO/IEC 17025:2005 standard for competence while calibrating in a laboratory setting, as well as
the ISO 7066 standard which provides procedures for designing calibration curves when
measuring flow rate. The standard also supplies ways for assessing the uncertainty in the
calibrations (International Organization of Standardization, n.d.). IEEE 2700-2014 provides a
framework for sensor performance, including units, conditions, and limits which should be
considered when choosing a sensor for our new design (IEEE, 2014).
Our device was designed to be used for testing with multiple horses, requiring proper
cleaning of the device. USP-NF 797 provides a procedure for properly sterilizing the device to

36
avoid the spread of infections (Pharmacopeia, U. S., 2014). The device was designed with this in
mind so that the shape and materials are able to be sterilized properly. There is also a standard to
be followed when administering drugs. To conduct lung function testing, the horse is often
sedated. USP-NF General Chapter 1151 outlines the recommended dosage and quality
requirements (Pharmacopeia, U. S., 2009). These standards are important to follow because an
overly sedated horse could cause inaccurate results during testing due to a change in breathing
pattern.
The device was designed specifically for horses. Testing this device on live horses
requires approval by the Institutional Animal Care and Use Committee (IACUC). According to
the American Veterinary Medical Association (AVMA), a Massachusetts law requires client
records to remain confidential unless the client releases the veterinary records of their animal
(American Veterinary Medical Association, 2015). This caused difficulty when trying to obtain
samples of data from client owned horses, compared to research horses. Also, although
veterinary medical device standards are not as comprehensive as human medical devices, the
U.S. Food and Drug Administration (FDA) has a guideline in the compliance policy guide
manual (CPG Section 607.100) addressing proper labeling and species designation to avoid
device misuse (U.S. Food and Drug Administration, 1995).
3.4 Revised client statement
After developing a better understanding of the project through meetings with Dr. Mazan
and researching the topics of equine lung function testing and the physiology of the equine
respiratory system, it was determined that the need for this device was more prevalent than one
may imagine. Due to the fact that up to 80% of horses can have a lung function disorder, there is
a need to be able to test horses for pulmonary disorders on a regular basis, especially since many
of the disorders are subclinical (Cumming Veterinary Medical Center, 2016). In result, the
overall goal of the project evolved to be: to develop an improved device to measure equine lung
function that can be used to detect abnormalities in airflow and diagnose horses with
inflammatory airway disease or other subclinical pulmonary obstruction disorders. This
improved goal placed our focus on developing a method to improve the airflow measurement
component of the device because this would resolve many of the concerns with the Fleisch
pneumotachograph.

37
3.5 Management approach
Our project approach was divided into three sections: identify, invent, and implement.
This approach ensured that we would meet the objectives determined from discussions with our
sponsor and properly follow the design process.
3.5.1 Identify
In the identify stage, the first step was to determine the need and significance of the
project. This included discussions with our sponsor, research about the prevalence of lung
function disorders in horses, and research into the benefits provided by the current device and
similar devices. Characterizing the current device provided insight into the specifications for
measuring lung function and limitations of the device that had to be improved upon. After this
research was completed and the current device was characterized, the need and the design space
for the new design was well-defined. Our project objectives were created and our constraints
were discussed.
3.5.2 Invent
From characterizing the current device, we determined specifications of what our new
design would need. We also designed a LabVIEW program to read and acquire data from our
new device. Before creating a LabVIEW program for the new device, we developed a LabVIEW
program to read in data from the current device. This allowed the team to test our understanding
of the current device and the signal processing necessary to create the expected visual data
output. Once a successful LabVIEW program was created for the current device, changes were
made to the base program to accommodate the new device.
Next, a list of brainstormed possible devices to measure equine lung function was created
based on research and a better understanding of the limitations of the existing device. These
ideas were then further narrowed down to four alternative designs. A CAD model or an assembly
for each of our alternative designs was created. Our final design was chosen based on research,
advisor input, feasibility studies, and feedback as discussed in Chapter 4. Lastly, the final design
was prototyped and tested.
Testing the different concepts is difficult because it is not practical to test each concept
on a horse. Using human test subjects can be used to test some aspects of horse breathing, but
humans cannot produce the volume or flow rates that a horse can produce, thus a testing

38
instrument needed to be designed that can accurately model a horse’s breathing. The gold
standard for calibrating and testing the Fleisch pneumotachograph is using a 3 L calibration
syringe. We decided to use a similar device to model a horse and test our concepts. We chose to
construct our own syringe because a 3 L calibration syringe can cost anywhere from $300-$500
depending on the manufacture and the desired accuracy. We used SolidWorks to design the
components of our syringe and then we created a final assembly to make sure that there was no
interference between parts when the piston was compressed and decompressed. Figure 3.3
displays an exploded view of the SolidWorks assembly.
Figure 3.3: Exploded view of the SolidWorks calibration syringe model
We used this model to create a bill of materials and purchase the required parts. We
specifically designed the syringe to use a standard PVC pipe size (4 in.-diameter) as the body
and a standard reducer coupling as the nozzle (4 in. to 2.5 in.), so these parts were easily
purchased at Lowes. The PVC piped purchased was 2 ft. in length. The only modification made
to these parts was the inside edge of the PVC pipe was chamfered using a handheld chamfering
tool and the internal surface was smoothed at the end where the piston was inserted. To
manufacture the piston, a 4 in.-diameter 6 in. long stock of aluminum was purchased. Following
the SolidWorks design, the piston was machined from the aluminum stock using a manual lathe.
The overall diameter was decreased to approximately 3.85 in. and the surface on both ends was
finished. O-ring grooves were then cut to accommodate 2-240 O-rings. Three O-ring grooves
were cut to provide an air-tight seal. A band saw was used to remove the excess 3-in. of length.
Lastly, a ¾ in. hole was drilled using the manual lathe and it was tapped, so that a wooden ¾ in.

39
dowel could be inserted as the handle. The handle was glued in place with gorilla glue. O-rings
were placed in the first and last O-ring grooves and the piston was coated in silicon vacuum
grease to guarantee a complete seal and also reduce the friction, thus allowing the piston to slide
easier. Figure 3.4A shows the disassembled final product and Figure 3.4B shows the assembled,
completely depressed syringe.
A. B.
Figure 3.4: A) Disassembled syringe with the body on the left and the piston and handle on the
right; B) Assembled and depressed syringe
The volume of our syringe was calculated by finding the volume of the body and
subtracting the volume of the piston. The volume was also measured by filling the syringe with
water and then measuring the volume of water. From both of these methods it was determined
that the volume of the syringe is 4.07 L.
3.5.3 Implementation
Before constructing and testing the new device, an analytical model was developed to
simulate lung function testing. LabVIEW was used to construct an interface that displays the
desired pressure and volume signals. The pressure drop that normally occurs across the
pneumotachograph in the current device can be set as an input to generate a sample output. This
helped us understand exactly what our device’s output should look like.
After making a model, our new device was calibrated, tested, and compared with the
model data. Once our experimental testing was determined to be accurate, the new device was
used in a clinical setting to measure equine lung function.
3.5.4 Management tools
The work breakdown structure (Figure 3.5) displays the objectives that the team
completed in order to create a successful project deliverable.

40
Figure 3.5: Work breakdown structure

41
In Figure 3.4 the completed tasks for each objective are clearly stated. The design phases
of the work breakdown include brainstorming and modeling solutions to meet our objectives. We
used materials that are durable, lightweight, biocompatible, and affordable, such as PVC and
rubber, similar to the current device. The exterior materials are soft and flexible to minimize risk
of injury to the horse and operators. Research was done on standards regarding veterinary
medical devices and procedures to ensure that the materials chosen were acceptable to use in this
application.
Our team developed Gantt Charts to manage the timeline of our tasks and milestones for
the project. Three Gantt Charts display the team’s tasks for each seven-week term (Appendix A).
For each task, a time frame was allotted for it to be completed and the percentage complete was
estimated and recorded at the end of each term.
3.5.5 Financial tools
Our team was supplied with a budget of $1,000. We managed our spending for the
duration of the project by keeping a detailed budget in an EXCEL spreadsheet. The budget was
organized based on project component or design. For example, all of the items used in our final
design were grouped together. We limited our spending by using resources available to us
already. When having to purchase items, we carefully considered the costs and benefits
beforehand and avoided buying excess items. A spreadsheet of our total spending is located in
Appendix B. Our final amount spent was $662.74 with $337.26 remaining.

42
4.0 Design process
4.1 Needs analysis
Our team was fortunate enough to be given a specific project statement from the
beginning. After meeting with our sponsor only a few times for clarification, the final objectives
for our new device design were developed. These objectives are displayed in Table 4.1 as a
reference. The objectives highlight what our new design must incorporate for it to be useful to
our sponsor. Some of our main focuses included minimizing risk of injury to the human users
and making the device more cost effective.
Table 4.1: List of project objectives
Objective # Objective Description
1 Accurately obtain lung function signals
2 Minimize resistance to horse’s breathing
3 Cannot require compliant breathing
4 Minimize risk for human user
5 Less expensive than current device
6 Compatible with LabVIEW
7 Portable
8 Meets veterinary standards
In order to determine which objectives were required for a successful design and which
were desires of our sponsor, the importance of each was ranked by both the team and our
sponsor. Table 4.2 shows each objective and its rankings for each party with an overall average.
The overall average of each objective was then used in a pairwise table (Table 4.3) to compare
the significance of the objective to each other.

43
Table 4.2: Objective rank comparison
Objective # 1 2 3 4 5 6 7 8
Team Rank 3 4 5 4 3 2 1 5
Sponsor Rank 5 5 5 5 4 3 5 5
Weight 4 4.5 5 4.5 3.5 2.5 3 5
Table 4.3: Pairwise objective comparison
Objective # 1 2 3 4 5 6 7 8 Total
1 -1 -1 -1 1 1 1 -1 -1
2 1 -1 0 1 1 1 -1 2
3 1 1 1 1 1 1 0 6
4 1 0 -1 1 1 1 -1 2
5 -1 -1 -1 -1 1 1 -1 -3
6 -1 -1 -1 -1 -1 -1 -1 -7
7 -1 -1 -1 -1 -1 1 -1 -5
8 1 1 0 1 1 1 1 6
After comparing our team’s rankings and our sponsor’s rankings, we were able to
determine which objectives were classified as needs and which were classified as wants. Table
4.4 separates the objectives into these two different categories.

44
Table 4.4: Needs and wants
Needs Wants
● Lighter than 1.5 lbs.
● Does not require compliant breathing
● Biocompatible
● Measures flow both ways
● Airflow and RIP band measurement
needs to be synced
● Non-invasive
● No more than 6” of protrusion
● Accuracy (± 0.33%)
● Cost (less than $1000)
● Compatible with both foals and horses
● Compatible with LabVIEW
● Portable
The main size constraints for the device are protrusion of no more than 6 in. and a weight
of no more than 1.5 lbs. These values were identified as a need because they will greatly reduce
the risk to the human user, by decreasing the overall size and weight of the device by at least
half.
4.2 Concept of designs and further testing
4.2.1 Concept map
The concept map displayed in Figure 4.1 was developed based on our brainstormed ideas.
This concept map displays the connection of different components of our final desired design
and potential solutions for measuring airflow either directly or indirectly. By developing a
concept map to organize our potential solutions, we were able to more easily identify the most
suitable design. The team brainstormed eight alternative device concepts which are listed in
Table 4.5.
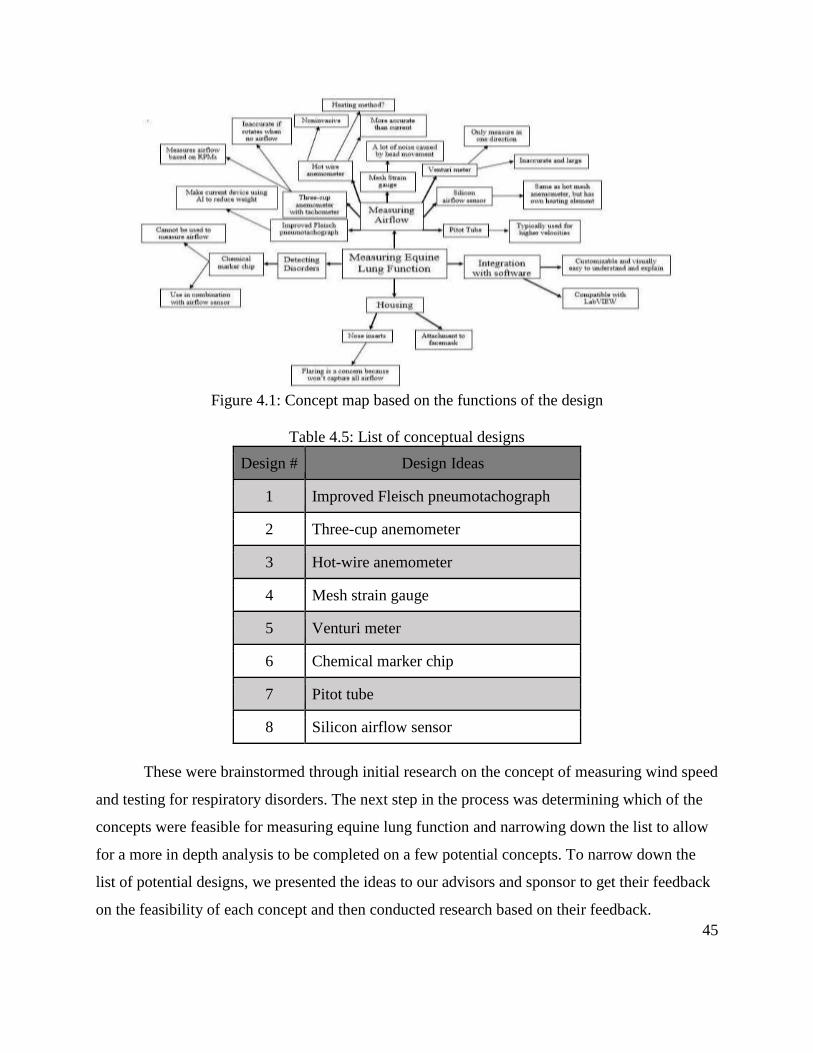
45
Figure 4.1: Concept map based on the functions of the design
Table 4.5: List of conceptual designs
Design # Design Ideas
1 Improved Fleisch pneumotachograph
2 Three-cup anemometer
3 Hot-wire anemometer
4 Mesh strain gauge
5 Venturi meter
6 Chemical marker chip
7 Pitot tube
8 Silicon airflow sensor
These were brainstormed through initial research on the concept of measuring wind speed
and testing for respiratory disorders. The next step in the process was determining which of the
concepts were feasible for measuring equine lung function and narrowing down the list to allow
for a more in depth analysis to be completed on a few potential concepts. To narrow down the
list of potential designs, we presented the ideas to our advisors and sponsor to get their feedback
on the feasibility of each concept and then conducted research based on their feedback.

46
4.2.2 Advisor feedback
Each concept was discussed with our advisors and they provided feedback based on their
knowledge of the method or sensors. The main concern with the first concept, the improved
Fleisch pneumotachograph, was the machinability of a bed of capillaries made from aluminum.
Our mechanical advisor suggested brazing small thin sheets of metal to create the capillary bed.
However, he cautioned that making an improved Fleisch pneumotachograph would be a
manufacturing project not a design project. Due to our limited machining knowledge, our
advisors believed it was impractical for us to machine (Robert Daniello, Personal
Communication, September 23, 2016).
The main concern our mechanical advisor had for the three-cup anemometer was the
accuracy. The turbine will have a delay in starting and stopping because of inertia and this delay
could produce inaccuracies when overlaying the RIP band data with the sensors. Overall, he
believed that the accuracy could be corrected with software and thus was not a major deterrent
from pursuing the design further (Robert Daniello, Personal Communication, September 23,
2016).
Our mechanical advisor agreed that the hot-wire anemometry would work, but he had
concerns about the varying moisture concentration between the flow in and out. He believed
using a calibration factor would account for the moisture content since all horses should have a
similar moisture concentration in their breath (Robert Daniello, Personal Communication,
September 23, 2016).
There were many concerns with the original idea of a mesh strain gauge. One concern
was the sensitivity of the strain gauge. Another potential concern was that the sensor would be
very fragile, which is not ideal for a device being used on a horse. Lastly, any temperature
changes or quick movements could convolute the signal causing a lot of noise that will make the
desired data difficult to analyze. Also, our mechanical advisor had many questions on the
fixation of the inert wire scaffold that the strain gauges would be mounted on. The fixation
method is key to reducing noise, but must not reduce the sensitivity of the gauge (Robert
Daniello, Personal Communication, September 23, 2016).
Through discussions with our mechanical advisor, we determined a venturi meter would
not work for this application. One issue with this concept is that venturi meters are typically
47
designed for larger pressure drops, which would not be sensitive enough to measure the pressure
drop caused by a horse breathing. Another concern is the potential high resistance to breathing
the venturi meter would cause for the horse. Venturi meters can only measure flow in one
direction and for this application we need to be able to measure the flow in both directions to
capture the horse’s inspiration and expiration. Lastly, there are major concerns about the size of
the venturi meters. Venturi meters are often quite large to increase their sensitivity, but since one
of the main goals of the project is to make the device smaller and safer, this method would not be
ideal (Robert Daniello, Personal Communication, September 23, 2016).
The major limitation of a chemical marker chip is that it needs to be used in combination
with another airflow measurement device because it detects chemicals in the air, not the flow
data that is desired (Robert Daniello, Personal Communication, September 23, 2016). It is also
very difficult to design, as it requires small scale circuitry and a chemical that can detect particles
that are characteristic of lung diseases. Another constraint of the chemical marker chip is that it
would not be sensitive to all pulmonary diseases, however, it will act as a verification for the
ones that it can detect (Marsha Rolle, Personal Communication, September 27, 2016).
A pitot tube works better for higher velocities and is frequently used for transient flow.
The velocity of a horse’s breath is significantly slower than the airflow over an airplane wing,
which is the typical use of a pitot tube. This will cause it to not be sensitive enough for the lower
velocity applications. Measuring laminar flow would be more ideal than measuring transient
flow because it has known equations and can be more easily processed. Our mechanical advisor
believes horses’ airflows can be simplified to laminar flow (Robert Daniello, Personal
Communication, September 23, 2016).
The silicon airflow sensor operates similar to hot-wire anemometry, as it measures
airflow using the change in temperature of a heated component. Discussions with our advisor
revealed that the silicon airflow sensor had potential as a concept because moisture did not affect
its measurements like hot-wire anemometers. The silicon airflow sensor, however, is very small
and could be too fragile for this application. The technology is also relatively new and sensors
are expensive with minimal options available to work with (Robert Daniello, Personal
Communication, September 23, 2016).

48
4.2.3 Literature and research
4.2.3.1 Improved Fleisch Pneumotachograph
After our mechanical advisor mentioned brazing metal being an option for producing an
improved Fleisch Pneumotachograph, we researched the different techniques to evaluate if they
were within our technical background. Each brazing technique follows the idea of welding metal
in the presence of a filler material. Torch brazing utilizes a torch that produces a steady flame to
heat the metal to the right temperature and is typically used for small volume pieces. The
capillary bed might be too large for the torch brazing technique and it requires operator skill,
which the team does not possess. Furnace brazing has a range from medium to large volume
pieces that are raised to high temperatures by convection. This technique does not require any
operator skill and would be sufficient for the capillary bed (Schwartz, 2003). However, the team
does not have access to a furnace which could braze.
4.2.3.2 Three-cup anemometer
To address our advisors concerns about the accuracy of this concept, we researched real
world applications of three-cup anemometers. Three-cup anemometers are commonly used as
reliable wind sensor instruments for weather stations, which indicates others were able to
overcome the accuracy issues. Through experimentation, researchers concluded that three-cup
anemometers can be simplified to a linear relationship between wind speed and revolutions as
well as follow mathematical models that account for the effect the mass has on the device
rotating faster or slower than the actual wind speed (Kristensen, Hansen, & Hansen, 2014; Saylor
Academy, 2011).
4.2.3.3 Hot-wire anemometry
The main concern determined for proceeding with the hot-wire anemometry concept was
the effect humidity can have on the sensing element. Standard practice for hot-wire anemometry
when used to measure air is to neglect the humidity's effect (Durst, Noppenberger, Stil, &
Venzke, 1996). Research shows that not incorporating humidity will result in an error in the
velocity reading of 1-5%. To adjust for humidity, there is a correction factor to Nusselts number
using Reynold’s number and temperatures as shown in Equation 4.1.

49
Nu = (0.24 + 0.56Re0.54)[Tf
Ta]0.17[1 + Ax + Bx2] (Eq. 4.1)
Despite humidity being the major concern of our mechanical advisor, the literature
illustrates that humidity is not a concern for hot-wire anemometry measurements and provides an
equation to correct for humidity. The literature provided the team with the ability to pursue this
design by addressing the major concern of our mechanical advisor.
4.2.3.4 Mesh strain gauge
After further research on the mesh strain gauge, it was determined that the mesh would
either need to be very stiff to reduce the fragileness of the material or it would need to be
adhered firmly to the walls of the housing. Both of these solutions will decrease the sensitivity
making it harder to read the small changes the horse’s breath will cause. Without making the
mesh stiffer, the device will be too fragile and there will be a lot of noise in the readings. While
researching this concept, another similar concept was found that was not as fragile, so it would
be better for our application. This new design concept was strain gauges on hair like structures.
This design has been used in the past to measure low wind speeds and is based on a biological
function of some insect hair that is used to determine wind speed (Ozaki, Ohyama, Yasuda, &
Shimoyama, 2000). Another concern with strain gauges in general were also uncovered during
our literature review, such as the effects of temperature and creep on the readings. Because a
horse breath is at a different temperature than the ambient air, the effect of temperature may be a
major concern. However, it can be calibrated for. Other than the temperature concern, the strain
gauges on hair like structures are a viable design that will be analyzed further (Omega, n.d.).
4.2.3.5 Venturi meter
The Venturi meter was determined to not be a feasible option for this project after
speaking with our advisor and no further research was conducted. The Venturi meter would be
too large to use on a horse and the application of the meter would not be stable enough to obtain
accurate results.
4.2.3.6 Chemical marker chip
A chemical marker chip must comprise of two main components, which are a sensor that
can detect the desired analyte and a reader that can interpret the results. One drawback of a
chemical marker chip is that multiple tests must be performed if quantitative data is desired.

50
Running a lung function test multiple times is not optimal. Also, to interpret the results, a visual
feedback system is required which is often difficult to read. On the other hand, binary data is not
as difficult to acquire and interpret, however, the severity of a certain disease cannot be
determined using this method (Erickson et al., 2014). Therefore, a chemical marker chip can
verify that a horse has a pulmonary disease, but it cannot distinguish the severity of the disease.
Also, with the chemical marker chip, flow data cannot be determined, and an alternative airflow
measurement device is needed in conjunction with the chip.
4.2.3.7 Pitot tubes
After researching the applications and functions of pitot tubes, the team determined that
laminar fluids are difficult to measure with pitot tubes. This is because a Reynold’s number of
greater than 3,150 is necessary to measure flow, and at this point the flow is turbulent. For low
Reynold’s numbers, pitot tubes require correction factors (Bailey et al., 2013). Also, pitot tubes
are ideal for measuring high velocities, like the wind speed over an airplane wing, which are
much greater than that of a horse’s breath. A device that measures pressure must be attached to
the pitot tube, typically a manometer. For low velocity airflows, using a manometer to measure
pressure drop can create inaccurate readings by the human user. Additionally, smaller pressure
measurement devices such as a hot-wire are more ideal to work in conjunction with the pitot
tube.
4.2.3.8 Silicon airflow sensor
It was believed that a silicon airflow sensor functions similarly to a hot-wire anemometer,
but its readings are not affected by moisture, making it more ideal. However, we learned that
humidity does not have the effect it does on the hot-wire anemometer because it is adjusted for
using a correction factor. This correction factor removes the concerns with the humidity of the
horse’s breath (Durst, Noppenberger, Stil, & Venzke, 1996). The silicon airflow sensor is more
expensive, and has a limited sensor selection compared to a hot-wire anemometer. Additionally,
silicon airflow sensors are a newer technology, posing a concern that it may be difficult to
operate. With these drawbacks, we decided to conduct further research on our original hot-wire
anemometer idea and rule out the silicon airflow sensor from our final design considerations.

51
4.2.4 Final alternative design selection
After conducting further research and speaking with our advisors, we narrowed down the
eight design ideas to the four most feasible: the improved Fleisch pneumotachograph, the three-
cup anemometer, the hot-wire anemometer, and the strain gauges on hair-like structures. These
four alternative designs were then further analyzed regarding our project objectives.
4.2.5 Predictive models
Different models were used as an initial method to test and analyze our design concepts.
We first created a LabVIEW program to model the software used for the current device. Data
was collected from the current software, Open Pleth, and loaded into the LabVIEW program we
developed. This was done to better understand how the current device collects and processes data
from the pneumotachograph and RIP bands.
Next, we completed flow simulations in SolidWorks for each of the four chosen
concepts. These were done using the flow simulation add-in in SolidWorks 2016. After each
model was created using SolidWorks, it was opened with the flow simulation add-in. As we went
through the setup wizard, each model was setup using internal, laminar flow of air with an inlet
flow rate of 65 L/min, the average resting flow rate of a horse. Initial boundary conditions were
then set for each model. The inlet flow rate was set to 65 L/min and the static pressure was set to
standard pressure of 101 Pa. The flow calculations were then completed and velocity and
pressure cut plots were made from each model.
4.3 Alternative designs
After reviewing the original eight concepts, we narrowed down our design concepts to
the four most feasible for measuring equine lung function. These ideas are discussed in more
detail in this section.
4.3.1 Improved Fleisch pneumotachograph
An alternative Fleisch pneumotachograph model could be designed using lighter and less
expensive material compared to the original model. Aluminum capillary tubes could be used to
mimic the stainless-steel capillary bed of the original Fleisch pneumotachograph, as they can
align on top of one another inside plastic tubing that will act as a casing. This design will
minimize resistance to the horse’s breathing if the capillary tubes are aligned precisely. The
diameters of the aluminum capillary tubes should be between 2.2-5.0 mm and their wall

52
thicknesses should be between 0.2-2.5 mm. Grades 1050, 1060, 1070, or 3003 of aluminum can
be used. The material of the plastic tubing can either be polypropylene, polycarbonate,
polyurethane, polyethylene, or polyvinyl. Compared to stainless-steel, aluminum is much lighter
as its density is between 156-181 lb./ft3 compared to 474-506 lb./ft3 of stainless-steel (Granta
Design Limited, 2016).
Using a different material than the original model is advantageous because it makes the
device lighter and shorter thus reducing the risk of injury to the operator. The aluminum capillary
tubes can be brazed in place to prevent dislocation. They should be cut into 1.5 in. lengths, to
mimic the length of the original pneumotachograph device, and be placed inside a 3-in. plastic
tube. When the capillary tubes are aligned on top of one another, they will create circular and
triangular tubes (Figure 4.2), resulting in a more accurate pressure drop.
Figure 4.2: SolidWorks model of an improved Fleisch pneumotachograph
However, if the capillary tubes are placed compactly with no spaces in-between them, the
pressure drop will be exceptionally high thus increasing the resistance to the horse’s breathing.
After counting how many of each tube type is present in the system, the pressure drops for each
tube were calculated. The pressure drop across the circular tube was calculated using Equations
4.2 and 4.3 (Young, Munson, Okiishi, & Huebsch, 2011). The number of tubes were multiplied
by their corresponding pressure drops and added together to get a final pressure drop reading
across the device.

53
Q =ΠR2vc
2(Eq. 4.2)
Q is the flow rate
Vc is the maximum velocity
R is the radius
Q =ΠD4ΔP
128μl(Eq. 4.3)
Q is the flow rate
D is the diameter
ΔP is the pressure drop
l is the length
This device could be incorporated inside a longer piece of tubing that attaches to a
facemask. A 3 L calibration syringe could be used to calibrate the device and to accurately obtain
lung function signals from equine patients. Similar to the current model, this device can connect
to a pressure transducer that will relay the collected data into LabVIEW Software. The pressure
transducer will reside in a data acquisition box (DAQ box). Additionally, this device can be used
onsite, however, it must be connected to a computer to display the data. With this improved
Fleisch pneumotachograph, fluid can flow in two directions, and the device is compatible with
passive breathing. In regards to the price, this improved pneumotachograph would be less
expensive than the current device because aluminum is less expensive than stainless-steel. Table
4.6 highlights the pros and cons of this improved Fleisch pneumotachograph design. This design
would meet veterinary standards if biocompatible materials are used for the connection to the
horse’s muzzle and proper sterilization procedures are followed.
Table 4.6: Pros and cons of the improved Fleisch pneumotachograph design
Improved Fleisch Pneumotachograph
Pros Cons
● Lightweight
● Less expensive than original model
● Linear relationship
● Pressure drop can be inaccurate if not properly
constructed
● Limited strength
● Tedious construction

54
4.3.2 Hot-wire anemometry
Hot-wires are a type of anemometer that measures the flow of a gas or liquid. Hot-wires
are often used in internal combustion engines or industrial process control applications, making
them affordable and easy to acquire. The sensor will determine the flow velocity by measuring
the rate at which heat is removed from the wire by the flowing fluid. Equation 4.4 shows the
governing equation of hot-wires. E is the thermal energy stored in the wire which is expressed in
Equation 4.5. W is the power generated from heating in joules given by Equation 4.6. H is the
heat transferred to the surroundings determined by using an energy balance of the convection to
the fluid, conduction to the supports, and radiation to the surroundings (Funda, 2010). The
electrical energy needed to maintain the wire’s temperature is proportional to gas flow which can
then be displayed as a voltage signal (Shiner & Steier, 2012). The signal could then be displayed
using a software like LabVIEW.
dE
dt= W − H (Eq. 4.4)
E is the thermal energy stored in wire
W is the power supplied to the wire
H is the heat transferred to surroundings
E = CwT (Eq. 4.5)
Cw is the heat capacity of wire
T is the temperature.
W = I2Rw (Eq. 4.6)
I is the current
Rw is the resistance of hot-wire which is temperature dependent
Hot-wire anemometers can be wires, meshes, or films; wires are often made of platinum,
but tungsten, glass tubes, silicon films, and quartz wires can also be used. The material used
should have a high temperature coefficient of resistance to increase sensitivity to velocity
variations and an electrical resistance low enough that the wire can heat up at a reasonable
voltage and current level. The material should also be strong enough to withstand stresses from
flow velocities (Funda, 2010).
There are constant current and constant temperature hot-wire anemometers. Constant
temperature hot-wires are used more frequently because they are an accepted standard, are easier

55
to use, and produce lower noise (Funda, 2010). Figure 4.3 shows the basic circuit used when
building a constant temperature hot-wire anemometer. The circuit design utilizes a Wheatstone
bridge to determine an unknown resistance. R1 and R2 are fixed resistors, R3 is a variable
resistor, and Rw is the hot-wire. Rw completes the bridge and is a function of temperature. R3
adjusts to the Rw starting point. As airflows over Rw, the temperature, and therefore the
resistance, change. The flow generates a voltage difference between points 1 and 2 which is
recognized by the amplifier. The amplifier then adjusts the feedback current to keep the wire
temperature and resistance constant by rebalancing the bridge (Advanced Thermal Solutions
Inc., 2007). Over the years many advancements have been made to hot-wire anemometry. The
sensors are reliable, sensitive, have a fast response time, and can even be made on a miniature
scale to measure single point flow measurements (Chen, Wang, Zhang, Chen, & Chen, 2012).
Figure 4.3: Basic hot-wire anemometry circuit including a Wheatstone bridge (Advanced
Thermal Solutions Inc., 2007).
Hot-wire anemometry has potential to be used for lung function testing because of its
accuracy and reliability. In addition, the fluid can flow both ways through a hot-wire system with
two wires installed in series (Kramme & Schlegelmilch, 2011). The sensor would also work with
passive, non-compliant breathing and has low noise levels. Hot-wire anemometry has been
successfully used in measuring infant lung function; the Florian neonatal respiratory function
monitor (RFM) is the most common hot-wire anemometry device used for lung function testing

56
which has an accuracy of ± 8% (Verbeek, Zanten, Vonderen, Kitchen, Hooper, & Pas, 2016).
Horses would require an even less sensitive sensor because their expiratory flow rates are larger
than an infant's. Hot-wires also exhibit less resistance during lung function testing than
pneumotachographs since they are smaller devices that can be placed in open tubes rather than a
tube divided into many tiny capillaries (Araujo, Freire, Silva, Oliveira, & Jaguaribe, 2004).
Figure 4.4 shows a basic design of a hot-wire anemometer that could be used for a lung function
testing device.
Figure 4.4: Basic schematic of a hot-wire anemometer device.
A smaller sensing element would result in a lighter and more compact lung function
testing device, allowing easier attachment to the horse and minimizing the risk to the operator.
Additionally, hot-wire anemometers are able to meet calibration and flow standards when
calibrated using known flow rates, as well as be housed in an exterior made of biocompatible
materials. Table 4.7 includes a summary of the pros and cons of using a hot-wire anemometer for
our new lung function testing device.
Table 4.7: Pros and cons of using a hot-wire anemometer in our lung function testing device.
Hot-Wire Anemometer
Pros Cons
● High accuracy
● Sensitive to rapid changes in velocity
● Minimal resistance
● Small/ lightweight
● Air can flow both ways
● Sensitive to contaminants and moisture
● Complex circuitry
● Difficult to clean

57
4.3.3 Three-cup anemometer with tachometer
An alternative design to the current device with a Fleisch pneumotachograph is a three-
cup anemometer with a tachometer. This type of anemometer is a common wind speed
measurement instrument, particularly in weather stations (Kristensen, et al., 2014; Saylor
Academy, 2011). Having the anemometer consist of three hemispherical cups allows the design
to respond more quickly to wind speed changes compared to the four-cup design (Kristensen, et
al., 2014). For the project, the main focus of this design is to measure airflow more directly by
measuring the revolutions per minute (RPM) rather than indirectly, such as the current device
with a pressure drop. Airflow in this design is meant to move the three hemispherical cups of the
three-cup anemometer at the same speed as the airflow, which describes a linear relationship
between airflow speed and the hemispherical cups rotational speed (Saylor Academy, 2011). The
tachometer sends a signal that reflects off of the reflective tape on one of the hemispherical cups.
The tachometer senses when the signal is sent back from the reflective tape, which is equivalent
to one revolution, and has a timing module to sense elapsed time to produce the display of RPM.
The three-cup anemometer with tachometer accomplishes the objectives set by our
sponsor in a different way than other alternative designs. There is a potential that the
tachometer’s accuracy will not be within the desired ± 0.33%. However, because the accuracy
objective is not weighted as a requirement, it does not disqualify the design from consideration.
There is the potential for the three-cup anemometer hemispherical cups to continue moving due
to inertia caused by their mass rather than to the airflow, which would cause inaccurate readings
of airflow. This phenomenon is commonly referred to as overspeeding; moves faster than the
actual wind speed (Kristensen, et al., 2014). Also, based on the angle of the hemispherical cups,
the anemometer can underspeed. Underspeeding is when there is a delayed reaction to the
change in wind speed, which causes the hemispherical cups to move slower than the actual wind
speed. However, a three-cup anemometer more easily overspeeds due to an increase than a
decrease in wind speed (Eq. 4.7; Kristensen, et al., 2014).

58
K+(U − rS) > K−(U + rS) (Eq 4.7)
S = angular velocity
r = rotor radius
U = wind speed
K+= Cup(s) experiencing acceleration
K−= Cup(s) experiencing deceleration
There are equations that account for the three-cup anemometer overspeed and underspeed
bias (Kristensen, et al., 2014). Due to the size of the three-cup anemometer, the design as a
whole is expected to offer minimal resistance to the horse’s breathing. A CAD model of the
three-cup anemometer is seen in Figure 4.5.
Figure 4.5: SolidWorks model of the three-cup anemometer component of the design
The three-cup anemometer moves in response to any airflow force and therefore is
compatible with passive breathing. This means that the design does not require compliant
breathing. Part of the intent with the design is to minimize the risk for the human user. This
objective is satisfied by the three-cup anemometer with tachometer design because the housing is
a 5-in. diameter by 4 in. length pipe, which protrudes less than the current device. The diameter
of the housing makes the design not compatible with the current horse facemasks. The
SolidWorks model of the housing can be seen in Figure 4.6.

59
Figure 4.6: SolidWorks model of the housing for the three-cup anemometer design
Material selection can also reduce the risk to the human user by incorporating lighter
materials such as, aluminum or polycarbonate (PC), for the three-cup anemometer component
(Granta Design Limited, 2016). To compare, the current device weighs 3 lbs. The cost of all the
materials for the three-cup anemometer with tachometer is within the budget and satisfies being
less expensive than the current device. This design can be compatible with LabVIEW if the
tachometer has an encoder that converts pulses to a voltage signal. The encoder’s wires would be
stripped to connect either to alligator clips or soldered to longer wires, which would attach to a
data acquisition box (DAQ box). Satisfying the portability objective is dependent on the amount
of equipment veterinarians are willing to bring to house calls, but this design can operate onsite.
The equipment necessary for testing lung function with this design is the horse mask, three-cup
anemometer with tachometer unit, DAQ box, and a computer. Most veterinary standards are
considered as guidelines and recommendations for performing care. Based on the information
gathered about veterinary standards, this design would fulfill this objective by consisting of
biocompatible materials, not cause harm to the horse, and adhere to proper sterilization
procedures.
The three-cup anemometer with tachometer also has different means that satisfy the
functional blocks, which set it apart from the other alternative designs. The calculate airflow
functional block contains different means that accomplish this goal, but the three-cup
anemometer with tachometer design is unique with attempting to calculate volumetric flow rate
60
through measuring RPMs. To accurately calculate volumetric flow rate for this design, the shape
of the three-cup anemometer must be accounted for as described in simplified terms in Equation
4.8 and 4.9 (Gudmundsson, 2013; The Engineering Toolbox, n.d.).
CFM = RPM ∗ p ∗ π ∗ (D
2)2 (Eq. 4.8)
RPM =revolutions per minute
p =pitch (ft.)
D =diameter (ft.)
CFM =cubic feet per minute
Air Volumetric Flow Rate = CFM ∗ 0.03283 ∗ 10−3 (Eq. 4.9)
The functional block regarding signal display has three means and the three-cup
anemometer with tachometer is compatible with two of the three means. The three-cup
anemometer with tachometer design was discussed earlier to be compatible with LabVIEW to
display voltage signals. Due to the linearity relationship of voltage to RPM from the encoder, an
Arduino is another viable option to display the voltage signals. An additional benefit of using an
Arduino is the design would be more likely to be portable because of the size of the Arduino
compared to the current device’s pressure transducer box. The envisioned device exterior is a
cylinder, 5 in. diameter, which is attached to the existing facemask. Calibration for the three-cup
anemometer with tachometer would be achieved by using the calibration syringe. With the
calibration syringe supplying a known volume, the airflow can be predetermined and expected as
the output. Table 4.8 summarizes the pros and cons of the three-cup anemometer with
tachometer alternative design.
Table 4.8: Pros and cons of the three-cup anemometer with tachometer design
Three-cup anemometer with Tachometer
Pros Cons
● Lightweight
● Less expensive
● Protrudes a max of 4in.
● Accuracy errors
● Tachometer must have an encoder to connect to LabVIEW
● Difficult to use onsite

61
4.3.4 Strain gauge on hair-like structures
Another alternative design for measuring airflow is using strain gauges on a hair-like
structure. Using strain gauges to measure airflow was developed from a study of insect hair
because they can measure very slight airflows based on the strain of their hairs. Most strain
gauges can measure microstrains and large strains, so are beneficial to use on large ranges of
airflows (Ozaki, et al., 2000). The horse will breathe through a tube that has the hair-like
structures in the center. The hair-like structures will deflect with the airflow and the strain gauges
will measure the output and produce a voltage reading. This device could measure airflow in
both directions because the hair-like structures can deflect in both directions. One strain gauge
would be required for each hair-like structure and at least two hair-like structures would be
required to make accurate measurement.
There are many mathematical models for the airflow related to the strain that can be used
to find the velocity of the airflow. Equation 4.10 is the equation used to calculate drag of a
cylinder perpendicular to flow. Equation 4.11 is the calculation for moment of inertia of the wire.
Finally, Equation 4.12 is the equation used to calculate the amount of deflection the hair-like
structure experiences.
D = Cd ∗1
2∗ ρair ∗ U2 ∗ A (Eq. 4.10)
D is Drag
Cd is the drag coefficient that can be determined based on Reynolds number and
length/diameter
ρairis the density of air (kg/m3)
U is the velocity (m/s)
A is the area (m2)
I =(
0.0036784546
1000∗d2)
2 (Eq. 4.11)
I is the moment of inertia
d is the diameter of the hair-like structure (m)
deflection =D∗L4
8∗(6.063∗109)∗I(Eq. 4.12)
D is drag calculated in Eq. 4.10
L is length (m)
I is moment of inertia calculated in Eq. 4.11

62
The strain gauges and hair-like structures can be incorporated into a system that attaches
to the current facemask, but it would only extrude approximately two inches from the horse’s
face rather than the current 12 in. of the Fleisch pneumotachograph. The weight can also be
significantly reduced because two narrow wires and small strain gauges can be used instead of a
large stainless-steel component. The wire can be any thin, long wire, so aluminum could be used
because it is less expensive and lighter than many other metals. Since this new device is using
the same facemask as the current device, it will still be biocompatible and the system can be
cleaned effectively as long as care is taken with the strain gauges. This means the device meets
the primary veterinary standards that are in place. The overall device would weigh less than 1.5
lbs., which again is significantly reduced from the current 3 lbs. By improving both the
protrusion and the weight, the device will be significantly safer. A model of the alternative
design can be seen in Figure 4.7.
Figure 4.7: Schematic of strain gauges on hair-like structures design
Since the horse is breathing through a large cylinder containing only two thin wires, the
pressure drop is negligible. Thus, reducing the resistance to a negligible amount would allow the
strain gauge and hair-like system to be used while the horse is at full exertion. The deflection
will also occur as the air flows over it, so the horse just needs to breathe as it naturally would,
which means this device does not require compliant breathing. The strain gauge used needs to
experience the same deflection as the wire it is on. Omega’s bonded resistance strain gage could
be used for this application because it can be used in a wide range of temperatures, it has a range
of sizes, it is highly sensitive, and it can be used in dynamic conditions. The desired size of the
strain gauge would be 0.008 in. because it needs to experience the strain of the 20 gauge wire it

63
is adhered to (Omega, n.d.). The main concern about the accuracy of the device is the noise
caused by the horse’s movements during testing. Any movement of the horse’s face will cause
deflection of the hair-like structures leading to noise that needs to be filtered out in order to
produce accurate measurements. Once calibrated with the calibration syringe that simulates the
airflow of a horse at a known volume and flow rate, the overall system will be more accurate
than the current device because it can differentiate at such a small interval. Lastly, strain gauges
can be combined into most circuitry systems and produce an output voltage signal, making it
compatible with LabVIEW and portable if a computer or other data acquisition device is
connected. In LabVIEW, this voltage signal can be converted to airflow, which can then be
synced and displayed in time with the RIP band measurements.
Table 4.9 summarizes the pros and cons of the strain gauge method for measuring
airflow using the hair-like structures.
Table 4.9: Pros and cons of hair-like structures on strain gauges
Hair-like structure on a strain gauge
Pros Cons
● Lightweight
● Protrudes less than 3 in.
● Resistance is negligible
● Cost < $40
● Accuracy affected by noise due to horse movement
● Delayed measurement can cause syncing to RIP
bands difficult
4.4 Final Design Selection
Table 4.10 shows a design matrix of our four alternative designs for an equine lung
function testing device. This matrix was created after further researching our four alternative
designs discussed in section 4.3. The design concepts are labeled in the top row and the criteria
that the designs should meet to be successful are in the left-most column. Ratings of -1,0, and 1
were given to each concept if they did not meet the criteria or were worse than the current
device, matched the current device, or were better than the current device, respectively. Each
criterion was weighted between a 1 and a 5 based off the results of Table 4.3, which compared
each objective to each other based on the averaged weighting between Dr. Mazan and the team.

64
Table 4.10: Design matrix of alternative designs
Wei
ghts
Impro
ved
Fle
isch
Thre
e-cu
p
anem
om
eter
Hot-
wir
e
anem
om
etry
Str
ain g
auge
Accurately obtain lung function signals (± 0.33%) 3 1 -1 1 -1
Minimize Resistance to breathing 4 -1 -1 1 1
Cannot require compliant breathing 5 0 0 0 0
Minimize risk for human users (<1.5 lbs. and <6 in.) 4 0 1 1 1
Less expensive (<$1000) 2 1 1 1 1
Compatible with LabVIEW 1 -1 1 1 1
Portable 1 0 0 1 1
Meets veterinary standards 5 0 0 0 0
Rank 0 0 15 9
4.4.1 Aluminum Fleisch pneumotachograph
4.4.1.1 Cost
When comparing the aluminum Fleisch pneumotachograph to the current device, there is
a noticeable difference in their costs as the aluminum Fleisch pneumotachograph is significantly
less expensive. Aluminum capillary tubes and plastic tubing are the materials needed to assemble
the pneumotachograph. A 3-pack of 12 in. aluminum capillary tubes costs between $1.00-$1.50.
Approximately 500-1,000 1.5 in. aluminum capillary tubes are needed in the device, which
means approximately 60-125 12 in. capillaries need to be purchased (Midland Hardware, 2016).
A 3-in. piece of plastic tubing costs approximately $5, resulting in an overall total of no more
than $68 for the materials. Factors such as time and manufacturing will add to the cost of the
aluminum Fleisch pneumotachograph. However, it is expected that this device will be less
expensive than the current pneumotachograph at $8,000 after manufacturing and time costs.

65
4.4.1.2 Accuracy
The accuracy of the aluminum Fleisch pneumotachograph is dependent on how well the
capillaries are assembled inside the tubing. The capillaries must be assembled in such a way that
triangular tubes form between their gaps. Additionally, the capillaries should not be able to shift
in direction under any circumstance. Assuming that these conditions are met, the aluminum
Fleisch pneumotachograph can serve as an accurate model for reading a pressure drop. When
completing flow simulations on the entire pneumotachograph model, the data that was acquired
was not expected nor meaningful. This is because the fluid boundary layers were not completely
defined. Therefore, flow simulations were completed on a single circular and triangular capillary
to determine if a pressure drop was present across the tube and to determine if there was a
standard velocity profile. Figures 4.8, 4.9, 4.10, and 4.11 display the measured pressure drop and
velocity profiles for both a single circular and triangular capillary.
Figure 4.8: SolidWorks flow trajectory pressure profile for a circular capillary
Figure 4.9: SolidWorks flow simulation velocity cut plot for a circular capillary

66
Figure 4.10: SolidWorks flow trajectory pressure profile for a triangular capillary
Figure 4.11: SolidWorks flow simulation velocity cut plot for a triangular capillary
The pressure drops across the circular and triangular capillaries were calculated in
SolidWorks to be 47.78 Pa and 446.09 Pa respectively. The team’s calculated pressure drop
across a single circular capillary was calculated to be 41.44 Pa using Equations 4.13 and 4.14
below. When creating the velocity profiles, the normal resting flow rate of a horse’s breath of 65
L/min was used as the inlet velocity for both capillaries. The velocity was constant throughout
the length of the tube in both instances, which was expected because the flow is laminar.
Q =ΠR2Vc
2(Eq. 4.13)
Q is the flow rate
Vc is the maximum velocity
R is the radius
Q =ΠD4ΔP
128μl(Eq. 4.14)
Q is the flow rate
D is the diameter
ΔP is the pressure drop
l is the length
𝜇 is viscosity

67
4.4.1.3 Feasibility
Regarding the feasibility of the aluminum Fleisch pneumotachograph, manufacturing was
a main concern. The success of the pneumotachograph reading a correct pressure drop is
dependent on how well the capillaries are assembled. Ultimately, circular and triangular tubes
need to be present in the model to create an accurate pressure drop reading. Brazing the
aluminum capillaries can secure the capillaries in place to prevent any shifting of the tubes.
However, manufacturing requirements would be complex, time consuming, and expensive for
the device.
Pressure drop calculations were performed to verify that the aluminum Fleisch
pneumotachograph was a feasible design. The pressure drop across both circular and triangular
tubes were calculated. This pressure drop is equal to the pressure drop across the entire device..
4.4.1.4 Prototype
A prototype of the aluminum Fleisch pneumotachograph was constructed to verify that
the device would produce a pressure drop. To read the pressure drop, a double-sided manometer
was also constructed using plastic tubing and a piece of wood. For the pneumotachograph
prototype, coffee stirrers were cut into 1.5 in. lengths and were sanded down to even their
surfaces. Using rubber bands, the stirrers were secured into a 3-in. circular shape and placed
inside a 3-in. long plastic bottle. The plastic bottle was then punctured once in an area before the
straw pneumotachograph model and once after the model. These punctures acted as inserts for
the rubber tubing of the manometer. One side of the manometer read the pressure before the air
flowed into the straws and the other side read the pressure right after air passed through. Using
these readings, the pressure drop was determined. A constant stream of air was provided by an
air regulator on a compressed airline.
4.4.2 Hot-wire anemometry
In section 4.3.2 a hot-wire anemometry concept was discussed as a potential design for
equine lung function testing. This method uses thermal sensing to measure airflow. This section
further discusses its cost, accuracy, and overall feasibility for our project.
4.4.2.1 Cost
Using a method of thermal sensing to measure airflow has the potential to be significantly
cheaper than the current device. Mass airflow sensors utilize a hot-wire and can be found for

68
around $35.00 from Premier Farnell Ltd (Farnell Ltd, 2016). Hot-wire anemometers can also be
made from scratch using materials like tungsten or platinum wire. Tungsten or platinum wire can
be obtained for $50.00-$200.00 from chemical suppliers like Sigma-Aldrich (Sigma-Aldrich,
2016). Thermistors can also be used to measure airflow by thermal sensing similar to hot-wire
anemometry when wired in a specific way. A thermistor is a resistor whose resistance increases
when cooled, in this case from a horse breath. A thermistor with all the embedded circuitry
necessary to measure air speed can be purchased for $17.00-24.00 dollars from Modern Device
(Modern Device, 2016). These sensors were financially the best option for thermal sensing, so
each was purchased to determine which was most technically feasible.
4.4.2.2 Accuracy
Our hot-wire anemometry design contained a cylinder with two open ends for the air to
pass through and a sensing element protruding into the cylinder to catch passing air. The top of
the cylinder contains housing for the necessary circuitry that the sensing element requires. Flow
simulations were done to determine the velocity profile and if there was any major pressure drop.
A figure of the measured pressure drop and a figure of the velocity profile for an inlet flow rate
of 65 L/min (the average resting rate of a horse) are displayed in Figure 4.12 and Figure 4.13,
respectively.
Figure 4.12: SolidWorks flow simulation pressure cut plot for the hot-wire anemometry concept

69
Figure 4.13: SolidWorks flow simulation velocity cut plot for the hot-wire anemometry concept
There was a slight pressure drop in the cylinder which was expected since the cylinder
increases in size where the sensing element is located. This drop-in pressure should not affect the
results as it is negligible, in ranges close to only 1 Pa, suggesting there is hardly any resistance
within the device. The velocity profile displays a higher velocity in the mid-section of the
cylinder as the flow continues to develop. This is also expected and the flow is laminar as
desired. The sensor’s placement is in the midrange of the velocities present, which is also ideal.
The Rev P Wind Sensor (Figure 4.14A) itself is capable of measuring wind speeds of 0-
150 mph, speeds well above what we require the device to measure, has ambient temperature
compensation, and can display temperature values. The Rev P has also been improved from an
earlier wind sensing model to have a maximum output voltage of 3.3 V and high precision
resistors (0.1%) in the embedded circuitry (Modern Device, 2016). Another sensor, the Rev C
Wind Sensor (Figure 4.14B), was developed before the Rev P and does not have ambient
temperature compensation. It works the same way as the Rev P does. However, it was designed
for use with lower flow speeds and operates using a lower voltage (Modern Device, 2016).
A. B.
Figure 4.14: A) Modern Device Rev P Wind Sensor; B) Modern Device Rev C Wind Sensor

70
4.4.2.3 Feasibility
The hot-wire anemometry concept is a feasible option for testing equine lung function.
Specifically, The Rev C Wind Sensor, is a highly feasible option because it is extremely
affordable at $17.00 and it includes all the necessary embedded circuitry. Assembling our own
hot-wire circuit posed a challenge because components could be expensive and our team’s skill
set is mostly mechanical. Having a sensor requiring minimal circuitry made it much more
intuitive to calibrate and conduct testing on. The Rev C Wind Sensor is also small in size which
made it easier to incorporate into a small design. This resulted in a safer device for operators and
more comfortable for the horses. The sensor is also compatible with LabVIEW which made it
easy for us to conduct various experiments with the sensor using LabVIEW software we had
access to already. Additionally, the sensor requires a 5-10 V supply voltage which is easily
obtained with a 9 V battery, laboratory regulated power supply, a regulated wall adapter, or using
a data acquisition box programmed in LabVIEW (Modern Device, 2016).
4.4.3 Three-cup anemometer
In section 4.3.3 the three-cup anemometer was considered as an alternative design for
equine lung function testing. This design uses a tachometer to record the revolutions per minute
of the hemispherical cups to measure airflow. This section focuses on the cost, accuracy, and
overall feasibility of the design in the context of our project.
4.4.3.1 Cost
There is a significant price difference between the actual cost of the Fleisch
pneumotachograph and the projected cost of considering the three-cup anemometer with a
tachometer design. As stated throughout the report the Fleisch pneumotachograph itself costs
$8,000. Based on the CAD model of the three-cup anemometer when the design is created out of
aluminum the corresponding mass for the design is 0.18 lbs. When the CAD model is created out
of polycarbonate (PC) the corresponding mass for the design is 0.07 lbs. Aluminum is
approximately $1.15/lb. and PC is $1.84/lb. (Granta Design Limited, 2016). Knowing the
approximate mass and cost per mass allows for a general estimate of the cost of the three-cup
anemometer design. If the three-cup anemometer is machined out of aluminum, it will cost
around $0.20 or if it is machined out of PC it will cost $0.13. However, those estimates are based
solely on the mass of the design, not the amount of stock material required to create the design.
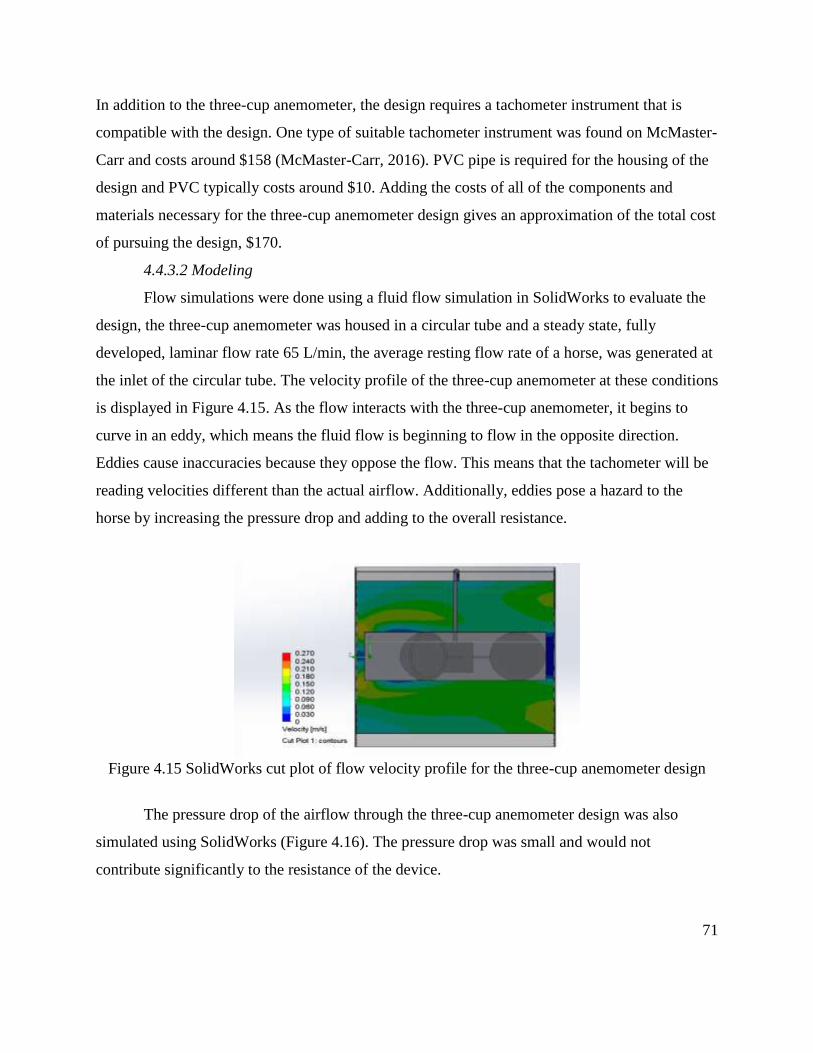
71
In addition to the three-cup anemometer, the design requires a tachometer instrument that is
compatible with the design. One type of suitable tachometer instrument was found on McMaster-
Carr and costs around $158 (McMaster-Carr, 2016). PVC pipe is required for the housing of the
design and PVC typically costs around $10. Adding the costs of all of the components and
materials necessary for the three-cup anemometer design gives an approximation of the total cost
of pursuing the design, $170.
4.4.3.2 Modeling
Flow simulations were done using a fluid flow simulation in SolidWorks to evaluate the
design, the three-cup anemometer was housed in a circular tube and a steady state, fully
developed, laminar flow rate 65 L/min, the average resting flow rate of a horse, was generated at
the inlet of the circular tube. The velocity profile of the three-cup anemometer at these conditions
is displayed in Figure 4.15. As the flow interacts with the three-cup anemometer, it begins to
curve in an eddy, which means the fluid flow is beginning to flow in the opposite direction.
Eddies cause inaccuracies because they oppose the flow. This means that the tachometer will be
reading velocities different than the actual airflow. Additionally, eddies pose a hazard to the
horse by increasing the pressure drop and adding to the overall resistance.
Figure 4.15 SolidWorks cut plot of flow velocity profile for the three-cup anemometer design
The pressure drop of the airflow through the three-cup anemometer design was also
simulated using SolidWorks (Figure 4.16). The pressure drop was small and would not
contribute significantly to the resistance of the device.

72
Figure 4.16: SolidWorks flow simulation pressure cut plot for the three-cup anemometer design
4.4.3.3 Feasibility
In terms of manufacturing, the three-cup anemometer would not be a feasible design due
to our limited manufacturing background and difficulty to machine. The small design would
require precise cuts on a lathe to create the cup shapes. Cutting the inner and outer diameter of
the cup would be difficult. The shape of the cup requires the inner diameter to be cut first and
then the piece needs to be removed from the chuck and flipped around in order to cut the outer
diameter. This flipping of the cup piece may also pose a concern because the chuck may not be
able to secure such a small component that has already been cut.
Another deterrent from pursuing the three-cup anemometer design is potential restriction
it poses against the horse’s breathing. A design cannot cause harm to the horse and the eddies
present from the SolidWorks simulations demonstrates that the three-cup anemometer can
greatly restrict the horse’s breathing at a level that can harm the horse.
The overspeeding of the device leads the design to be considered infeasible. PhD
candidate conducted several experiments on different three-cup anemometers for his doctoral
dissertation. His work illustrated a variety of three-cup anemometers overspeeding for an
average period of two seconds after being subjected to wind speeds of 15 m/s, 10 m/s, and 5 m/s
(Chen, 2016). His work displays three-cup anemometers having a tendency to overspeed as
discussed in 4.3.3. Based on horses’ resting flow rate and maximum exertion flow rate it was
determined that the corresponding wind speeds would be in a range of 0 to 5.5 m/s. Therefore, a
three-cup anemometer subjected to horses’ wind speeds should also expect an average time of

73
two seconds of overspeeding. Horses breathe at an average rate of twelve breaths per second,
which is equivalent to five seconds per breath with 2.5 seconds of inspiration and 2.5 seconds of
expiration (Erickson, 2004). Theoretically two seconds of overspeeding would occur after the
end of expiration, because during expiration the three-cup anemometer would be increasing
speed. Inspiration is flow in the opposing direction to expiration, effectively acting as a
decelerator for the three-cup anemometer. The three-cup anemometer would only be able to
respond accurately to the last 0.5 seconds of inspiration. Missing two seconds of inspiration wind
speed data for each breath would make it impossible to accurately report a horse’s lung function.
With the simulations and equations considered for this design, we have deemed it
unfeasible, but more simulation would be needed to fully understand the other factors of
modeling turbomachinery and their effects on accuracy.
4.4.4 Strain gauges on hair-like structures
As described in chapter 4.3.4 the idea of using hair-like structures to measure airflow is
developed from the knowledge that insects use the hair on their bodies to determine wind speed
and direction based on its deflection. This concept has been adapted to work with wire and strain
gauges to measure deflection caused by airflow, which is a potential method for measuring
equine lung function.
4.4.4.1 Cost
Using strain gauges to measure airflow has the potential to cost significantly less than the
current device. This design is drastically less expensive than $8,000. An appropriate strain gauge
for this application costs on average $70. As discussed in section 4.3.4, the 0.008 in. bonded
resistance strain gauge would work best for this application because it would strain with the
twenty-gauge wire (Omega, n.d.). The twenty-gauge wire can be a simple aluminum wire, which
can be purchased for $2 to $6 from various online retailers. Also, an epoxy that does not creep is
required to ensure that the strain gauge’s accuracy does not change over time. An appropriate
epoxy can be purchased at any hardware store and will cost $5 to $10. Lastly, the hair like
structures will need to be housed in tubing with a 3-in. diameter and no more than 2 in. long. A
PVC pipe with these dimensions can be purchased at any hardware store and costs less than $10.
An estimated overall cost to construct this device is $96. This is significantly improved from the
cost of the Fleisch pneumotachograph.

74
4.4.4.2 Accuracy
There are a few concerns with the accuracy of the strain gauges for this application.
Strain gauges are very sensitive to small changes in strain, which may pose a problem when
being used to measure a transient flow such as a horse’s breath. There are also concerns with the
delay in response time. Since the wire deflection does not occur instantaneously, there will be a
delay in the strain gauges reading. This delay would be almost imperceptible, but when the
timing with another device is critical such as in this system where timing with the RIP bands is
critical this delay could cause a drastic visual shift in the data from the band readings producing
an undesired result.
In order to determine if the flow would react differently in this device causing inaccurate
readings, flow simulations were conducted using the fluid simulation add-in in SolidWorks.
These flow simulations were completed to make sure that the system had a normal laminar flow
velocity profile and experienced a minimal pressure drop. The boundary conditions set were a
static pressure at the outlet and an inlet flow of 65 L/min, which is the average resting rate of a
horse. Figure 4.17 shows the velocity profile for the strain gauge design. The hair like structures
caused no disruption in the flow, so a standard laminar flow velocity profile was seen as
expected. As expected, the maximum velocity occurred in the center of the housing and was
0.488 m/s, which is approximately the same as the maximum velocity for the other designs
including the existing Fleisch pneumotachograph model. Matching that maximum velocity
between the designs is ideal.
Figure 4.17: SolidWorks flow simulation velocity cut plot for the strain gauge design

75
Pressure drop is a very important parameter to consider when designing a device for non-
invasive equine lung function testing because a higher-pressure drop applies more resistance to
the horse’s breathing. If the resistance is too high, the horse could suffocate because it would be
unable to breathe. Due to the open profile of this design, the pressure drop is minimal which is
shown in the pressure cut plot in Figure 4.18.
Figure 4.18: SolidWorks flow simulation pressure cut plot for the strain gauge design
As seen in Figure 4.18 the pressure is very consistent throughout the housing. The
maximum pressure drop experienced is 1.00 Pa, which is significantly lower than the current
device thus improving the resistance the horse experiences during testing.
4.4.4.3 Feasibility
There are a few concerns about the feasibility of this design for our team. As mentioned
before, we all have a mainly mechanical background, so working with and designing circuits is
outside our area of focus. Since the strain of the wire needs to be detected, a microstrain gauge
would need to be positioned on the wire appropriately to measure that deflection. Using equation
4.9 through 4.11 the drag, moment of inertia, and deflection were calculated to be 2.72 ∗ 10−6N,
approximately 0 Kg*m2, and 0.308 nm respectively. Due to the size of the wire and the strain
calculated for the average flow rate produced by a horse, the strain gauge used would need to be
extremely small and sensitive. Strain gauges of this size and sensitivity are not readily available,
so we would have to design and construct a strain gauge specifically for this purpose, which
would require an electrical engineering background. Strain gauges also require a lot of signal
processing, which requires a deep understanding of data analysis and computer science. Due to

76
our inexperience in the required fields to create this design and interpret the results, it was
determined that it was not feasible for us to pursue this design further.
4.4.5 Overall sensor selection
After researching, modeling, and conducting simulations for our four alternative designs,
we chose the hot-wire anemometry concept to incorporate into our final design. Specifically, we
chose to perform testing with the Rev P and Rev C Wind Sensors from Modern Device because
they were affordable, small, and had all necessary circuitry and code embedded.
The Rev P Wind Sensor was designed to work with an Arduino Uno. The Arduino code
was provided with the device and included calibration curve equations for the conversion of the
raw data to the temperature and wind speed. Equation 4.15 displays the calibration equation for
the temperature and Equation 4.16 shows the calibration equation for the wind speed.
T =((
RawT∗5.0
1024.0)−0.400)
0.0195(Eq. 4.15)
T= temperature (oC)
RawT= value proportion of bits output
Wind Speed = (RawW−264.0
85.6814)3.36814(Eq. 4.16)
Wind Speed= speed (MPH)
RawW= value proportion of bits output
The Rev C Wind Sensor is also produced by Modern Device, the same manufacturer as the Rev
P sensor, but it is an earlier model. The Rev C does not have ambient temperature compensation
built into its circuitry, but does have an adjustable calibration factor within the supplied code,
making it simpler to calibrate. Like the Rev P, the Rev C measures temperature changes that it
converts to wind speed in MPH. The sensor is designed to work with an Arduino Uno and the
code with the calibration equations was provided. The sensor was originally calibrated by
Modern Device with a 5 V source, but the zeroWindAdjustment factor built into its calibration
code can be changed based on the voltage used. Equation 4.17 is the calculation of zeroWind in
Arduino units, Equation 4.18 is the conversion of that value to zeroWind in voltage, which is
where the zeroWindAdjustment factor is used, and lastly Equation 4.19 is the conversion to
WindSpeed in MPH.

77
zeroWindADunits = (−0.006 ∗ TMPThermADunits2) + (1.0727 ∗ TMPThermADunits) +47.172 (Eq. 4.17)
TMPThermADunits=temperature of the thermistor on the wind sensor in Arduino units
zeroWindADunits=the velocity measured at zero wind in Arduino units
zeroWindvolts = (zeroWindADunits ∗ 0.0048828125) − zeroWindAdjustment (Eq. 4.18)
zeroWindvolts=the velocity measured at zero wind in volts
zeroWindAdjustment=0.2 at 5V
WindSpeedMPH = ((RVWindVolts−zeroWindvolts)
0.2300)2.7265 (Eq. 4.19)
RVWindVolts=measured wind speed converted from Arduino units to voltage
WindSpeedMPH=final output of wind speed in MPH
After calibrating and testing each, we determined the Rev C was most feasible for our
device. Chapter 5 covers our experimental plan and how we verified our choice of thermal
sensing to measure airflow.
4.4.6 Final Design
This section discusses the housing, attachment, and software options that we chose for
our final sensor selection.
4.4.6.1 Housing
An appropriate housing needed to be chosen to contain the sensing element. The housing
for the sensor had to be shorter than the current 12 in. long device and be softer or more flexible
than the current combination of stainless-steel and PVC. These specifications were decided on
because they would make the entire device safer for the operators and personnel in the room
during testing. The wind sensor is made up of an embedded circuit, which should have
minimized exposure to the humidity of the horse’s breath. To accomplish this, the circuitry was
surrounded by a protective box within the housing of the device, so that only the thermistor
sensing element is exposed to the horse’s breath.
We developed three different designs of how the sensor should be attached to the horse in
order to capture the horse’s breath. The first and simplest to implement was an attachment to the
current facemask. The second idea was to 3D print a more streamlined facemask that covered
less of the horse’s face. Our last design was a mask that connected to a standard bridle that just

78
covered their nostrils.
4.4.6.2 Attachment to facemask
Cummings School currently has a facemask that attaches to the pneumotachograph
device, so the simplest way to integrate our sensor was to make it attachable to the existing
facemask. The facemask that they use fits over the horse’s entire muzzle, so that all air is
captured from their breathing. An image of the mask can be seen in Figure 4.19.
Figure 4.19: Current facemask used for testing
The connection on this mask to the current device is 2.5 in. in diameter, so the new
design needed to have the same dimensions on the portion that connects to the mask. Ultimately,
the new design needed to be shorter and lighter than the current device to address safety
concerns.
4.4.6.3 Streamlined facemask
By inverting and 3D printing a mold of a horse’s face, we could produce a shorter and
less bulky mask that would not sit so far back on the horse’s face. It would also sit closer to the
sides of their face rather than protruding out on each side. This could reduce cost and increase
safety for the user and comfort for the horse.
4.4.6.4 Bridle incorporated mask
Since horses are obligatory nose breathers and are used to wearing bridles, we initially
assumed they would be comfortable with wearing a modified bridle for the test. A mask that just
covers their nostrils could be developed to connect to the bridle, so that their entire face did not
have to be encased in a plastic mask for the test. The sensor would be inserted into a small

79
opening in the mask with the electrical components above. This design would be lightweight,
more comfortable for the horse, and would protrude significantly less than the current design.
These modifications would significantly improve the safety of the overall device for the human
user and increase the comfort for the horse being tested. However, after discussing this idea with
our sponsor, we learned horses have high sensitivity around their mouth and nose. Therefore, a
bridle incorporated mask may cause discomfort for the horse.
4.4.6.5 Final housing
We chose to make an attachment to the current facemask. The overall length of the
housing is approximately 3.5 in. making it significantly safer for the veterinarians using the
device. It only protrudes 2.5 in. from the mask and weighs 0.32 lbs. The wires that connect from
the DAQ box to the sensor are 8 ft. long, to connect the device to the DAQ box at a sufficient
distance away from the horse and extend through the top of the housing for easy access. Figure
4.20 shows the final housing in the mask with the sensor inserted.
Figure 4.20: Final housing and Rev C sensor in current facemask
4.4.7 Software
The current software used for real time data acquisition during testing is called Open
Pleth. This program is designed to work with the pressure transducer and circuitry contained
within a box that Ambulatory Monitoring Inc. made specifically for the Fleisch
pneumotachograph system. Since our device does not work based on the pressure drop across the

80
sensor, as the Fleisch pneumotachograph does, Open Pleth software does not work. This
software could not be edited to meet the needs of the new sensor, so a new program needed to be
developed to interface with the bands and the new sensor.
The new program was written in LabVIEW because we all had prior experience
programming in it and Dr. Mazan prefers the ability to access the block diagram, or code for the
program in case changes need to be made. LabVIEW can be used to collect data in real time
from most sensors when coded correctly for the input data to be processed. The cost for a new
user to buy the full edition of LabVIEW is $2,999 and an additional $149 is required for the
National Instruments’ USB-6000 data acquisition box required for data collection (National
Instruments, 2016a; National Instruments, 2016b). The new program will have similar graphs,
user controls, and output data as the Open Pleth system. Some of the features in Open Pleth that
were not ideal will also be improved upon such as the color scheme of the graphs.

81
5.0 Design Verification
To verify that the design met the required needs of the client, multiple tests needed to be
completed, but first, the sensor needed to be calibrated. The sensor was calibrated at a zero-point
to ensure that the values were read accurately. After calibrating the sensor, the functionality at
high and low speeds was determined to verify the sensor’s ability to work appropriately for the
specified application. Lastly, the sensor was tested in a clinical setting to prove proper function
on a horse.
5.1 Calibration of the thermal sensors
The two thermal sensors we purchased had to be calibrated to perform correctly and
obtain accurate results. If the sensor could not be properly calibrated then it was deemed
infeasible for this application and further testing was not continued.
5.1.1 Arduino to LabVIEW
Both the Rev P and Rev C sensors from Modern Device were designed to work with an
Arduino Uno. In order to make the sensors compatible with other components of our device and
meet the objective of being compatible with LabVIEW, the equations in the Arduino code were
recreated in LabVIEW. Equations 4.15 and 4.16 are the wind speed and temperature equations
for the Rev P sensor that we recreated in LabVIEW (Appendix C). Equations 4.17, 4.18, and
4.19 are the wind speed equations for the Rev C sensor that we recreated in LabVIEW
(Appendix D). These equations needed to be converted to perform the same operation in
LabVIEW as they did for the Arduino. The Arduino works in portions of bits, but LabVIEW
reads voltage directly. The Arduino used was a 10 bit Arduino Uno with a resolution of 210 (or
1024) values and a maximum voltage output of 5 volts. The values are divided by the maximum
voltage to get a conversion factor of 204.8 values/volts. To account for this difference in the
LabVIEW program, the acquired voltages were multiplied by 204.8 before using the Arduino
equations to process the data. Once the data was properly converted and the appropriate
equations were written, a zero-point test was used to calibrate the sensor.
5.1.2 Zero-point test
A zero-point test was conducted with both the Rev P and Rev C sensors to calibrate each
device. The Rev C sensor had a zero-wind adjustment factor that was used to ensure that the
value read at a known 0 MPH flow rate was, in fact, 0 MPH. The Rev P did not have this

82
correction, so it had to accurately read 0 MPH without correction. To guarantee there was a solid
connection between the DAQ box and the sensor, wires were soldered directly to the four
required pins on the sensor and then were inserted directly into the proper ports on the DAQ box.
Each sensor was powered with an appropriate wall wart that provided a consistent voltage. The
Rev C was powered with a 5 V wall wart and the Rev P was powered with a 9 V wall wart. To
ensure that the sensor was in a zero-wind environment for this test, a glass bowl was placed over
the sensor, only leaving a small gap between it and the table to allow for the wires to connect to
the DAQ box. Figure 5.1 displays the experimental setup for this test. Both sensors were tested
using the same setup.
Figure 5.1: Rev C sensor covered by a glass bowl to simulate a known zero-wind environment
Using the test setup seen in Figure 5.1 with the Rev P sensor we conducted a zero-point
test with a 9V power supply. When tested, the Rev P sensor produced an average reading of
0.0179 MPH (Figure 5.2).
Figure 5.2: Graphical representation of the results of the 9 V zero-point test with the Rev P
sensor
0
0.005
0.01
0.015
0.02
0 5 10 15 20 25 30 35
Win
d s
pee
d (
MP
H)
Data Points
Rev P zero-point test at 9V

83
Using the setup shown in Figure 5.1, the Rev C sensor was originally tested with a 4.7 V
excitation voltage using a power supply and it was found that with a correction factor of 0.05 the
sensor read consistently at 0.001 MPH. Figure 5.3 shows the speed in miles per hour on the y-
axis and the sampled data points on the x-axis. This graph clearly shows that the wind speed
readings were consistent throughout the length of the zero-point test.
Figure 5.3: Graphical representation of the results of the Rev C zero-point test at 4.7 V
For the Rev C, we found that the correction factor required to get a 0 MPH reading at a
known 0 MPH flow was dependent on the environmental conditions and the excitation voltage.
A calibration LabVIEW program was created that would automatically find the correction factor
that resulted in a reading less than 0.0005 MPH (Appendix E). This program consistently finds a
correction factor within the range of 0.25 to 0.39 for a 5 V excitation voltage depending on the
ambient temperature of the room. If run repeatedly in the same room, it will find a value within
±0.01 every time. This proves that the Rev C calibration is repeatable and reproducible making it
ideal for further testing.
5.2 Sensor function verification
After verifying that both sensors read reasonably close to 0 MPH after the zero-point
calibration test, the sensors’ abilities to read higher wind speeds needed to be verified. First a
high-speed wind tunnel was used to verify the sensors’ abilities to accurately display the same
wind speed as the set wind tunnel speed values. Also, high wind tunnel testing determined which
sensor, the Rev P or the Rev C, was more accurate so that our focus was directed towards one
0
0.005
0.01
0.015
0.02
0 5 10 15 20 25
Win
d s
pee
d (
MH
)
Data Points
Rev C zero-point test at 4.7 V

84
sensor. After choosing which sensor to pursue, we had to develop a different method to verify
the sensor results at low flows that are more representative of a horse’s breath. This was done by
developing our own wind tunnel specifically for low flows. Finally, we tested on multiple horses
to verify the total system’s functionality.
5.2.1 High speed wind tunnel test
The wind tunnel in WPI’s Aerospace department was used to verify both sensors
accurately measured high wind speeds. The wind tunnel is calibrated based on reading a large
water manometer that experiences changes in the water height due to the speed of airflow
through the pitot tube in the wind tunnel. Visual changes in the water height do not occur below
approximately 20 MPH and above this the change in height is still very small, so the calibration
is approximate and assumed linear from 0 to 100 MPH even though the low speeds cannot be
verified. Eq. 5.1 is the current calibration equation for the wind tunnel.
V(m/s) =45
56.5∗ f(Hz) (Eq. 5.1)
Equation 5.1 was used to determine what frequency to set the wind tunnel to in order to
test at the desired speeds. We laser cut an acrylic part (Figure 5.4) that attached to the common
metal fixture (Figure 5.5) to hold the sensor steady in the flow stream.
Figure 5.4: Laser cut acrylic fixture for holding Rev P and Rev C sensors for high speed wind
tunnel testing with a slot for wire insertion and hole for screw connection to the metal fixture
(Figure 5.5)

85
Figure 5.5: Common fixture for attaching the test object in the high-speed wind tunnel
Figure 5.6 displays the final test setup for the wind tunnel test with the sensor in the wind tunnel
attached to the laser cut piece and the standard metal fixture.
Figure 5.6: Rev P sensor held in flow stream by the laser cut acrylic piece
We first tested the Rev P sensor at wind speeds of 0, 2, 5, 8, and 12 MPH assuming that
the calibration was actually linear at these low speeds. These speeds were chosen because the
average flow rate of a horse, 65 L/min, is approximately 0.2 MPH assuming a diameter of 3 in.
for the housing and the maximum flow rate of a horse, 1500 L/min is approximately 12 MPH
assuming the same 3 in. diameter for the housing. Testing from 0 to 12 MPH ensured that we
were testing across the entire possible range that a horse could produce. The first test was
completed using the original equation, Equation 4.16, and then from this data five other
equations were created for testing in order to determine which equation produced the best results.
The five alternative equations were two linear equations (Equations 5.2 & 5.3), two polynomial
equations (Equations 5.4 & 5.5), and one additional power equation (Equation 5.6).

86
mph = 0.126 ∗ values − 36.965 (Eq. 5.2)
mph = 0.1302 ∗ values − 38.557(Eq. 5.3)
mph = 0.0004 ∗ values2 − 0.1546 ∗ values + 11.521(Eq. 5.4)
mph = 0.003 ∗ values2 − 0.0492 ∗ values − 7.6893(Eq. 5.5)
3 ∗ 10−19 ∗ values7.5712 (Eq. 5.6)
A LabVIEW program for each of these equations was created to increase the ease of
testing, Appendix F displays the block diagram for each of these programs. We did not obtain the
expected readings using any of these equations, but we did find that Equation 5.2 was the best fit
for wind speeds below 2 MPH and that Equation 5.6 was the best fit for wind speeds above 2
MPH. The graphical results for each of these low flow tests with the Rev P sensor are displayed
in Appendix G.
Since the Rev P sensor did not respond well to the low flow test in the wind tunnel we
developed other methods for testing at low speeds, but we tested both the Rev P and Rev C
sensors at higher speeds in the wind tunnel to guarantee that they responded to the known
calibration speeds correctly. Both were tested at high speeds using their original Arduino
equations in LabVIEW. Figure 5.7 is the graphical results for the Rev P and Figure 5.8 is the
graphical results for the Rev C.
Figure 5.7: High speed wind tunnel test of the Rev P wind sensor with linear regression
R² = 0.9926
0
10
20
30
40
50
60
70
80
90
0 10 20 30 40 50 60 70 80
Set
win
d t
un
nel
sp
eed
(M
PH
)
Rev P sensor's readings (MPH)
Rev P high speed wind tunnel test

87
Figure 5.8: High speed wind tunnel test results of the Rev C wind sensor with linear regression
As seen in Figure 5.8, the Rev C sensor responded linearly to the increase in speed. It
also read very close to the known calibration value, whereas the readings from the Rev P sensor
were linear, but did not read within an acceptable range of the known value as seen in Figure 5.7.
The Rev P was reading close to 10 MPH at 20 MPH, whereas the Rev C read 20 MPH at 20
MPH. Due to the low speed readings and inability to properly calibrate the Rev P sensor, all
additional testing was continued with just the Rev C sensor to further verify its functionality.
5.2.2 Low flow wind tunnel test
After testing in the high-speed wind tunnel, we designed and constructed our own low
flow wind tunnel for testing at speeds closer to what horses produce while breathing both at rest
and during exercise. We created our low flow wind tunnel using two 2 ft. 3-in. diameter PVC
pipes connected by a coupler, an air regulator, an on/off ball valve, 6 ft. of airline tubing, and 5
PVC reducers to go from 3-in. diameter PVC to ¼-in. NPT, a bundle of coffee stirrers, and a
compressed airline. The coffee stirrers were cut to 1.5 in. lengths and then bundled using rubber
bands to form a 2-in. diameter flow straightener. This was placed at the end of one of the PVC
pipes closest to the regulator. The air regulator was connected to a compressed airline and the
flow rate was controlled using the regulator and ball valve. A rotameter device was placed at the
start of the tunnel connected directly to the ball valve and then the wind tunnel. This was used to
measure initial flow rate. The sensor was attached 4 ft. from the regulator at the end of the other
PVC pipe to ensure that the flow was laminar when it reached the sensor. Appendix H has
R² = 0.9963
0
10
20
30
40
50
60
0 10 20 30 40 50 60
Set
win
d t
un
nel
sp
eed
(M
PH
)
Rev C sensor's readings (MPH)
Rev C high speed wind tunnel test

88
detailed instructions on how to properly setup and use the low flow wind tunnel. Figure 5.9
shows the overall setup of the low flow wind tunnel.
Figure 5.9: Low flow wind tunnel test setup showing the Rev C wind sensor wires connected at
the end of the tunnel (left), the Testo 405i hot wire probe held at the open space at the end (left),
and the rotameter (right) used to determine the set pressure of the ball valve
This wind tunnel was used with a variety of tests comparing to three different calibrated
devices to verify that the Rev C sensor accurately measured low wind speeds. First, the Rev C
sensor, which was taped inside of the PVC pipe to keep the sensor in the center of flow, was
compared to the Hold Peak handheld anemometer. Appendix I is a standard operating procedure
(SOP) for the use of the Hold Peak handheld anemometer. The handheld anemometer was held at
the end of the wind tunnel just past where the sensor was. Many different orientations and
locations were tried, but the handheld anemometer did not respond to the airflow because the
airflow was too low to overcome the friction of the anemometer shaft.
Since the Rev C sensor’s functionality could not be verified using the Hold Peak
handheld anemometer we purchased a Testo 405i hot wire anemometer smart probe. The hot
wire probe was held at the end of the PVC, so that the hot wire portion was in the center of the
flow. Data was recorded using a Testo app (Smart probes). The data was then saved as an
EXCEL file and compared to the sensor’s readings. Appendix J includes a SOP for using this
device. Figure 5.10 shows the two sensors speed readings in m/s graphed over the data points of
each. Figure 5.11 shows the results of the same test, but compares the two sensor’s speed
readings directly with the Rev C sensor’s readings on the x-axis and the Testo 405i hot wire
probe’s readings on the y-axis.

89
Figure 5.10: Overlaid signal from the Rev C and Testo 405i hot wire probe
Figure 5.11: Linear regression analysis of the Rev C wind sensor compared to the Testo 405i hot
wire probe in low flow wind tunnel test
As Figure 5.10 shows, the hot wire anemometer produces similar readings to the Rev C
sensor at flows below 0.5 m/s. Above this speed the Rev C sensor’s readings began to drift
higher than the hot wire probe’s readings. A one sample T-test was conducted between the
differences of the two data sets with a null hypothesis of 𝜇≠0. The test had a p value of 0.000437,
much less than an ⍺ of 0.05, so the null hypothesis was rejected. This showed that there was no
0
0.1
0.2
0.3
0.4
0.5
0 10 20 30 40 50 60
Win
d s
pee
d (
m/s
)
Data points
Low speed wind tunnel test
Rev C Hotwire probe
P-value = 4.37x10⁻⁴
R² = 0.938
0
0.05
0.1
0.15
0.2
0.25
0.3
0.35
0.4
0.45
0 0.1 0.2 0.3 0.4 0.5
Win
d s
pee
d (
m/s
) o
f th
e Te
sto
ho
t w
ire
pro
be
Wind speed (m/s) of the Rev C sensor
Rev C sensor compared to Testo 405i hot wire probe in low flow test

90
significant different between the hot wire probe and Rev C data sets, thus verifying that the Rev
C sensor is calibrated and functions correctly in the range that would be expected for a horse at
rest. Figure 5.11 further justifies that the Rev C sensor accurately reads low wind speeds because
it is linearly comparable to the Testo 405i hot wire probe. This is shown by the R2 value of
0.9369, which is close to 1, meaning the line is almost perfectly linear.
Lastly, the Rev C sensor was compared to the Fleisch pneumotachograph in the low flow
wind tunnel to verify the readings from each were comparable. The Fleisch pneumotachograph
was first connected to Open Pleth and calibrated using the 4.07 L syringe we constructed. After
reaching an appropriate calibration factor from the calibration, the device was attached to the low
flow wind tunnel along with the Rev C sensor. Very quickly we realized that the low flow wind
tunnel would not be appropriate for testing the pneumotachograph because the
pneumotachograph finds the volumetric flow rate using integration. Since the low flow wind
tunnel provides a consistent flow rate the integration resulted in a zero reading at all constant
speeds. To get a proper integration factor that can be compared to the flow rate measured by the
Rev C sensor the flow needs to be cyclic so other test methods were used to compare the two
devices.
5.2.3 Syringe test
We used the 4.07 L syringe that we designed and constructed to test the wind sensor’s
response to cyclic airflow. The syringe produced airflows between 0.6 and 1 MPH based on
readings from the handheld anemometer. The Rev C sensor responded as expected, producing
cyclic peaks and valleys with maximums close to those measured by the handheld anemometer.
Figure 5.12 shows the wind speed in MPH measured by the sensor over the data points.

91
Figure 5.12: Rev C wind speed readings of cyclic flow produced by team created 4.07 L syringe
After determining how the Rev C sensor responded to cyclic flow, the syringe was used
to produce a cyclic flow through both the pneumotachograph and the Rev C sensor
simultaneously. Data for the Rev C sensor was collected using LabVIEW and data from the
pneumotachograph was collected in Open Pleth. After five to ten cycles the programs were
stopped and the data was exported to EXCEL. The flow rate data from both were compared by
graphing. Figure 5.13 displays the flow rate comparison of the two devices during the syringe
test.
Figure 5.13: Graphical comparison of corrected Rev C data and Fleisch pneumotachograph data
during syringe testing with the team designed 4.07 L syringe
0
0.2
0.4
0.6
0.8
1
1.2
1.4
0 20 40 60 80 100
Win
d S
pee
d (
MP
H)
Data Points
Rev C syringe test
-6
-4
-2
0
2
4
6
6 11 16 21 26 31 36
Vo
lum
etri
c fl
ow
rat
e (L
/s)
Time (s)
Syringe Test
Pneumotach Rev C corrected

92
There was a delay between the start of the two programs used to collect the data to
produce the graph seen in Figure 5.13, resulting in a misalignment of the data. The Rev C sensor
responds with the proper shape and amplitude to the cyclic flow, but all values it reads are
positive. In order to correct for this the signal needs to be inverted, so that inspiration is negative
and then shifted so that the graphical signal crosses zero as the veterinarian expects to see. This
data manipulation does not change what the data represents, but instead puts it in a form the
veterinarian is used to seeing, so it is easier for them to understand and compare to other methods
they use for testing. Human breathing tests were used to better compare the performance of both
the Rev C and pneumotachograph because breathing is more controlled and easier to compare
than the irregular movement of the syringe.
5.2.4 Human breathing test
Humans and horses produce a similar shaped curve just with different amplitudes, so
breathing tests on human subjects provide a good representation of how the sensor will respond
on a horse. These breathing tests were performed to determine if the temperature change between
inspiration and expiration would have an effect on the sensor’s performance. We were also
trying to determine if humidity would impact the sensors function. Breathing tests were
performed following the same method as syringe tests. The sensor was adhered to the end of the
pneumotachograph with the sensor in the center of the airflow. One of the team members
breathed through a funnel attached to the pneumotachograph for 25 seconds. Data was collected
using LabVIEW for the Rev C sensor and Open Pleth for the pneumotachograph. After the test
was complete, the data was exported to LabVIEW from each program and the results were
compared in EXCEL. Similar data manipulation techniques were used for the Rev C results to
better display the relationship of the data from both. This manipulation included negating the
data and shifting it up by a factor to ensure that it had both positive and negative readings where
appropriate. Figure 5.14 displays the overlaid pneumotachograph and Rev C data from a
breathing test after manipulation of the Rev C data.

93
Figure 5.14: Overlaid pneumotachograph and corrected Rev C data for a human breathing test
Figure 5.14 shows that the curves of each device overlap very well. From these results, it
was determined that temperature and humidity do not affect the Rev C sensor’s functionality.
The breathing tests also further verified that the pneumotachograph and the Rev C sensor
produce readings that are within an acceptable range of error from one another confirming that
both the pneumotachograph and the Rev C had a similar response to breathing.
5.3 Clinical testing on horses
We designed a simple housing that interfaced with the current facemask and housed the
sensor exposing the sensor to the center of the airflow as shown in Figure 4.20. We also designed
two different LabVIEW programs for clinical testing. The first incorporated a single calibration
program that found the zero-wind adjustment factor using the method described previously. This
zero-point was then automatically updated in the test program using global variables. This was
executed using a case structure controlled by the ringer, so that the veterinarian using the
program could easily control which program was running without having multiple files open. It
also guaranteed the proper correction factor was entered into the test program removing the
chances of human error with the transfer of the correction factor between programs. Appendix K
displays images of both the front panel and the block diagram for this program. Appendix L is an
SOP for how to use this program for a clinical test. The second program incorporates a second
calibration program that is run after the zero-point calibration. This calibration finds the shifting
factor that is required to automatically manipulate the data to display the data with both the
-0.25
-0.2
-0.15
-0.1
-0.05
0
0.05
0.1
0 5 10 15 20 25
Vo
lum
etri
c fl
ow
rat
e (L
/s)
Time (s)
Human breathing test of pneumotachograph vs Rev C sensor
Rev C Pneumotach

94
negative and positive values as would typically be seen in a breathing test. This program was
written to shift and integrate the signal on each iteration until the integration equals the average
dead space of a horse (2.5 L). Once this value is reached within a specified range of error, the
program stops running and the shift factor is automatically incorporated in the test program.
Appendix M displays images of the block diagram and front panel of this program and Appendix
N is an SOP for using this program for clinical tests.
Three different horses, Oliver, Missy, and Ginger, were tested using the one-step
calibration program. Oliver and Missy were both tested unsedated in stables in the hospital.
Ginger was tested in the lung lab and was slightly sedated because of an earlier procedure.
Before each horse was tested, the mask and housing were wiped down with an antiseptic, the
sensor was zeroed to the room, placed in the housing, and the mask was put on the horse’s
muzzle by Dr. Mazan. The test program in LabVIEW was run on each horse for approximately a
minute and the data was saved to EXCEL. Figure 5.15 shows the final device being used in a
clinical test.
Figure 5.15: Final device being used during clinical testing
The flow rate versus time data was visually displayed during testing for each horse. After
testing was complete, the saved data for each horse was manipulated in MATLAB to display the
proper positive and negative readings, and was then graphed in EXCEL in order to analyze the
results and compare to past test with the pneumotachograph. Figure 5.16 shows the graphical
results from each horse.

95
A.
B.
C.
Figure 5.16: A) Oliver clinical test results after manipulation in MATLAB; B) Missy test results
after manipulation in MATLAB; C) Ginger test results after manipulation in MATLAB
Oliver was the first clinical test subject. His breathing provided the cyclic patterns and
peaks expected in a horse’s respiratory pattern, but he was frightened by other horse’s in the area
causing him to whinny (spike at 23 seconds). His respiratory rate was also fast and irregular
compared to a sedated horse’s patterns. Missy was a smaller pony compared to Oliver and
Ginger, thus her lung capacity was smaller. She had lower peaks in her flow rate which was
-10
0
10
20
5 15 25 35 45 55 65Flo
w r
ate
(L/s
)
Time (s)
Oliver's Sample Data
-5
0
5
10
15
5 15 25 35 45 55 65
Flo
w r
ate
(L/s
)
Time (s)
Missy's Sample Data
-2
0
2
4
6
15 25 35 45 55 65 75 85 95 105 115 125
Flo
w r
ate
(L/s
)
Time (s)
Ginger's Sample Data

96
expected, but the data was also noisy due to the misalignment of the sensor in the housing during
testing. Lastly, Ginger had an ideal set of sample data. She was tested in the lung lab and was
slightly sedated, so she had a very consistent respiratory rate. Her resulting flow rate maximums
were comparable to past data from other horses of her size.

97
6.0 Final Design and Validation
6.1 Design validation
Our final functional design included several different components. Each working
component required separate testing and verification to determine success. This section discusses
how the testing for each component contributed to the overall functionality of the device and
how our objectives were met.
6.1.1 Calibration of the sensors
The first major component of our design was the calibration of the sensing element we
used to measure the airflow from the horse’s lungs. Successful calibration was essential because
it allows for accurate measurements to be made. The ISO/IEC 17025:2005 standard was
incorporated while calibrating the Rev C wind sensor for accuracy. This international standard
describes the requirements that calibration laboratories must follow to ensure competent testing.
It focuses on technical requirements that determine whether or not calibration tests are reliable
and correct, as well as management requirements that determine if a customer’s requirements
have been met (International Organization of Standardization, n.d.). Our sensor was calibrated by
performing a zero-point test. This placed the sensor in an environment with no airflow and gave
us our first point for a calibration curve. The zero-point test was also used to determine an
adjustment factor that is automatically incorporated into our LabVIEW test program.
6.1.2 Measuring airflow from breathing horse
Another important component to the success of our project was measuring airflow from a
breathing horse. These measurements are needed to analyze the lung function of a horse for
potential disorders. We measured airflow directly using the Rev C wind sensor from Modern
Device. The wind sensor measures air speed from the change in temperature that the horse’s
breath causes as it passes over a thermistor incorporated into the sensor.
After successful calibration, multiple tests were performed to confirm the wind sensor’s
function. The first was a basic test that involved blowing on the sensor to prove that it registered
the change in airflow. After confirming the sensor’s responsiveness, our zero-point testing was
done again to prove that our calibration was correct. Zero-point testing provided a no airflow
environment to change the adjustment factor in our LabVIEW program so the sensor reads
correctly at 0 MPH of wind. After zero-point testing was successful, high flow wind tunnel

98
testing was done so that known wind speed values could be compared with the sensor’s readings.
This testing allowed us to confirm the sensor was reading airspeed correctly at higher speeds
because the wind tunnel was calibrated linearly for wind speeds above 20 MPH. The wind tunnel
testing also showed the consistency of the sensor’s readings. To confirm the sensor could read
lower wind speed values, closer to those of a horse’s breath, we constructed a smaller scale wind
tunnel using a compressed air regulator. We were able to conclude that the sensor can read at low
flow speeds below 0.5 m/s. Additionally, we conducted breathing tests with human subjects that
compared the Rev C to the pneumotachograph, simultaneously. This further confirmed the Rev
C’s function at low wind speeds, as well as its ability to read cyclic data that breathing produces.
After manipulating the sensor data from wind speed to flow rate and accounting for the negative
inspiratory flow, the graphs for both devices aligned with each other, showing the similarities
between the readings. These tests verified that the Rev C can correctly read lower speeds similar
to that of a horse at rest and during exercise.
After testing was completed to determine the sensor’s function, the sensor, along with the
entire system, was ready to be validated by testing on horses. Three horses were tested with our
device. Two of the three horses were tested while unsedated in the stables of the hospital and the
last was mildly sedated because of a previous test. This is an improvement from the Fleisch
pneumotachograph which requires full sedation. Only one operator was required to perform
these tests compared to the multiple required for tests with the Fleisch pneumotachograph. The
results of these tests were comparable to past data collected in Open Pleth in terms of maximum
flow rate experienced and respiratory rate.
6.1.3 Displaying the lung function data
The last main component of our new device is the data acquisition and display.
Collecting and displaying data proved our sensor was working properly. LabVIEW was used to
acquire the data from the sensing element and to also display the data graphically. A simple
virtual interface developed in LabVIEW successfully allowed us to collect and save data during
our calibration and measuring phases. Our team was also able to successfully account for both
inspiration and expiration by manipulating the data in MATLAB after testing was complete
because the sensor only collects positive readings. Improvements were made during the course of
the project and our final program is able to not only collect and save data, but displays a graph of

99
the unmanipulated flow rate over time. Flow rate (L/s), speed in MPH and m/s, and volume (L)
data points are also displayed while the program is running. All of this data is exported and saved
in EXCEL for further signal manipulation after testing is complete.
6.1.4 Attachment of the device to the horse
Our team wanted to develop an improved attachment method for our new device design.
The pneumotachograph attaches to a bulky, plastic mask that goes almost half way up the horse’s
muzzle. The sensor we used was capable of having a significantly smaller housing than the
pneumotachograph. The housing used in our prototype is a simple, cylindrical rubber coupling
that is 1.5 in. in diameter and 3.4 in. in length. An insert for the Rev C was cut into the coupling
and a rubber stopper was attached to the coupling so that the sensor would rest in the stream of
airflow. The coupling inserts into the current mask and protrudes only 2.5 in., decreasing the
overall size by 80%. The housing also decreased in weight by 90%, weighing only 0.32 lbs. This
design worked successfully in holding the sensor and attaching to the current mask while also
decreasing the overall weight and size.
6.2 Impact of Device
6.2.1 Economics
Horses are expensive; they require special accommodations and veterinary care.
Respiratory disorders are a common occurrence in horses and having a less expensive and easy
way to test pulmonary function could save a horse owner’s money. A less expensive option also
makes the device more available to practicing equine veterinarians. Currently, Cummings school
is one of few facilities that has access to the Fleisch pneumotachograph device. By creating a
less expensive and easy to use device, the market would expand to other veterinarians around the
country, potentially resulting in more diagnoses and higher treatment rates for horses with
pulmonary disorders. The market for pulmonary testing could also expand beyond race and sport
horses who often receive top of the line veterinary care. As an economic downside, however, a
non-invasive and less expensive device could make invasive methods less common, taking
business away from specialists that perform those kinds of procedures.

100
6.2.2 Environmental Impact
Compared to invasive methods to test an equine’s lung function, our non-invasive device
would produce less medical waste. Traditionally, an esophageal balloon is placed in the
esophagus to measure pleural pressure to diagnose pulmonary disorders. The balloon and small
tubing that are used in this method are then disposed of after the procedure is complete. Another
common lung function testing procedure, Bronchoalveolar Lavage (BAL), utilizes a
bronchoscope that is placed in the lungs and fluid samples are collected and analyzed. The fluid
collected from this procedure must be properly disposed of, creating biohazardous waste. The
waste generated from these invasive procedures would negatively impact the environment. Our
device, however, minimizes waste because it is non-invasive, sterilizable, and reusable, reducing
negative environmental impacts. Additionally, our device is much smaller than the current
Fleisch pneumotachograph, therefore less chemicals are required to clean the device.
6.2.3 Societal Influence
A non-invasive and less expensive pulmonary testing device for horses could result in
healthier horses. Currently, sport or race horses might receive more diagnoses and treatments for
respiratory disorders because they are expected to perform well and their owners can easily
afford or prioritize veterinary care. With a new device, more horse owners could have access to
improved care and a healthier horse.
6.2.4 Political Ramifications
Our product not only can be used for lung function testing in equines, but for non-
compliant humans such as those in emergency cases or infants. By expanding from veterinary
use, the global market would be positively influenced because of the increase in potential users
around the world. Looking at the veterinary market specifically, we performed a marketability
study, where we asked veterinarians and horse owners a list of questions about respiratory
disorders in horses and their willingness to pay and or use a non-invasive testing device.
Appendix O includes a list of questions we asked horse owners and Appendix P includes the
questions we asked veterinarians. From this study, we found that 30% of horse owners have had
a horse with a respiratory disorder and a majority of horse owners were willing to pay over $150
for equine lung function testing if they thought their horse may have a respiratory disorder.
Appendix Q shows the complete results of this study in pie graph form. The respondents were

101
limited to horse owners we knew and people they passed the survey onto, so this study had fewer
respondents from a smaller region compared to the veterinarian study.
The veterinarians, who were surveyed around the country, also responded positively
about their willingness to use the device, but most were not willing to spend a significant amount
of money on the device. This need for less expensive diagnostic tools is one objective that our
device will meet, thus making it more accessible to veterinarians, especially individual travelling
veterinarians or small practices who have limited financial resources. Appendix R shows the
overall results of the veterinarian survey, Appendix S displays the results broken down by
region.
For both the veterinarian and horse owner surveys, some questions used the scale of 1 to
5 in terms of time, where 1 was never and 5 was weekly. These surveys did prove that there was
a market for a non-invasive device in the United States, but it also suggested the device needs to
be significantly less expensive than the current device to make it more available. We did not
survey any veterinarians outside of the United States, but other countries that regularly practice
equine sports could also benefit from improved veterinary diagnostic equipment. This would
expand the market for our device globally and improve the standard of equine veterinary care as
well.
6.2.5 Ethical Concerns
Our device could aid in diagnosing pulmonary disorders in racehorses. This could help
improve the care and lives of horses performing at high levels. However, our device could also
be indirectly linked with the horse racing industry. Although horse racing is designed to be
elegant and showcase a horse’s skill, there are some ethical concerns associated with the sport
including drug abuse, injuries, and slaughter of horses.
6.2.6 Health and Safety Issues
Compared to the original Fleisch pneumotachograph, our device is physically smaller and
lighter with a more secure attachment method, decreasing the probability that it would become a
projectile during testing. This decreases the risk of serious injury of all personnel in the testing
room. Additionally, because our device requires non-invasive techniques for operation, the
complications and pain that the horse might experience during invasive tests are minimized.

102
6.2.7 Manufacturability
The final design, in terms of manufacturability, can be streamlined due to easily
accessible components. There are two basic components: electrical and housing. The electrical
component consists of the wind sensor and wires. The assembly process for the electrical
component only requires one step because of the wind sensor’s established circuitry; solder four
wires onto the sensor. The final cylindrical housing would be rapid prototyped to incorporate the
desired diameter and length as well as a slot for the sensor.
6.2.8 Sustainability
In an effort to promote sustainability with our design, we have chosen to use electricity at
a low voltage to power our device, at only 5 volts. In addition, we have chosen to use a rubber
coupling for our housing that can be repurposed later on if the device is disposed of. Our final
device also creates minimal waste as described in 6.2.2, and can be reused for testing on horses.
Due to the durability of the materials chosen and its multi-use design, the final device should last
a long time and under proper use should not require frequent part replacements.

103
7.0 Discussion
Our project was designing a prototype of a new, non-invasive, small, lightweight, low
cost, and accurate equine lung function testing device. The current gold standards for equine lung
function testing are invasive, complicated procedures that most veterinarians perform as a last
resort. The only non-invasive device in New England includes a Fleisch pneumotachograph that
measures pressure drop across a 2.5 in. diameter and 1.5 in. length, stainless-steel, capillary bed.
This device is heavy (3 lbs.) and extends off the horse’s muzzle approximately 12 in. It also
provides too much resistance to the horse’s breathing to be used during exercise. Our design
improves upon the size, weight, availability, and resistance of the current device.
7.1 Choosing an appropriate sensing element
The first task was to choose a feasible way to measure airflow from a breathing horse that
would be more accurate than the current device, but also smaller and significantly less expensive.
A new sensing element would improve the device’s availability and safety for the user. The hot-
wire anemometry concept, specifically using a thermistor-based Modern Device Rev C Wind
Sensor, was determined to be the most feasible design choice because of its ability to measure
low airflow rates, compared to alternative designs we considered. Measuring low flow rates was
important because horses breathe at flow rates lower than most calibrated flowmeters are capable
of measuring. Most flowmeters on the market claim to measure in ranges that include low flow
rates, but are calibrated at higher speeds, resulting in inaccuracies at the lower speed ranges. This
made testing our sensing element at lower speeds critical to determine its feasibility for our final
device.
The Rev C sensor was also a good choice for our design because it was significantly
smaller and lighter than the Fleisch pneumotachograph used in the current device. The Rev C
measures approximately 0.7 in. by 1.6 in., largely contributing to our ability to reduce the size
and weight of our new design.
7.2 Sensor calibration
In order to ensure the device could accurately measure low wind speeds, it was calibrated
at a range of flows. All initial tests were conducted at 0 MPH, achieved by covering the sensor
with a glass bowl, to ensure that the sensor read the appropriate value. Modern Device created
the sensor with a corresponding calibration equation. The calibrated equation included a zero-

104
wind adjustable correction factor to ensure the sensor accurately read 0 MPH. This correction
factor is based on the environmental conditions the sensor is in. Without changing the adjustment
factor, the sensor initially read slightly above 0 MPH. We believe this is due to a combination of
air movement in the room that seeped through a gap between the bowl and table and the voltage
used to initially calibrate the sensor during manufacturing. From the results of the zero-point test,
we were able to determine what the correction factor should be at various voltages so the sensor
read 0 MPH. We then programmed a calculation for this correction into the final program so that
it did not need to be manually changed for each test. Calibration is an important process to
ensure that the results obtained are accurate. The calibration method for our device is more
consistent than the current device’s calibration which relies heavily on a known volume supplied
by a human operated 3 L calibration syringe. Our device uses an automated program which
removes sources of potential human error, decreases the amount of time needed for calibration,
and improves repeatability between tests.
7.3 Sensor function verification
Since a device cannot be fully calibrated with a single datum point, additional data was
required for our initial calibration. We thought that testing in the Aerospace department’s wind
tunnel would be an ideal way to calibrate the sensors at varying known wind speeds, but when
we performed initial tests with the Rev P sensor, we found large discrepancies in the reading
between the wind tunnel and the Rev P sensor. We believed the discrepancy in the Rev P sensor
compared to the wind tunnel readings may be due to the inaccurate calibration of the wind tunnel
at low wind speeds. The wind tunnel was calibrated using a water manometer and at low wind
speeds no change in height of the water can be detected. There is no discernible change until the
wind tunnel is set above approximately 20 MPH. The calibration for the wind tunnel is assumed
to be linear, since it is linear in the high speed measurable region, but this may not be accurate
for lower speeds. We created several calibration equations from the collected data and conducted
another wind tunnel test with the Rev P, but it still did not read the values accurately.
However, when testing the Rev C in the wind tunnel, it was able to accurately read the set
high wind speed values and had a strong linear fit. Like the Rev P, the Rev C was not able to
accurately read lower flow values, agreeing with our hypothesis about the wind tunnel’s
calibration not being linear at lower speeds. Because the Rev C matched with the higher speed

105
values, we pursued testing with that sensor over the Rev P.
Since the calibration is unknown at these low wind speeds and there was no readily
available way for us to accurately prove the wind tunnel’s calibration, we were still left with the
problem of needing more than one known datum point for proper calibration of the sensors. To
produce these known low wind speeds, we constructed a low flow wind tunnel to produce a
steady, fully developed, laminar flow environment of different wind speeds depending on the
regulated pressure. To compare the Rev C’s reading, both a hot-wire anemometer probe and a
Hold Peak handheld anemometer were used during testing. The handheld anemometer was
inconsistent and unable to measure the low flows. We tested the Rev C against the hot-wire
probe and obtained comparable readings with both sensors for flows less than 0.5 m/s. This data
confirmed that the Rev C functioned at low speeds, similar to what a horse’s breathing would
produce.
The device not only needs to be able to accurately measure low wind speeds, but also
differentiate between inspiratory and expiratory flow. This cyclic flow pattern was modeled with
a 4.07 L PVC syringe. The sensor accurately produced peaks within the range of the handheld
anemometer’s readings and it had both valleys and peaks that corresponded to the cyclic
movement of the syringe.
After verifying the sensors response to low flows and cyclic flows we compared the
Fleisch pneumotachograph and Rev C simultaneously with a breathing test to verify that the Rev
C sensor is not affected by the temperature differences between inhaled and exhaled breaths or
the moisture content. The results of this breathing test showed the Rev C and pneumotachograph
function was similar suggesting that the Rev C is not significantly affected by the unique
properties of breathing.
Through the verification of the Rev C sensor, we were able to prove that it can accurately
read low wind speeds and differentiate between inspiratory and expiratory flow, which is critical
for a properly functioning equine lung function testing device. Accurate calibration and function
testing are not sufficient to prove that the device operates properly in a clinical environment, so
clinical tests were conducted to validate the sensor’s function in this setting.

106
7.4 Clinical testing
To ensure the device was reduced in length and weight, both the new device and the
Fleisch pneumotachograph were measured and weighed. It was determined that the new device
was approximately 90% lighter and 80% shorter than the current. This proved that we met the
sponsors need for a shorter and lighter device to improve the safety for the human operators.
This decrease in size also minimizes the number of people required to perform the test, making it
more accessible to small veterinary clinics that lack the necessary staff Cummings School has
available to perform a test with the Fleisch pneumotachograph.
The test that ultimately proved our device met all of our sponsor’s needs and functioned
properly was a clinical trial on horses. After testing our device, we determined that the Rev C
operates properly because it produced a cyclic flow pattern and the peak flow rates it collected
were between 3 and 5 L/s, as expected for a horse based on previous data acquired in Open Pleth.
In addition, our device was tested on unsedated stabled horses with no concerns, unlike the
Fleisch pneumotachograph. Also, while testing our device, only one operator was required to
hold it, compared to multiple people required to hold the Fleisch pneumotachograph. During our
test an operator had to hold the device because the straps on the horse’s facemask were not
available. If the straps were available there is the potential our device would not require any
operators to hold it. This saves both time and money for the veterinarian and for veterinary
clinics.
7.5 Limitations
Our team was able to successfully meet most of our design objectives. However, even
with all of these improvements, the device still has limitations. Currently, the LabVIEW software
the sensor interfaces with needs to be directly connected to the sensor via a DAQ box, so the
device cannot be used on an exercising horse unless it is on a treadmill. The long wires cause a
potential tripping hazard for the human operators and horse. The requirement of an external
power source for the device limits its portability and ability to be used onsite. Another limitation
for usability onsite are the unforeseen weather conditions (rain, snow, fog, high winds) and its
effect on the circuitry. Currently part of the wind sensor rests outside of the attachment and
raises a durability concern as it is possible that the sensor could sustain permanent damage and
fail to function. Additionally, the LabVIEW software for data acquisition is potentially too

107
expensive for small veterinary clinics to afford, which reduces the device’s accessibility. Another
limitation is the difficulty to diagnose with just the wind sensor because the current diagnostic
method depends on the comparison between the RIP band signals and the Fleisch
pneumotachograph and our device does not include the RIP bands.

108
8.0 Conclusions and Recommendations
8.1 Conclusions
Using Modern Device’s Rev C Wind Sensor housed in a rubber coupling, a National
Instruments DAQ box, and LabVIEW, we were able to successfully prototype an improved non-
invasive device to measure equine lung function, detect abnormalities in airflow, and diagnose
horses with subclinical pulmonary obstruction disorders. Our device provided an improved
alternative to the current device that uses a Fleisch pneumotachograph because ours is much
safer for the human operators. The design met our objectives of being less expensive, smaller,
and lighter than the Fleisch pneumotachograph, therefore minimizing risk of injury for the
human user. Additionally, our device is non-invasive, compatible with non-compliant breathing,
and minimizes resistance to the horse’s breathing. It also remained non-invasive which is safer
and more comfortable for the horses being tested with the device. We created a LabVIEW
program that acquires and displays flow and volume data, and we created a MATLAB program
that accounts for inspiratory and expiratory flow. This was necessary because most anemometry
devices require more than one sensor to measure flow in two directions. The whole system
proved feasible through clinical testing on horses. Additionally, our device significantly reduces
the cost of pulmonary testing, making it accessible to equine veterinarians beyond the ones at
Cummings School.
Initially, four alternative design concepts were developed and their feasibility were
assessed using velocity and pressure cut plots created in SolidWorks’ Flow Simulations.
Additional calculations were completed to further assess each design concept. Three out of the
four alternative designs were ruled out either because they would drastically increase resistance,
cause significant eddying and have a delayed response time that limits accuracy, or cannot
accurately measure lower wind speeds similar to a horse’s breath. With further research, we
decided that thermistor-based sensors were most feasible. They work similarly to the hot-wire
anemometer concept, one of our four alternative designs, only they are less fragile and less likely
to be affected by moisture. Therefore, both the Rev C and Rev P wind sensors from Modern
Device were purchased. However, the Rev C proved to be more accurate at lower wind speeds
and was further pursued.
Zero-point testing on the Rev C was completed to properly calibrate the sensor so that it

109
could consistently and correctly measure data. After we verified that the sensor was functional at
higher speeds using a high-speed wind tunnel and functional at lower speeds using our low flow
wind tunnel; breathing tests from human subjects were completed to compare the
pneumotachograph reading to the sensor’s reading. Results from this test also verified that the
Rev C was capable of working at lower wind speeds. After sensor verification testing, we moved
to clinical testing on horses. This testing confirmed our device worked as desired and meets our
main objectives described above.
Overall, our device can successfully measure equine lung function. However, our team
did face a major setback when trying to verify our sensing element, costing us time we could
have spent improving other aspects of our design. This setback was due to the limited availability
of flowmeters calibrated to read low flow rates. Our team had to purchase or acquire multiple
types of flowmeters before finding one that read accurately at low flows and could be used to
calibrate and help verify our sensor’s readings. Eventually, we were able to move past this
roadblock and focus on other aspects of our design so the device could be used for clinical
testing.
8.2 Recommendations
Due to time constraints and limited resources, there were a few recommendations our
team had to further improve our device. These concepts are discussed in the following sections.
8.2.1 Improved sensor housing
Currently, the sensor circuitry is exposed outside of the housing. This exposure can cause
the sensor circuitry to not function as intended due to external environmental factors and it
increases the likelihood of damage. We recommend a protective covering for the sensor circuitry
consisting of rubber with a slot for the sensor to be inserted and removed from that can close
during testing. The protective covering would be attached to the current rubber housing.
Additionally, rapid prototyping a housing with a more precise slot and wire rest would be ideal
to ensure the sensor does not move during testing. The protective covering mentioned above
could also be incorporated into this design. This would make the housing a more rigid, but still
lightweight, one-piece device that would be less fragile and would support and protect the sensor
better.

110
8.2.2 Improved mask design
The pneumotachograph attaches to a transparent plastic mask with rubber components
that slides onto the horse’s muzzle and covers approximately half of the horse’s face. Our device
is housed in a 1.5-inch diameter rubber coupling that attaches to the current mask. However, the
current mask is bulky, large, and has a protrusion off the front to attach the pneumotachograph.
Due to a lack of time our team could not create a new mask, but CT scans of a horse’s head were
obtained. These scans could be used to design a mask that fits the horse’s face better and directly
incorporates the Rev C sensor. The current mask’s protrusion could easily be eliminated with the
new sensor, given its small size. We recommend an improved mask be made to better
accompany the Rev C sensor and to continue increasing comfort for the horse.
8.2.3 Improved signal processing
The Rev C sensor only produces positive wind speed readings, so the flow rate versus
time graph it produces, although correct, does not display in a way that is easily understandable
for veterinarians because it is not what they are used to seeing when making diagnoses. This data
can be manipulated in MATLAB after testing is complete, but ideally it would be processed real-
time, so the running display can be used for diagnosis. In order to do this, a second functioning
calibration program would need to be incorporated into the software. This program would find
the appropriate shift factor for the horse being tested and then automatically incorporate it into
the test program, using the same method as the zero-wind adjustment factor.
In addition to correcting the flow rate over time display, the veterinarians would like a
display of a flow-volume loop that has the expected butterfly shape horse breathing generates.
This would require making the XY chart used for the flow-volume loop dependent on time
without time being an axis of the graph. If this graph is dependent on time, the data can be
viewed over the same time interval as the flow rate over time graph thus showing only a given
segment of the graph. This would allow the proper shape to be seen because a smaller scale
would be analyzed at a time. The current display appears to be a straight line, but there are
changes in the data that cannot be seen because of the scale. After making this graph time
dependent these changes should produce the expected shape because the y-scale will be more
appropriate for viewing the change.
Lastly, a table of critical values should be displayed during testing. This table should

111
include the start and end time of each breath, the breathing rate, the dosage of histamine
administered, the delta flow, the tidal volume, theta (the angle between the abdomen and thorax
signal produced by the RIP bands), the peak inspiratory flow, the peak expiratory flow, the
inspiratory time, and the expiratory time. Further data processing will need to be programmed
into the LabVIEW program to produce these values and display them in a table form. Others
such as histamine dosage will need to be incorporated as a user input during testing. Lastly, theta
cannot be found until the RIP bands are incorporated into the program and the voltage of both
are graphed against each other with abdomen on the y-axis and ribcage on the x-axis.
8.2.4 Incorporating RIP bands
Veterinarians are able to diagnose pulmonary disorders with the current device from
overlaying signals of the Fleisch pneumotachograph and the RIP bands. Currently the RIP bands
are not integrated within our LabVIEW program, which means a veterinarian would have
difficulties diagnosing pulmonary disorders with only our device. To integrate the RIP bands, we
recommend a RLC (resistance-inductance-capacitance) circuit following the design in US-
4,308,872 patent (Watson, Sackner, & Stott, 1982). The LabVIEW test program would also have
to be updated to incorporate acquired signals from the RIP bands. This updated should include
the overlaying of the RIP band and Rev C flow rate over time signals and a delta graph that
shows the difference between these signals over time.
8.2.5 Wireless sensing
Our device is much smaller and provides less resistance to breathing than the current
device, making it more ideal for use with exercising horses. Unfortunately, our device still
incorporates wires to power the device and acquire the data from the sensor. In the future, we
would like the device to be made completely wireless, using battery power and wireless data
collection, so that veterinarians can easily use the device at barns or on racetracks. This could
make the horses feel more comfortable if they are being tested at home. A wireless device could
also be a better diagnostic tool because it could be used on exercising horses as well as resting
horses, allowing veterinarians to compare lung function at different levels of exertion.
8.2.6 Improved test program
LabVIEW is used with the device we designed. LabVIEW allowed for easy
customization when going through the process of building our data acquisition program, but

112
could be expensive for some veterinarians to acquire. Also, LabVIEW is a proprietary software
that requires compliance with their license agreement in order to distribute and sell our device
with our LabVIEW program. Due to their restrictions, we recommend that a software program be
developed using a different platform than LabVIEW that is less expensive, able to sell without
restrictions, and has improved user interface features. It would also be ideal if the software
program is adaptable for mobile applications which would work well with a wireless device and
enhance portability.
8.2.7 Continued clinical testing
Clinical testing was done on three horses with our device. Although our results suggested
the device worked properly, more testing would help confirm its functionality. We suggest that
the clinical tests include comparing our device to the Fleisch pneumotachograph on the same
horses in the same conditions to confirm our device is comparable to the pneumotachograph.
Further testing would also provide us with more data which could be used to better determine the
accuracy of our device.
8.2.8 Humidity/moisture study
One concern we had with using a thermal-based sensing element was the effect that
humidity and moisture could have on the sensor’s readings. This is especially a concern since a
horse exhales humid air that will condensate on the sensor. During our testing on horses, the
sensor’s readings did not appear to be affected by the moisture in the horses’ breaths. However,
conducting a study to specifically control for the effects of humidity on Rev C sensors would be
beneficial to further confirm that humidity does not affect the readings of the sensor. If it is
determined that humidity has a significant effect on the sensor’s performance, a correction
should be incorporated into the LabVIEW program to account for this effect.
8.2.9 Veterinarian feedback
Our team had hoped to interview multiple veterinarians after they used the device. Due to
time constraints this did not happen, but would be beneficial to do in the future. Veterinarian
feedback would provide insight to parts of the device that function well or make it easy to use as
well as areas that are difficult to use or are not working as expected. This information would
highlight improvements that would benefit the veterinarians using the product.

113
References
Advanced Thermal Solutions Inc. (2007). Understanding Hot Wire Anemometry. [Pamphlet].
Norwood, MA: Thermal Solutions.
American Lung Association. (2016). How lungs work. Retrieved from http://www.lung.org/lung-
health-and-diseases/how-lungs-work/lung-capacity-and-
aging.html?referrer=https://www.google.com/
American Thoracic Society. (2009). Lung Function Studies: Methacholine Challenge Test. Am J
Respir Crit Care Med. 180 (3-4).
American Veterinary Medical Association. (2015). Confidentiality of veterinary patient records.
Retrieved from https://www.avma.org/Advocacy/StateAndLocal/Pages/sr-confidentiality-
patient-records.aspx
Araujo, G. A. L., Freire, R. C. S., Silva, J. F., Oliveira, A., & Jaguaribe, E. F. (2004, May).
Breathing flow measurement with constant temperature hot-wire anemometer for forced
oscillations technique. In Instrumentation and Measurement Technology Conference,
2004. IMTC 04. Proceedings of the 21st IEEE (Vol. 1, pp. 730-733). IEEE.
Bailey, S. C. C., Hultmark, M., Monty, J. P., Alfredsson, P. H., Chong, M. S., Duncan, R. D., ...
& Nagib, H. M. (2013). Obtaining accurate mean velocity measurements in high
Reynolds number turbulent boundary layers using Pitot tubes. Journal of Fluid
Mechanics, 715, 642.
The British Horse Society. (2011). Advice on horse respiratory health. [Leaflet] Warwickshire,
England.
Chen, T., Wang, Q., Zhang, B., Chen, R., & Chen, K. P. (2012). Distributed flow sensing using
optical hot-wire grid. Optics express, 20(8), 8240-8249.
Chen, Y. R. (2016). Characterization of cup anemometer dynamics and calculation of the
acoustic noise produced by a nrel phase VI wind turbine (Doctoral dissertation, Case
Western Reserve University). Retrieved from
https://etd.ohiolink.edu/!etd.send_file?accession=case1459427530&disposition=inline
Crabbe, B. (2007). The comprehensive guide to equine veterinary medicine. Sterling Publishing
Company.
Cummings Veterinary Medical Center. (2016). Melissa Mazan DVM, DACVIM. Retrieved from

114
http://vetprofiles.tufts.edu/doctor/melissa-mazan.
Davis, S. (2013). How does the Equine Respiratory System Work. FlexinebTM North America.
Erickson, D., O'Dell, D., Jiang, L., Oncescu, V., Gumus, A., Lee, S., ... & Mehta, S. (2014).
Smartphone technology can be transformative to the deployment of lab-on-chip
diagnostics. Lab on a Chip, 14(17), 3159-3164.
Erickson, H. H., Goff, J. P., & Uemura, E. E. (2004). Dukes' physiology of domestic animals
(Vol. 512). W. O. Reece (Ed.). Ithaca, NY: Cornell University Press.
Farnell Ltd. (2016). FS5.0.1L.195 innovative sensor technology. Retrieved from
http://uk.farnell.com/ist/fs5-0-1l-195/sensor-flow-gas/dp/1778049
Funda, D. (2010). Hot wire measurements [PDF document]. Retrieved from
http://ocw.metu.edu.tr/course/view.php?id=66
Gordon, J. (2009). The horse industry contributing to the Australian economy. A report for the
Rural Industries Research and Development Corporation, RIRDC publication 01/83
RIRDC project no CIE-9a.
Granta Design Limited. (2016). CES EduPack [Computer software]. Cambridge, United
Kingdom.
Gudmundsson, S. (2013). General aviation aircraft design: Applied Methods and Procedures.
Butterworth-Heinemann.
Hausberger, M., Roche, H., Henry, S., & Visser, E. K. (2008). A review of the human–horse
relationship. Applied Animal Behaviour Science, 109(1), 1-24.
Hoffman, A. M. (2002). Clinical application of pulmonary function testing in horses. Equine
respiratory diseases international veterinary information service Ithaca, Document No B,
3040802.
Hoffman, A. M., Mazan, M. R. (1999). Programme of lung function testing horses suspected of
small airway disease. Equine Veterinary Education, 11(6), 322-328.
Howell, D. (2011). Horse clip art. Retrieved from
http://orig12.deviantart.net/bcc9/f/2011/152/f/a/horse_clip_art_by_soulhavennz-
d3hr8sk.png
IEEE, (2014). 2700-2014 - IEEE Standard for Sensor Performance Parameter Definitions.
Retrieved from http://ieeexplore.ieee.org/document/6880296/

115
International Organization of Standardization. (n.d.). ISO- International Organization of
Standardization. Retrieved from http://www.iso.org
Knapp, W. R., Holt, D. A., & Lechtenberg, V. L. (1975). Hay preservation and quality
improvement by anhydrous ammonia treatment. Agronomy Journal, 67(6), 766-769
Kramme, R., Schlegelmilch, R. M., (2011). Springer Handbook of Medical Technology:
Pulmonary Function Testing. Berlin: Springer.
Kristensen, L., Hansen, O., Hansen, S. (2014). The working of the cup anemometer. Retrieved
from
http://www.windsensor.com/application/files/8814/2694/4640/The_Working_of_the_Cup
_Anemometer_20140619.pdf
Kusano, K., Ishikawa, Y., Kazuhiro, S. E. K. I., & Kusunose, R. (2008). Characteristic of
inflammatory airway disease in Japanese Thoroughbred racehorses. Journal of equine
science, 19(2), 25-29.
Kutasi, O., Balogh, N., Lajos, Z., Nagy, K., & Szenci, O. (2011). Diagnostic approaches for the
assessment of equine chronic pulmonary disorders. Journal of Equine Veterinary Science,
31(7), 400-410.
Marieb, E. & Hoehn, K. (2012). Human anatomy and physiology (9th ed.). Boston, MA:
Pearson.
Mazan, M. R., & Hoffman, A. M. (2003). Clinical techniques for diagnosis of inflammatory
airway disease in the horse. Clinical Techniques in Equine Practice, 2(3), 238-257.
McCall, C. A. (1990). A review of learning behavior in horses and its application in horse
training. J. Anim. Sci, 68, 75-81.
McMaster-Carr. (2016). Noncontact tachometers. Retrieved from
http://www.mcmaster.com/#noncontact-tachometers/=14jlom7
Midland Hardware: Lawn & Garden Plumbing Electrical Tools. (2016). K & S aluminum tube
1/16 in. 8100. Retrieved from
http://www.midlandhardware.com/642926.html?gclid=Cj0KEQjwvve_BRDmg9Kt9ufO1
5EBEiQAKoc6qrzhFTpqLs5a2yyq3k
Modern Device. (2016). Wind sensor rev p- low cost anemometer. Retrieved from
https://moderndevice.com/product/wind-sensor-rev-p/

116
Molecular Products Ltd. (n.d.). Technical article: A Guide to Breathing Rates in Confined
Environments. Retrieved from http://www.molecularproducts.com/pdf/technical-
library/A%20Guide%20to%20Breathing%20Rates%20in%20Confined%20Environments
%20Technical%20Article.pdf
Moore, J. E., Millar, B. C., Matsuda, M., & Buckley, T. (2003). Human infections associated
with horse bites. Journal of Equine Veterinary Science, 23(2), 52-54.
Myers, W., Bass, P. (2010). A Physical Exam for Asthma Diagnosis. Retrieved from
http://www.everydayhealth.com/asthma/physical-examination-for-asthma.aspx
National Instruments. (2016a). Buy LabVIEW. Retrieved from http://www.ni.com/labview/buy/
National Instruments. (2016b). NI USB-6000. Retrieved from http://www.ni.com/en-
us/support/model.usb-6000.html
Omega. (n.d.). The strain gage. Retrieved from
http://www.omega.com/literature/transactions/volume3/strain.html
Ozaki, Y., Ohyama, T., Yasuda, T., & Shimoyama, I. (2000, January). An air flow sensor
modeled on wind receptor hairs of insects. In Micro Electro Mechanical Systems, 2000.
MEMS 2000. The Thirteenth Annual International Conference on (pp. 531-536). IEEE.
PetWave. (2015). Diagnosing asthma (allergic bronchitis) in dogs. Retrieved from
http://www.petwave.com/Dogs/Health/Asthma/Diagnosis.aspx
Pharmacopeia, U. S., (2009). USP-NF. US Pharmacopeia.
Pharmacopeia, U. S., (2014). General chapter< 797> pharmaceutical compounding–sterile
preparations is revised and finalized.
Preuschoft, H., Witte, H., Recknagel, S., Bär, H., Lesch, C., & Wüthrich, M. (1999). Effect of
common head gear on horses. DTW. Deutsche Tierarztliche Wochenschrift, 106(4), 169-
175.
Pusterla, N., Watson, J. L., & Wilson, W. D. (2006). Diagnostic approach to infectious
respiratory disorders. Clinical Techniques in Equine Practice, 5(3), 174-186.
Raven, M. & Rashmir-Raven, A. (1996). Equine Science Instructional Materials. Madison, WI:
The National Council for Agricultural Education
Robinson, N. E. (2003). Inflammatory airway disease: defining the syndrome. Conclusions of the
Havemeyer Workshop. Equine Veterinary Education, 15(2), 61-63.

117
Robinson, N. E., Derksen, F. J., Olszewski, M. A., & Buechner-Maxwell, V. A. (1996). The
pathogenesis of chronic obstructive pulmonary disease of horses. British Veterinary
Journal, 152(3), 283-306.
Rozanski, E. A., & Hoffman, A. M. (1999). Pulmonary function testing in small animals.
Clinical techniques in small animal practice, 14(4), 237-241.
Sanchez, A., Couetil, L. L., Ward, M. P., & Clark, S. P. (2005). Effect of airway disease on
blood gas exchange in racehorses. Journal of Veterinary Internal Medicine, 19(1), 87-92.
Saylor Academy. (2011). Anemometer. Retrieved from https://www.saylor.org/site/wp-
content/uploads/2011/04/Anemometer.pdf
Scope, I. I., Contraindications, B., & Training, C. T. (1999). Guidelines for methacholine and
exercise challenge testing—1999. American Journal of Respiratory and Critical Care
Medicine, 161(1).
Shiner, R., Steier J., (2012). Lung Function Tests Made Easy. Churchill Livingstone.
Sigma-Aldrich, (2016). Tungsten wire, diam 0.25 mm >= 99.9% trace metals basis.
Retrieved from
http://www.sigmaaldrich.com/catalog/product/aldrich/267554?lang=en®ion=US
Schwartz, M. M. (2003). Brazing. ASM international.
U.S Food and Drug Administration. (1995). CPG Sec. 607.100 - adequate directions for use
(species designation) -animal drugs and veterinary devices. Retrieved from
https://www.fda.gov/ICECI/ComplianceManuals/CompliancePolicyGuidanceManual/uc
m074652.htm
Verbeek, C., Zanten, H. A., Vonderen, J. J., Kitchen, M. J., Hooper, S. B., & Pas, A. B. (2016).
Accuracy of currently available neonatal respiratory function monitors for neonatal
resuscitation. European Journal of Pediatrics, 1-6.
Vitalograph. (2016). The Fleisch pneumotachograph. Retrieved from
https://vitalograph.com/education/fleisch
Watson, H. L., Sackner, M. A., & Stott, F. D. (1982). U.S. Patent No. 4,308,872. Washington,
DC: U.S. Patent and Trademark Office.
Wood, J. L. N., Newton, J. R., Chanter, N., & Mumford, J. A. (2005). Inflammatory airway
disease, nasal discharge and respiratory infections in young British racehorses. Equine

118
veterinary journal, 37(3), 236-242.
Young, D. F., Munson B. R., Okiishi, T. H., & Huebsch, W. W. (2011). A brief introduction to
fluid mechanics (5th ed.). United States of America: John Wiley & Sons, Inc.
Yu, C., Tsai, T. H., Huang, S. I., & Lin, C. W. (2013). Soft stethoscope for detecting asthma
wheeze in young children. Sensors, 13(6), 7399-7413.

119
Appendix A: Gantt charts for each seven-week project segment
Figure A.1: Aterm Gantt chart

120
Figure A.2: BTerm Gantt chart

121
Figure A.3: CTerm Gantt Chart

122
Appendix B: MQP project expenses and budget
Table B.1: Detailed MQP budget
MQP Budget
Total Budget $1,000.00 $0.00 $662.74
Total Spent $662.74 $0.00 $1,000.0
0
You're under budget by $337.26
Item
Des
crip
tio
n
Co
st
Qty
Am
ou
nt
No
tes
Nee
d
Rei
mb
urse
men
t?
MANOMETER
Tubing $0.00 5 ft. $0.00 in lab N
Wood $0.00 2 ft. $0.00 N
Zip ties $0.00 6 $0.00 in lab N
Water $0.00 2 cups $0.00 in lab N
Food coloring $0.00 3 drops $0.00 in lab N
Nails $1.30 1 unit $1.30 Y
SYRINGE
4" PVC pipe $7.53 1 $7.53 Y
2-240 O-rings $6.97 1 unit $6.97 N
Aluminum stock Metal for piston $53.71 6 in $53.71 N
End cap $2.08 1 $2.08 Y
4" x 2" coupling $6.38 1 $6.38 Y
Gorilla glue $6.58 1 $6.58 Y
Wooden dowel 0.75 in diameter $2.98 1 $2.98 Y
DEVICE WITH STRAWS
Coffee stirrers $4.90 1 unit $4.90 Y
Liter soda bottle? $0.00 1 $0.00 N
Tubing for pressure drop $0.00 2 ft. $0.00 in lab N

123
FINAL DESIGN
Wind sensor Rev-P Modern Device $24.00 2 $48.00 N
Attachment 3D print
Wires GH 007 $0.00 20 ft. $0.00 in lab N
DAQ Box NI USB-6000 $150.00 1 $150.00 N
Wind sensor Rev-C Modern Device $17.00 1 $17.00 N
K-type Thermocouple $20.80 1 $20.80 N
Electric wire $9.14 50 ft. $9.14 N
5V Supply $7.52 1 $7.52 N
1.5" rubber coupling $3.90 1 $3.90 Y
Screw driver set For DAQ box $5.59 1 $5.59 Y
WIND TUNNEL
Regulator and filter $58.18 1 $58.18 N
1/4 Connector $7.62 1 $7.62 N
Coupler $3.05 1 $3.05 Y
5/8" Quick connect $4.44 1 $4.44 N
3"X2" PVC pip $6.85 2 $13.70 Y
3"X2" Flex coupling $6.68 1 $6.68 Y
3" Coupling $1.51 1 $1.51 Y
Hot Wire $104.45 1 $104.45 N
1.5"-1.25" straight reducer $1.53 1 $1.53 N
1.25"-1" straight reducer $1.44 1 $1.44 N
1"-0.75" straight reducer $0.86 1 $0.86 N
0.75"-0.5" straight reducer $0.50 1 $0.50 N
1.5" socket connect female $0.71 1 $0.71 N
1.25" socket connect female $0.67 1 $0.67 N
1" socket connect female $0.48 1 $0.48 N
0.75" socket connect female $0.27 1 $0.27 N
0.75" socket connect male x 0.5" NPT
female $0.50 1 $0.50 N
0.5" NPT male x 0.25" NPT female $1.44 1 $1.44 N
0.25" standard-wall brass pipe nipple $1.66 2 $3.32 N
8 oz. pipe cement $4.68 1 $4.68 N
3' Air hose 0.25" x 0.25" NPTF brass
male fittings $13.03 2 $26.06 N
Panel-mount flowmeter for air without
valve $58.00 1 $58.00 N
Brass On/Off valve with lever handle $8.27 1 $8.27 N
Total $662.74

124
Appendix C: Rev P wind sensor original LabVIEW program
Figure C.1: Rev P original LabVIEW program

125
Appendix D: Rev C wind sensor original LabVIEW program
Figure D.1: Rev C original LabVIEW program

126
Appendix E: LabVIEW program to find zero wind correction factor
Figure E.1: Block diagram of zero wind correction factor program

127
Figure E.2: Front panel of zero wind calibration factor program

128
Appendix F: Five different calibration LabVIEW programs tested in wind tunnel for Rev P
Figure F.1: Rev P first linear equation

129
Figure F.2: Rev P second linear equation

130
Figure F.3: Rev P first polynomial equation

131
Figure F.4: Rev P second polynomial equation

132
Figure F.5: Rev P power equation

133
Appendix G: Graphical results of Rev P wind tunnel testing
Figure G.1: Wind tunnel test with Eq. 4.16
(Wind Speed = (RawW−264.0
85.6814)3.36814)
Figure G.2: Wind tunnel test with first linear equation
(mph = 0.126 ∗ values − 36.965)
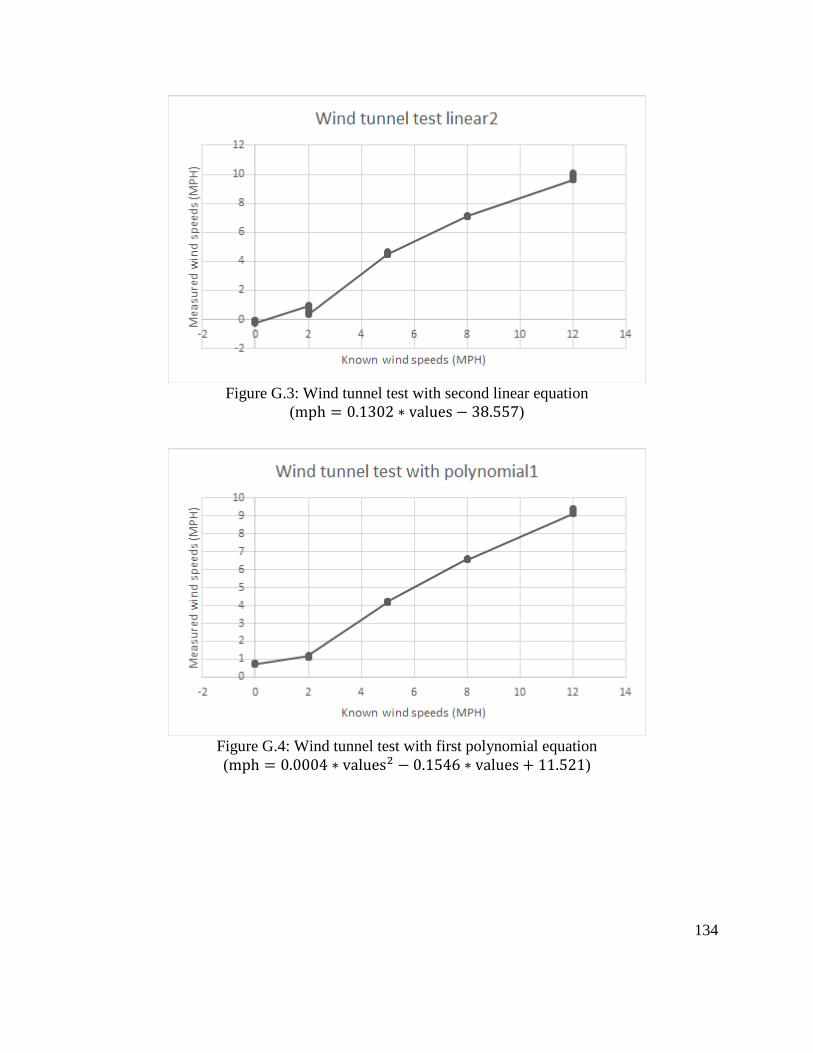
134
Figure G.3: Wind tunnel test with second linear equation
(mph = 0.1302 ∗ values − 38.557)
Figure G.4: Wind tunnel test with first polynomial equation
(mph = 0.0004 ∗ values2 − 0.1546 ∗ values + 11.521)

135
Figure G.5: Wind tunnel test with second polynomial equation
(mph = 0.003 ∗ values2 − 0.0492 ∗ values − 7.6893)
Figure G.6: Wind tunnel test with power equation
(3 ∗ 10−19 ∗ values7.5712)

136
Appendix H: Low flow wind tunnel SOP
1. Connect cemented reducers to reducing coupling at end of wind tunnel
A. B.
Figure H.1: A) reducers unattached from reducing coupling; B) Reducers attached
2. Use a threaded nipple to connect the reducers to the top of the rotameter
3. Connect an airline hose to the bottom of the rotameter
Figure H.2: threaded nipple and airline hose attached to rotameter
4. Connect the ball valve to the rotameter with the hose
Figure H.3: Ball valve attached to rotameter via airline hose
5. Use another airline hose to connect the ball valve to the regulator

137
Figure H.4: Ball valve connected to regulator via airline hose
6. Ensure the regulator is closed and the ball valve is closed
A. B.
Figure H.5: A) Regulator in closed position; B) Ball valve in closed position
7. Use the quick disconnect to connect the airline to the regulator
Figure H.6: Male quick disconnect of regulator that interfaces with compressed airline

138
8. Use electrical tape to secure the sensor at the end of the wind tunnel with the sensing
element in the center of flow
Figure H.7: Rev C sensor secured at end of wind tunnel
9. Connect the sensors wires to the correct ports of the DAQ box (see Appendix L for
detailed instructions)
10. Hold the hot wire probe or Hold Peak handheld anemometer in the center of flow (see
Appendices I and J for instructions on use)
11. Start running the software programs to collect data as described in (Appendix L and J)
12. Open the regulator completely by turning the cap on the top
13. Regulate the flow by slowly opening the ball valve until desired pressure and thus flow
rate is reached
Figure H.8: Ball valve completely open
14. Stop the flow by returning the ball valve back to the closed position
15. Disassemble the wind tunnel by following these steps in reverse

139
Appendix I: SOP for Hold Peak handheld anemometer
1. Open side cover and connect the digital anemometer to the flow anemometer via the USB
port
A. B. C.
Figure I.1: A) Side cover on digital anemometer; B) Side cover open on digital anemometer; C)
Flow anemometer attached to USB of digital anemometer
2. Turn the device on and ensure it is in the desired measurement mode
Figure I.2: Digital anemometer screen display and keypad used for operation
a. Use the unit button to choose between MPH, m/s, km/hr., ft./min., knots
b. Use the 6 button to choose °C or °F
3. Hold the flow anemometer portion of the device in the desired location
Figure I.3: Flow anemometer positioned for flow coming out of the page, in the direction of the
arrow
a. Make sure the arrow is pointing in the direction of flow

140
4. Read the screen and record the values as they are produced (Figure I.2)
a. Use the hold button to display a constant value on the screen
5. Hold the power button for 3 seconds to turn off the device
Figure I.4: Closeup image of the keypad of the device to better show the power, unit and
temperature control buttons
6. Unplug the flow anemometer from the digital anemometer and return to case
Figure I.5: Device powered off and in case for storage

141
Appendix J: SOP for Testo 405i hot wire smart probe
1. Download the Testo smart probe app
Figure J.1: Icon for the smart probes app used for the Testo 405i hot wire probe
2. Turn on Bluetooth on your device and open the app
Figure J.2: IPhone menu pulled up from the bottom used to quickly turn on Bluetooth
3. Unfold the device and remove plastic covering
A. B.
Figure J.3: A) Testo 405i probe folded and wrapped for storage; B) Testo 405i probe unwrapped
and unfolded for use
4. Turn on the hot wire probe by pressing the large orange button, the light will blink orange
Figure J.4: Testo 405i probe on, but not connected to the app as signified by the orange light
5. Wait for the light to be blinking green
Figure J.5: Testo 405i probe connected to the app as signified by the green light

142
6. Turn the black cover to expose the hot wire
A. B.
Figure J.6: A) Black cover closed to protect the hot wire sensor; B) Black cover opened to allow
for testing with the hot wire sensor
7. Use the buttons at the very top (bulleted list (left) and lists (right)) of the app to change
unit measurements and choose other settings
a. Use the list, trending, and table buttons to change how the data is displayed
Figure J.7: Home screen of the app showing list measurements
8. Click the center button (dog-eared page with +) at the bottom of the app to control when
testing begins
a. When the menu comes up press continue to begin recording and discard collected
data

143
A. B.
Figure J.8: A) Trending view of standard app set up; B) The menu used to restart data collection
that comes up when the center button at the bottom is clicked
9. Once data collection is complete: use last button, arrow in square brackets, (right) to
export data to an Excel file (.csv)
A. B.
Figure J.9: A) Trending view of standard app setup; B) Export option menu that allows the user
to choose a file type to export the data to

144
10. Enter an email and email the file for further processing
Figure J.10: Email message with file attached that opens when file type is chosen
11. Hold the orange button used to turn it on until the light turns off (Figure J.3B)
12. Close the black cover by turning (Figure J.6A)
13. Fold the probe and return the wrapping to the handle (Figure J.3A)

145
Appendix K: Single calibration final LabVIEW program for Rev C sensor
Figure K.1: Zero wind calibration factor portion of final program

146
Figure K.2: Front panel of final zero wind calibration program
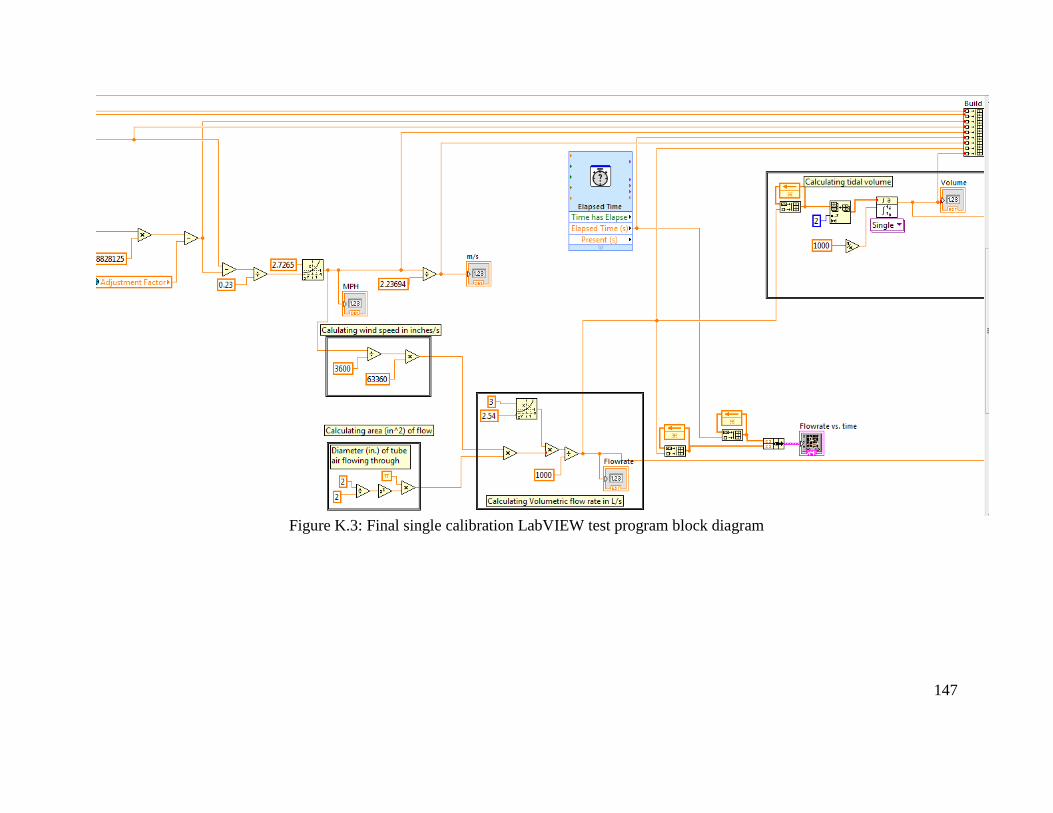
147
Figure K.3: Final single calibration LabVIEW test program block diagram

148
Figure K.4: Final single calibration LabVIEW test program front panel

149
Appendix L: SOP for single calibration LabVIEW program
Policy: This SOP will comply with veterinary standards and guidelines for external device
sterilization and equine testing.
Purpose: The purpose of this SOP is to ensure safe and proper setup of the wind sensor lung
function testing device for reliable and repeatable results.
Scope: This procedure is for veterinarians using the wind sensor lung function testing device to
diagnose pulmonary disorders.
Prerequisites: ● Wind sensor system
○ Including: Rev C sensor with 4 wires attached and a 5V wall wart connected to
the sensor and a ground wire
● USB-6000 DAQ box
● 1.5 in. rubber connector (housing)
● Plastic face mask for the horse
● 2.4 mm flat head screwdriver
● Electrical tape
● Scissors
● Paper towels or rag
● 70% ethanol for disinfecting the housing
● Computer with LabVIEW 2015 software (or newer) and USB port
● Electrical outlet
Procedure:
System setup
1. Connect wires to DAQ box using the following steps (a-d)
Figure L.1: DAQ box used with the system; wires insert into the side below screws
a. Ground (GND) of the sensor (1st pin) should be in one of the ports marked by an
arrow (AI GND)
b. The ground (V+ GND) of the power supply should be in another port marked by
an arrow (Ai-GND)

150
c. The RV pin on the sensor (4th pin) should be connected to port Ai0 on the DAQ
box
d. The TMP pin on the sensor (5th pin) should be connected to port Ai1 on the DAQ
box
A. B.
C.
Figure L.2: A) DAQ box ports with labels; B) Sensor with pins on left; C) Schematic of Rev C
sensor with labeled pins to corresponding DAQ box ports
i. All pins are connected by inserting the exposed end of the wire into the
respective port and then tightening the port (clockwise) using the 2.4 mm
flat head screwdriver
ii. The wires can typically be left attached, so check if they are secure with a
soft pull on each
1. If it comes out: loosen screw (counterclockwise) with 2.4 mm flat
head screwdriver, insert the wire, and retighten the screw
2. Insert housing in face mask
a. Locate the rectangular slot on the rubber connection
b. Orient this slot so that it will point up when attached to the mask on the horse
c. Insert the rubber connector (duct taped side) into the PVC portion of the mask
ensuring the slot is closest to you when you slide it on
i. Lightly tug the device or shake the horse face mask to ensure the housing
is securely attached

151
Figure L.3: Housing for the sensor
3. Insert wind sensor in housing
a. Slide wind sensor into slot in housing until the wires on the wind sensor rest on
the stop (extended piece of rubber on the housing)
Figure L.4: Sensor in housing in mask
b. Using scissors cut a piece of electrical tape 1 inch in length
c. With the piece of electrical tape, tape the four wires from the wind sensor to the
stop
4. Plug 5 V wall wart into an electrical outlet
Figure L.5: Wall wart plugged into electrical outlet
5. Plug USB cable from DAQ box into computer’s USB-port

152
Figure L.6: DAQ box connected to computer via USB
LabVIEW Setup
1. Power on computer with LabVIEW
2. Open LabVIEW 2015 or newer
3. In LabVIEW: File -> open -> bidirectional_flow_1.vi
4. Check to make sure the DAQ box is connected properly and turned on (should see blue
light on the side of the DAQ box)
Calibrating the device to the room
1. Use the down arrow on the ringer (labelled ring) to choose the zero-calibration program
A. B.
Figure L.7: A) Ringer used to choose which program is running; B) Programs that can be chosen
2. Click the run arrow (highlighted in image below with a red box) in the upper left hand
corner right below edit on the toolbar
Figure L.8: Run arrow on upper left of screen when in LabVIEW
3. The windspeed MPH should be displaying NAN when the program when started
Figure L.9: Desired start conditions for the zero-calibration program
a. If it is not reading NAN click the stop button and ensure everything is connected
properly before rerunning the program
4. The program will stop on its own once reaching a wind speed less than 0.0005 MPH

153
Figure L.10: Example of a desired end condition (zerowindadjustment factor will vary with test
environment)
a. Note: For a 5 V wall wart, the adjustment factor should be approximately 0.30-
0.40
i. If the program does not stop and the windspeed is reading higher than
0.0005 stop the program using the stop button
ii. Check the setup and rerun the program
5. Once the program stops running keep the LabVIEW bidirectional_flow_1.vi open
Horse setup
1. Put the mask on the horse’s muzzle by holding the black rubber cover back and sliding it
on
2. Release the rubber seal and allow it to fit tightly to the horse’s muzzle
3. Attach the blue Velcro strap over the horse’s head to keep the mask on
Testing the horse
1. Check that bidirectional_flow_1.vi is still open in LabVIEW
a. If not, go back to “Calibrating the device to the room” and follow steps again
2. Use the arrow on the ringer (labeled ring) to select the test program
Figure L.11: Ringer setting for testing
3. Set file name by editing existing or browsing for a file using the folder button
a. The file type must be .xls
b. Program will produce an error if file is open when trying to run the program
Figure L.12: Define file path or choose a file by browsing
4. Click the run arrow in the upper left hand corner as done before
a. Note: data does not automatically begin saving
5. Click the save button to begin recording data

154
Figure L.13: Click this button to stop or start saving (currently not saving, light changes to
brighter green when saving)
6. To stop saving click the save button again
7. If finished testing stop the program using the stop button
Figure L.14: Use this button to stop the test program; it will not stop on its own
8. Your file will be saved in the location specified with the defined filename
9. Open the file and save as an .xlsx file before analyzing
a. When opening an .xls file, Excel will produce a warning message. Select “Yes” to
continue
Figure L.15: Excel warning message
System disassembly
1. Unplug 5 V wall wart from electrical outlet
2. Horse face mask disassembly
a. Detach blue Velcro strap from horse’s head
b. Slide face mask off of horse’s muzzle
3. Wind sensor housing disassembly
a. Take off electrical tape from wind sensor wires
b. Slide wind sensor out of the slot
c. Slide housing (rubber connector) off of horse face mask
4. Close LabVIEW
5. Unplug DAQ box USB cable from computer USB port
6. Optional: Wire removal from DAQ box
a. Unscrew each DAQ box screw (4 total) with a wire attached (2 GND, Ai0, Ai1)
using the 2.4 mm flat head screwdriver (counter clockwise)
Cleaning system after testing
1. Spray 70% ethanol disinfectant onto paper towel (or rag)
2. Wipe down housing (rubber connector)
3. Set housing down to dry

155
4. Spray 70% ethanol disinfectant onto a new paper towel (or rag)
5. Wipe down horse face mask
6. Set horse face mask down to dry

156
Appendix M: Double calibration final LabVIEW program for Rev C sensor
Figure M.1: First calibration program to find zero wind correction factor

157
Figure M.2: Zero wind calibration factor program front panel

158
Figure M.3: Second calibration program to find shift factor

159
Figure M.4: Shift factor calibration program front panel and ringer

160
Figure M.5: Final test program for double calibration program

161
Figure M.6: Final test program front panel for double calibration program

162
Appendix N: SOP for double calibration LabVIEW program
Policy: This SOP will comply with veterinary standards and guidelines for external device
sterilization and equine testing.
Purpose: The purpose of this SOP is to ensure safe and proper setup of the wind sensor lung
function testing device for reliable and repeatable results.
Scope: This procedure is for veterinarians using the wind sensor lung function testing device to
diagnose pulmonary disorders.
Prerequisites: ● Wind sensor system
○ Including: Rev C sensor with 4 wires attached and a 5V wall wart connected to
the sensor and a ground wire
● USB-6000 DAQ box
● 1.5-in. rubber connector (housing)
● Plastic face mask for the horse
● 2.4 mm flat head screwdriver
● Electrical tape
● Scissors
● Paper towels or rag
● 70% ethanol for disinfecting the housing
● Computer with LabVIEW 2015 software (or newer) and USB port
● Electrical outlet
Procedure:
System setup
6. Connect wires to DAQ box using the following steps (a-d)
Figure N.1: DAQ box used with the system; wires insert into the side below screws
a. Ground (GND) of the sensor (1st pin) should be in one of the ports marked by an
arrow (AI GND)
b. The ground (V+ GND) of the power supply should be in another port marked by
an arrow (Ai-GND)
c. The RV pin on the sensor (4th pin) should be connected to port Ai0 on the DAQ
box

163
d. The TMP pin on the sensor (5th pin) should be connected to port Ai1 on the DAQ
box
B. B.
C.
Figure N.2: A) DAQ box ports with labels; B) Sensor with pins on left; C) Schematic of Rev C
sensor with labeled pins to corresponding DAQ box ports
i. All pins are connected by inserting the exposed end of the wire into the
respective port and then tightening the port (clockwise) using the 2.4 mm
flat head screwdriver
ii. The wires can typically be left attached, so check if they are secure with a
soft pull on each
1. If it comes out: loosen screw (counterclockwise) with 2.4 mm flat
head screwdriver, insert the wire, and retighten the screw
7. Insert housing in face mask
a. Locate the rectangular slot on the rubber connection
b. Orient this slot so that it will point up when attached to the mask on the horse
c. Insert the rubber connector (duct taped side) into the PVC portion of the mask
ensuring the slot is closest to you when you slide it on
i. Lightly tug the device or shake the horse face mask to ensure the housing
is securely attached

164
Figure N.3: Housing for the sensor
8. Insert wind sensor in housing
a. Slide wind sensor into slot in housing until the wires on the wind sensor rest on
the stop (extended piece of rubber on the housing)
Figure N.4: Sensor in housing in mask
b. Using scissors cut a piece of electrical tape 1 inch in length
c. With the piece of electrical tape, tape the four wires from the wind sensor to the
stop
9. Plug 5 V wall wart into an electrical outlet
Figure N.5: Wall wart plugged into electrical outlet
10. Plug USB cable from DAQ box into computer’s USB-port

165
Figure N.6: DAQ box connected to computer via USB
LabVIEW Setup
5. Power on computer with LabVIEW
6. Open LabVIEW 2015 or newer
7. In LabVIEW: File -> open -> bidirectional_flow_1.vi
8. Check to make sure the DAQ box is connected properly and turned on (should see blue
light on the side of the DAQ box)
Calibrating the device to the room
6. Use the down arrow on the ringer (labelled ring) to choose the zero-calibration program
A. B.
Figure N.7: A) Ringer used to choose which program is running; B) Programs that can be chosen
7. Click the run arrow (highlighted in image below with a red box) in the upper left hand
corner right below edit on the toolbar
Figure N.8: Run arrow on upper left of screen when in LabVIEW
8. The windspeed MPH should be displaying NAN when the program when started
Figure N.9: Desired start conditions for the zero-calibration program
a. If it is not reading NAN click the stop button and ensure everything is connected
properly before rerunning the program
9. The program will stop on its own once reaching a wind speed less than 0.0005 MPH

166
Figure N.10: Example of a desired end condition (zerowindadjustment factor will vary with test
environment)
a. Note: For a 5 V wall wart, the adjustment factor should be approximately 0.30-
0.40
i. If the program does not stop and the windspeed is reading higher than
0.0005 stop the program using the stop button
ii. Check the setup and rerun the program
10. Once the program stops running keep the LabVIEW bidirectional_flow_1.vi open
Horse setup
4. Put the mask on the horse’s muzzle by holding the black rubber cover back and sliding it
on
5. Release the rubber seal and allow it to fit tightly to the horse’s muzzle
6. Attach the blue Velcro strap over the horse’s head to keep the mask on
Calibrating the device to the horse
1. Check that bidirectional_flow_1.vi is still open in LabVIEW
a. If not, go back to “Calibrating the device to the room” and follow steps again
2. Use the arrow on the ringer (labeled ring) to select the multidirectional calibration
program
Figure N.11: Ringer setting for second calibration
3. Click the run arrow in the upper left hand corner as before
a. The program will stop automatically when the integral of the curve results in a
value about the same as the dead space of a horse (2.5 L)
Testing the horse
3. Check that bidirectional_flow_1.vi is still open in LabVIEW
a. If not, go back to “Calibrating the device to the room” and follow steps again
4. Use the arrow on the ringer (labeled ring) to select the test program
Figure N.12: Ringer setting for testing
10. Set file name by editing existing or browsing for a file using the folder button
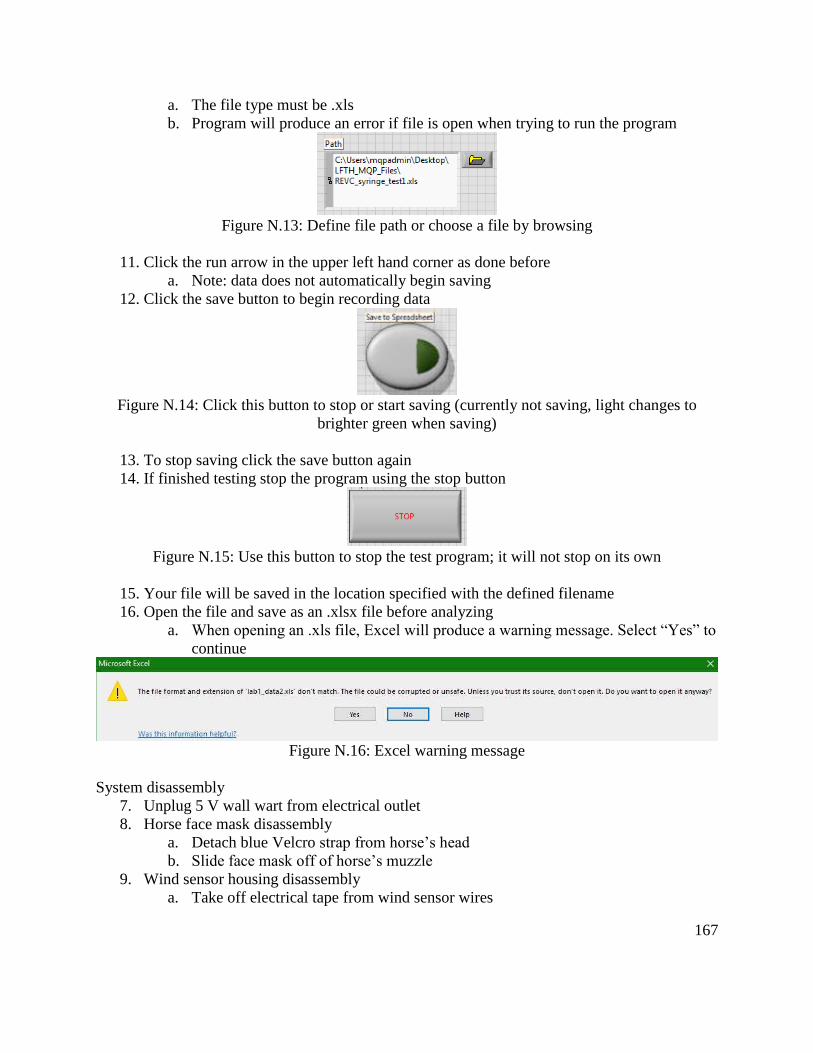
167
a. The file type must be .xls
b. Program will produce an error if file is open when trying to run the program
Figure N.13: Define file path or choose a file by browsing
11. Click the run arrow in the upper left hand corner as done before
a. Note: data does not automatically begin saving
12. Click the save button to begin recording data
Figure N.14: Click this button to stop or start saving (currently not saving, light changes to
brighter green when saving)
13. To stop saving click the save button again
14. If finished testing stop the program using the stop button
Figure N.15: Use this button to stop the test program; it will not stop on its own
15. Your file will be saved in the location specified with the defined filename
16. Open the file and save as an .xlsx file before analyzing
a. When opening an .xls file, Excel will produce a warning message. Select “Yes” to
continue
Figure N.16: Excel warning message
System disassembly
7. Unplug 5 V wall wart from electrical outlet
8. Horse face mask disassembly
a. Detach blue Velcro strap from horse’s head
b. Slide face mask off of horse’s muzzle
9. Wind sensor housing disassembly
a. Take off electrical tape from wind sensor wires

168
b. Slide wind sensor out of the slot
c. Slide housing (rubber connector) off of horse face mask
10. Close LabVIEW
11. Unplug DAQ box USB cable from computer USB port
12. Optional: Wire removal from DAQ box
a. Unscrew each DAQ box screw (4 total) with a wire attached (2 GND, Ai0, Ai1)
using the 2.4 mm flat head screwdriver (counter clockwise)
Cleaning system after testing
7. Spray 70% ethanol disinfectant onto paper towel (or rag)
8. Wipe down housing (rubber connector)
9. Set housing down to dry
10. Spray 70% ethanol disinfectant onto a new paper towel (or rag)
11. Wipe down horse face mask
12. Set horse face mask down to dry

169
Appendix O: Horse owner questionnaire on veterinary care
Figure O.1: Page 1 of 4 of horse owner survey

170
Figure O.2: Page 2 of 4 of horse owner survey
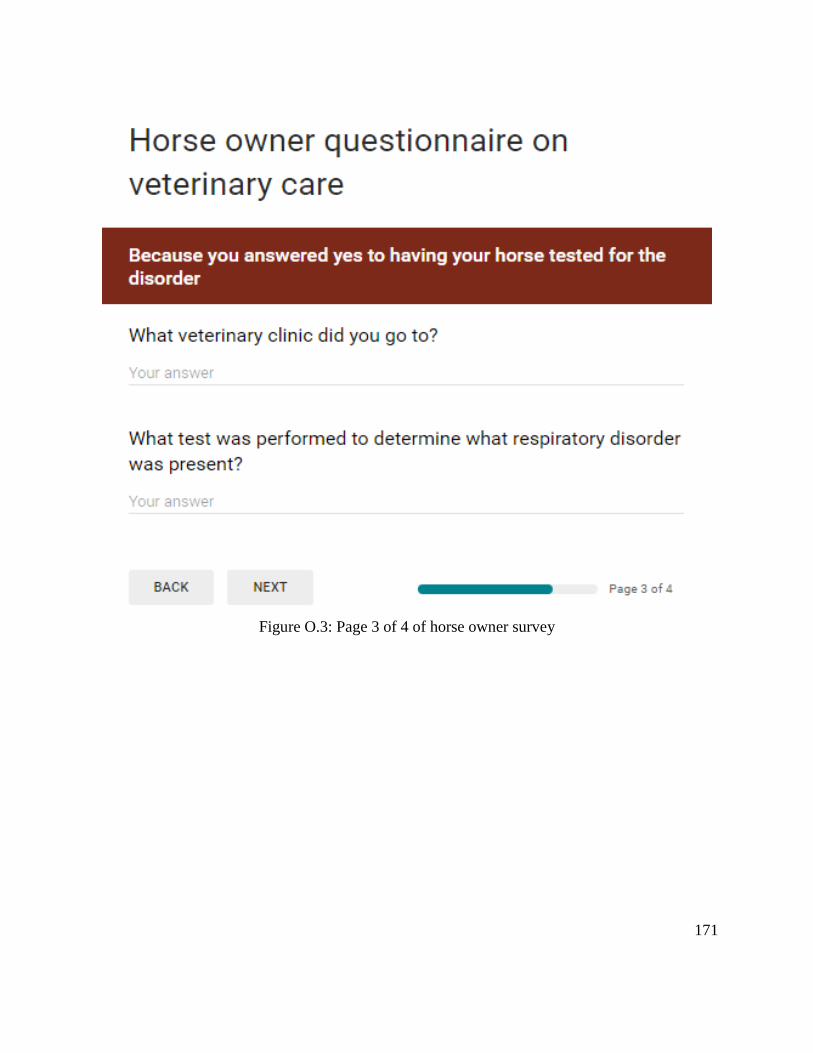
171
Figure O.3: Page 3 of 4 of horse owner survey

172
Figure O.4: Page 4 of 4 part 1 of horse owner survey

173
Figure O.5: Page 4 of 4 part 2 of horse owner survey

174
Appendix P: Veterinary questionnaire on veterinary care
Figure P.1: Page 1 of 4 of veterinarian survey

175
Figure P.2: Page 2 of 4 of veterinarian survey

176
Figure P.3: Page 3 of 4 of veterinarian survey

177
Figure P.4: Page 4 of 4 of veterinarian survey

178
Appendix Q: Overall results from horse owner survey
Figure Q.1: Horse owner response to having a horse with a respiratory disorder
Figure Q.2: Horse owner response of if their horse was tested for a respiratory disorder
Figure Q.3: Gauging knowledge of horse owners on prevalence of respiratory disorders

179
Figure Q.4: How much horse owners are willing to pay for respiratory function
Figure Q.5: How far horse owners currently travel for care
Figure Q.6: How much horse owners believe they would pay for lung function testing

180
Figure Q.7: How far horse owners will travel for lung function testing

181
Appendix R: Overall results from veterinarian survey
Figure R.1: Displays how frequently equine vets see equine lung function disorders
Figure R.2: Veterinarians that perform vs. Don’t perform equine lung function

182
Figure R.3: How frequently veterinarians perform equine lung function testing
Figure R.4: Veterinarians interest in purchasing a non-invasive equine lung function testing
device
Figure R.5: How much veterinarians are willing to spend on an equine lung function testing
device

183
Appendix S: Veterinarian survey data by United States’ region
Northeast
States: Maine, Massachusetts, Rhode Island, Connecticut, New Hampshire, Vermont,
New York, Pennsylvania, New Jersey, Delaware, Maryland
Number of Respondents: 27
Figure S.1: Veterinarian survey results from the Northeast

184
Southeast
States: West Virginia, Virginia, Kentucky, Tennessee, North Carolina, South Carolina,
Georgia, Alabama, Mississippi, Arkansas, Louisiana, Florida
Number of Respondents: 15
Figure S.2: Veterinarian survey results from the Southeast

185
Midwest
States: Ohio, Indiana, Michigan, Illinois, Missouri, Wisconsin, Minnesota, Iowa, Kansas,
Nebraska, South Dakota, North Dakota
Number of Respondents: 8
Figure S.3: Veterinarian survey results from the Midwest

186
Southwest
States: Texas, Oklahoma, New Mexico, Arizona
Number of Respondents: 3
Figure S.4: Veterinarian survey results from the Southwest

187
West
States: Colorado, Wyoming, Montana, Idaho, Washington, Oregon, Utah, Nevada,
California, Alaska, Hawaii
Number of Respondents: 12
Figure S.5: Veterinarian survey results from the West