Embed Size (px)
Citation preview

April 28, 2010Pekka Lundmark, President and CEOTeo Ottola, CFO
Q1 2010Interim Report

Highlights of Q1/10
Positives• Improving macro indicators• Service showing signs of a recovery• Successful cost savings actions supported result• Alliance with Kito
Negatives• Continued low new equipment demand• Intense price competition• Profit burdened by low deliveries
2© 2010 Konecranes Plc. All rights reserved.
ORDERS RECEIVED Y/ Y EMEA AME APAC
SERVICE
EQUIPMENT

Capacity utilization: EU27 and USA
3© 2010 Konecranes Plc. All rights reserved.
SOURCES: Eurostat, Federal Reserve Bank of St. Louis
72,7
69,4
64
66
68
70
72
74
76
78
80
82
84
86
Jan 2005
Jul 2005
Jan 2006
Jul 2006
Jan 2007
Jul 2007
Jan 2008
Jul 2008
Jan 2009
Jul 2009
Jan 2010
Capacity utilisation in the USA
Total industry Manufacturing
72,9
64
66
68
70
72
74
76
78
80
82
84
86
2005
Q01
2005
Q02
2005
Q03
2005
Q04
2006
Q01
2006
Q02
2006
Q03
2006
Q04
2007
Q01
2007
Q02
2007
Q03
2007
Q04
2008
Q01
2008
Q02
2008
Q03
2008
Q04
2009
Q01
2009
Q02
2009
Q03
2009
Q04
2010
Q01
Capacity utilisation of manufacturing in EU

Container traffic
4© 2010 Konecranes Plc. All rights reserved.
SOURCES: Drewry Container Annual 2009/2010, Drewry Freight Shipper Inshight
Annual port handling volume Monthly port handling volume
0
100
200
300
400
500
600
1990
1991
1992
1993
1994
1995
1996
1997
1998
1999
2000
2001
2002
2003
2004
2005
2006
2007
2008
2009
2010
Million teu
-25 %
-20 %
-15 %
-10 %
-5 %
0 %
5 %
10 %
15 %
20 %
25 %
Change Y/Y

• Founded in 1932 and listed on the Tokyo Stock Exchange in 2007
• Serves customers mainly in Japan, North America and China
• Clear market leader for manual and electric chain hoists in Japan
• For the year ended March 31, 2009, Kito’s net sales amounted to EUR 227 million and operating profit to EUR 16.5 million
• Kito has approximately 1,500 employees and factories in Japan, China and the Philippines
Facts about Kito Corporation
© 2010 Konecranes Plc. All rights reserved. 5

• Purchase of 22% of shares for EUR 27 million
• Konecranes will sell Kito manual products; Kito will sell wire rope hoist made by Konecranes
• Enhances Konecranes’ presence in East Asia and North America
• Possibilities to expand co-operation• Both companies will retain own
identity and independence
Strategic alliance with Kito Corporation
© 2010 Konecranes Plc. All rights reserved. 6

Q1/2010 Group orders and net sales
7© 2010 Konecranes Plc. All rights reserved.
Orders: 320.6 (369.7) MEUR, -13.3% | Net sales: 306.3 (442.1) MEUR, -30.7%

Sales split by business area & region, R12M
8© 2010 Konecranes Plc. All rights reserved.
R12M 1,535 MEUR
(FY 2009 1,671)
16%(16%)
56%(56%)
28%(29%)
61%(63%)
39%(37%)
R12M1,535 MEUR
(FY 2009 1,671)

Order book at end of the period 641.3 (792.0) MEUR, -19.0%
Group order book
9© 2010 Konecranes Plc. All rights reserved.
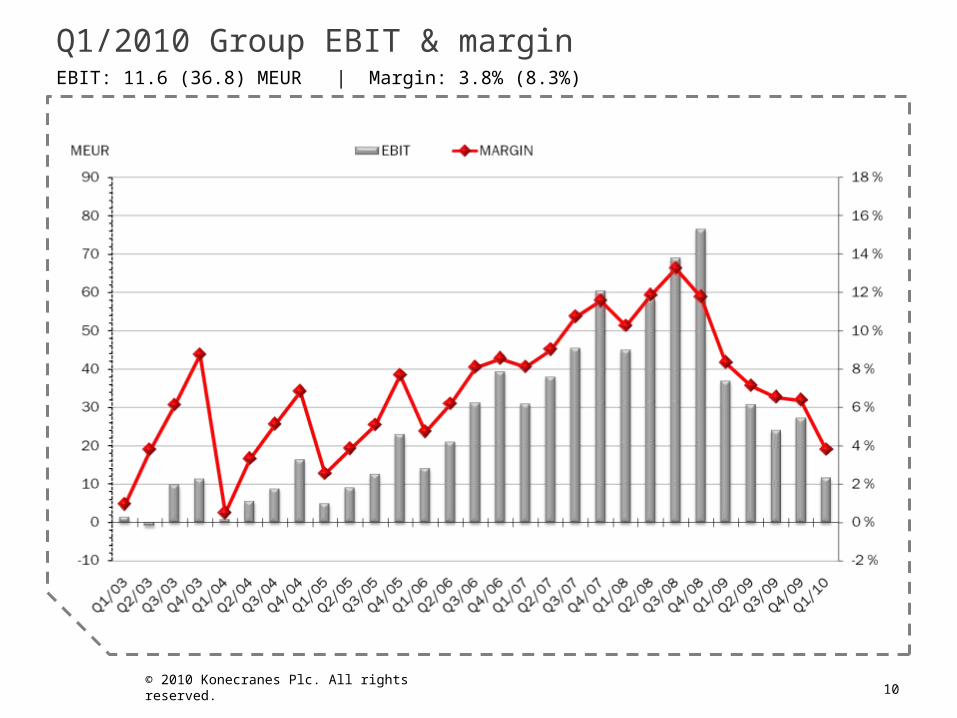
Q1/2010 Group EBIT & margin
10© 2010 Konecranes Plc. All rights reserved.
EBIT: 11.6 (36.8) MEUR | Margin: 3.8% (8.3%)

Return on capital employed
11© 2010 Konecranes Plc. All rights reserved.
*The 2007 ROCE including capital gain was 50.4%
ROCE %
24.3
17.8
10.813.7
17.2
29.5
46.2 *
56.3
19.3
14.6

Future prospects as of April 28, 2010
12© 2010 Konecranes Plc. All rights reserved.
• 2010 guidance for sales and operating profit reiterated, Services’ demand outlook changed
• Market uncertainty to continue• Demand outlook for maintenance
services has improved as a result of higher capacity utilization within customer industries
• Demand for new equipment to remain on a low level
– Price competition to remain• Order book lower than a year ago
Sales in 2010 forecast to be lower than in 2009
Operating profit in 2010 expected to be lower than in 2009 before restructuring costs

Service

Orders: 139.8 (125.6) MEUR, 11.3% | Net sales: 148.0 (169.7) MEUR, -12.8%
Q1/2010 Service: orders & net sales
• New orders grew in all geographic regions• Higher orders across several business units with particular
strength in Modernization due to large single orders
14© 2010 Konecranes Plc. All rights reserved.

EBIT: 9.8 (15.7) MEUR | Margin: 6.6% (9.3%)
Q1/2010 Service: EBIT & margin
15© 2010 Konecranes Plc. All rights reserved.
• Profitability declined due to lower volumes
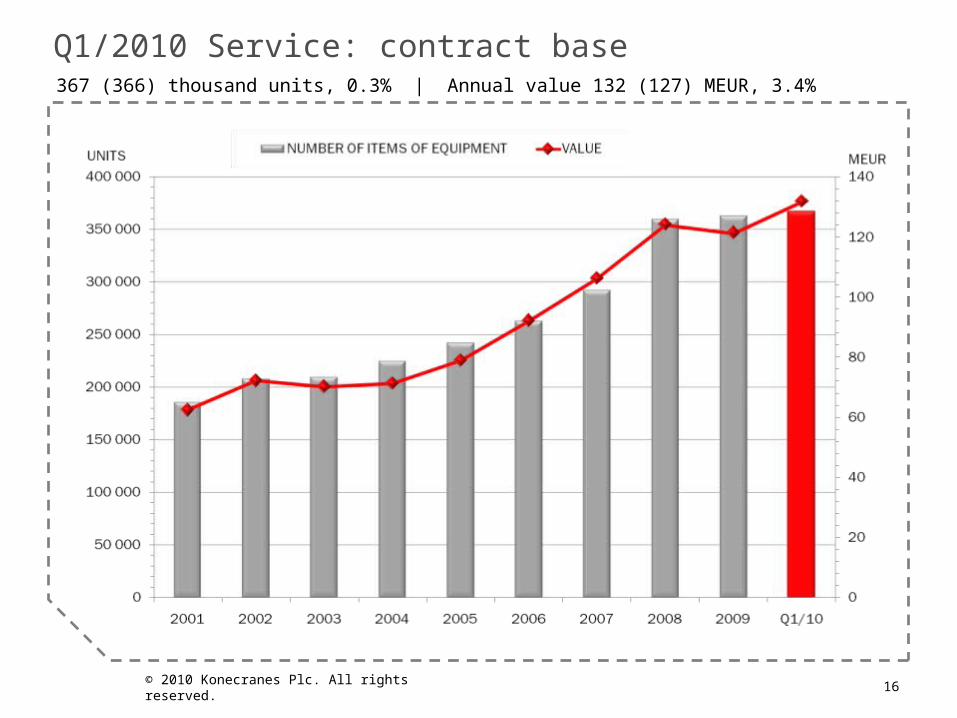
Q1/2010 Service: contract base 367 (366) thousand units, 0.3% | Annual value 132 (127) MEUR, 3.4%
16© 2010 Konecranes Plc. All rights reserved.

Service: order book87.7 (109.1) MEUR, -19.6%
17© 2010 Konecranes Plc. All rights reserved.
0
20
40
60
80
100
120
Q1/ 09 Q2/ 09 Q3/ 09 Q4/ 09 Q1/ 10
MEUR

Equipment

Q1/2010 Equipment: orders & net sales
• Orders decreased both in EMEA and the Americas, but grew in APAC due to strong growth in China
• Orders declined both Y/Y and Q/Q due to lack of large single block orders for port equipment particularly
19© 2010 Konecranes Plc. All rights reserved.
Orders: 196.2 (263.9) MEUR, -25.7% | Net sales: 185.8 (304.6) MEUR, -39.0%

Q1/2010 Equipment: EBIT & margin
• Profitability declined due to declining volumes• Negative profit impact could not be fully offset by cost savings actions
20© 2010 Konecranes Plc. All rights reserved.
EBIT: 6.0 (26.8) MEUR, -77.4% | Margin: 3.3% (8.8%)

Equipment: order bookOrder book: 558.2 (701.9) MEUR, -20.5%
21© 2010 Konecranes Plc. All rights reserved.
0
100
200
300
400
500
600
700
800
Q1/ 09 Q2/ 09 Q3/ 09 Q4/ 09 Q1/ 10
MEUR

Balance Sheet and Cash Flow

Q1/2010 Net working capital 102.5 (267.0) MEUR | 6.7% (12.7%) of LTM sales | 156.0 MEUR | 10.2% of LTM sales incl. dividends
23© 2010 Konecranes Plc. All rights reserved.
0 %
2 %
4 %
6 %
8 %
10 %
12 %
14 %
16 %
0
50
100
150
200
250
300
Q1/ 07 Q2/ 07 Q3/ 07 Q4/ 07 Q1/ 08 Q2/ 08 Q3/ 08 Q4/ 08 Q1/ 09 Q2/ 09 Q3/ 09 Q4/ 09 Q1/ 10
MEUR NWC, MEUR NWC INCL. DIVIDENDS, MEUR % OF SALES % OF SALES INCL. DIVIDENDS
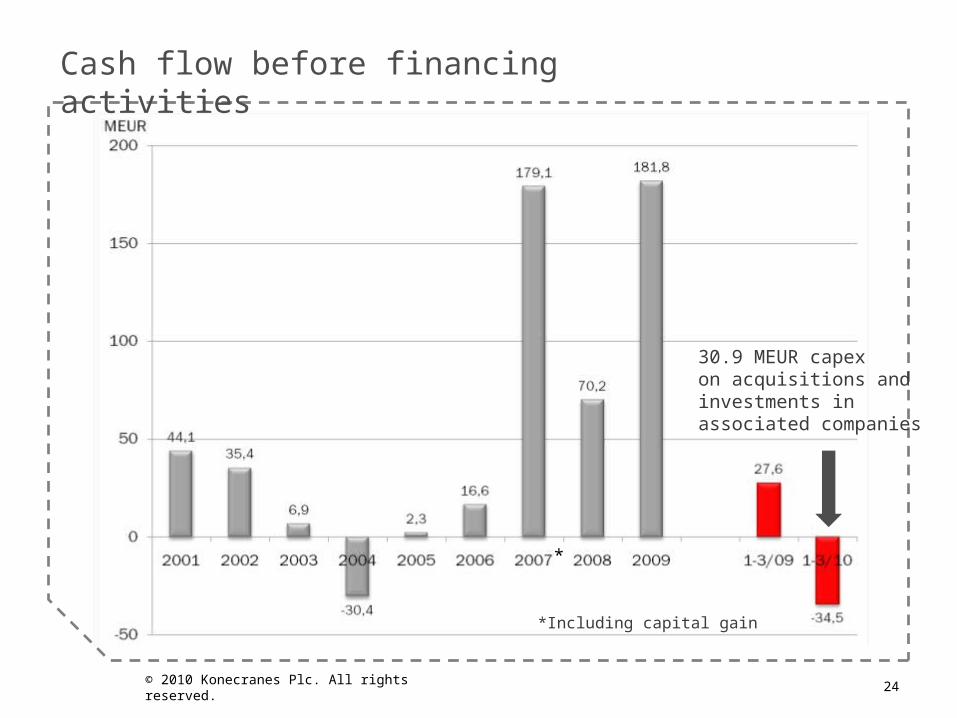
Cash flow before financing activities
24© 2010 Konecranes Plc. All rights reserved.
*Including capital gain
*
30.9 MEUR capexon acquisitions and investments in associated companies

Q1/2010 Gearing
25© 2010 Konecranes Plc. All rights reserved.
Equity: 373.7 (379.7) MEUR | Net debt: -46.6 (37.8) MEUR | Gearing; -12.4% (10.0%)
Appendixes

Statement of income
Q1 2010 MEUR
Q1 2009MEUR
% Change
Sales 306.3 442.1 -30.7
Other operating income 0.8 0.7
Depreciation and impairments -7.3 -6.8
Other operating expenses -288.2 -399.2
Operating profit 11.6 36.8 -68.6
Share of associates’ and joint ventures’ result 0.1 0.0
Financial income and expenses 0.7 -1.5
Income before taxes 12.4 35.4 -64.9
Taxes -3.7 -10.1
Net income for the period 8.8 25.3 -65.4
27© 2010 Konecranes Plc. All rights reserved.

Balance sheet
MEUR Q1 2010 Q1 2009 Q1 2010 Q1 2009
Non-current assets 324.9 241.2 Equity 373.7 379.7
Inventories 271.1 356.7 Non-current liabilities 111.8 180.4
Other current assets 395.5 468.4 Provisions 58.6 46.9
Cash and cash equivalents
121.1 116.0 Current liabilities 568.6 575.3
Total assets 1 112.7 1 182.2Total equity and
liabilities1 112.7 1 182.2
28© 2010 Konecranes Plc. All rights reserved.

Cash flow statement
MEUR Q1 2010 Q1 2009
Operating income before change in net working capital 19.3 43.9
Change in net working capital 10.8 9.5
Financing items and taxes -29.6 -20.8
Net cash from operating activities 0.5 32.6
Net cash used in investing activities -35.0 -5.0
Cash flow before financing activities -34.5 27.6
Proceeds from options exercised and share issues 0.9 0.7
Change of interest-bearing debt 10.0 38.8
Dividends paid to equity holders of the parent 0.0 -53.3
Net cash used in financing activities 10.9 -13.8
Translation differences in cash 7.1 1.3
Change of cash and cash equivalents -16.5 15.1
Cash and cash equivalents at beginning of period 137.5 100.9
Cash and cash equivalents at end of period 121.1 116.0
Change of cash and cash equivalents -16.5 15.1
29© 2010 Konecranes Plc. All rights reserved.

Key figures
Q1 2010MEUR
Q1 2009MEUR
% Change
Sales 306.3 442.1 -30.7
Operating profit (EBIT), including restructuring costs 11.6 36.8 -68.6
Profit before taxes 12.4 35.4 -64.9
Net profit for the period 8.8 25.3 -65.4
Cash flow from operations before financing items and taxes
30.1 53.4
Cash flow from operating activities per share (EUR) 0.01 0.55
Interest bearing net debt -46.6 37.8 -223.2
Gearing (%) -12.4 10.0
Solidity (%) 40.2 38.5
Return on capital employed (%), (R12M) 14.6 50.4 -71.0
Return on equity (%), (R12M) 12.2 49.4 -75.3
Equity per share (EUR) 6.26 6.38 -1.9
Investments total (excl. acquisitions) 4.2 6.0 -29.5
Personnel at end of period 9 562 9 866 -3,1
Personnel on average during the period 9 672 9 885 -2,2
30© 2010 Konecranes Plc. All rights reserved.

Share details and ownership information
Trading information•Listing: NASDAX OMX Helsinki•Date of listing: March 27, 1996•Segment: Large Cap•Sector: Industrials•Trading code: KCR1V•Q1/10 average daily trading volume 505,322 shares, EUR 10.8 million
Largest shareholders on March 31, 2010
Nr of shares
% of all shares
1 Htt 2 Holding Ltd 3,694,500 5.96%
2 Gustavson Stig, Chairman of the Board of Konecranes
2,036,772 3.29%
3 Varma Mutual Pension Insurance Company
2,005,275 3.24%
4 Nordstjernan Ab 1,380,024 2.23%
5 Nordea Nordenfonden 1,109,591 1.79%
6 Ilmarinen Mutual Pension Insurance Company
1,076,978 1.74%
7 Sigrid Juselius Foundation 601,500 0.97%
8 Mandatum Life Insurance Company Ltd. 558,695 0,90%
9 The State Pension Fund 550,000 0.89%
10 Folkhälsan non-governmental organization svenska Finland rf
535,600 0.86%
Konecranes’ treasury shares 2,542,600 4.10%
Nominee registered shares 29,834,749 48.15%
Other shareholders 13,302,676 21.47%
Total number of shares 61,872,920 100,00%
Market cap > EUR 1 bn
© 2010 Konecranes Plc. All rights reserved. 31
48% 32%
14%
7%

Contact information
• Pekka Lundmark, President and CEOtel. +358 (0)20 427 2000 [email protected]
• Teo Ottola, Chief Financial Officertel.+358 (0)20 427 2040 [email protected]
• Miikka Kinnunen, Director, Investor Relationstel: +358 (0)20 427 [email protected]
• Anna-Mari Kautto, Assistant, Investor Relationstel. +358 (0)20 427 [email protected]
www.konecranes.com
© 2010 Konecranes Plc. All rights reserved. 32

Thank you!