Embed Size (px)
Citation preview
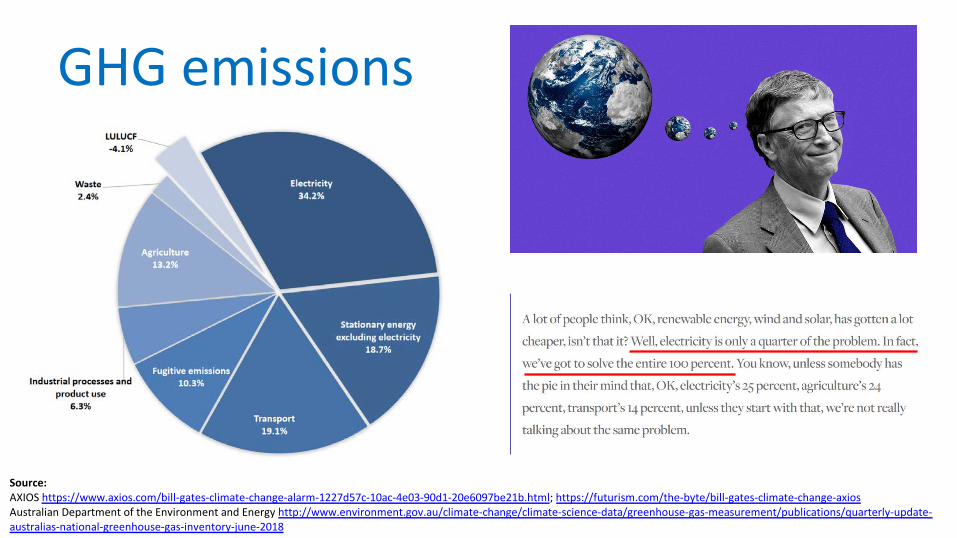
GHG emissions
Source:AXIOS https://www.axios.com/bill-gates-climate-change-alarm-1227d57c-10ac-4e03-90d1-20e6097be21b.html; https://futurism.com/the-byte/bill-gates-climate-change-axios
Australian Department of the Environment and Energy http://www.environment.gov.au/climate-change/climate-science-data/greenhouse-gas-measurement/publications/quarterly-update-
australias-national-greenhouse-gas-inventory-june-2018
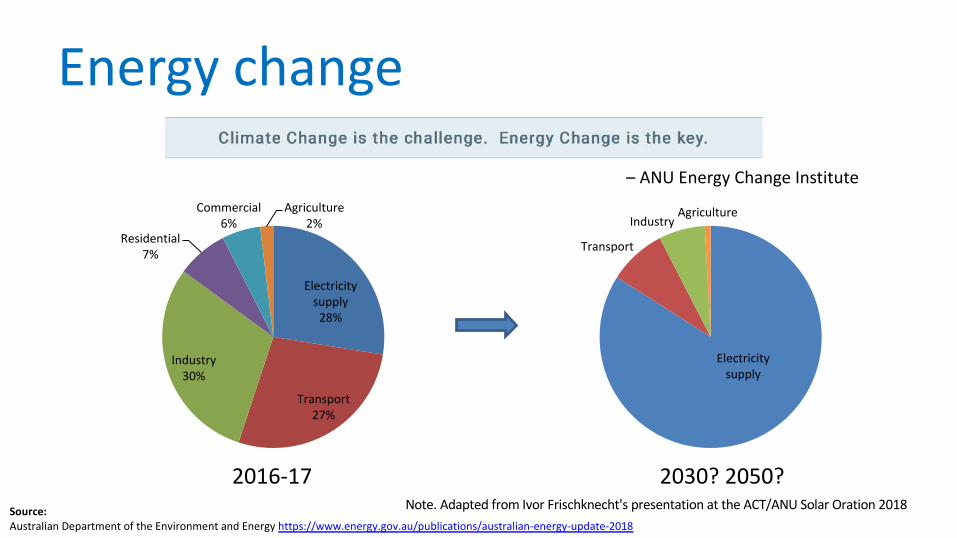
Energy change
2016-17 2030? 2050?Source:Australian Department of the Environment and Energy https://www.energy.gov.au/publications/australian-energy-update-2018
Note. Adapted from Ivor Frischknecht's presentation at the ACT/ANU Solar Oration 2018
Electricity supply
28%
Transport27%
Industry30%
Residential7%
Commercial6%
Agriculture2%
Electricity supply
Transport
IndustryAgriculture
– ANU Energy Change Institute
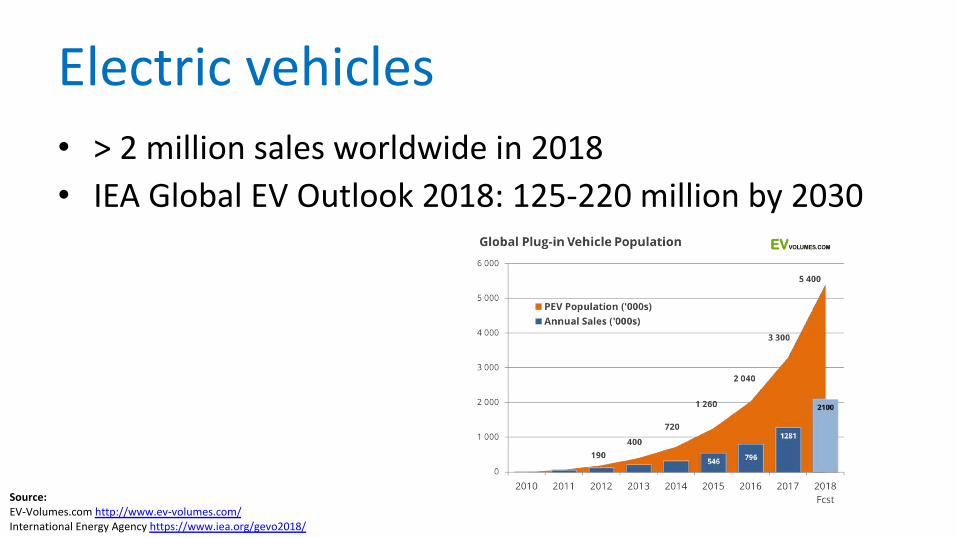
Electric vehicles• > 2 million sales worldwide in 2018• IEA Global EV Outlook 2018: 125-220 million by 2030
Source:EV-Volumes.com http://www.ev-volumes.com/International Energy Agency https://www.iea.org/gevo2018/
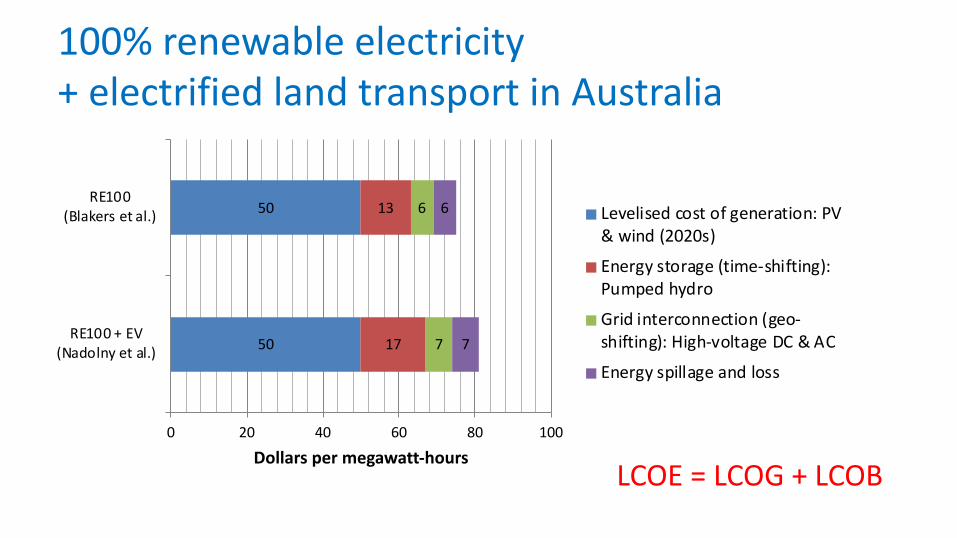
100% renewable electricity
+ electrified land transport in Australia
50
50
17
13
7
6
7
6
0 20 40 60 80 100
RE100 + EV
(Nadolny et al.)
RE100
(Blakers et al.)
Dollars per megawatt-hours
Levelised cost of generation: PV
& wind (2020s)
Energy storage (time-shifting):
Pumped hydro
Grid interconnection (geo-
shifting): High-voltage DC & AC
Energy spillage and loss
LCOE = LCOG + LCOB

Electrification of land transport: • Adds 38% electricity consumption in the National Electricity Market• Adds 44% maximum peak demand
(right axis)
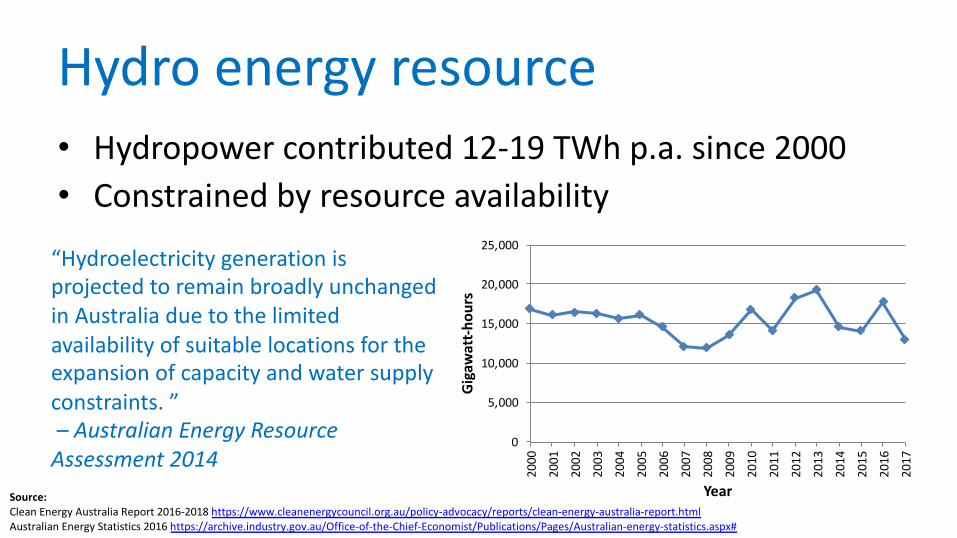
Hydro energy resource• Hydropower contributed 12-19 TWh p.a. since 2000• Constrained by resource availability
“Hydroelectricity generation is projected to remain broadly unchanged in Australia due to the limited availability of suitable locations for the expansion of capacity and water supply constraints. ”– Australian Energy Resource
Assessment 2014 0
5,000
10,000
15,000
20,000
25,000
2000
2001
2002
2003
2004
2005
2006
2007
2008
2009
2010
2011
2012
2013
2014
2015
2016
2017
Gigawatt-h
ours
YearSource:Clean Energy Australia Report 2016-2018 https://www.cleanenergycouncil.org.au/policy-advocacy/reports/clean-energy-australia-report.htmlAustralian Energy Statistics 2016 https://archive.industry.gov.au/Office-of-the-Chief-Economist/Publications/Pages/Australian-energy-statistics.aspx#
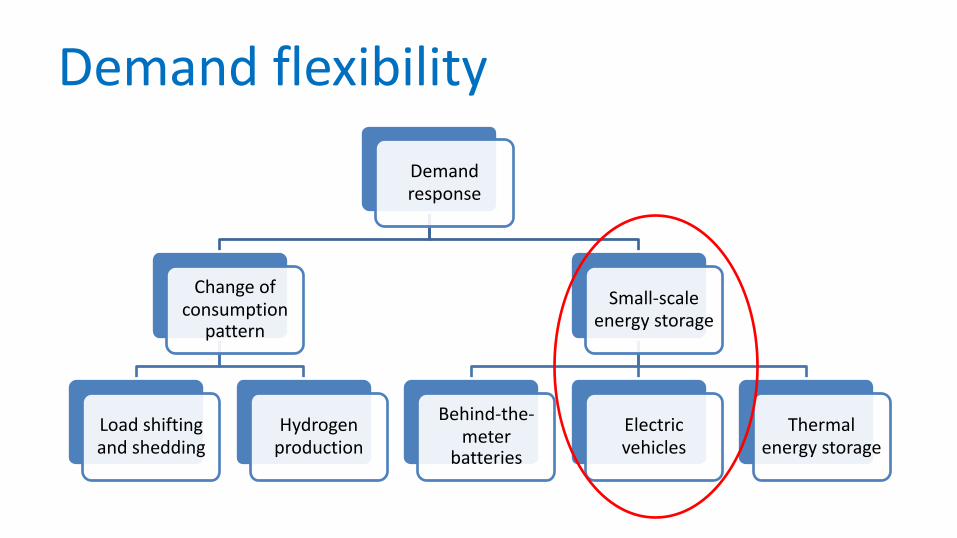
Demand flexibilityDemand response
Change of consumption
pattern
Load shifting and shedding
Hydrogen production
Small-scale energy storage
Behind-the-meter
batteriesElectric vehicles
Thermal energy storage
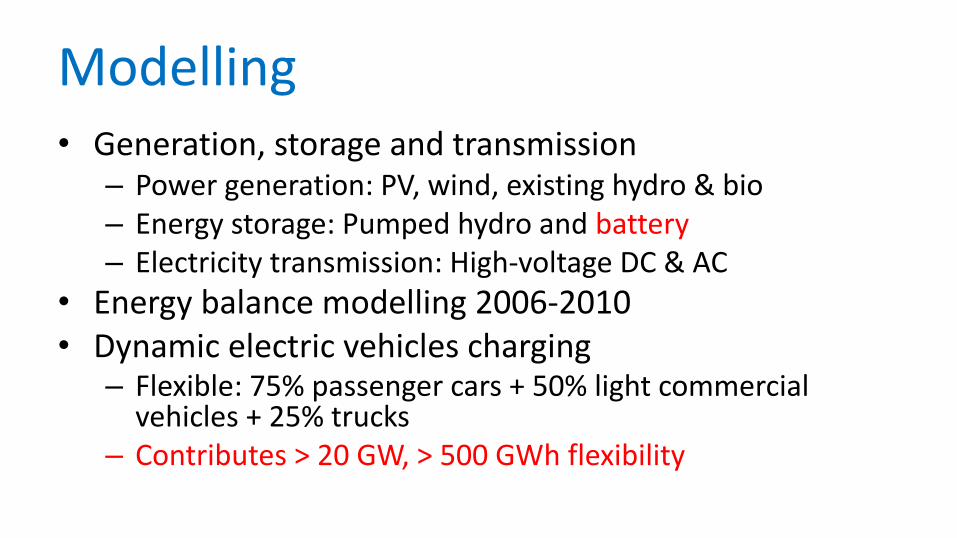
Modelling • Generation, storage and transmission– Power generation: PV, wind, existing hydro & bio– Energy storage: Pumped hydro and battery– Electricity transmission: High-voltage DC & AC
• Energy balance modelling 2006-2010• Dynamic electric vehicles charging
– Flexible: 75% passenger cars + 50% light commercial vehicles + 25% trucks
– Contributes > 20 GW, > 500 GWh flexibility
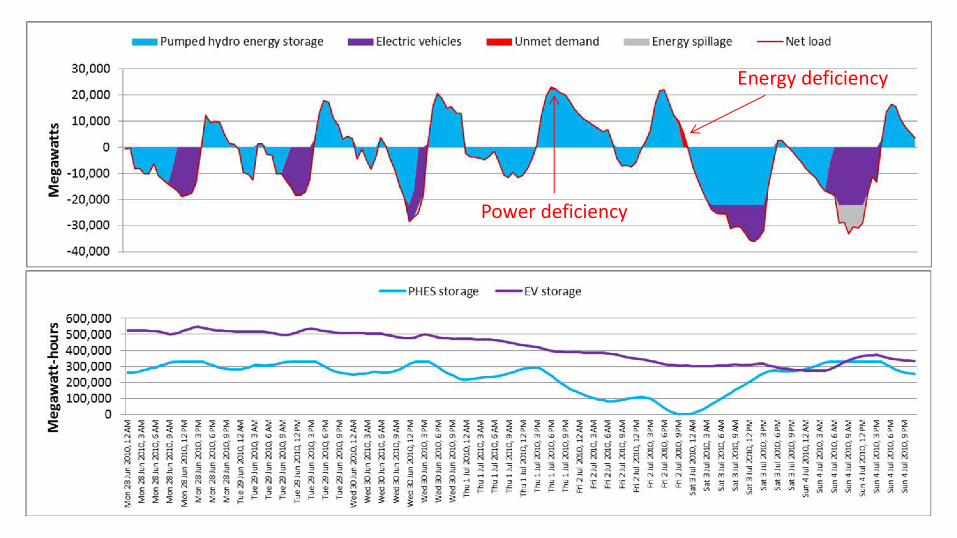
Power deficiency
Energy deficiency
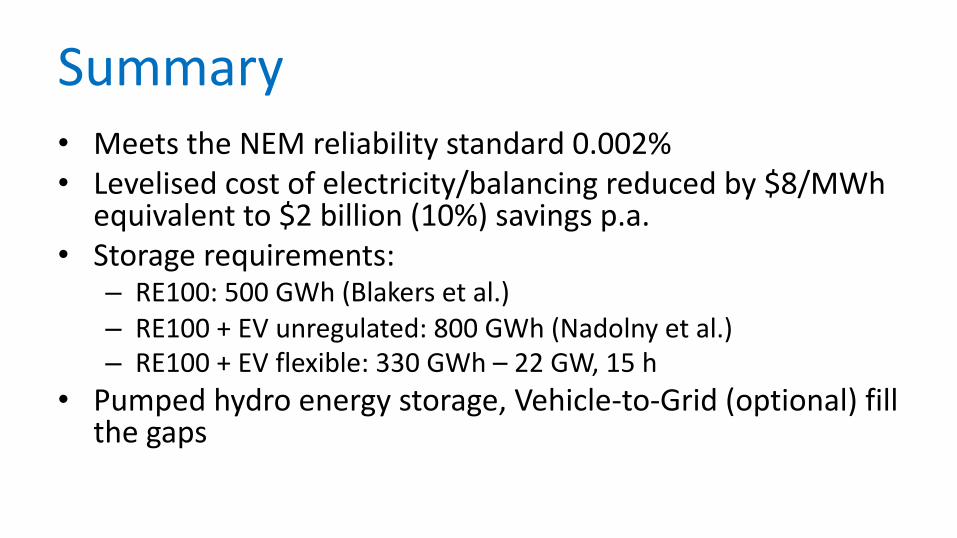
Summary• Meets the NEM reliability standard 0.002%• Levelised cost of electricity/balancing reduced by $8/MWh
equivalent to $2 billion (10%) savings p.a.• Storage requirements:
– RE100: 500 GWh (Blakers et al.)– RE100 + EV unregulated: 800 GWh (Nadolny et al.)– RE100 + EV flexible: 330 GWh – 22 GW, 15 h
• Pumped hydro energy storage, Vehicle-to-Grid (optional) fill the gaps
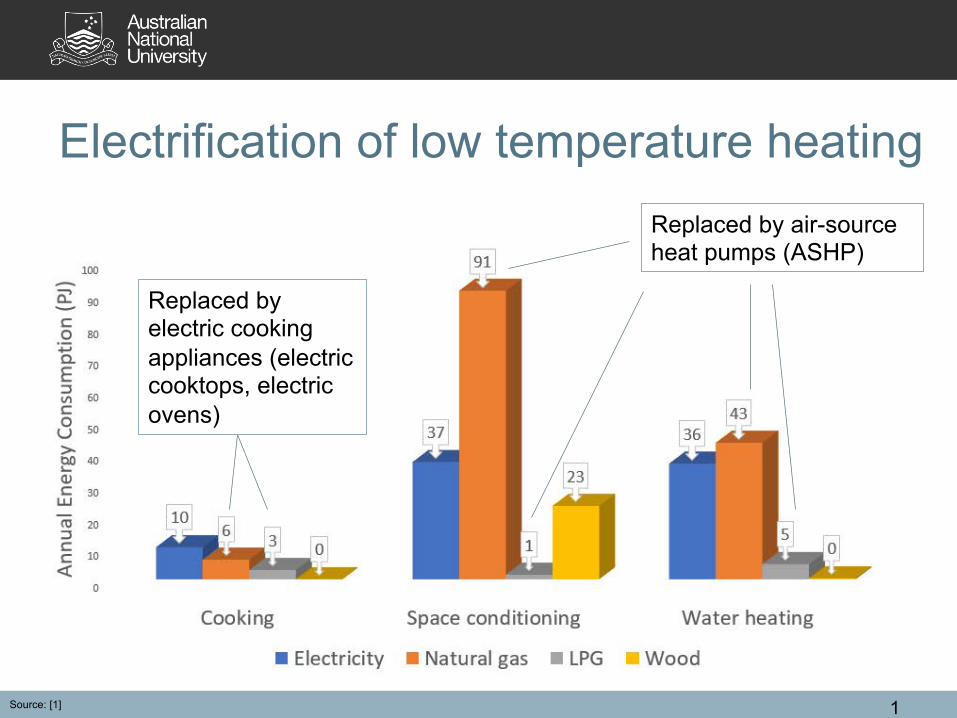
Electrification of low temperature heating
1
Replaced by electric cooking appliances (electric cooktops, electric ovens)
Replaced by air-source heat pumps (ASHP)
Source: [1]
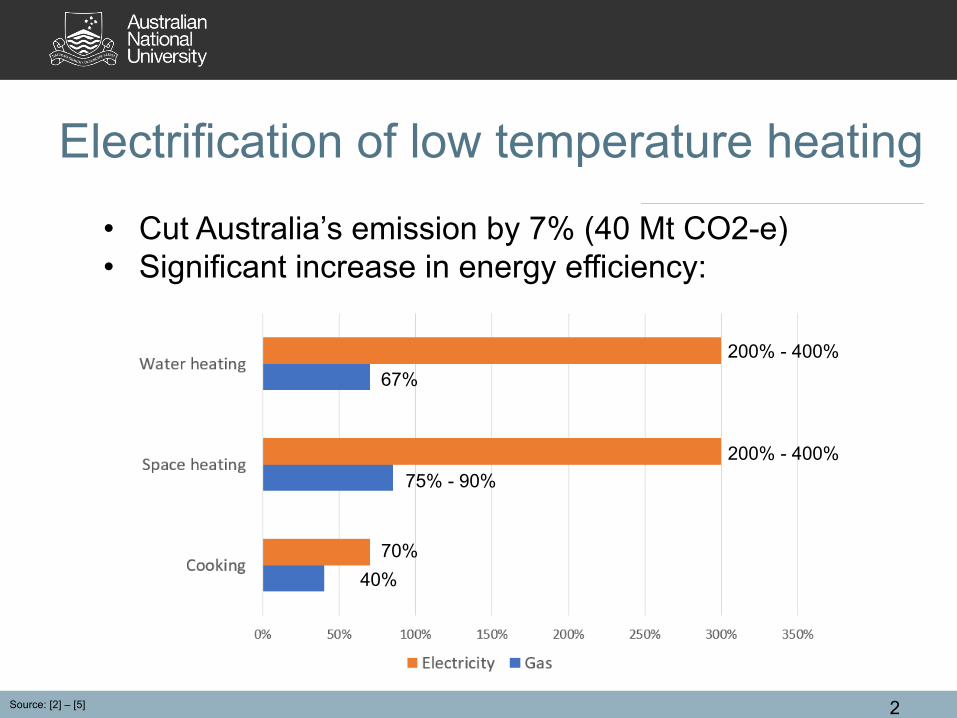
Electrification of low temperature heating
2
Replaced by air-source heat pumps (ASHP)
• Cut Australia’s emission by 7% (40 Mt CO2-e)• Significant increase in energy efficiency:
40%
70%
75% - 90%
200% - 400%
67%
200% - 400%
Source: [2] – [5]
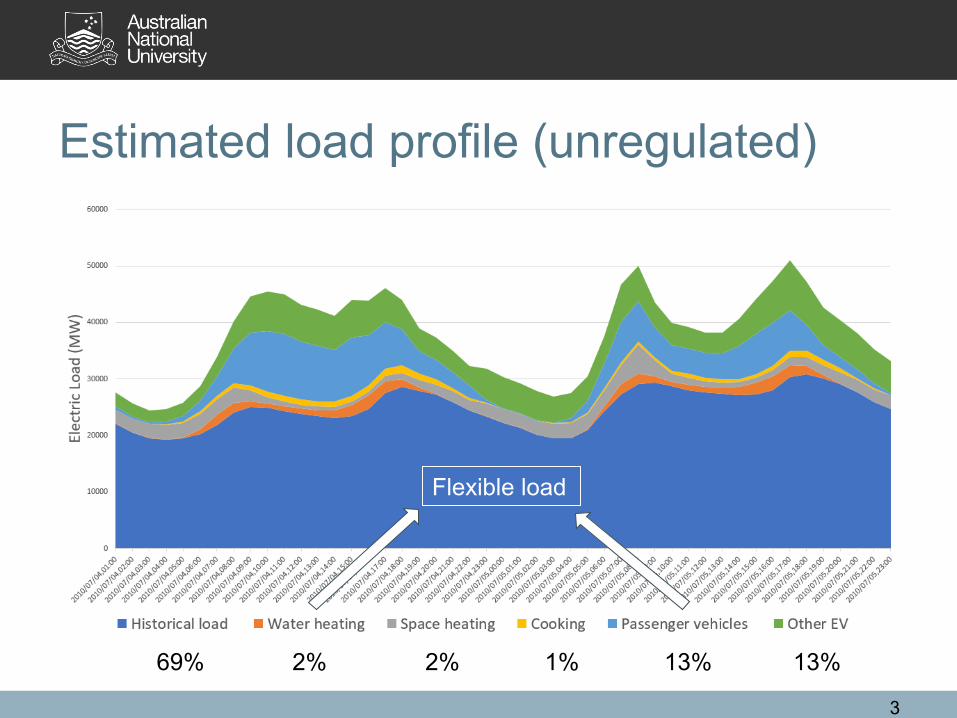
Estimated load profile (unregulated)
3
69% 2% 2% 1% 13% 13%
Flexible load
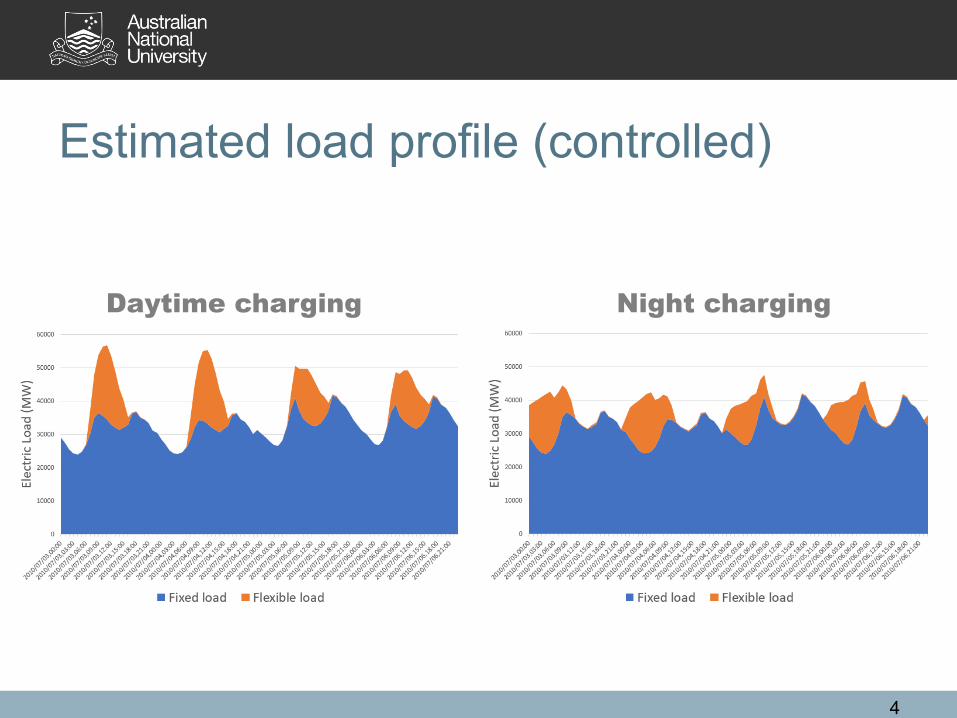
Estimated load profile (controlled)
4
Daytime charging Night charging
References• [1] EnergyConsult, “Residential Energy Baseline Study: Australia,” 2015.• [2] DEPARTMENT OF ENERGY, “Energy Conservation Program: Test Procedures for
Conventional Cooking Products,” 2014.• [3] EnergyConsult, “Product Profile: Gas Space & Decorative (Fuel Effect) Heaters.” 2012.• [4] G. Wilkenfeld, “Regulation Impact Statement : for Decision Specifying the Performance of
Water Heaters for new Class 1 Buildings in the Building Code of Australia Prepared for the Department of the Environment , Water , Heritage and the Arts by George Wilkenfeld and Associates December 2009,” no. December, 2009.
• [5] Commonwealth of Australia, “Australia’s emissions projections 2017,” 2017.
5