Embed Size (px)
Citation preview

August 2012
APT Petroleum Pipelines Pty Limited
ACN 009 737 393
Access Arrangement Information
Effective
1 September 2012– 30 June 2017

APT Petroleum Pipeline Pty Limited Access Arrangement Information
Contents
1 Introduction 1
1.1 Structure of this document 2
2 Information relevant to the earlier access arrangement period 3
2.1 Capital expenditure 3
2.2 Operating expenditure 3
2.3 Pipeline usage 4
3 The Capital Base 6
3.1 Opening Capital Base 6
3.1.1 Opening Capital Base for Access Arrangement Period 6
3.2 Projected Capital Base 6
3.2.1 Forecast conforming capital expenditure for the Access Arrangement Period 7
3.2.2 Forecast depreciation 8
3.2.3 Forecast disposals 10
3.2.4 Forecast redundant assets 10
3.2.5 Projected Capital Base over the Access Arrangement Period 10
4 Forecast network demand and utilisation 12
4.1 Forecast customer numbers and volumes 12
4.2 Forecast network capacity and utilisation 12
4.3 Forecast demand 12
5 Forecast operating expenditure 14
6 Key performance indicators 16

APT Petroleum Pipeline Pty Limited Access Arrangement Information
7 Rate of return 17
8 Taxation 19
9 Historical incentive mechanism 20
10 Approach to tariff setting 21
10.1 Reference Services 21
10.2 Tariff structure 21
10.3 Allocation of revenue to tariffs 21
10.4 Reference Tariffs 22
10.4.1 Reference tariff variation mechanism 22
10.4.2 Annual reference tariff adjustment formula mechanism 22
10.4.3 Cost Pass-through Reference Tariff Adjustment Mechanism 22
11 Incentive mechanism 24
12 Total Revenue 25
APT Petroleum Pipelines Pty Limited Access Arrangement Information
1
1 Introduction
This Access Arrangement Information document has been prepared, in accordance with Rule 43(1) of the National Gas Rules (NGR), to provide Users and Prospective Users with sufficient information to understand the derivation of the Access Arrangement and its compliance with the NGR.
This Access Arrangement Information accompanies the APT Petroleum Pipelines Pty Limited (ACN 009 737 393) (APTPPL) access arrangement for the Roma to Brisbane Pipeline (RBP). The revised Access Arrangement commences on 1 September 2012.
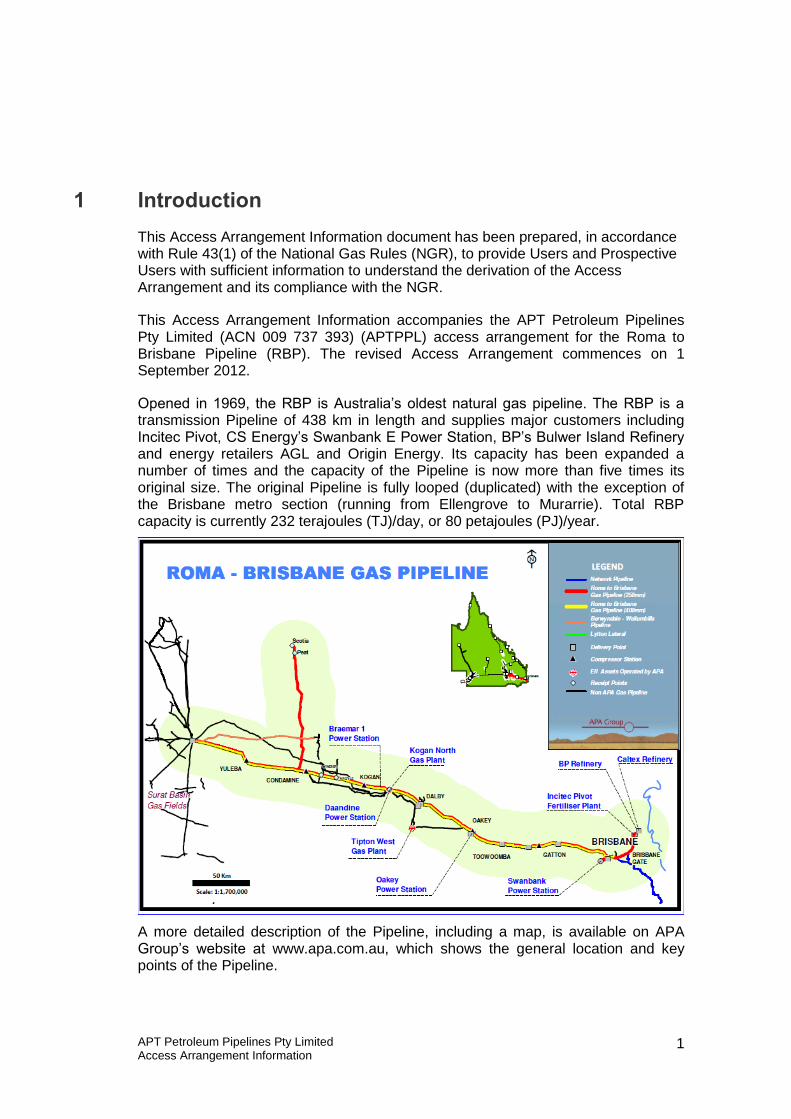
Opened in 1969, the RBP is Australia’s oldest natural gas pipeline. The RBP is a transmission Pipeline of 438 km in length and supplies major customers including Incitec Pivot, CS Energy’s Swanbank E Power Station, BP’s Bulwer Island Refinery and energy retailers AGL and Origin Energy. Its capacity has been expanded a number of times and the capacity of the Pipeline is now more than five times its original size. The original Pipeline is fully looped (duplicated) with the exception of the Brisbane metro section (running from Ellengrove to Murarrie). Total RBP capacity is currently 232 terajoules (TJ)/day, or 80 petajoules (PJ)/year.
A more detailed description of the Pipeline, including a map, is available on APA Group’s website at www.apa.com.au, which shows the general location and key points of the Pipeline.

APT Petroleum Pipelines Pty Limited Access Arrangement Information
2
1.1 Structure of this document
This document follows the structure of Rule 721 setting out the requirements for content of the Access Arrangement Information for a full Access Arrangement proposal.
APTPPL’s Access Arrangement proposal commences at the end of an earlier Access Arrangement Period, and therefore contains information relevant to the earlier Access Arrangement Period (in this case spanning from 12 April 2007 to 31 August 2012) as required under the NGR. This information is included in Part 2 of the Access Arrangement Information. The remaining parts of this Access Arrangement Information are as follows:
Part 3 establishes the capital base for the Access Arrangement Period (in this case spanning 1 September 2012 to 30 June 2017), including forecast capital expenditure for the Access Arrangement Period;
Part 4 discusses forecast utilisation for the Pipeline, including forecast customer numbers, reserved capacity and volumes used to derive tariffs;
Part 5 outlines forecast operating expenditure for the Access Arrangement Period;
Part 6 sets out key performance indicators for the Pipeline;
Part 7 sets out the rate of return used in the Access Arrangement;
Part 8 outlines the approach to taxation and how the tax asset base has been calculated;
Parts 9 and 11 discuss historical and proposed incentive mechanisms;
Part 10 describes the Reference Services, approach to tariff setting and reference tariff variation mechanism; and
Part 12 sets out the total revenue requirement for the Pipeline for each year of the access arrangement.
While the previous Access Arrangement operated from 12 April 2007 to 31 August 2012, and the Access Arrangement commences 1 September 2012, financial information in this document is presented on a fiscal year basis.
1 All references to Rules or a particular Rule in this document refer to the National Gas Rules, or part
thereof, unless an alternative meaning is expressly stated.

APT Petroleum Pipelines Pty Limited Access Arrangement Information
3
2 Information relevant to the earlier access arrangement period
2.1 Capital expenditure
Capital expenditure by asset class over the earlier Access Arrangement Period2 is set out in Table 2.1 below. These costs are based on actual costs for financial years 2006/07 to 2010/11, and forecast costs for financial year 2011/12.
Table 2.1 – Capital expenditure by asset class over the earlier access arrangement period
($m nominal) 2006/07 2007/08 2008/09 2009/10 2010/11 2011/12F Total
Stay in Business
2.5 27.4 2.7 4.1 2.3 3.4 42.4
Actual - Growth 0.1 0.0 0.0 0.0 9.5 51.9 61.5
Total Capex 2.6 27.4 2.7 4.1 11.8 55.3 103.9
2.2 Operating expenditure
Operating expenditure by category over the earlier Access Arrangement Period3 is set out in Table 2.2 below. These costs are based on actual costs for financial years 2006/07 to 2010/11, and forecast costs for financial year 2011/12.
2 As required by Rule 72(1)(a)(i)
3 As required by Rule 72(1)(a)(ii)

APT Petroleum Pipelines Pty Limited Access Arrangement Information
4
Table 2.2 – Operating expenditure by category over the earlier Access Arrangement Period
($’000 nominal) 2006/074 2007/08 2008/09 2009/10 2010/11 2011/125
Wages & Salaries - 2,316 4,201 4,323 5,234 5,473
APT Other Corporate Costs
2,093 2,117 2,306 3,016 3,393 3,603
Operations and Maintenance, Insurance, License Fees and Security
7,601 3,320 2,393 2,317 5,5756 2,789
Total 9,694 7,752 8,900 9,657 14,202 11,865
2.3 Pipeline usage
Pipeline minimum, maximum and average demand figures over the earlier Access Arrangement Period7 are set out in Table 2.3 below. These figures are based on actual demand for financial years 2006/07 to 2010/11, and forecast demand for financial year 2011/12.
Table 2.3 – Minimum, maximum and average demand over the earlier Access Arrangement Period
TJ/day 2006/07 2007/08 2008/09 2009/10 2010/11 2011/12F
Minimum 98.2 102.1 109.2 92.8 110.7 107.3
Average 168.9 167.7 174.0 169.0 167.0 167.8
Maximum 216.5 203.4 207.6 209.3 207.7 199.1
4 APT Petroleum Pipelines Pty Ltd Regulatory Accounting Statements
5 Forecast
6 This increase is caused primarily by the damage to the RBP caused by the 2011 Queensland floods.
See below for adjustment to base year costs.
7 As required by Rule 72(1)(a)(iii)(A)

APT Petroleum Pipelines Pty Limited Access Arrangement Information
5
Pipeline customer numbers in total and by tariff class over the earlier Access Arrangement Period8 are set out in Table 2.4 below. These figures are based on actual customer numbers for financial years 2006/07 to 2010/11, and forecast customer numbers for financial year 2011/12.
Table 2.4 – Customer numbers
2006/07 2007/08 2008/09 2009/10 2010/11 2011/12F
Total users 8 9 11 11 11 11
8 As required by Rule 72(1)(a)(iii)(B)

APT Petroleum Pipelines Pty Limited Access Arrangement Information
6
3 The Capital Base
3.1 Opening Capital Base
3.1.1 Opening Capital Base for Access Arrangement Period
The Opening Capital Base for the Access Arrangement Period9 is shown in Table 3.1 below.
Table 3.1 – Opening Capital Base for the Access Arrangement Period
$m nominal 2006/07 2007/08 2008/09 2009/10 2010/11 2011/12
Opening Capital Base
296.4 300.2 335.2 339.5 346.5 362.7
Plus capex 2.7 28.7 2.8 4.3 12.4 57.2
Plus speculative capex
0.0 0.0 0.0 0.0 0.0 0.0
Plus reused redundant assets
0.0 0.0 0.0 0.0 0.0 0.0
Less depreciation (6.0) (6.5) (6.8) (7.1) (7.7) (8.0)
Plus indexation 7.2 12.7 8.3 9.8 11.5 5.7
Less redundant assets 0.0 0.0 0.0 0.0 0.0 0.0
Less disposals 0.0 0.0 0.0 0.0 0.0 0.0
Closing Capital Base
300.2 335.2 339.5 346.5 362.7 417.6
3.2 Projected Capital Base
The projected Capital Base for the Access Arrangement Period is made up of the following components:
Opening Capital Base; plus
9 As required by Rule 72(1)(b)

APT Petroleum Pipelines Pty Limited Access Arrangement Information
7
Forecast conforming capital expenditure; less
Forecast depreciation; less
Forecast disposals.
These components are described in the following sections, and the projected Capital Base is provided in section 3.2.5 below.
3.2.1 Forecast conforming capital expenditure for the Access Arrangement Period
Forecast conforming capital expenditure by asset class over the Access Arrangement Period10 is set out in Table 3.2 below.
Table 3.2 – Forecast capital expenditure by asset class over the Access Arrangement Period
($m) 2011/12 2012/13 2013/14 2014/15 2015/16 2016/17 Total
SIB Capex 3.99 4.46 3.33 3.54 2.98 18.31
Pipelines 0 0 0 0 0 0
Compressors 0 0 0 0 0 0
APTPPL’s capital expenditure forecast is derived based on purpose in categories as follows:
Stay in Business capital expenditure – routine capital activities targeted at maintaining the Pipeline in good working order in the long term;
Growth related capital expenditure – expenditure required to maintain capacity to meet current customer demand and to provide additional capacity to meet future customer demand.
Non-system capital expenditure is related to IT systems and software, motor vehicles, and plant and equipment which are not part of the Pipeline, but which are otherwise required to deliver Pipeline Services.
Forecast conforming capital expenditure by category over the Access Arrangement Period in shown in Table 3.3 below.
10 As required by Rule 72(1)(c)(i)

APT Petroleum Pipelines Pty Limited Access Arrangement Information
8
Table 3.3 – Forecast conforming capital expenditure by category over the Access Arrangement Period
($m) 2011/12 2012/13 2013/14 2014/15 2015/16 2016/17 Total
Expansion 0 0 0 0 0 0
Replacement 0 0 0 0 0 0
Stay In Business 3.99 4.46 3.33 3.54 2.98 18.31
System Total 3.99 4.46 3.33 3.54 2.98 18.31
Non System 0 0 0 0 0 0
Total 3.99 4.46 3.33 3.54 2.98 18.31
3.2.2 Forecast depreciation
Forecast depreciation by asset class over the Access Arrangement Period11 is shown in Table 3.4 below.
Table 3.4 – Forecast depreciation over the Access Arrangement Period
$m 2011/12 2012/13 2013/14 2014/15 2015/16 2016/17 Total
Depreciation 15.4 16.7 18.1 18.0 17.3 85.5
Indexation 10.7 10.6 10.6 10.5 10.4 52.8
11 As required by Rule 72(1)(c)(ii)

APT Petroleum Pipelines Pty Limited Access Arrangement Information
9
Table 3.5 sets out APTPPL’s asset economic lives.
Table 3.5 – Asset economic lives (years)
Asset Class Standard life Remaining life Tax Statutory Life
Remaining tax life
Original Pipeline 60.00 17.00 20.00 n/a
Looping 1 80.00 56.00 20.00 n/a
Looping 2 80.00 58.00 20.00 n/a
Looping 3 80.00 66.00 20.00 6.00
Looping 4 80.00 69.00 20.00 9.00
Looping 5 80.00 71.00 20.00 11.01
Looping 6 80.00 71.00 20.00 11.14
Lateral 80.00 69.00 20.00 9.09
Dalby Compressor 35.00 5.00 20.00 9.50
Kogan Compressor 35.00 5.00 20.00 5.08
Oakey Compressor 35.00 6.00 20.00 6.13
Condamine Compressor 35.00 7.00 20.00 5.06
Yuleba Compressor 35.00 9.00 20.00 5.96
Gatton Compressor 35.00 10.00 20.00 3.73
Easements n/a n/a n/a n/a
Communications 15.00 4.00 20.00 n/a
Other 5.00 n/a 20.00 6.83
Capitalised AA costs 5.00 4.92 5.00 4.93
Pipelines / Laterals 80.00 78.12 20.00 18.31
Group IT 5.00 4.19 5.00 4.20
SIB Capex 5.00 3.47 5.00 3.52
PMA 12.00 8.00 5.00 1.00
Regulator and meter stations 40.00 35.69 20.00 15.74
Lytton lateral 80.00 79.00 20.00 19.00
RBP Expansion - Stage 8 46.00 46.00 20.00 20.00
APTPPL has applied a straight-line methodology in determining future depreciation.

APT Petroleum Pipelines Pty Limited Access Arrangement Information
10
3.2.3 Forecast disposals
Forecast disposals for the Access Arrangement Period are set out in Table 3.6 below.
Table 3.6 – Forecast disposals over the Access Arrangement Period
$m 2011/12 2012/13 2013/14 2014/15 2015/16 2016/17 Total
Disposals 0 0 0 0 0 0
3.2.4 Forecast redundant assets
The forecast of assets that will be made redundant in the Access Arrangement Period in set out in Table 3.7 below.
Table 3.7 – Forecast redundant assets over the Access Arrangement Period
$m 2011/12 2012/13 2013/14 2014/15 2015/16 2016/17 Total
Redundant Assets 0 0 0 0 0 0
3.2.5 Projected Capital Base over the Access Arrangement Period
The projected Capital Base for the Access Arrangement Period12 is shown in Table 3.8 below.
12 As required by Rule 72(1)(c)

APT Petroleum Pipelines Pty Limited Access Arrangement Information
11
Table 3.8 – Projected Capital Base for the Access Arrangement Period
$m nominal 2012/13 2013/14 2014/15 2015/16 2016/17
Opening Capital Base 417.6 417.1 415.9 412.1 408.6
Plus capex 4.2 4.8 3.7 4.0 3.5
Plus speculative capex 0.0 0.0 0.0 0.0 0.0
Plus reused redundant assets 0.0 0.0 0.0 0.0 0.0
Less depreciation (15.4) (16.7) (18.1) (18.0) (17.3)
Plus indexation 10.7 10.6 10.6 10.5 10.4
Less redundant assets 0.0 0.0 0.0 0.0 0.0
Less disposals 0.0 0.0 0.0 0.0 0.0
Closing Capital Base 417.1 415.9 412.1 408.6 405.1
APT Petroleum Pipelines Pty Limited Access Arrangement Information
12
4 Forecast network demand and utilisation
4.1 Forecast customer numbers and volumes
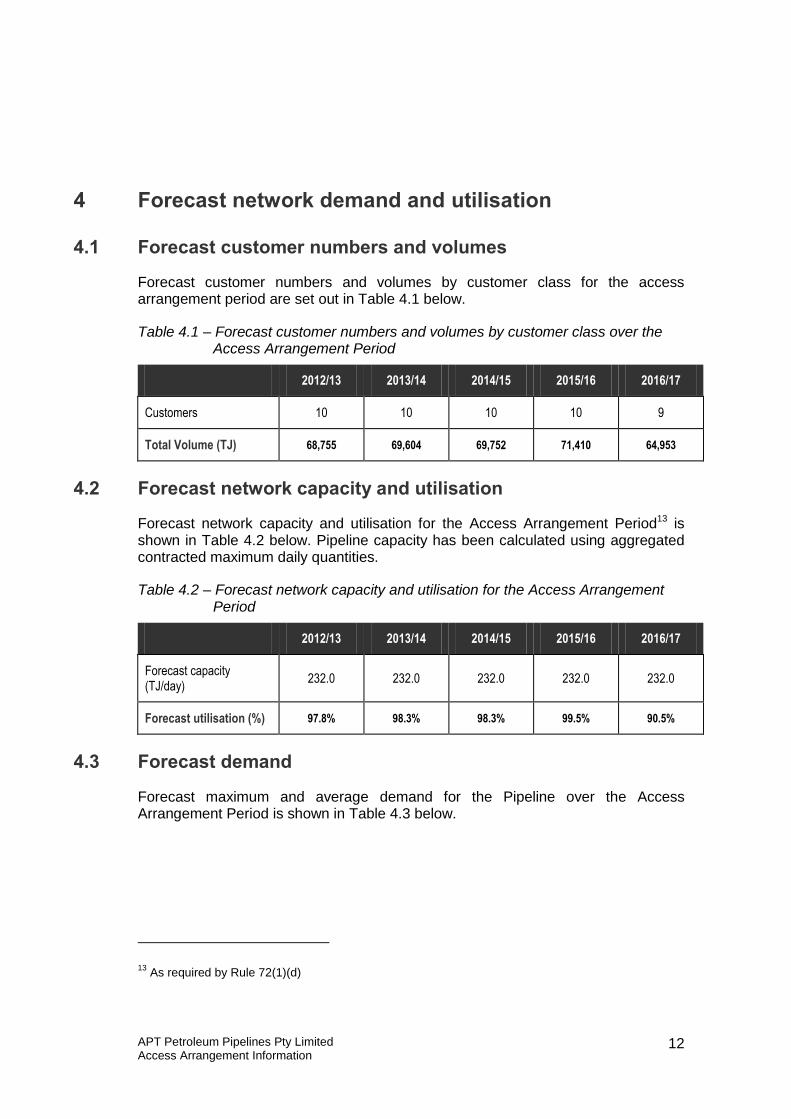
Forecast customer numbers and volumes by customer class for the access arrangement period are set out in Table 4.1 below.
Table 4.1 – Forecast customer numbers and volumes by customer class over the Access Arrangement Period
2012/13 2013/14 2014/15 2015/16 2016/17
Customers 10 10 10 10 9
Total Volume (TJ) 68,755 69,604 69,752 71,410 64,953
4.2 Forecast network capacity and utilisation
Forecast network capacity and utilisation for the Access Arrangement Period13 is shown in Table 4.2 below. Pipeline capacity has been calculated using aggregated contracted maximum daily quantities.
Table 4.2 – Forecast network capacity and utilisation for the Access Arrangement Period
2012/13 2013/14 2014/15 2015/16 2016/17
Forecast capacity (TJ/day)
232.0 232.0 232.0 232.0 232.0
Forecast utilisation (%) 97.8% 98.3% 98.3% 99.5% 90.5%
4.3 Forecast demand
Forecast maximum and average demand for the Pipeline over the Access Arrangement Period is shown in Table 4.3 below.
13 As required by Rule 72(1)(d)

APT Petroleum Pipelines Pty Limited Access Arrangement Information
13
Table 4.3 – Forecast maximum and average demand for the Pipeline over the Access Arrangement Period (TJ/d)
2012/13 2013/14 2014/15 2015/16 2016/17
Maximum demand (TJ/day)
227.0 228.0 228.0 230.9 209.9
Average demand (TJ/day)
188.4 190.7 191.1 195.6 178.0

APT Petroleum Pipelines Pty Limited Access Arrangement Information
14
5 Forecast operating expenditure
Forecast operating expenditure by category over the Access Arrangement Period is set out in Table 5.1 below.
Table 5.1 – Forecast operating expenditure by category over the Access Arrangement Period
$m(June-2012) 2012/13 2013/14 2014/15 2015/16 2016/17 Total
Labour 5.3 5.3 5.4 5.4 5.4 26.8
Contractors O&M 0.9 0.9 0.9 0.9 0.9 4.6
Other operating costs 1.1 1.1 1.1 1.2 1.1 5.5
Total controllable opex 7.3 7.3 7.4 7.5 7.5 36.9
Asset licences & insurance
0.6 0.6 0.6 0.6 0.6 3.2
Regulatory costs 0.0 0.0 0.0 0.0 0.6 0.6
Debt raising costs 0.3 0.3 0.3 0.2 0.2 1.3
Corporate costs 3.6 3.7 3.7 3.7 3.8 18.5
Carbon costs 0.7 0.7 0.7 0.8 0.7 3.7
Total Operating Expenditure
12.5 12.6 12.7 12.9 13.5 64.1
APTPPL’s forecast of operating expenditure for the Access Arrangement Period has been prepared using the base year methodology. This methodology involves the following steps:
Selection of an appropriate base year in which to measure costs;
Modification of the base year costs to ensure that all costs required for future operation of the Pipeline are added to the base year costs, and all costs in the base year costs which are not relevant to future operation of the Pipeline are subtracted from the base year costs;
Modification of base year costs as required to reflect changed consumer numbers, additional Pipeline facilities required to supply gas to these additional consumers, and increased loads from existing consumers;

APT Petroleum Pipelines Pty Limited Access Arrangement Information
15
Modification of the base year costs to reflect changes in input costs anticipated over the Access Arrangement Period; and
Modification of the base year costs to reflect appropriate productivity improvements.

APT Petroleum Pipelines Pty Limited Access Arrangement Information
16
6 Key performance indicators
Key performance indicators for the Access Arrangement Period14 are shown in Table 6.1 below.
Table 6.1 – Key performance indicators ($2011–12)
Indicator Unit 2012/13 2013/14 2014/15 2015/16 2016/17
Total Operating Costs per km
$/km 12,343 12, 411 12, 505 12, 700 13, 272
Total Operating Costs per mmkm
$/mmkm 38.97 39.19 39.48 40.10 41.90
14 As required by Rule 72(1)(f)

APT Petroleum Pipelines Pty Limited Access Arrangement Information
17
7 Rate of return
The AER has calculated a nominal vanilla weighted average cost of capital (WACC). The formula in is used to derive the nominal vanilla WACC is set out below.
WACC = Ke V
E+ Kd
V
D
where:
Ke = the expected rate of return on equity or cost of equity
Kd = the expected rate of return on debt or cost of debt
V
E=
the market value of equity as a proportion of the market value of
equity and debt, which is 1 – V
D
V
D=
the market value of debt as a proportion of the market value of equity and debt
The cost of equity, Ke, is calculated with the following formula:
Ke =Rf + βe x MRP
where:
Rf = the nominal risk free rate of return
βe = the equity beta
MRP = the expected market risk premium
The cost of debt, Kd, is calculated with the following formula:
Kd = Rf + DRP
where:
Rf = the nominal risk-free rate of return
DRP = the debt risk premium.

APT Petroleum Pipelines Pty Limited Access Arrangement Information
18
Table 7.1 below sets out input parameters and the calculated rate of return used to derive APTPPL’s revenue requirement for the Access Arrangement Period15.
Table 7.1 –Weighted average cost of capital for the Access Arrangement Period
Parameter Estimate
Risk free rate 2.95%
Forecast inflation 2.55%
Real risk free rate 0.39%
Gearing (debt to value) 60%
Debt risk margin 4.06%
Nominal pre-tax cost of debt 7.01%
Market risk premium 6.0%
Equity beta 0.8
Nominal post-tax cost of equity 7.75%
Gamma 0.25
Nominal vanilla WACC 7.31%
15 As required by Rule 72(1)(g)

APT Petroleum Pipelines Pty Limited Access Arrangement Information
19
8 Taxation
APTPPL is using a post tax framework to derive its revenue requirement for the access arrangement period.16 This has been calculated based on the Tax Asset Base (TAB) established by the ACCC in the 2006–11 Access Arrangement review.
The estimated cost of corporate income tax for each year of the Access Arrangement Period (ETCt) is calculated in accordance with the following formula:
ETCt = (ETIt × rt) (1 – γ)
Where:
ETIt is an estimate of the taxable income for Regulatory Year t that would be earned by a benchmark efficient entity as a result of the provision of regulated services if such an entity, rather than the Service Provider, operated the business of the Service Provider, such estimate being determined in accordance with the AER’s post-tax revenue model
rt is the expected statutory income tax rate for that Regulatory Year assumed to be 30 per cent
γ (gamma, the assumed utilisation of imputation credits) is deemed to be 0.25
Asset class standard lives (in years) or the Australian Tax Office statutory cap used to prepare the APTPPL TAB are set out in Table 3.5 above.
APTPPL’s tax asset base roll forward for the Access Arrangement Period is shown in Table 8.1 below.
Table 8.1 – Tax asset base roll forward for the Access Arrangement Period
$m (nominal) 2012/13 2013/14 2014/15 2015/16 2016/17
Opening TAB 133.3 120.9 113.3 103.7 94.6
Capital expenditure 4.1 4.7 3.6 3.9 3.4
Tax depreciation 16.4 12.3 13.2 13.0 12.4
Total 120.9 113.3 103.7 94.6 85.6
16 As required by Rule 72(1)(h)

APT Petroleum Pipelines Pty Limited Access Arrangement Information
20
9 Historical incentive mechanism
There was no incentive mechanism operative in the earlier Access Arrangement Period giving rise to increments or decrements that need to be included in the revenue requirement for the Access Arrangement Period.17
17 As required by Rule 72(1)(i)

APT Petroleum Pipelines Pty Limited Access Arrangement Information
21
10 Approach to tariff setting
10.1 Reference Services
There is one Reference Service offered on the RBP - a firm, forward haul service for receipt, transport and delivery of Gas in the direction from Wallumbilla or Peat to Brisbane.
Consistent with existing contracts and customer enquiries, APTPPL considers this to be the Service likely to be sought by a significant portion of the market.
APTPPL also provides Negotiated Services.
10.2 Tariff structure
The Reference Service has a two-part tariff, being
a Capacity Charge (expressed as dollars per GJ of MDQ per Day); and
a Throughput Charge (expressed as dollars per GJ).
The allocation of revenue between Capacity Charge and Throughput Charge is 95% to Capacity Charge and 5% to Throughput Charge.
10.3 Allocation of revenue to tariffs
Reference Tariffs are designed to recover the Total Revenue allocated to the Reference Service based on costs allocated to the Reference Service. This approach equalises revenue derived from the application of Reference Tariffs with the total Reference Service revenue requirement, assuming that assumptions regarding costs and demand hold.
The forecast revenue requirement for the Access Arrangement Period is shown in Table 10.1 below.
Table 10.1 – Forecast revenue requirement for the Access Arrangement Period
$m (nominal) 2012/13 2013/14 2014/15 2015/16 2016/17
Reference Service revenue requirement
48.5 51.7 53.6 54.0 54.1
The net present value of the Reference Tariff revenue stream when discounted at the nominal vanilla WACC of 7.31% is $212.19 million.

APT Petroleum Pipelines Pty Limited Access Arrangement Information
22
Table 10.2 –Reference Tariff revenue stream
$m (nominal) 2012/13 2013/14 2014/15 2015/16 2016/17
Forecast Reference Service revenue
46.2 50.0 53.4 57.7 55.4
The net present value of the Reference Tariff revenue stream when discounted at the nominal vanilla WACC of 7.31% is $212.19 million which is equal to the present value of the revenue requirement.
10.4 Reference Tariffs
Tariffs for Reference Services are set out in the Access Arrangement. Tariffs are published for 2012/13 ($2012/13) and are exclusive of Goods and Services Tax (GST).
10.4.1 Reference tariff variation mechanism
Reference Tariffs are varied in later years of the Access Arrangement Period through the operation of the Reference Tariff variation mechanism, made up of:
an Annual Scheduled Reference Tariff Adjustment Formula Mechanism - which applies in respect of each year during the Access Arrangement Period; and
Cost Pass-through Reference Tariff Adjustment Mechanism - under which APTPPL may seek to vary one or more of the Reference Tariffs as a result of a Cost Pass-through Event/s.
10.4.2 Annual reference tariff adjustment formula mechanism
The annual tariff variation adjustment formula adjusts tariffs on each 1 July of the Access Arrangement Period as follows:
The Capacity Tariff and Throughput Tariff for the Firm Service will be varied by consumer price index (CPI) and an X factor.
These adjustments are intended to ensure efficient tariffs over the Access Arrangement Period. Relevant values and formulae for the above parameters are set out in section 4.5 of the Access Arrangement.
10.4.3 Cost Pass-through Reference Tariff Adjustment Mechanism
A Cost Pass–through Reference Tariff Adjustment Mechanism is included in the Access Arrangement to allow tariffs to be adjusted to recover incremental costs resulting from material unforeseen or uncontrollable events.

APT Petroleum Pipelines Pty Limited Access Arrangement Information
23
Relevant Cost Pass-through Event/s are defined as events that are uncontrollable, and that are unforeseen or not able to be accurately forecast at the time the Access Arrangement is approved, that lead to or are expected to lead to, material changes in costs that are not already included in Reference Tariffs.
Part 4.5 of the Access Arrangement sets out the tariff variation process, including requirements for tariff variation notifications and relevant materiality thresholds for Cost Pass-through Event/s.

APT Petroleum Pipelines Pty Limited Access Arrangement Information
24
11 Incentive mechanism
The Access Arrangement does not include an incentive mechanism of the type described under the Rules18, however APTPPL faces incentives to reduce costs and increase demand over the Access Arrangement Period compared with the forecast on which the Access Arrangement is based, as total revenue will not be adjusted to reflect differences between forecast and actual Gas deliveries and/or business costs.
No allowance has been made for revenue that may accrue from the sale of negotiated services that may be entered into following any capacity expansion of the RBP, as no capital in respect of such expansion has been included in the calculation of the Total Revenue.
The prospect of retaining improved returns for the Access Arrangement Period provides an incentive for APTPPL to seek to sell additional services and to minimise the cost of providing services consistent with the gas access regime. This includes noncapital costs and stay in business capital.
18 See Rule 98

APT Petroleum Pipelines Pty Limited Access Arrangement Information
25
12 Total Revenue
The total revenue requirement to be derived from Pipeline Services over the Access Arrangement Period is shown in Table 12.1 below.
Table 12.1 – Total Revenue to be derived from Pipeline Services over the Access Arrangement Period
$m (nominal) 2012/13 2013/14 2014/15 2015/16 2016/17
Return on capital 30.5 30.5 30.4 30.1 29.9
Regulatory depreciation 4.8 6.0 7.5 7.5 6.9
Tax allowance 0.4 1.9 2.1 2.1 2.1
Incentive mechanisms - - - - -
Operating expenditure 12.8 13.2 13.7 14.2 15.3
Total Revenue requirement (unsmoothed)
48.5 51.7 53.6 54.0 54.1
X-factors -8.75% -5.00% -4.00% -4.00% -3.00%
Smoothed revenue requirement
46.2 50.0 53.4 57.7 55.4